Knowledge needs in sea ice forecasting for navigation in Svalbard and the High Arctic
←
→
Page content transcription
If your browser does not render page correctly, please read the page content below
1

Knowledge needs in sea ice
forecasting for navigation in
Svalbard and the High Arctic
Veland, S., P. Wagner, D. Bailey, A. Everett, M. Goldstein,
R. Hermann, T. Hjort-Larsen, G. Hovelsrud, N. Hughes, A. Kjøl,
X. Li, A. Lynch, M. Müller, J. Olsen, C. Palerme, J.L. Pedersen,
Ø. Rinaldo, S. Stephenson, T. Storelvmo
Knowledge needs in sea ice forecasting
for navigation in Svalbard and the High Arctic
Veland, S.,¹,² P. Wagner, ⁴ D. Bailey, ⁵ A. Everett, ³ M. Goldstein, ⁶ R. Hermann, ⁷ T. Hjort-Larsen, ⁸
G. Hovelsrud, ¹,² N. Hughes, ⁴ A. Kjøl, ⁸ X. Li, ⁹ A. Lynch, ⁹ M. Müller, ³ J. Olsen, ¹,² C. Palerme, ³ J.L. Pedersen, ⁸
Ø. Rinaldo, ⁸ S. Stephenson, ¹⁰ T. Storelvmo, ¹¹
1
NORCE Norwegian Research Center, Bergen, Norway
2
Nordland Research Institute, Bodø, Norway
3
MET Norwegian Meteorological Institute - Tromsø, Norway
4
Norwegian Ice Service, Tromsø, Norway
5
National Center for Atmospheric Research – NCAR, Boulder, CO, USA
6
Babson College, Wellesley, MA, USA
7
Center for High North Logistics (CHNL), Nord University, Bodø, Norway
8
Norwegian Coastal Administration, Tromsø, Norway
9
Brown University, Providence, RI, USA
10
RAND Corporation, Santa Monica, CA, USA
11
Institute for Geosciences, University of Oslo, Norway
Please cite as: Veland, S., Wagner, P., Bailey, D., Everett, A., Goldstein, M., Hermann, R., Hjort-Larsen, T., Hovelsrud,
G., Hughes, N., Kjøl, A., Li, X., Lynch, A., Müller, M., Olsen, J., C. Palerme, Pedersen, J.L., Rinaldo, Ø., Stephenson, S.,
Storelvmo, T. (2021). Knowledge needs in sea ice forecasting for navigation in Svalbard and the High Arctic.
Svalbard Strategic Grant, Svalbard Science Forum. NF-rapport 4/2021
Printing: Center for Graphic Services, Nord University
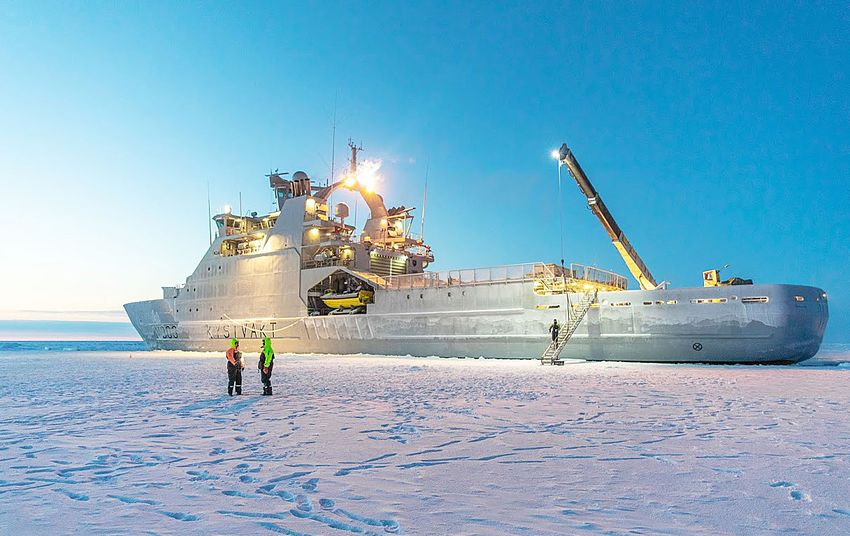
Cover photo: KV Svalbard/Sjøforsvaret ved Daniel Fatnes.
Other photographic material reproduced in this volume are also copyrighted to Daniel Fatnes.
NF-rapport 4/2021
ISBN nummer:
978-82-7321-818-6 (trykt)
978-82-7321-819-3 (digital)
Table of contents
Glossary ............................................................................................................................................. 4

Summary ........................................................................................................................................... 5

Introduction ....................................................................................................................................... 6

Meeting Svalbard Stategic Grant’s Strategic Objectives .................................................................... 7

State of the art and knowledge needs .............................................................................................. 8
                                                                                                                                                           3
Workshop findings: Future of the Arctic from a user perspective: .................................................. 16

     Expectation for significant increases in Arctic activity ............................................................... 16

     Recent observed changes in ice regimes ................................................................................... 16

     Maritime Industry user needs in the Polar Regions .................................................................. 17

     How users apply experience-based knowledge ........................................................................ 18

     The role of experience and Intuition in Sea Ice Navigation ....................................................... 18

     Information needs and requirments ......................................................................................... 19

     Limitations with communications and data size requirements ................................................. 20

Future of the Arctic from a user perspective: .................................................................................. 21

Future work ..................................................................................................................................... 24

References ....................................................................................................................................... 25

Copies of submitted papers ............................................................................................................. 27

Copy of application for funding from the SSG ................................................................................. 56
Glossary
    This report uses terminology used within the sea ice forecasting community, which may differ from
    other uses.

    Automated products - The process of generating             based on physical parameters of sea ice (rheology,
    products automatically typically using little to no        albedo, thickness, etc)
    manual input or quality control.
                                                               MIZ – marginal ice zone. “The region of an ice cover
    End-users – A person or group that uses a product          which is affected by waves and swell penetrating into
4
    or service for decision making or research, and may        the ice from the open ocean” (WMO No. 259).
    use these to generate a product or service for a next
    end-user (KEPLER, 2019, 2020)                              Operational - The term ‘operational’ under the man-
                                                               date of the IMO and WMO sets standards for sea
    Forecast – short-term (up to two week) projections         ice products for dissemination to end-users. To be
    of sea ice conditions                                      operational, a product needs to be: Relevant (user
                                                               AOI, needed suite of parameters, WMO standards);
    High resolution - Sub-kilometer (meter scale) for          Accurate (resolution, parameters mapped properly);
    spatial resolution                                         Reliable (agreed provisions received, strengths/lim-
                                                               itations known, continuity); Actual (near real time
    Ice edge – The boundary that separates the edge of         or on a routine basis); and Accessible (band width,
    the sea ice and open water in the sea, rivers or lakes.    format, availability, production scheme).
    The region over which sea ice concentration is at least
    15 percent per pixel (25km), based on the Norwegian        Operation - A practical application or activity being
    Polar Council estimates for September 1st sea ice over     planned or executed in a particular environment.
    the period 1985-2014, as defined by the Norwegian
    Ministry of Climate and Environment Barents Sea            Product - a presentation of data in the form of
    Management Plan. The operational definition used           maps, visual imagery, tables, or other format that is
    by sea ice services refers to the WMO No.259, Sea Ice      intended for use by operators and planners. E.g. sea
    Nomenclature where “The demarcation between the            ice forecast product.
    open sea and sea ice of any kind, whether fast (fast
    ice edge) or drifting. The drift ice edge may be termed    Derived product - Products or information created
    compacted or diffuse.” The difference between the          through use of other sources, of data. For example,
    two interpretations is significant because it can mean     sea ice concentration products are derived from raw
    differences in ice edge locations from a few to hun-       satellite data information.
    dreds of kilometers. This affects how the location of
    ice edges in a product is disseminated and affects how     Services - Assistance provided to users in the form of
    decisions are made for the types of activities that will   consultation, products and product support.
    be permitted in the area in question.
                                                               Skill - the level of ability, here used for the perfor-
    IMO – International Maritime Organization                  mance of climate and forecast models to reproduce
                                                               observed events
    Model – a numerical representation of sea ice
    evolution, using either statistical methods based          WMO – World Meteorological Organization
    on past sea ice extent, or using physical measures
Summary

Two virtual conferences brought together participants        projections as they plan over shorter operational
from forecasting, operations, climate and sea ice fore-      time scales, and over longer investment and policy
casting, economics, and planning. The aim was to             timescales.
better understand user needs in Arctic operations and     4. Indicating and relating a mariners’ level of expe-
planning, and more specifically to explore whether           rience in ice relative to the ice class of the ship
                                                                                                                    5
the development of sea ice forecasts can be useful           they are operating. Navigator experience should
for future maritime operations and planning, partic-         be commensurate with the ice class of the vessel,
ularly along the ice edge and marginal ice zone (MIZ).       but ice dynamics introduce risks with consequence
Given the challenges of maritime users often working         for safety and preparedness also for open water
on multiple temporal and spatial scales at any given         vessels, particularly in areas along the ice edge,
time, it is essential that the information providers         coastal zones, MIZ and outer ice pack where polar
(researchers, forecasters) understand the difference         lows can rapidly change ice conditions.
between the use of products that are appropriate for
projections of sea ice extent for future investment and   From the workshop, this report recommends that
policy, and those that are more suitable for planning     researchers and product developers
and supporting operations (Wagner et al, 2020). The       1. Establish formal cooperation opportunities
workshops were supported by the Svalbard Strategic           to develop a longer-term strategy that allows
Grant SSG, (The Research Council of Norway), with            researchers, forecasters, and user groups to jointly
the aim of fostering international cooperation, open         develop and validate prototype products. An open
sharing of data, coordination of logistics, the use of       dialogue with users will enable researchers to
new technologies, and to reduce the environmental            tailor products that better suit user needs and
impact of fieldwork.                                         ensure awareness and capacity building for the
                                                             use of tools that are available today.
This report recommends:                                   2. Create initiatives that allow product developers to
1. Translating operational model outputs and where           integrate end-user needs during the development
   appropriate, research model results, into deci-           process to strengthen the relevance of methods
   sion-relevant products that are easily understood         and findings.
   and accessible for all users.                          3. Facilitate the communication of limitations and
2. Forecast products should be integrated into mari-         possibilities presented by forecasts for Arctic
   time navigator training curriculum: Forecasts could       marine operations, planning, and investments
   be beneficial for end-users if there is more effort       over different time scales
   on capacity building and training programs. This       4. Identify and address hindrances that prevent users
   will allow users to have a better understanding of        have from accessing to and making use of sea ice
   forecast capabilities.                                    information
3. Building user capacity to accommodate uncertainty
   in existing forecasting products and in climate
Introduction

    This white paper reports on two virtual workshops        of industry, shipping, and polar tourism. For leisure
    held with representatives of the Norwegian Coastal       visitors to the Arctic, multiple vessels, ranging from
    Administration, the Reference Fleet, sea ice research    large overseas and expedition cruises to small per-
    communities in Norway and the United States, and         sonal yachts, and of varying ice classes, will continue
    the Norwegian Ice Service. The workshops were            to sail in the region. This will also be the case for an
6
    planned as sessions at the High North Dialogue in        expected increasing number of fishing vessels, and
    Bodø in March 2020, with funding from the Sval-          cargo, container, and oil tanker vessels. This increase
    bard Strategic Grant. The High North Dialogue was        will also bring new and less experienced mariners
    cancelled due to the Covid-19 pandemic, and could        into Arctic waters. Understanding knowledge needs
    not be rescheduled for the following meeting. The        among current and future mariners, as well as the
    organizers opted instead to host two virtual meetings.   capabilities of models and technology is key to reduc-
    This format permitted a different set of participants    ing the risks from increasing Arctic marine traffic.
    to the intended academic audience. This produced
    more applied discussions of sea ice forecasting needs    This report first outlines the workshops’ contributions
    and product development with the Norwegian Ice           to the strategic objectives of the Svalbard Strategic
    Service, the Norwegian Coastal Administration, the       Grant. It then presents the state of the art in sea ice
    Norwegian Reference Fleet, and researchers.              forecasting, and highlights key knowledge needs. The
                                                             report outlines the workshop findings in the follow-
    The pair of workshops were inspired by the growing       ing sections. User perspectives on knowledge needs,
    need for improved skills among mariners, forecast-       state of the art, and perspectives on the future of
    ers, and modelers to reduce the risks of operating in    the Arctic are presented in the form of quotes and
    ice-encumbered areas. The Arctic is home to approxi-     insights shared by participants. In the discussion, the
    mately 4 million people, and the number of residents     report reflects on these findings and recommends
    and visitors is expected to increase from the growth     action points and priorities for further research.
Meeting Svalbard Strategic Grant’s
strategic objectives
Svalbard Science Forum’s (SSF) strategic objectives        Norway, under the “Copernicus evolution – Mission
of cooperation, coordination, sharing of data and          exploitation concepts for the Polar Regions” (2018-
reduced environmental impact were at the core of           2021)), and the United States NSF-funded project
this project’s purpose, scientific contribution, and       “Modeling Risk From Black Carbon In A Coupled Nat-
organization. Meeting the SSF strategy for open            ural-Human System At The Arctic Ice Edge” (Brown
                                                                                                                    7
sharing of data and information, the workshops             Univ. 2018-2021).
included discussion of user needs and the limitations
and possibilities for research. Topics included possi-     SSF-funded workshops are required to contribute to
ble challenges in sharing different forms of sea ice       a reduced environmental impact. The project team
information, issues concerning intellectual property       achieved this in two key ways. First, on the project
rights, the timing and extent of information sharing,      level, the workshop was organized using the online
forecasting, access to sea ice maps and information,       meeting platform, Zoom, where approximately ~25
and other issues relevant to debates over open infor-      end-users from the Norwegian Coastal Administration,
mation sharing for Arctic operations and research.         the Reference Fleet (Referanseflåten), and research-
                                                           ers from Norway and the United States participated
The proposal to hold the workshops built on recom-         in a roundtable discussion. Second, on the policy
mendations from previously funded SSF research,            level, there is a need for improved understanding
including the “1st Science-Industry platform on            of user needs as a wider global community of ship-
expedition cruise tourism in Svalbard (Oslo, 2012),        ping operators make decisions to navigate in Arctic
and the SSF-funded workshop on “Barents Sea Ice            waters as sea ice regimes respond to anthropogenic
sheet - insights into the climatic sensitivity of marine   climate change. Decision-makers need improved tools
based ice sheets” (Anne Hormes, 2012). Workshop            to plan for futures in which Arctic shipping increases
participants brought insights from the ERC-funded          markedly. The two workshops allowed exploratory
project “Mixed-phase clouds and climate (MC2)”             conversation to synergize research that will improve
(Storelvmo, UiO 2018), the EU-funded LC-SPACE-             products for operations and planning at all scales of
02-EO-2018 “KEPLER (Key Environmental monitoring           sea ice forecasts.
for Polar Latitudes and European Readiness)” (MET
State of the art
    and knowledge needs
    The rapid retreat and altered dynamics of Arctic sea              and variability of retreat, particularly on seasonal
    ice has long been a symbol of global climate change.              time scales (Boeke and Taylor 2016) are subject to
    As summer sea ice transitions from largely Multi-Year             much disagreement among climate models. Further-
    Ice (MYI) to mostly First-Year Ice (FYI) with longer              more, the Svalbard and Barents Sea sector of the
    open water seasons, new routes are expected to                    Arctic shows a large variability in seasonal sea ice
8
    become more accessible and transit seasons are                    extent (Figure 1), therefore places greater demand
    expected to begin earlier and end later. While there              on conveying a more accurate representation in sea
    is wide agreement on the long-term trend in sea ice               ice models and forecasts. Moreover, about 80% of all
    retreat, there are many uncertainties in medium term              Arctic shipping crosses Norwegian waters (St. Meld.
    projections of sea ice extent and dynamics, as well               31 2015-2016).
    as in short term forecasts for navigation. The rates

    Figure 1: Top row: Standard deviation of number of ice-free days for selected decades of a 40-member ensemble of the NCAR CESM
    (Kay et al., 2015). Values range to 100 days (red). Low row: Total number of breakpoints detected by Rodionov (2004) routine for
    ensemble members. Maximum values reach 60 instances (red).
Current operational short-range (lead times 1-10          the Suez Canal alternative (see Bennett et al. 2020,
days) sea-ice forecasting systems have a km-scale         Stephenson and Smith 2015). Humbert and Raspotnik
resolution and mostly assimilate satellite data with a    (2012) find that Arctic routes are presently a com-
resolution of O(20km). In order to make those sea-ice     mercial risk for shipping companies, citing potential
forecast products useful, the forecast accuracy and       ship damage and delays caused by ice risk. Based
resolution needs to be further improved by advancing      on differences in estimated costs and risks, Lasserre
on sea-ice reologies, physics, and data assimilation      (2014) and Meng et al. (2016) find there is diver-
of high-resolution (greater than 1km spatial resolu-      gence in perspectives on the viability of Arctic sea
tion) satellite data. In addition, there needs to be a    routes. To-date, traffic has been modest. After a peak
stronger emphasis on the development and choice           in traffic along the Northern Sea Route (NSR) in 2013,
of the verification methods (Melsom et al. 2019). Sea     when 71 ships transited, transits remain below 40 per
ice forecast systems for long-term (e.g. investment)      year (Figure 2 , Li et al. 2021). Nevertheless, cautious
planning can provide an overview on sea ice condi-        optimism among nations and shipping operators has          9
tions and progress towards skillful seasonal forecast     driven some early investment in vessels and infra-
of for example the sea-ice edge (Palerme et al. 2019)     structure. In particular, future raw material shipments
the length of open water season in a given area (Dirk-    from the Arctic region to Asia drives this interest,
son et al. 2019 ). These uncertainties, variabilities,    although policy barriers between nations remain a
and limitations present challenges to managing risks      limitation (Lee and Kim 2016). For the time being, the
from increasing marine operations, and for the good       majority of Arctic marine traffic is limited to shorter
governance of expanding Arctic industries (Veland         transits within the Atlantic, Russian, and Pacific sec-
and Lynch 2017).                                          tors. Fishing vessels make up the majority of this
                                                          traffic, followed by other industrial vessels (Table 1).
At the same time, investors and nations alike are plan-   Passenger vessels such as cruise ships, ferries, and
ning for potential futures where receding sea ice,        other smaller vessels together make up only ca. 8
lower fuel prices, and industry consolidation might       percent of the traffic.
make the transpolar shipping route competitive with

                                                                                  Figure 2: Number of transits on
                                                                                  the NSR per year 2011-2019 (data
                                                                                  source: CHNL 2020,
                                                                                  arctic-lio.com)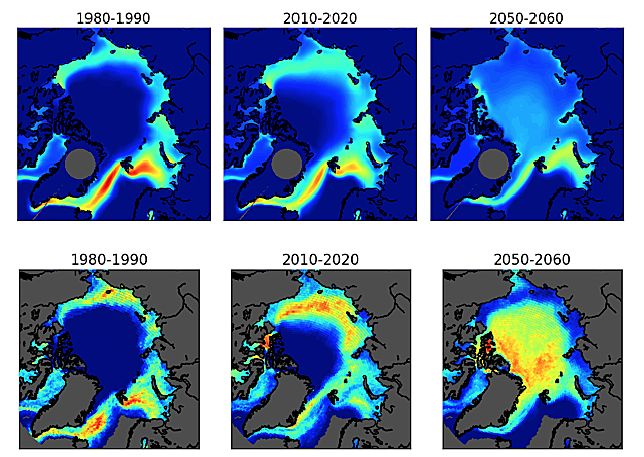
Geographic Arctic                       IMO Arctic
                                                                                                          Table 1: Number of vessels in the
                                                                                                          geographic Arctic and the IMO Arc-
             Ship class              Number of      Percent of fleet   Number of          Percent of
                                                                                                          tic for 2015 (modified from Comer
                                       ships                             ships              fleet
                                                                                                          et al. 2019). The IMO definition of
           Fishing vessel               1903             18.8             755                  36.2
                                                                                                          the Arctic excludes high-traffic areas
           General cargo                2035             20.2             243                  11.6       of the Atlantic Arctic region.
           Service vessel               618               6.1             198                  9.5
            Bulk carrier                1287             12.7             181                  8.7
             Tug boats                  501               5.0             138                  6.6
          Chemical tanker               874               8.7             109                  5.2
             Oil tanker                 691               6.8              94                  4.5
         Refrigerated bulk              213               2.1              90                  4.3
             Offshore                   521               5.1              64                  3.0

10            Cruise                    154               1.5              63                  3.0
             Container                  292               2.9              43                  2.1
            Ferry-to-pax                387               3.8              37                  1.8
           Ferry-pax only               192               1.9              21                  1.0
               Ro-ro                    119               1.2              20                  1.0
               Yacht                     76               0.8              13                  0.6
              Vehicle                    51               0.5              11                  0.5
        Liquefied gas tanker            172               1.7               4                  0.2
               Other                      4               0.0               1                  0.0
           Non propelled                  7               0.1               1                  0.0
        Other liquid tankers              3               0.0               -                   -
               Total                   10,099             100             2,086                100

     Due to the increased risk of health and safety, the                        Convention for the Prevention of Pollution from Ships
     International Maritime Organization (IMO) Interna-                         (MARPOL) (IMO Doc. MSC.385(94)). The Polar Code
     tional Code for Vessels Operating in Polar Waters                          provides guidance for navigators on required training,
     (Polar Code) was implemented in 2017 and is manda-                         relevant environmental information (i.e. weather, ice,
     tory for ship operators travelling in the polar regions                    oceanographic, etc.) and types of ice regimes in which
     to follow under both the International Convention for                      specified ice class vessels may operate (Table 2).
     the Safety of Life at Sea (SOLAS) and the International

     Table 2: Polar Classes (from IMO 2019)

        Polar Class         Ice Description (based on WMO Sea Ice Nomenclature)
            PC1             Year-round operation in all Polar waters
            PC2             Year-round operation in moderate multi-year ice conditions
            PC3             Year-round operation in second-year ice which may include multi-year ice inclusions
            PC4             Year-round operation in thick first-year ice which may include old ice inclusions
            PC5             Year-round operation in medium first-year ice which may include old ice inclusions
            PC6             Summer/autumn operation in medium first-year ice which may include old ice inclusions
            PC7             Summer/autumn operation in thin first-year ice which may include old ice inclusions
Mariners’ Levels of Experience less experienced, who may travel near ice or com-
Today, mariners operating these vessels are overall pletely avoid any ice. Distinguishing a mariners’ level
well experienced, and the use of ice pilots is currently of experience can also be considered and related
required and will continue to be under the Polar Code to the ice class of the ship they are operating. For
for specific ships over a certain tonnage. The Polar example, ships that are built with higher ice classes
Code will also require all navigators to have a basic will require a more advanced level of certification
training certification for those planning on travel- because it is assumed that the navigators will be trav-
ling in ice-encumbered areas. However, the level of elling through different types of ice regimes within
expertise for navigators travelling in this area varies the pack ice or outer pack ice. However, the concern
(Lovecraft et al. 2013, Hamilton & Stroeve 2016, Knol is that a navigator with little experience with sea ice,
et al. 2018), and the diversification and increase is operating a ship (that also has a lower ice class)
in economic activity following industry growth is in areas where open water and MYI or glacier ice
expected to intensify this variation (Wagner et al. can be advected from the main ice pack and very 11
2020). All navigators will want to comply with the quickly drift into an unexpected area. So the linkages
Polar Code regulations but some of the guidelines between absolutely no ice, low ice area, and a need
can be vague with regards to specific ice conditions for more experience for the navigator are weak. It is
or requirements for sources of information. Future important to consider these scenarios to determine
challenges include finding the balance between the the best way to support navigators so they can make
shifting ice regimes in high-traffic areas in the Arctic the best decisions (Polar Code 12.3 – Regulation).
and assuring that navigators with less experience Furthermore, Blair et al. (2020) find that planners and
know where to access the correct data to support navigators frequently face contradictory solutions as
their activities and how to interpret the information. they manage uncertainties across different spatial and
temporal scales. They therefore recommend knowl-
Given such factors, Wagner et al. (2020) argue marine edge co-production processes for forecast product
operators should not be treated as a homogenous development (Blair et al. 2020). To understand the
group where it is assumed everyone will have the differences between mariners, the International Ice
same knowledge or are able to interpret large suites Charting Working Group (IICWG) found that there is
of data products, for all areas during all seasons. a need to account for ship capabilities, vessel sizes,
For instance, the KEPLER (2019) and IICWG (2019) level of experience, seasonality, ice regime, and cer-
reports show highly experienced navigators may tification and training (Table 3).
prefer different ice information than those who are
Table 3: Factors relevant to the differences in skill among mariners in Arctic waters (KEPLER International Ice charting Working Group 2019)
Multiple ice classes from no ice class to Polar class (yachts, cruise, tanker, bulk carriers, coast
Ships capabilities guard, container and others) and these may travel through various ice regimes (i.e. ice edge,
marginal ice zone, outer pack ice, etc)
Vessel Size Small vessels to cruise ships
Ship Operator/Navigator Ranges from background with limited experience to high level expertise
Seasonality Calm and ice free to extremely harsh with no visibility and blocked by ice
Ice regime Ice free to MYI/SYI and FYI ice mixed with icebergs
Many training facilities specialize in polar regions training and are appropriate for operations
Mariner training
in ice, but Polar Code certificates are also issued by Bahamas, India, Philippines.Sea ice regimes and user information needs products (Table 4). For instance, a captain several
Sea ice conditions vary considerably across the Arctic. days away from the ice edge may be satisfied with an
In addition to sea ice variability (Figure 1), there are ice product (see glossary) that is several km off, pro-
differences in sea ice age, thickness, floe size, and vided it offers a relevant picture of the ice situation.
movement, among many others. In the Northern and The Norwegian Ice Service defines the sea ice edge as
Eastern part of Greenland and within the pack ice 1/10 of ice or more, but hazardous small scale ice is
above Svalbard and the Barents Sea, year-round ice often also present outside the ice edge, pointing to a
cover in some areas and partly very rough ice con- need for the resolution to describe ice edge properly
ditions including ice pressures and heavy multi-year and the small scale ice outside. The IICWG Mariner
floes. Sea ice mapping in the Arctic is highly depen- Training Survey (2019) found that there is a need to
dent on meter-scale remote sensing for operations as define quantitatively the qualitative scale “far from
the primary source of information, due to numerous ice.” This term is used today but raises considerable
12 safety and environmental risks of in-situ mapping. challenges in terms of accuracy.
As investment continues to grow in the Arctic, marine Highly experienced navigators prefer to have access
operations will call for a substantial need to improve to all available information. They will recognize what
information provision through Earth Observation may require background information to understand
(EO) services and products, to ensure that safe and the limitations, and interpret difficult areas along
efficient operations can be adequately supported coastal zones and the outer pack ice, as well as during
throughout the year. In particular, ensuring better the melt and Summer seasons. For these mariners,
support for relevant sea ice data products through it is important that information supplementing any
the Global Data-processing and Forecasting System other ice information is received onboard and that
(GDPFS) will be critical for operationalization efforts. they are equipped to understand the history of ice
Based on the EU-funded project SALIENSEAS Jeur- in critical areas for navigation. Maps at the kilometer
ing et al. (2020, p. 139) identify three key issues in scale and greater are not suitable for tactical naviga-
user–producer interfaces of the Norwegian Meteo- tion in critical areas such as along the ice edge, in the
rological Institute(1) the importance of knowing how fjords and coastal areas, outer pack ice and marginal
information is used, (2) the increasing automation ice zone, especially during the sea ice and glacial melt
of meteorological practices and the growing need and Summer seasons. In these areas, ships operate
for user observations, and (3) the need for bridging and require sub-kilometer regional/local products to
research-to-operations gaps. serve any vessel all the way from the open ocean to
shore and harbor in ice-covered waters. User needs
For Arctic marine operations, proximity to the ice for ice information in the Arctic vary between ice ser-
edge determines typical requirements of sea ice vices due to the conditions in which they are required
Table 4: Mariner needs relative to their distance from the ice edge (IICWG 2019, KEPLER 2019)
High spatial resolution ice products are probably not necessary: Typical
Ships far from any ice need: iceberg limit, iceberg clusters, sea ice edge, sea ice distribution
compared with average conditions at the scale of 10-100km
High resolution and short term ice products (10 m scale, iceberg
positions, fast updates, hourly forecasts, observed changes since last
Ships near shore and near the ice edge
observation, daily outlook produced ice analysts, high resolution satellite
images in certain regions)
High resolution ice products (ice thickness, pressure, ridges, drift,
Ships in the pack ice (far from the ice edge) strength, leads) nowcasting and 24 h forecast. Scalable files to onboard
systems. satellite images, scale 20-50mto navigate, dissimilar regulation requirements and from the east coast of Greenland to Cape Chelyuskin,
differences in infrastructure where some may support and DMI in Greenland Exclusive Economic Zone (EEZ).
more frequent in situ observation sites and stations. While they have many shared users, the two also
serve different needs, and have different expectations
Ice service products, requirements, of what the other provides. DMI provides regional
and capabilities analysis and broad overview of sea ice including stage
National ice services are the regulatory authority on of development and icebergs, with a detailed focus
sea ice information provision of routine information on South Greenland inshore and critical areas. MET
to mariners to support life and safety (Table 5). They Norway focuses on the MIZ for Greenland, Norwegian
follow an international structure to provide standard and Barents Seas, and the ice concentration up to
products and reduce the effort for any one nation to the North Pole.
support their national interests for ice navigation and
safety in the Polar regions (WMO-No. 574). Norway’s The European Arctic has the highest density of marine 13
area of operational monitoring is considered the Euro- traffic in the region due to high population density at
pean Arctic, the area between Eastern Greenland high latitudes and increasing socio-economic activ-
and Russia. The Norwegian Ice Service and weather ity in this sector. Dynamic sea ice conditions in this
forecasting division in Tromsø, Norway, is designated area provide a seasonality that facilitates easier travel
by the International Maritime Organization (IMO), during the Spring and Summer, unlike other areas
the International Hydrographic Organization (IHO) to of the Arctic. Arctic waters are unregulated in terms
provide standardized sea ice and weather informa- of shipping lanes. This is in contrast with the Baltic
tion, forecasts and warnings to ensure the safety of waters, in which there is an international cooperation
life and property at sea. The same mandate applies to keep waters open for traffic by breaking channels
to national weather forecasters. where other ships follow.
Today, the Norwegian Meteorological Institute (MET) Operational sea ice mapping and routine products
Norwegian Ice Service and the Danish Meteorological mainly use satellite data but areas where sea ice oper-
Institute (DMI) Greenland Ice Service have a common ations are highly regulated or include communities
core of end users across their two different areas of (i.e. Greenland, Russia and Canada) may include the
monitoring responsibility: MET in the Atlantic section use of more reconnaissance and in situ observations.
Table 5: National ice service providers in the Arctic (Source: WMO 2019)
United States US National Ice Center, North American Ice Service (NAIS)
Canada Canadian Ice Service, North American Ice Service (NAIS)
Russia Centre for Ice Hydrometeorological Information at the Arctic and Antarctic Research Institute
Norway Norwegian Ice Center, Meteorological Institute (MET)
Denmark The Admiral Danish Fleet
Finland Finnish Institute of Marine Research (FIMR)
Iceland The Icelandic Meteorological Office
Greenland, Denmark The Danish Meteorological Institute
Baltic Baltic Sea Ice Services (BSIS)The use of satellites has allowed for ice analysts to is to ensure their activities are conducted in a safe,
combine their expert knowledge of ice conditions of more efficient manner and to avoid the potential of
a given area, and create valuable services and prod- an environmental impact. In general, KEPLER finds
ucts for mariners. Ice analysts continue to produce that end users involved in maritime activities request
routine ice charts manually because the geophysical higher spatial resolution data than is currently avail-
caveats caused by melting snow on sea ice during able from operational satellites, as well as additional
the Spring and Summer, limits the satellites ability parameters such as deformation, leads, ice type, stage
to accurately distinguish areas of ice and open water of development that are currently not available in
and thicker ice from thin ice types. Currently, most routine products fit for marine navigation (IICWG
ice services use SAR (synthetic aperture radar) data 2019, KEPLER 2019, 2020). Short and mid-term sea
at approximately 50m resolution or less, yet augment ice forecasts (multiple days to up to two weeks) that
areas of sparse coverage with optical imagery and can represent areas along the coastal zones, MIZ and
14 visible infrared (when available) or passive micro- indicate when leads will open and close, are consis-
wave data (not ideal due to low spatial resolution). tently requested (KEPLER 2019). The “Safe maritime
The current state of satellites in the European Arctic operations under extreme conditions: the Arctic case
will continue to have almost full SAR coverage over (SEDNA)” project, concluded that the Arctic activity
the monitoring area between Greenland and Russia, sector does not often use current sea ice forecasting
however, future satellites may make it possible to products for ship navigation because they are not
provide more semi-automated or fully automated suitable for using on board vessels, have not been
products that can be effectively validated to over- adequately verified, validated or enhanced for opera-
come seasonal limitations. Yet, current satellite tional use or strategic ice management (SEDNA 2019).
capabilities have demonstrated that long-term and
seasonal sea ice forecasts can be a reliable source for Maritime operators may use historical data for stra-
navigators, but require modifications to make them tegic planning and design, and forecasts for tactical
more easily accessible and understandable for all and route planning. Forecasts can be obtained from
marine navigators. It is also necessary to note how ice services (if available) and data centers. Yet often
precision of sea ice feature tracking differs from what they will rely on their own personal knowledge of
is required for routine products from end-users. For the area and previous experiences to interpret how
example, operational ice services use SAR data for this information can be used to support their deci-
routine ice charting products and for filtering target/ sion. In the context of a non-stationary climate, these
iceberg products. In the case of iceberg products, that approaches have the potential to yield maladapta-
information can be used in production of an iceberg tions. However, new mariners obtaining Polar Code
limit (limit between ice free and bergy waters) in the certification may not have adequate training to oper-
Northwest Atlantic, monitored by the Greenland Ice ate in ice-encumbered areas, depending on where
Service and U.S. International Ice Patrol (Rudnickas the training center is located, and certificates can
et al, 2018). The iceberg limit is updated 2-3 times also be procured online. This introduces numerous
weekly and the accuracy is in kilometers; however, it inconsistencies with mariner experience operating in
requires approximately meter-scale resolution from the polar regions and their level of understanding on
SAR in order to be produced. how to interpret data, if clear information on product
quality is not readily available.
The EU project KEPLER aims to determine how current
information and products developed from the Coper- As sea ice forecast products are made available to
nicus satellite observational programme succeed at users, there is a need for understandable and clear
meeting the needs expressed with user feedback, as metadata included in the data. The IICWG (2019) rec-
well as determine how the term “operational” may be ommends data quality and uncertainty information
defined differently by an information provider, prod- in routine products and forecasts, and need to be
uct developer, researcher and end-users (IICWG 2019, included in order to be part of an operational product
KEPLER 2020). Feedback from surveys, workshops, for navigational safety. Furthermore, inaccessible data
and personal communication with the maritime com- platforms and barriers to communication continue to
munity concur that the purpose of ice information be a challenge in the uptake of information products.15
This is particularly the case with products that are are mainly focused on retrieving long reference data-
developed as part of a research funded project and sets over periods of years that use coarser spatial
not necessarily developed with the end-user in mind. resolution, compared to what SAR or altimetry infor-
Most users can obtain information with the use of mation can provide today. The key is finding how all
satellite and iridium connections at high latitudes information products can support maritime users
yet, these do not allow easy integration with large whether it is short or long-term planning needs. It is
(approx. >1MB) or complicated file formats, especially well known that there is great variability in region-
those that are not scalable. This also can be applied to scale or Pan-Arctic sea ice information products as
areas where topography limits clear data transmission a result of different retrieval algorithms (Ivanova et
(i.e. vessels next to areas in fjords and mountains). al., 2014), that has an influence on how consistent
ocean-sea ice analyses tend to be that assimilate
Overall, there are some key areas that present specific those products (Chevallier et al., 2016; Uotila et al.,
challenges for improved operational monitoring that 2018), and the skill of seasonal predictions initialized
can be supported with the use of improved sea-ice from those reanalyses (e.g., Bunzel et al., 2016). From
forecasting systems which utilize data assimilation an operational information provision service, the key
approach with input data on meter-to-kilometer is to find the balance between information that is
scales and thus relevant for operators and navigators, relevant for end-users and those useful for research-
particularly for areas in the Northern Sea Route (NSR), only activities, but that have the potential to lead to
Svalbard and Greenland waters including the Fram value-added products to support navigation.
Strait. Climate modeling and research requirementsWorkshop findings – Future of the
Arctic from a user perspective
The following sections report on the contents of the is characterized by seasonal and interannual sea ice
two workshops by remaining as true as possible to variability. For instance, comparing the amount of ice
the original way in which statements were made. As around Svalbard in April 2020 to the ice conditions
such, they focus purely on the contents of what was during the same time in 2019 and 2018, there have
said, and do not correct or refer to published liter- already been enormous changes from the perspec-
16
ature. After this presentation of results, the report tive of mariners who frequently use this area and are
continues with a discussion of these findings within familiar with seasonal ice regimes (Figure 3). These
the context of the literature and future work. changes - which include all aspects of the sea ice state
as well as the underlying ocean structure - combine a
Expectation for significant increases response to anthropogenic climate change with large
in Arctic activity: interannual variability, making them challenging to
In the last few years, the Norwegian Coastal Admin- interpret.
istration has observed that new traffic patterns are
being recognized and driven by raw material trade. Preparedness in Svalbard and in the NSR will ben-
Despite year-to-year traffic fluctuations, ships con- efit from any long-term forecast which can reveal,
tinue to utilize the Northern Sea Route to transport if possible, anything about how changing sea ice
resources along the west and eastern regions of the regimes will affect the shipping routes in that area.
Russian Arctic, with 17 of 28 million total tons being If there is a situation 5 - 10 years from now where
transported through the Norwegian waters and close there is less ice and more unpredictability, this will
to the coast. It is projected that 51 million tons of have an effect on preparedness efforts for the NSR.
liquefied natural gas (LNG) and condensate minerals It is unclear whether the situation in the 2019-2020
will be transported along the Northern Sea Route season, where there was more ice around Svalbard
in 2024, not including traffic from Murmansk and and sea ice extended further south than previous
Arkhangelsk. New trends are emerging where Canada years, was predicted, but participants from research
exports iron ore to China and Taiwan. These routes indicated there were some signals to that effect. The
trend very close to 79 degrees north before entering fishing industry representative stated, “we’ve seen
the NSR. Today, this area (March 2020) has very heavy evidence in the last 3-4-5 years that the water tem-
pack ice, maybe 1 – 1 ½ meter thick, so this is not pos- perature in the Barents Sea has been going down.”
sible at present. These routes are often inaccessible
in October at present due to heavy ice conditions, The forecasters said the Bergen group (Bjerknes
but may open for longer periods in the coming years. Center for Climate Research) published predictions
Additionally, there has been an approximate 40% on expected cooling in the Barents over the next years
increase in fishing activity in the Barents Sea since because of a cold anomaly of water masses moving
2013. For future scenarios, this traffic is expected to northward. The forecast is tentative, however: it is
increase since some fish species move northward. unclear how strong the anomaly is and which regions
Thus, forecasts are very important for operators to it may impact. For this reason, it is difficult to say
understand, specifically annual and regional anom- something specific about local areas, for example,
alies and where unpredictable conditions can be the Hinlopen strait, though a rudimentary indica-
expected due to climate variations. tion can be provided a few years before in some
circumstances. The climate modelers contributed
Recent observed changes in ice regimes: that regional variances can be seen when assessing
Despite the sea ice retreat in the Arctic, the region a global climate model projection. Though the overall17
Figure 3: Svalbard sea ice area extent 2018-2020. Data: Norwegian Ice Service (MET)
globe will undergo warming, regional cooling signals how users understand products and forecasts. The
can be observed. For many years the Global Climate Arctic and Antarctic Research Institute (AARI), the
Models (GCMs) have shown that there are these U.S. National Ice Center (U.S. NIC) and the Finnish
signatures of North Atlantic cooling spots. Climate Meteorological Institute (FMI) ice service were used
modellers are trying to understand some of these as examples of how sea ice forecasts provided from
features in their models. Improved models of such operational providers are used from a user perspec-
features will provide more accurate predictions of tive. These institutes deliver many types of forecasts
use to end-users. such as long-range, short-range, and compression, in
addition to their ice forecasting services, that support
From the mariner perspective, the challenge is deter- their specific maritime community operators. Feed-
mining how far south the sea ice will extend. It is a back from participants stated the forecasts from these
key concern because should some areas experience institutes, as well as the National Snow and Ice Data
increased sea ice concentration it will certainly affect Center (NSIDC) can be quite accurate, sometimes up
both fishing vessels and shipping (i.e. LNG concerns) to 1-2 weeks, using freezing degree days and other
and almost all vessels, in different ways, travelling climate parameters.
in the Arctic waters. Currently (at the time of the
workshop), there is a lot of ice south of Storfjord- Additionally, commercial sea ice forecasts are rou-
area and further towards Novaya Zemlya and also tinely developed using both publicly available and
Franz Josephs Land, in contrast to the East Barents commercial-in-confidence data and models. These
Sea, where there is significantly less. The extent of are used by gas companies when setting up opera-
the ice edge in these areas influences whether or tions and for long-term planning to understand when
not there will be more or less ice present rather than they should install platforms and other equipment in
open water, for the duration of the summer season. ice-covered areas. This is important when consider-
ing when and where to charter support vessels. The
Maritime Industry User Needs vessels and equipment should be available to support
in the Polar Regions the operation once ice conditions become favorable.
The following discussion provided insights into Oil and gas companies may require 5 or more yearsbefore a seismic finding requires ice exploration hazard situation that may require multiple levels of
analytics. Once environmental assessments begin, emergency services and corrective action. Subse-
specific personnel will be tasked to investigate ice, quently, if when fishing, a long tether is employed
weather and climate information and undertake a risk over a long period, there needs to be some assurance
assessment, which may require soliciting commer- that the vessel can safely navigate over that duration
cial support from third-party or national services to without having to cease operations. Thus, the fishing
perform long-term climatological analysis. However, boat operator will need to be able to predict where
to reach the goal of enhanced maritime safety, all the sea ice will be to make the best decision.
relevant sea ice information and products must be
publicly available and linked to other main authorized The role of experience and intuition
data information centers that provide information in sea ice navigation
to support navigation (i.e. web pages, national ice To forecast ice conditions, mariners make use of
18 service web pages, Arctic Council and others). synoptic maps, local/regional maps, ice charts and
imagery to predict where the ice will be the next
Users apply experience-based knowledge with day. They compare the sea ice observations with
both ice analysis and sea-ice forecasts the current and forecasted weather conditions and
For the most part users understand that ice anal- plan the route accordingly. This forecasting requires
ysis and ice forecasts are two completely different considerable analytic skills and experience and the
products. They use forecasts to understand how the navigator needs to rely on their own intrinsic under-
ice will move, the type of ice and its age, when it standing of the whole environmental system and not
will freeze and melt, and areas of pressure ridges only the small area around the vessel. They need
and how or when they may open. Good long term to understand what is currently present and what
ice forecasts are available today; however, there is a should be anticipated based on sea ice conditions,
need to include the correct climatological inputs in concentration, weather and wind and ocean currents.
the models, including seawater temperature, as an
important parameter, in order to improve accuracy. While improved sea ice forecasting products are
Currently, there is not a reliable short or long-term key to securing future Arctic operations, the role
forecast available that provides the detail required for of experience and intuition were highlighted at the
navigation. Instead, navigators use routine ice analysis workshop. The need to develop skills to gain an intui-
and imagery to plan operations. For this purpose, tive sense of how the ice moves in this highly dynamic
navigators need imagery that provides a broad-scale environment also plays a key role, a participant noted.
overview of an area larger than their immediate sur- “You can’t just be in the environment for a few days
roundings, as well as point information of the area of and then know how to operate,” they warned. Better
operations. For instance, if a ship is traveling 10 knots, forecasting tools and products may never completely
it will be moving near 240 miles in 24 hours. Thus, fill the gap to allow inexperienced Arctic mariners
the navigator needs to be able to get an overview of to operate safely. The panel agreed, however, if a
the ice and weather conditions to understand how sea ice forecast were available this would present a
they will influence one another. second opinion. Yet, there is and will likely remain a
considerable component of navigation in ice covered
Another example can be illustrated using a fishing waters that relies on skill and some degree of intu-
vessel operating in an area that contains a lot of ice, ition. Over time, trust in new services and products
for example around the south cape of Svalbard (as it should develop after demonstrating the capability to
was a case in Spring 2020), where dynamic ice con- support particular operations. There is therefore a
ditions can be expected from the main pack ice or need for continued engagement between operators,
calving glaciers can quickly advect into areas of open forecasters, and researchers.
water. If the tides around South Cape are approxi-
mately 2 knots, and there is a strong north-east wind, In the example of fishing operators, a short and long-
the ice can arrive quickly and create a dangerous sit- term forecast (approximately up to 1 week) would
uation where the vessel can be in a compromising be preferred. Currently, the Norwegian Ice Service
position. This becomes a safety and environmental only offers observations that the mariners then useto make their own predictions of how ice will move sea ice would be good in combination with the
in the next 24 hours. From a user perspective, in the long term forecast. Services and products that can
absence of forecasts it is preferred to have a good present this type of information on these scales
overview of the whole system. This means the Ice should be included in the Ice Service, as a recog-
Service providing a combination of area and regional nized authority of ice information.
observations and images will be a useful compliment 3. Has an accessible and user-friendly data format.
to support maritime users with decision making. Forecasts will need to be accessible, have a high
compression and must be scalable. Current infor-
Information needs and requirements mation with routine products is easy for users to
The participants shared several key areas in which access while at sea, where bandwidth continues to
there are needs for better information and data be limited and information is needed quickly. Ice
sharing infrastructure. The participants called for Services and other information centers that want
information that: mariners to adopt their products should offer two 19
1. Provides more detail about the location of the ice different web interface options for telephones and
edge, with higher frequency and in a simplified easy ingestion for (1) high bandwidth and (2) low
version of current ice information. The Informa- bandwidth options. A simple way to implement
tion should not be too complicated and must be a forecast would be to offer an image showing
easy for mariners to read and interpret. On today’s ice in a 6-hour time step on expected conditions.
observations they have to zoom in on imagery, The high bandwidth option could be an animation
and sometimes it can be hard to determine the presenting the ice forecast that is ingested directly
exact position of the ice edge just from the pic- into the electronic chart system.
tures. Interannual variability and the dynamics 4. Provide as a long-term service estimates of the
are a considerable source of uncertainty in plan- beginning or end of the navigable season. Such a
ning operations, particularly during the melt and service would provide information on a specific
summer seasons where satellites underestimate date or week in which to plan for specific sea ice
areas of ice due to masked signatures of water. conditions and operations and when the season
The seasonal variations make it difficult to mon- begins and ends. The historical data would give
itor sea ice in a routine way if we want to include comparability to understand what the next season
all features that are of interest to mariners with might bring.
a high level of accuracy. 5. Operational ice information for navigational safety
2. Dissemination of accurate past and future state Is provided more frequently. The main request
of the sea ice for navigational safety. Today, the from mariners is that they need to have daily ice
current state of the sea ice is available on the Ice charts or ice information that supports naviga-
Service web pages and includes a high level of tional safety. Satellite images are available, of
precision on the ice edge and high spatial resolu- course, but the coverage of the satellite image
tion concentration of sea ice, mainly based on SAR does not always represent ice information in spe-
data. Critical information for mariners is knowing cific positions that may be required. This is where
when the ice will break up or refreeze, how the the development of an accurate short term fore-
location of the ice edge will change over a longer cast would be extremely helpful.
time period, and whether the sea ice is multi-year 6. Develop products to support situational awareness
or first-year medium ice type. These parameters to indicate where dangerous ice phenomena can
are very important because such forecasting is crit- occur. For example, some areas can have high tides
ical for maritime operations, shipping and tactical and wind travelling in the same direction. This
and strategic planning. For example, if the ice edge introduces a high velocity in the ice regime and
is pushed approximately 3 nautical miles to the causes potentially dangerous ice conditions to
north and undergoes forcing from northerly winds, quickly develop in the area. Ice warnings and alerts
the mariner will need to determine whether this should be included similar to weather warnings
will cause damage to the vessel, equipment, or for storms on the coast.
how this will affect the operation. As an example, 7. Is compatible with the Electronic Navigational
a 5 -10 day forecast and short term forecast for Chart (ENCs) on board vessels such that theinformation can be displayed there. The German is helpful because the satellite images themselves
Ice Service (BHS) in Hamburg already do their are still today very often too big to download.
analysis of the Norwegian ice chart. This format
is much easier to ingest on the ship because you Obtaining smaller file formats remains a challenge,
can assess the information in relation to the whole and mariners therefore need to find ways of down-
marine operation and vessels. loading and processing data with low bandwidth. The
8. Translates climate model outputs into products VSAT communication has offered some improvement,
that provide decision support. For instance, long but precipitation, snow, freezing snow, the icing on
term business planners may need information the antenna and other issues can limit bandwidth
about the expected variability in season length. even within coverage of VSAT communication. North
Understanding the influence of and resilience to of 78-79N, meanwhile, VSAT is not available, such
uncertainties in these medium range outlooks is that North of New Ålesund there is no connection,
20 critical. There is also interest among modelers to apart from some small spots in Hinlopen, for instance.
ensure their research outputs are made relevant Furthermore, Iridium will be operational soon, and
to mariners. In addition, projections from multiple the HEO satellite is coming up soon, giving broadband
models are needed to provide a sufficient enve- communication in the north. For custom support, Ice
lope of sea ice variability and change reflecting a Services can upload maps and imagery and it allows
range of possible futures. the mariner to access the FTP client to download
data for easy connectivity in the very high Arctic and
Limitations with communications pole expeditions.
and data size requirements
The participants report they need the information File sizes are a limiting factor at ‘the edge of the
sent by email from the Ice Service. These emails world’ where a 5 MB might be a limit, as well as at
should not exceed more than 5 Mb. Even at that file other places and times where reception is spotty
size it sometimes takes 2-4 hours to download the and speed of information is important. While some
emails. While communications are improving, it is a suggestions were to increase the radio coverage or
slow process. Marine operations require attention bandwidth, another suggestion was to have maps
to many things simultaneously, but “to download that cover a much smaller area that is more tailored
heavy maps is not always possible when you are on to the general location of the ship and the direction
the edge of the world,” the member of the fishing of sea ice and the ship’s track. Since they cover less
fleet said. During specific operations, persons at the area, these files could still contain notable detail but
Ice Service respond to e-mail requests for smaller would likely be smaller and thus easier and faster to
(lower resolution) images that include comments and both transmit and receive, especially in bad weather
a forecast for a couple of days. Such communication or locations with spotty or intermittent reception.You can also read