Arab Rebuplic of Egypt - IW:LEARN
←
→
Page content transcription
If your browser does not render page correctly, please read the page content below
Arab Rebuplic of Egypt

                          FEBRUARY 2012
ACRONYMS
EEAA        Egyptian Environmental Affairs Agency
FAO         Food and Agriculture Organization of the United Nations
GDP         Gross Domestic product
GEF         Global Environment Facility
ICZM        Integrated Coastal Zone Management
IMO         International Maritime Organization
JICA        Japan International Cooperation Agency
LBA         Land-based Activities
MWRI        Ministry of Water Resources and Irrigation
PERSGA      Regional Organization for the Protection of the Environment of the Red
            Sea and Gulf of Aden
SAP         Strategic Action Programme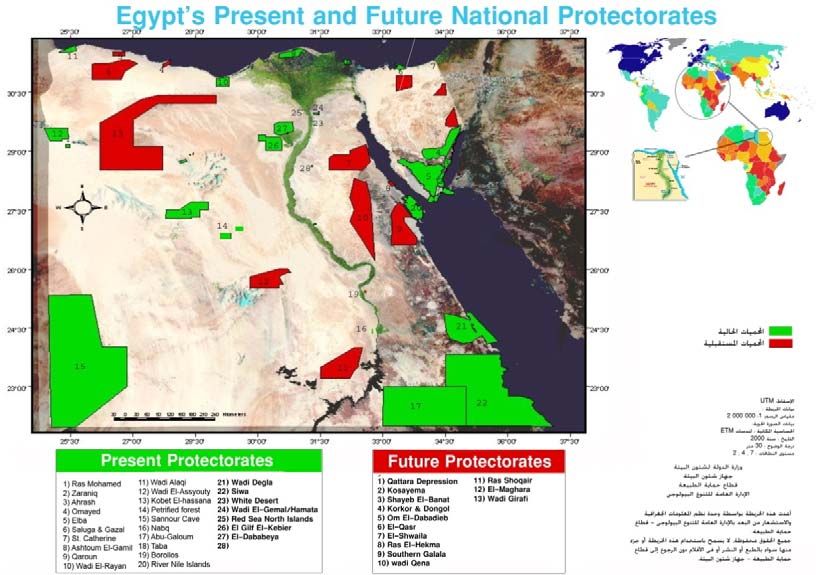
UNCED              United Nations Conference on Environment and Development
UNDP               United Nations Development Programme
UNEP               United Nations Environment Programme
UNESCO             United Nations Educational, Scientific and Cultural Organization
UNIDO              United Nations Industrial Development Organization

                                    CONTENTS
LIST OF FIGURES
LIST OF TABLES
ACRONYMS
PREFACE

  1. INTRODUCTION

  2. SHIPPING
     2.1 The role of shipping in the national economy
            2.1.1 Registered shipping companies
            2.1.2 Number and types of vessels registered
           2.1.3 Shipyards
            2.1.4 The number of people employed in the sector
     2.2 Ports and harbours
            2.2.1 Major Ports, harbors and marinas along the Red Sea, Gulf of    Suez and
            Aqaba costs
                   2.2.1.1 Suez port (PortTawfiq)
                    2.2.1.2 Adabiya Port
                    2.2.1.3 Petroleum Basin Port
                    2.2.1.4 Sokhna Port
                    2.2.1.5 Hurghada Port
                    2.2.1.6 Safaga Port
                    2.2.1.7 Al-Tour Port
                    2.2.1.8 Nuweiba Port
                    2.2.1.9 Sharm El Sheikh Port
                    2.2.1.10 Specialized Ports
                            2.2.1.10.1 SUMED Pipeline and Port

     2.3 Types and frequency of vessels visiting Egypt’s Red Sea Ports

     2.4 The annual volumes of traded goods – imports and exports – passing through each port

     2.5 The Suez Canal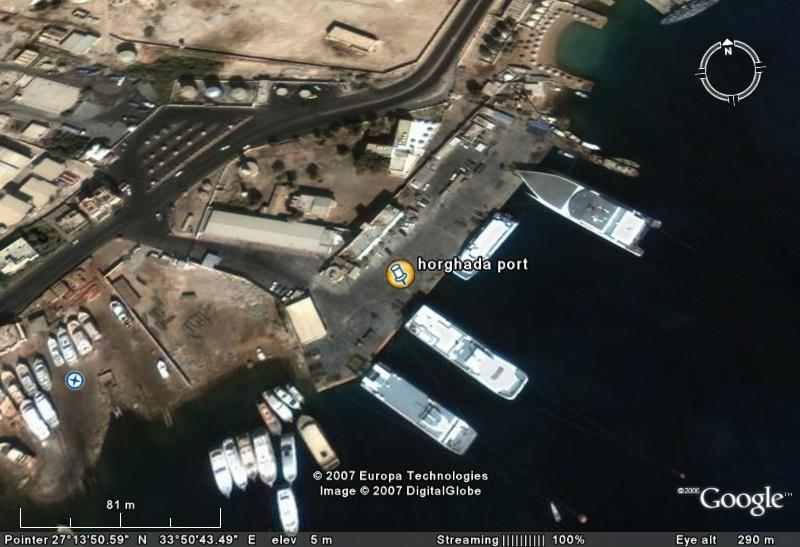
2.6. Situation of oil pollution in coastal waters (source EEAA/JICA, 2009)
2.6.1 Sources and Generation of Oil Pollution
2.5.1.1.Land-Based Pollution Sources- Port related Oil Facilities
2.6.2 Oil Spill Incidents
2.6.3.Spots of Frequent Oil Spill Incidents
2.6.4 Sources of Spilled Oil
2.6.6 Actions Undertaken for Oil Spills
2.6.7 Oil Pollution in Coastal Waters
2.7 Ballast water uptake and discharge
3.THE MARINE AND COASTAL ENVIRONMENT
3.1 Marine and coastal ecology
3.1.1. Red Sea coastal area
3.1.2 Oceanographic conditions
3.1.3 Habitats and Biological Communities
3.1.4 Sensitive and vulnerable coastal environments
3.1.4.1 Environment-Sensitivities, particularly to oil pollution
3.1.5 Sensitive areas and the need for protection
3.1.5.1 Marine protected Areas in Egypt
3.2 Resources of economic importance
3.2.1 Living resources
3.2.2 Tourism
4. CASE STUDIES OF MARINE BIOINVASIONS
4.1 General
4.2 Invasive species: Transboundary elements
4.2.1 Impacts of marine invasive species
4.3 The current situation in the Red Sea Egypt
5. LEGAL, POLICY AND INSTITUTIONAL ASPECTS
5.1 International and regional obligations
5.1.1 The International Response
5.1.2 Regional Response
5.2 National policies and legislation
5.2.1 Environmental Law (Law No. 4/1994) amended by the executive statute of
Act 9/2009
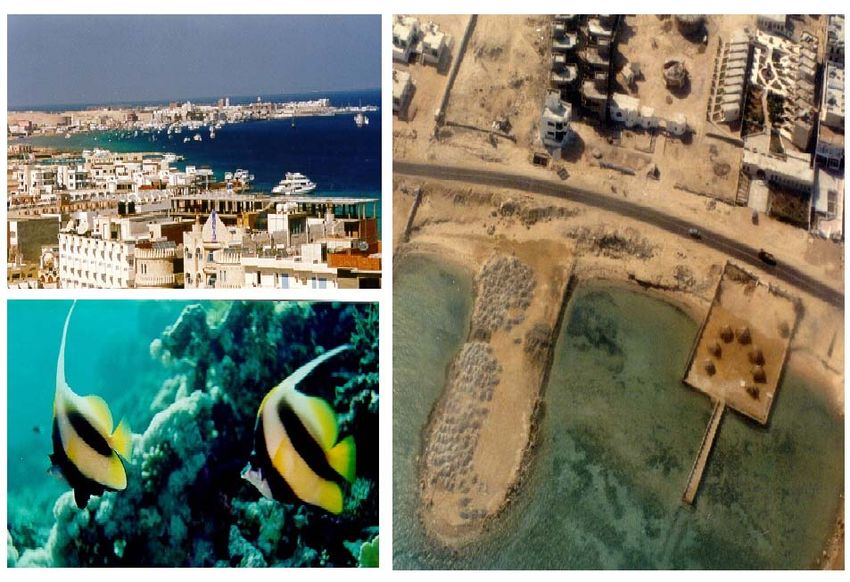
5.2.2. Natural Protectorates (Law No. 102/1983)
5.2.3.Environmental Impact Assessment
5.2.4 Environmental Protection Fund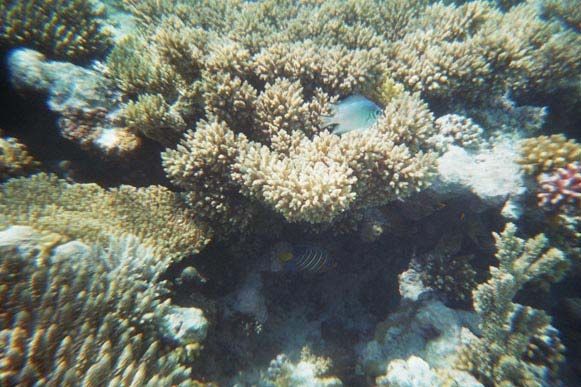
5.3 Legal Setting Associated with Oil Pollution
             5.3.1 Provisions of Law No. 4
             5.3.2 Water Quality Standards for Oil and Greases
             5.3.3 National Oil Spill Contingency Plan

      5.4 National Policy and Strategy
             5.4.1 General Environmental Policy
                    5.4.1.1 National Environmental Action Plan (1992)
                    5.4.1.2 Policy Directive of MSEA (1998)
                    5.4.1.3 Updated National Environmental Action Plan (NEAP) (2002)
                    5.4.1.4 EEAA Five-Year Action Plan

      5.5 Policies Associated with Oil Pollution
             5.5.1 General Principles for Protecting Coastal and Marine Environment
             5.5.2 General Direction for Protecting Coastal Water
             5.5.3 Management Scheme of Coastal Water

      5.6 Integrated Coastal Zone Management
             5.6.1 Current ICZM Institutional Context
             5.6.2 The ‘Framework Programme for the Development of National           ICZM
             Plan for Egypt, 1996’

      5.7 National Institutions
             5.7.1 Ministry of State for Environmental Affairs (MSEA) and the Egyptian
             Environmental Affairs Agency (EEAA)
             5.7.2 Ministry of Transport-Maritime Transport Sector “MTS”
                    5.7.2.1 Red Sea Port Authority
                    5.7.2.2 Port State control

6. STAKEHOLDERS SUPPORT

7. CONCLUSIONS AND RECOMMENDATIONS

8. NATIONAL SOURCES OF INFORMATION
       7. 1 National Experts
       7. 2 Sources of Information
              7.2.1.Web sites (National Level)
              7.2.2 References
Boxes
Box 1. Case Study: Exotic Invasive Seaweed Caulerpa prolifera in Suez Canal

Box 2. Success story: Crown of thorn starfish - Predator Outbreaks
Box 3. Regional initiative concerning Port State Control

ANNEXES
ANNEX 1. REGISTERED SHIPPING COMPANIES IN EYPT
LIST OF FIGURES
Figure 1. Egypt’s topographic map including the Red Sea
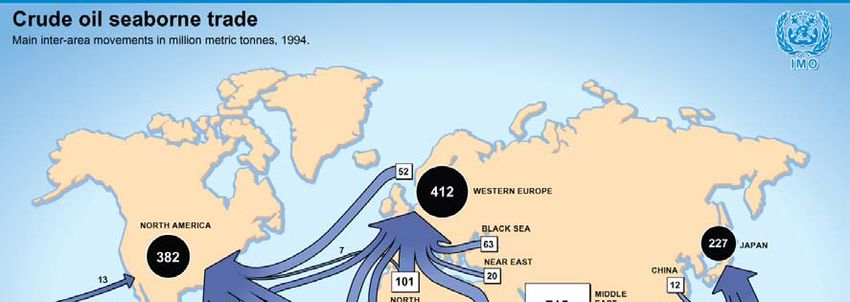
Figure 2. Oil transport pathways including the Red Sea area
Figure 3. Share of Egyptian Ports in Total Local and Transit cargo in 2005 %
Figure 4. Share of transport sector, including maritime, in Egypt ‘s production services
Figure 5 a. Location of major ports and harbours along the Red Sea of Egypt
Figure 5 b .Ports in the Gulf of Suez (source: EEAA/JICA, 2009)
Figure 6. Suez port (PortTawfiq)
Figure 7. Adabiya Port
Figure 8. Petroleum Basin Port
Figure 9. Sokhna Port
Figure 10. Sokhna Port (Master Plan 2020)
Figure 11. Hurghada Port
Figure 12. Safaga Port
Figure 13. Nuweiba Port
Figure 14. Sharm El Sheikh Port
Figure 15. SUMED Pipeline
Figure 16 .Location of oil fields and pipelines in the northern Red Sea of Egypt
Figure 17. Oil spills incidents in the northern Red Sea
Figure 18. Location of oil spill incidents
Figure19. Sources of spilled oils
Figure 20. Actions taken for oil spills
Figure 21. Situation of oil pollution in coastal waters
Figure 22. General geomorphologic map of the Red Sea, Egypt
Figure 23. Avicennia marina from the Red Sea coast of Egypt
Figure 24. Rhizophora macronata, Shalatin
Figure 25. Distribution of coral reefs in the Red Sea, Egypt
Figure 26. Landfilling a beach in Hurghada
Figure 27. Areas subjected to land infilling operations in Hurghada during the 16-year period from
1984 to 2000.
Figure 28. Recreational impact on coral reef
Figure 29. Sea grass beds from the Red Sea
Figure 30. Hawksbill Turtle
Figure 31. Environmental Sensitivities of the Northern Red Sea and Gulfs (Egypt)
Figure 32. Egypt's present and future national protectorates
Figure 33. The Red Sea fish production between 1992 and 2007
Figure 34. Number of marine fishing vessels using different gears in 2007
Figure 35.Major pathways, concurrent with major shipping routes, and origins of invasive or toxic
species infestations in the marine environment
Figure 36. The Suez canal and Fistularia commersonii, a lessepsian migrant
LIST OF TABLES
Table 1. Types, number and conditions of registered vessels
Table 2. Number of frequented vessels calling in Red Sea Ports during the period from 1/7/2008 to 30/6/2009
Table 3. Number of frequented vessels calling in Red Sea Ports during the period from     1/7/2009 to
30/6/2010
Table 4. Number of frequented vessels calling in Red Sea Ports during the period from 1/7/2010 to 30/6/2011
Table 5. The annual volumes of traded goods- imports and exports – passing through Egypt’s Red Sea Ports
(tonnes) during the period from 1/7/2009 to 30/6/2010
Table 6. The annual volumes of traded goods- imports and exports – passing through Egypt’s Red Sea Ports
(tonnes) during the period from 1/7/2010 to 30/6/2011
Table 7. Total Suez Canal crossing vessels, net tonnage, containers and total cargo (2001 – 2008)
Table 8. The estimated volume of ballast water being discharged in the Red Sea ports annually (2009 – 2010)
Table 9. Number of genera and species of reef building corals in the Egyptian Red Sea
Table 10.Red sea fish production by species and locations in 2007
Table 11.Classification of marine fishing vessels according to power and gears in 2007
Table 12. Register of the Multilateral Agreements to which Egypt is a Signatory
Table 13. Relevant Stakeholders

ACRONYMS
EEAA                   Egypt’s Environmental Affairs Agency
FAO                    Food and Agriculture Organization of the United Nations
GDP                    Gross Domestic product
GEF                    Global Environment Facility
ICZM                   Integrated Coastal Zone Management
IMO                    International Maritime Organization
JICA                   Japan International Cooperation Agency
LBA                    Land-based Activities
MWRI                   Ministry of Water Resources and Irrigation
PERSGA                 Regional Organization for the Conservation of Environment of the Red
                       Sea and Gulf of Aden
SAP                    Strategic Action Programme
UNCED                  United Nations Conference on Environment and Development
UNDP                   United Nations Development Programme
UNEP                   United Nations Environment Programme
UNESCO                 United Nations Educational, Scientific and Cultural Organization
UNIDO                  United Nations Industrial Development Organization

PREFACE

According to GEF/UNDP/IMO/IOI (2009), shipping is essential to the global economy,
providing the most cost-effective means of transporting bulk goods over great distances. Over
90% of all global trade – including everything from food and fuel to construction materials,
chemicals and household items – is carried by ships, with some 36,000 merchant ships sailing
the world’s oceans, with a combined tonnage of over 1 billion dead weight tonnes (dwt)
(UNCTAD, 2008).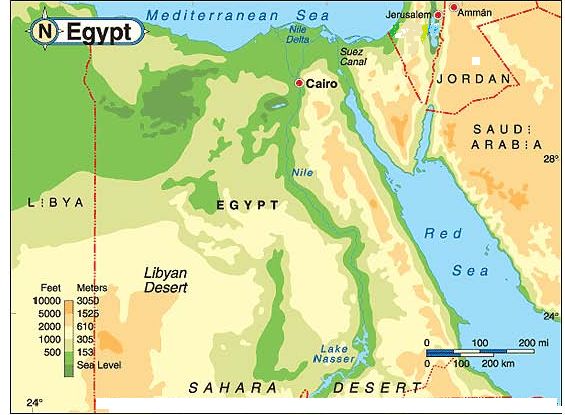
Ships are specifically designed and built to move safely through the water while carrying this
cargo. But, when the ship is travelling either without cargo, or only partially laden, it must take
additional weight on board to enable it to operate effectively and safely by, for example, keeping
the ship deep enough in the water to ensure efficient propeller and rudder operation. This
additional material is called ballast. When ships were first built years ago, they carried solid
ballast, in the form of rocks, sand or metal. However,
since around 1880, ships have used water as ballast principally because it is more readily
available, much easier to load on and off a ship, and is therefore more efficient and economical
than solid ballast (GEF/UNDP/IMO/IOI, 2009).

While ballast water is crucial to the safe operation of ships, studies have shown that when ballast
water is taken on board, the organisms living in that water are also drawn in to the ballast tanks.
Depending on the duration of the voyage and other factors, many of these organisms are then
able to survive the journey, and are subsequently released live into the waters of the destination
port when the ballast water is discharged. Thus, ballast water serves as a vector for the transfer of
species from one part of the world to
another. Where this new area is outside of its natural geographic range, the species which has
been transferred is commonly known as an invasive alien species. If
the environmental conditions in this new geographic area are suitable, the alien species may then
not only survive, but may establish and spread, in many cases causing, or with the potential to
cause, harm to the local environment, economy, or human health

Invasive alien species are now generally recognized as one of the greatest threats to biodiversity
globally. They also have serious economic, environmental and health impacts and, as a result, place
major constraints on development. In marine and coastal environments, invasive species have been
identified as one of the greatest threats to the world’s oceans. Ballast water is of particular concern
as a vector for the introduction of invasive alien species both because of the large quantities of
ballast water being used and discharged into new environments around the world, but also because
of the huge variety and numbers of species which it may transfer (IMO, 2009).

The International Maritime Organization (IMO) is the United Nations’ initiatied the development
of the International Convention for the Control and Management of Ships’ Ballast Water and
Sediments (2004), and the GloBallast Programme. The primary objective of the second phase of
the GloBallast Programme (Globallast Partnerships (GBP)) is to assist developing countries with
the implementation of the Ballast Water Management Convention by supporting the
development of appropriate national policies, legislation and institutional arrangements. This
support is provided through the development and distribution of relevant technical guidelines– of
which the Guidelines for National Ballast Water Status Assessments are one example.

Accordingly, the Regional Organization for the Protection of the Environment of the Red Sea
and Gulf of Aden “PERSGA”, has initiated in cooperation with the IMO the development of
national assessment reports for its riparian countries. Within this context, Egypt developed this
report following the GEF-UNDP-IMO GloBallast Partnerships and IOI, 2009: Guidelines for
National Ballast Water Status Assessments. GloBallast Monographs No. 17.
This integral report has multifaceted purposes. It will not only serve the ultimate goal that is
developing Egypt’s National Ballast Water Management Strategy, but it will be the building block
for other reports if required in the BWM process.

The formal contributor to this report is the Red Sea Port Authority, Egypt. National experts on
their personal capacities provide invaluable efforts and assistance to finalize this document.

The report is based on accessible, accredited, documented and reliable information provided
from all contributors.

   1. INTRODUCTION
The Red Sea is a great canyon created by the pulling apart of the Arabian Peninsula and Africa.
The longitudinal axis of the Red Sea extends for about 2950 km between 40º N and 12º 40’ N
and has a surface area of 440,000 square km. The Red Sea connected at its northern end with the
Mediterranean Sea through the man made Suez Canal, and at its southern end with the Indian
Ocean through Bab el Mandeb strait. The average width of the Red Sea is about 280 km.

The maximum depth the Red Sea is 3039 m, and its average depth is 524m. In cross section The
Red Sea is roughly V shaped. Meanwhile the depth of Bab el Mandeb does not exceed 100m.
This shallow sill, separating the Gulf of Aden and the Red Sea water masses below the level of
100m, and has a determining influence on all the oceanography of the Red Sea. According to the
200 mile limits and the limited width of the Red Sea, the whole width of the Red Sea is included
in the national economic zones of its bordering countries.

The Egyptian coast of the Red Sea proper is about 750 km, stretching from Ras Gemshah (N) to
Ghubbet Essa (S) on the Latitude 22º which represent the Southern border of Egypt (Figure 1).
The northern end of the Red Sea is bifurcated by the Sinai Peninsula, creating the Gulf of Suez in
the west and the Gulf of Aqaba to the east. The Gulf of Suez is a relatively young rift basin,
dating back 40 million years. It stretches some 280 km to north, terminating at the City of Suez
which is the entrance to the Suez Canal. Along the mid-line of the Gulf lies the border between
the continents of Africa and Asia. The entrance of the Gulf of Suez in the south lies atop the
mature oil and gas field. The Suez Canal, extending from Port Said to Port Tawfiq (near Suez)
and connecting the Mediterranean Sea with the Gulf of Suez, and thence with the Red Sea. The
canal is about 160 km long. The Canal comprises two parts, north and south of the Great Bitter
Lake, linking the Mediterranean Sea to the Gulf of Suez on the Red Sea. The Canal allows two-
way north to south water transport between Europe and Asia without circumnavigating Africa
(EEAA/JAICA, 2009)

                    Figure 1. Egypt’s topographic map including the Red Sea
Egypt’s coast along the Red Sea is formed mainly of more or less flat lands with average width
varying between 3 and 20 km. This flat land is bordered from the western side by the chain of the
Red Sea Mountains. The highest of which is Gabel Shayib El Banat (2187 m.). The mountains
may have extensions seaward as in Ghubbet El Zeit north of Hurgada, or may produce islands, as
Shedwan and Giftoon. The wadis extend from the mountains to the coast.

The Red Sea and Gulf of Aden carry around 7% of global seaborne trade and a significant
portion of the world’s crude and refined oil cargoes (PERSGA, 2004).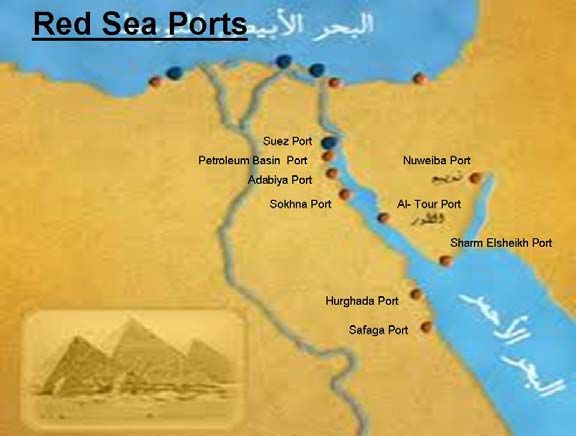
There are 25,000-30,000 ship transits annually of the Red Sea (Figure 2). Oil tankers and other
ships constitute another significant source of oil pollution and the southern entrance to the Gulf
of Suez (GIWA 2006).

 Figure 2. Oil transport pathways/source ports including the Red Sea area (source: IMO website).

2. SHIPPING

       2.1 The role of shipping in the national economy
There are several variables which affect the cost of maritime transport and related logistics
including geography, directional imbalance in trade between countries, port infrastructure and
port services. While there are some variables which cannot be easily influenced, such as
geography, others can be positively affected by improving both the institutional infrastructure
and the policy framework.

Maritime transport and related logistics services play an important role in Egypt’s economy and
international trade with Egypt’s maritime ports handling over 65 percent of exports (Al Tony,
2005). Recent efforts to upgrade and reform ports and port services have resulted in significant
improvements when compared to the past where the costs of handling a container in Alexandria
port were 30 percent higher than similar ports in the Mediterranean (World Bank, 1997).
Maritime services and related logistics are important to a large number of sectors in the economy because of their link to both exports and imports. Improving the efficiency of maritime transport and related logistics can have significant positive spillover effects on encouraging private investments, trade flows, and subsequently enhancing production and job creation in almost every sector in the economy, reducing costs of imports for producers and consumers, and increasing government revenue from port services. Maritime service is important to the Egyptian economy which contribute to more than 48 percent of GDP and 51 percent of jobs. The maritime sector and related logistics services together with other production services constitute 36 percent of GDP and 16 percent of jobs in the economy. Egypt enjoys a revealed comparative advantage in a number of services including transport, travel, communications and construction. In fact, exports of services have contributed significantly to the surplus achieved in the current account and have overcome the chronic deficit in the merchandise trade balance. In other words, enhancing maritime services and related logistics, among other services, can play an important role in achieving Egypt’s national policy objectives, which are mainly focused on promotion of non-oil exports, attraction of foreign direct investment and job creation. Efficient maritime services and related logistics can help Egypt to achieve such goals both directly and indirectly through their direct links to the rest of the economy. There is increased attention given by the government of Egypt to this sector (captured by the increased amount of public investment allocated to the maritime sector). The number of containers handled by Egyptian ports has increased by more than 56 percent between 1995 and 2003, and the number of vessels calling into Egyptian ports increased by 35 percent within the same period. Moreover, Egypt has remained among the 20 largest developing countries in terms of container traffic. On the negative side, the study points out that the Egyptian fleet has decreased from 141 vessels in 1999 to 71 vessels in 2005 and that the existing fleet has aged (Figure 3). Moreover, there is a high degree of concentration among the shipping lines visiting Egyptian ports (Ghoneim and Helmy, 2007). Figure 3. Share of Egyptian Ports in Total Local and Transit cargo in 2005 % In 2005/2006, services constituted 48 percent of GDP in Egypt, out of which 20 percent were provided solely by the government5 and 28 percent were jointly provided by the government and the private sector. The employment share of services reached 51 percent in 2004/2005 with government employees representing more than half of this percentage (Ministry of Economic Development, 2007a). Maritime transport and other production services6 contributed nearly 32 percent to value added in 2005/2006 and more than 16 percent to employment in 2004/2005 (Figure 4).
Figure 4. Share of transport sector, including maritime, in Egypt,s production services

       2.1.2 Registered shipping companies

Egypt is a flag state country. The registered shipping companies are provided in Annex 1.
        2.1.3 Number and types of vessels registered

The number and types of vessels registered are 140 Vessels of which 123 are operational and 17
are out of service (Table 1).

   Table 1. Types, number and conditions of registered vessels (source: Red Sea Port Authority)

                   Types                       All          Operational     Out of service
                 Tug boats                      52              46                6
                Water tankers                   2               2                 -
                  Trawlers                       6               6                -
                General cargo                    5               3                2
                  Dredgers                      2               2                 -
                 Oil tankers                     8               5                3
                   Others                       65              59                6
                    Total                      140             123               17

           2.1.4 Shipyards
Shipyards are aas follows: Suez Shipyard, PortTawfiq shipyard, Port Said shipyard (Portsaidia),
Fisheries dry-dock at Suez, Hurghada slipway (small boats), Safaga shipyard (synchro-lift) army
forces, Sharm El sheikh slipway) small boats).
           2.1.5 The number of people employed in the sector

The number of people employed in the sector is about 4000 (2000 Temporary employment, 2000
Permanent workers).
2.2 Ports and harbours (Source: Red Sea Ports Authority)
Egypt issued Law No. 1 of 1996 on the specialized ports and issued a decision of the Minister of
Transport No. 81 of 1999 and the issuance of the Special Regulations for the Law of specialized
ports. It is intended specialized ports (and that of the 35 port) that the construction built on the
Egyptian coasts or in the Special Economic Zone Arab Republic of Egypt to receive the fishing
vessels or oil tankers or mining materials or tourist yachts in ports of a special nature, taken in
the rule of specialized ports Platforms marine and coral specialist within the boundaries of public
port. The Red Sea Ports and harbors operate under the above regulations.
In the Red Sea of Egypt, the capacity of ports is as follows:
• 4.5 million tons of general cargo
• 6 million tones of dry bulk goods
• 8.5 million tones of liquid bulk cargoes
• 3.4 million passengers / tourists
• 100 thousand containers
The total number of berths 41 different ports ,the berth Jetty 5 (oil) and the total lengths of the
various ports of berth 9063 meters deep linear gradient from 5:17 m. Figure 5 shows the
locations of major ports and harbors along the Red Sea of Egypt.
Figure 5 a. Location of major ports and harbours along the Red Sea of Egypt
(source: Red Sea Ports Authority)Figure 5 b .Ports in the Gulf of Suez (source: EEAA/JICA, 2009)
2.2.1 Major Ports, harbors and marinas along the the Red Sea, Gulf of Suez and Aqaba costs:
2.2.1.1 Suez port (PortTawfiq) (Figure 6)
Location: Located on the northern side of the Gulf of Suez at the southern entrance to the Suez Canal.
Activity: general cargo / passenger / tourism.
Boundaries: from the southern entrance of the Suez Canal in the north, to an imaginary line
Sadat Ras Masalla in the south.
Total area: 162.40 km2 (portawfiq, adabia, petroleum basin)
Land area: 2.30 km2
Maximum capacity of cargo: 3.50 million tonnes
Number of berths: 12
Length of berths: 2070 m
Depth of berths: 8 mSquares and stores area: 18615 m2
2.2.1.2 Adabiya Port (Figure 7)
Location: Located on the western coast of the Gulf of Suez at a distance of 16 km from Suez.
Activity: general cargo / Dry Bulk / Liquid Bulk
Land area: 0.85 km2
Maximum capacity of cargo: 6.75 million tonnes
Number of berths: 9
Length of berths: 1840 m
Depth of berths: 12 m
2.2.1.3 Petroleum Basin Port (figure 8)Location: Located in the western part of the port of Suez.
Activity: Pour liquid / receive crude oil and gas.
Land area: 1.16 km2
Maximum capacity of cargo: 4.14 million tonnes
Number of berths: 7
Length of berths: 828 m
Depth of berths: 9 m
Zatyat Port (Petroleum Port)
Zatyat Port is known as the Petroleum Basin. The harbor consists of five concreted platforms extending
for the oil tankers with 18,000 tons capacity. The platforms are equipped with pipe lines to receive and
handle all oil product vessels with about 5 m in depth. The total length of platforms is about 510 m. In
addition to that a deep platform (about 11m) is placed outside the harbor to receive oil tankers with
40,000 tons capacity. The maximum length of oil tankers that enter the harbor is 169 m and the maximum
depth of oil tankers is 8 m. The port lies to the west from Tawfik Port. The average number of ships
entering the port is 120 annually. The average quantity of petroleum that the port receives annually is
approximately 1,000,000 tons (EEAA/JAICA, 2009).
2.2.1.4 Sokhna Port
Figure 9. Sokhna Port
Location: Located on the western coast of the Gulf of Suez, at a distance of 43 km south of Suez.
Activity: container / general cargo / Dry Bulk / Liquid Bulk
Total area: 87.80 km2
Land area: 22.30 km2
Maximum capacity of cargo: 6.00 million tonnes
Maximum capacity of containers: 00.45 million containers
Number of berths: 6
Length of berths: 2000 m
Depth of berths: 17.05 mSquares and stores area: 11140 m2
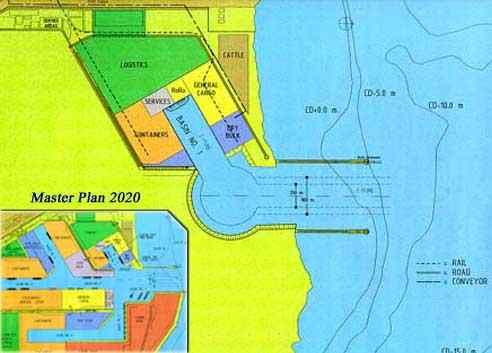
Sokhna 2020 (source: Ministry of Transportation)
2020 Year Master plan Development of Sokhna Port and Logistic Center
Ain Sokhna , located about 40 km south of Suez on the Red Sea , the Egyptian
government has allocated 9,000 hectares of land for economic and industrial development.
This area is referred to as the Suez Special Economic Zone (S.S.E.Z.). In the direct vicinity of
this industrial development, the Sokhna port and logistic center is under development, offering
excellent deep – sea port facilities for the handling of liquids and bulk cargo, containers, break–
bulk and general cargoes.
The port is built at an excellent location on the coast of the gulf of Suez, with Cairo located some
130 km to the west. The new port will provide the necessary interface for import and export
cargo flows, serving the Suez Special Economic Zone as well as the Red Sea area and the
Greater Cairo Region.
Operations in the port started in 2002. To be able to met the cargo handling
demands in the future , a Masterplan has been developed that shows the
development of the Sokhna port up to 2020.
Figure 10. Sokhna Port (Master Plan 2020)
2.2.1.5 Hurghada Port (Figure 11)Location: Located on the western coast of the Red Sea at a distance of 370 km south of Suez.
Activity: Passenger / Tourism
Total area: 9.90 km2
Land area: 0 .02 km2
Number of berths: 3
Length of berths: 240 m
Depth of berths: 5 m
2.2.1.6 Safaga Port (Figure 12)
Location: Located on the western coast of the Red Sea at a distance of 60 km south of
Hurghada.
Activity: general cargo / Dry bulk / passenger / tourism.Total area: 57 km2
Land area: 00.48 km2
Maximum capacity of cargo: 6.25 million tonnes
Number of berths: 3
Length of berths: 730 m
Squares and stores area: 33940 m2
2.2.1.7 Al-Tour Port
Location: Located on the eastern coast of the Gulf of Suez at a distance of 280 km south of Suez.
Activity: Services of petroleum.
Total area: 1.65 km2
Land area: 0.43 km2
Maximum capacity of cargo: 0.38 million tonnes
Number of berth: 1
Length of berth: 75 m
Depth of berth: 5 m
Squares and stores area: 385600 m2
2.2.1.8 Nuweiba Port (Figure 13)
Location: Located on the western coast of the Gulf of Aqaba at a distance of 64 km south of Taba.
Activity: Passenger / Tourism.
Total area: 9.87 km2
Land area: 0.34 km2
Maximum capacity of cargo: 0.25 million tonnes
Number of berths: 4
Length of berths: 380 m
Depth of berths: 8 m
Squares and stores area: 22720 m2
2.2.1.9 Sharm El Sheikh Port (Figure 14)Location: Located in the far south of the Sinai Peninsula at the confluence of Alois and Gulf of Aqaba.
Activity: passenger / tourism.
Total area: 88.28 km2
Land area: 0.16 km2
Number of berths: 1
Length of berths: 625 m
Depth of berths: 8 m
Squares and stores area: 48000 m2
2.2.1.10 Specialized Ports
SUMED Port
SUMED Port lies approximately 55 km south of the Suez City and is made of numbers of
moorings where oil pipelines can be attached to. The harbor receives oil takers where their
loaded oil is pumped through pipelines on land to Sidy-Krair in Alexandria City, and the
numbers of oil tankers are approximately 3,000 annually. Some 117 million tons of oil and
petroleum products are transported annually.
SUMED Pipeline (source: EEAA/JICA, 2009) (Figure 15)A further factor adding to the importance of the Red Sea and Gulf of Aden route is oil movement
across the Gulf of Suez via the 200 miles SUMED (Suez to the Mediterranean) Pipeline
complex. This pipeline allows ships that are too large to transit the Canal to discharge their cargo
at Ain Sukhna, south of Suez, at the oil terminal built for this purpose. The SUMED pipeline
runs from Ain Sukhna to Sidi Kerir on the Mediterranean coast of Egypt, west of Alexandria.
Loaded tankers can call at the Ain Sukhna Oil Terminal to discharge their cargo to shore and
return southwards in ballast to reload, generally in Red Sea or Gulf ports. Very large tankers also
have the option of partially discharging at Ain Sukhna in order to reduce their draughts and then
transiting the Canal part-loaded their cargo to shore and return southwards in ballast to reload,
generally in Red Sea or Gulf ports. The SUMED's original capacity was 1.6million bbl/d, but
with completion of additional pumping stations, capacity has increased to 3.1million bbl/d.
The region has some oil shipping terminal used by oil companies to transfer their production to
its final destination. Namely, Gabal El Zeit, El Zeit East, Mersa Badran, Ras Shukheir, Wadi
Feiran(Abu Redeis-El Nazazat), Ras Sudr Sadat and Ras Ghareb.
• Ras Sidr
• Ras Shukheir
• Ras Gharib
• Marina Sadat
• Offshore Oil Port Mount
• Port Marina Badran
• East Port offshore oil
• Wadi Ferran
Mining Ports
• Abu Zenima
• Abu branches
• Hamrawein
• Maritime pavement (stone head)
• short
• Bernice
• pavement Orientals (McDermott)
• Safaga Mining Port (Abu Tartour)
• Safaga Mining Port (Egyptian)
Tourism Ports/Marinas
• El Gouna
• Hurghada
• Port Ghalib
• Marina Taba
• Marina Dome Valley
Tourism Ports under construction
: • Porto Sokhna
• Marsa Alam
• The Egyptian Company for tourism products (draft Serena Tourism) Sahl Hasheesh
• Red Sea Sharm for Tourism Development (the project of establishing a local yacht marina
beach Oriental Marsa Alam - Red Sea).Fishing Ports/ Marinas
• Attaka
Atakah Port (Fishing Harbor)
Atakah Port (called the fishing harbor) is managed by Public Fish stock Authority in the
*
Ministry of Agriculture. The number of platforms is 2 and the total length of platforms is
456 m to receive the fishing ships and boats. The average number of fishing ships is 447
annually, meanwhile the average number of boats is 495 annually.
• Al Tour • Marina Safaga
• Hurghada • Marina Shalateen
• Suez • Point El Salakhana
• Marina Oburmad • Point Srouh Dahab
• Marina Bernice Military
Types and frequency of vessels visiting Egypt’s Red Sea Ports
The following tables (2 – 4) present the types and frequency of vessels visiting Egypt”s Red Sea
Ports from 2008 to 2011.
Table 2. Number of frequented vessels calling on Red Sea Ports during the period from 1/7/2008
to 30/6/2009 (source: Red Sea Ports Authority)
Ports Suez,
Safaga,
Adabiya and Sharm
Sokhna Hamrawein Nuweiba Hurghada Total
Petroleum Elsheikh
and Quseir
Vessels Basin
General
537 701 10 0 0 0 1248
cargo
Containers 132 668 0 0 0 0 800
Dry Bulk
193 23 111 0 0 0 327
cargo
Liquid
311 0 1 0 0 0 312
Bulk
Vessels of a
special 109 2 1 0 0 0 112
nature
Passenger
16 0 1088 2971 0 604 4679
ships
Tourist
51 54 237 0 1245 352 1939
ships
Total 1217 780 1448 2971 1245 956 8617
Table 3. Number of frequented vessels calling on Red Sea Ports during the period from 1/7/2009
to 30/6/2010 (source: Red Sea Ports Authority)Ports Suez, Adabiya Safaga,
Sharm
and Petroleum Sokhna Hamrawein Nuweiba Hurghada Total
Elsheikh
Vessels Basin and Quseir
General cargo 570 724 5 0 0 0 1299
Containers 115 686 0 0 0 0 800
Dry Bulk
182 38 113 0 0 0 333
cargo
Liquid Bulk 296 0 6 0 0 0 302
Vessels of a
158 4 4 0 0 0 166
special nature
Passenger
16 0 1334 2486 0 412 4248
ships
Tourist ships 51 76 242 0 1569 419 2357
Total 1273 842 1704 2486 1569 831 8705
Table 4. Number of frequented vessels calling on Red Sea Ports during the period from 1/7/2010
to 30/6/2011 (source: Red Sea Ports Authority)
Ports Suez, Adabiya
Safaga,
and Sharm
Sokhna Hamrawein Nuweiba Hurghada Total
Petroleum Elsheikh
and Quseir
Vessels Basin
General
554 678 5 0 0 0 1237
cargo
Dry Bulk
140 40 167 0 0 0 347
cargo
Liquid Bulk 262 0 7 0 0 0 269
Vessels of a
special 181 3 10 0 0 0 194
nature
Passenger
20 0 1165 2654 0 385 4224
ships
Tourist ships 7 130 231 0 1942 231 2407
Total 8678
2.4 The annual volumes of traded goods – imports and exports – passing through each port
The annual volumes of traded goods (in tones) - imports and exports – passing through each of
Egypt’s Red Sea Port from 2009 to 2011 are shown in tables 5 and 6Table 5. The annual volumes of traded goods- imports and exports – passing through Egypt’s Red
Sea Ports (tonnes) during the period from 1/7/2009 to 30/6/2010 (source: Red Sea Ports Authority)
Suez, Adabiya Safaga,
and Petroleum Sokhna Hamrawein and Nuweiba
Goods
Basin Quseir
Import Export Import Export import Export Import Export
General cargo 1088562 1181225 3396511 2183688 14186 69827 211506 456923
Dry Bulk cargo 1045889 1275803 470643 1267371 1315701 1585606 20125 21787
Liquid Bulk cargo 1972949 1299 0 0 4842 0 31 251
Cargo of a special
265416 28870 11886 5926 3551 0 7220 11377
nature
Total 4372816 2487197 3879040 3456985 1338280 1655433 238882 490338
Table 6. The annual volumes of traded goods- imports and exports – passing through Egypt’s Red
Sea Ports (tonnes) during the period from 1/7/2010 to 30/6/2011 (source: Red Sea Ports Authority)
Suez, Adabiya Safaga,
and Petroleum Sokhna Hamrawein Nuweiba
Basin and Quseir
Goods
Import Export Import Export Import Export Import Eport
General cargo 1072828 1607784 3219716 1981973 11448 89165 246438 531078
Dry Bulk cargo 771389 706710 387700 609595 1473393 2781614 26060 24881
Liquid Bulk cargo 2081393 29747 0 0 9928 0 48 56
Cargo of a special
235033 150995 16693 0 8224 0 11688 12512
nature
2.5 The Suez Canal
In addition to the Red Sea harbors and ports, the Suez Canal plays a major role in the maritime
industry in Egypt.
The Suez Canal is an artificial waterway in Egypt, connecting the Mediterranean Sea to Gulf of
Suez, and then to the Red Sea. The canal is 163 km long, and its width varies, and 60 meters at
its narrowest ends. Along most of the length, there is only one lane for traffic available, though
there are a handful of passing bays.
The canal is extensively used by modern ships, as it is the fastest crossing from the Atlantic
Ocean to the Indian Ocean. Fees paid by the vessels represent an important source of income for
the Egyptian government.
The total tonnage of ships transiting the canal is now rising due to world trade increases and the
average size of ships using the canal is also rising. This is urged by the increase size of containerships employed in world trade and by the greater capacity of the Canal to handle larger vessels
(Table 7).
Table 7. Total Suez Canal crossing vessels, net tonnage, containers and total cargo (2001 – 2008)
(source: Ministry of transport)
2.6. Situation of oil pollution in coastal waters (source EEAA/JICA, 2009)
2.6.1 Sources and Generation of Oil Pollution
Land-Based Pollution Sources - Port related Oil Facilities
The Suez region accommodates a number of ports for various purposes along the
western coast of the Gulf of Suez as shown in Figure 5 b, along with other possible sources as
oil fields, terminals and pipelines (Figure 16). Therefore, many numbers of possible sources of
oil pollution exist, like oil loading/unloading facilities, oil pipelines and storage facilities.
2.6.2 Oil Spill Incidents
According to EEAA/JICA (2009), the numbers of oil spill incidents recorded in the Gulf Region
is a total of 122 between 1998 and 2005, ranging from a very small spill to a large scale spill. As
seen from these records, on average some 15 oil spill incidents are likely to happen annually in
the Suez Canal and the Gulf of Suez.Figure 16 .Location of oil fields and pipelines in the northern Red Sea of Egypt (source:
EEAA/JICA, 2009)
Several oil spill incidents affected the northern Red Sea area, 51incidents were recorded only in
2005 (Figure 17).
Figure 17. Oil spill incidents in the northern Red Sea (source: EEAA/JICA, 2009)It is not certain whether a sharp increasing tendency is true phenomena, or, whether it is
depending on the procedure of data collection of oil spill incidents.
2.6.3. Spots of Frequent Oil Spill Incidents
Of 122 oil spill incidents, 85 incidents spots have been identified. Figure 18 shows the zones
having suffered from oil spill incidents in the past. From this figure, the Gulf of Suez manifested
the highest possible oil spills on the whole area.
However, the following zones have suffered from frequent incidents:
· The zone including Abu Rudays of Ras Abu Sywayrah in the Governorate of South
Sinai and Ras Gharib and Ras Shuqeir in the Governorate of Red Sea. This zone incorporates
many oil fields and associated pipelines at the seabed and on land, and
· The zone including Suez City and Ayn Sukhnan near the entrance of Suez Canal in the Governorate
of Suez. Many ports facilities with oil loading/unloading are located in
this zone.
Figure 18. Location of oil spill incidents (source: EEAA/JICA, 2009)2.6.4 Sources of Spilled Oil
Of all the oil spill incidents, incidents in which spilled oil sources were not identified account for
48 %, as shown in Figure 19. This indicates that finding out the sources of spilled oil is very
difficult, resulting into the failure in identifying the sources of nearly half of the oil spill. This
clearly implies that secure identification system with analytical technologies for finding out
spilled oil sources is strongly needed in the region.
Among the sources of oil spills identified, movable sources like tankers and ships (cargo
vessels, passenger ships, fishing ships, etc.) account for 25 %, the largest percentage. Next, oil
spills caused by the breakdown or wrong operations in pipelines (especially seabed pipelines),
and loading (including unloading) facilities account for large parts with 19 % and 5 %,
respectively.
Figure 19. Sources of spilled oils (source: EEAA/JICA, 2009)
2.6.6 Actions Undertaken for Oil Spills
Actions undertaken to contain oil spills are not necessarily recorded for all the incidents.
As far as known from the limited records, removals by means of mechanical and manual
operation have been the most frequent methods, accounting for some 40 %, as shown in Figure
20. Despite some recognition of environmental concerns to the marine ecosystem, dispersants
have been used often to clean up oil slick, accounting for 26 %.
Figure 20. Actions taken for oil spills (source: EEAA/JICA, 2009)2.6.7 Oil Pollution in Coastal Waters
EEAA continuously monitors the water quality along coastal lines like the Mediterranean Sea
and the Red Sea in the Coastal Water Monitoring Program (CWMP). In CWMP, a total of 16
monitoring stations are located in the Gulf of Suez and the water quality measurements have
been carried out four times annually, on average. The CWMP have recorded the situation of oil
pollution, observing visually the pollution pattern by tar and oil at respective monitoring points.
By employing these results, pollution index of oils have been calculated. In the pollution index
of oil, the index “0” means no oil pollution to be observed and the index “15” means the utmost
polluted status.
As shown in Figure 21, Ras Gharib indicates the high oil pollution, where it has a higher
pollution index are largely consistent with the areas of oil field, and that the coastal waters at Ras
Gharib have chronically suffered from oil pollution.
2.7 Ballast water uptake and discharge
According to the Red Sea Ports Authority, vessels carrying bulk oil calling on Zaitia Port (only
segregated ballast tankers). After discharging their cargo, these vessels take additional weight on
board (ballast water) to adjust their stability and to enable it to operate effectively and safely by,
for example, keeping the ship deep enough in the water to ensure efficient propeller and rudder
operation.
From inspection, most of the vessels have BWM Plan, and perform exchange method:
sequential or flow through method.
Sources of registered ballast water uptake are : Alexandria , Aqaba, Jeddah, Sudan, Malaysia,
Indian ocean ,Yemen, Philippine ,Aden gulf , Rotterdam, Spain, Colombia , Atlantic Ocean,
Russia, U.K. , Mombasa & Black sea . The estimated volumes per m3 of ballast water being
discharged in the Red Sea major ports annually are presented in Table 8.
Figure 21. Situation of oil pollution in coastal waters (source: EEAA/JICA, 2009)Table 8. The estimated volume of ballast water being discharged in Red Sea ports annually (2009 –
2010) (source: Red Sea Ports Authority)
Ports 2009 (m3) 2010 (m3)
Suez, Adabiya and
5120239 4735219
Petroleum Basin ports
In Sokhna Port 3281665 3132015
Hurghada Port 4022143 3091090
Safaga, Hamrawein and
6092117 6338424
Quseir Ports
Nuweiba Port 12499779 9247255
Sharm Elsheikh Port 5238042 5836260
3. THE MARINE AND COASTAL ENVIRONMENT
3.1 Marine and coastal ecology
3.1.1. The Red Sea coastal area
The coastal plain of the Red Sea proper is narrow and lies between the high fringing mountains,
consisting mostly of crystalline rocks, and the sea. Along the shores there is an almost
continuous band of emergent reef terraces between 0.5 to 10 km wide. Between these and the
foot of the crystalline hills extends a sand gravel surface which is inclined towards the sea with
gradients that range from 1:80 to 1:200. The width of this plain ranges from less than one km to
over 20 km. This plain is covered mainly with Middle Miocene and later sediments (Said, 1969).
An escarpment is the northern limit of the Southern Galala Plateau is made of Eocene limestones
with Cretaceous rocks. To the S of this highly broken massif, the coastal plain becomes wider.
About 40 km south of Zaafarana the Red Sea hills begin to appear and the monotony of the plain
is broken further S by the appearance of the Gebel Zeit and Esh-Mellaha ridges which form
conspicuous topographical features between the coast of the Gulf of Suez and the main red Sea
hills. These ridges are seaparated by a plain which forms the southern extension of the main
coastal plain to the N (Said, 1969)
The Zeit range extends in the NW direction close to the seashore for about 30 km; its average
breadth is 5 -6 km. Its granitic core, rising in a series of irregular peaks to a height of over 400 m
above the sea, appears in two separate patches interrupted by a saddle of evaporate deposits which
divides the main Gebel Zeit in the north from the so-called Little Zeit range in the S. To the E, the
granitic ranges end abruptly in a line of high scarps over the waters of the Gulf; where patches of
dolimitic limestones and gypsum abutting at the sides of the granite. To the S and N the granite
disappear under a series of sedimentary rocks of Cretaceous and Miocene ages; which series
extends along the western side of the range in a parallel ridges of decreasing heights to the west.
The plain that separates the Zeit range from Esh-Mellaha range is about 15 – 20 km in breadth. It
is gravel-covered plain traversed by a few drainage lines which descend from Esh-Mellaha range
to the sea. Generally, the Red Sea geomorphological units are as follows (Figure
22;.GEF/TDA/EEAA/RSG, 1998):
The Coastal BeltThe coastal belt forms a continuous strip of low-lands bordering the Gulf Suez and Red Sea, at
altitudes rarely exceeding 200 m. The subsurface is generally comprised of mildly tectonized
strata (sandstones, marls and limestones) of mid-Tertiary age, which locally rise in low hills and
hummocks. Extensive gravel terraces and raised beaches of Pleistocene age cover this basement:
they slope gently seawards, where they generally terminate in a pronounced step.
Numerous flat-bottomed wash-filled wadis cut across these formations in a direction
perpendicular to the coast. The sea-shore forms a nearly continuous coralline beach. Rocky
shores are exceptional.
From Zafarana, to Safaga, the coastal belt overlies the large sedimentary structures and forms at
20 to 30 km wide plain, marked by the extrusion of elongated granitic ridges parallel to the
shore-line.
The Eastern Mountain Belt
The high and rugged Red Sea mountains do not form a continuous range, but rather a series of
mountain groups which are more or less coherently lined up parallel to the coast. These
mountains offer no easy communication between the Nile and the Red Sea.
The constituent rocks belong to the Pre-Cambrian complex of schists and gneiss, granites and
volcanics. The uplift of this block is recent and possibly still active. The mountains are therefore
in a stage of youthful erosion, indicated by an extremely dissected and rugged relief and a total
denudation of the rock.
Wadis run deeply in geometrically arranged narrow gorges incised along the faults and fractures,
showing everywhere evidence of current cutting. A shallow wash-fill occurs only in the major
collectors where it consists of a coarse arenaceous sand, or a pebbly pavement.
The Elevated Central Belt
The western side of the Pre-Cambrian block exhibits a comparative maturity. The rock often
shows a degree of granular decomposition and even, in places, of arenaceous accumulation.
The wadis forming a dentritic pattern, are less deeply incised and are sometimes ill-defined.
Extensive alluvial sand covers, reaching at times the dimensions of an internal plain, accompany
the main collectors.
The Dissected Table-Land
The virtually flat-bedded Nubian Sandstones and associated younger formations of the Upper
Cretaceous give rise to a highly distinctive morphology, marked by a series of structurally
controlled scarps, tables and mesas.
The Nubian Sandstone outcrops themselves are generally depressed at altitudes of about 200
meters. They are traversed by some major wadis which have developed immense alluvial plains.
Thick pebbly terraces of the Pleistocene flank the sides of these valleys.
The Limestone Table-Land
The undistributed Eocene limestones give rise to flat-topped plateau which boldly dominate the
surrounding relief, at altitudes of 400 to 500 meters.
Short wadis cut deeply across the bordering cliffs in narrow gorges. With the exception of some
dune massifs, their surface is formed of bare limestone and chalk rocks, with a karstic
morphology.Figure 22. General geomorphologic map of the Red Sea, Egypt
3.1.2 Oceanographic conditions
The oceanographic characteristic of the Red Sea is influenced by its structure. In cross section,
the Red Sea is V shaped with average depth of 524m., and a maximum depth of 3039m.
Meanwhile the depth in Bab El Mandeb that connects the Red Sea with the Indian Ocean is only
100m., and hence, the Red Sea basin is partially isolated from the Indian Ocean.
The Northern part of the Red Sea is located between two arid regions, the Eastern Egyptian
desert (W) and the Saudi Arabian (E). A daily alternation between the day time sea breeze and
the nocturnal land breeze in the Northern part of the Red Sea is due to the large variation in local
heating.
Oceanograhic conditions are largely based on the findings of the EEAA/JAICA (2009)
Tides
The physiographic configurations of the Red Sea, and the Gulf are long, narrow and an
almost closed embankment, dictate the nature of the tides. Tides are semi-diurnal and their
characteristics differ in the two Gulfs. In the Gulf of Suez, a nodal point occurs near El-Tur
about 180 km north of the southernmost limit of the Gulf. The tidal range in the Gulf of Suez,
near its northern limit, is about 2 m, decreasing southward to 0 m at El-Tur and increasing again
up to about 60 cm near Ras Mohammed. The tidal range in the Gulf of Aqaba is about 70 cm at
Taba and 90 cm near Sharm El-Sheikh. No nodal point exists along the Gulf of Aqaba.Water Movement and Currents
The fundamental movements of surface water follow the winds, so that the northerly wind of
summer drives surface water south for about four months at a velocity of 12 to 50 cm/sec, while
in winter, the flow is reversed, pushing water into the northern Red Sea from the southern part;
the net value of the latter movement is greater than the summer current to the north, and the drift
continues to the northern end of the Gulf of Suez. The main surface drifts are slow moving and
are easily modified and even reversed by local effects and by small tides.
Although south-flowing currents, generated by the prevailing northern winds, exert a major force
that affects the sea marginal depositional environments, other northward-moving currents in the
southern parts of both gulfs counteract this influence. These
northward-flowing currents include currents resulting from salinity differences. A warm less
saline surface water current flows into the gulfs from the Red Sea replacing waters lost by
evaporation and lost by an out flowing deeper density current of more saline cooler waters.
Stormy winds from the south at the tip of the Sinai Peninsula drive currents northward in
both gulfs.
The common storms in the Gulf of Aqaba accompanied by winds of up to 45 to 80 knots
provide considerable bursts of energy to these currents. Because some of the high winds are
southerly, especially in winter, one can expect to find the normal long shore current's flow to be
temporarily reversed. Currents in the southern part of the gulf are most affected by strong
southerly winds. Oceanic currents in the Indian Ocean change the level of the Red Sea and the
gulfs seasonally. The effects in both gulfs are sea levels that are about 30 cm higher in winter
than in summer.
Water Temperature
The water temperature is lower in the northern parts than in the southern part of the Red Sea.
Sometimes, sudden changes of temperature occur from one area to another, especially in the
central part of the area. This change may reflect the natural barriers that prevent free mixing of
waters in the area and thus inhabiting regular changes. The Gulf of Suez water affects the
northern and western side of the Red Sea down to 200 m in depth. Surface temperature declines
slightly towards the entrance of the gulfs, owing to the influx of cooler water from the Gulf of
Aqaba, and there is also a gradual decrease of temperature in the northerly direction. The mean
annual maximum and minimum water temperatures of the coast of the Gulf of Aqaba are higher
than those of the Gulf of Suez.
In Sharm El-Sheikh area the surface water temperature in summer (June 1996) showed a
variation from 25.5 to 27.3o C, with an average of 26.1 o C. In winter (February 1997) the
temperature were lower than that of summer showing less variability at the surface, ranging from
22.6 to 23.2 o C, with an average of 22.9 o C.
Salinity
The salinity gradient in the Gulf of Suez is greater than the values recorded for the Red Sea or
Gulf of Aqaba. Salinity show limited variation in spite of the presence of desalination plants in
Naama and Sharm El-Maya Bays, but it appears to be with negligible effect. In Port Bay, the
salinity distribution showed an increase in the North West direction indicating the effect of land
drainage resulting from human activities in this area. There is considerable evidence that, ingiven latitude, salinities are higher on the western side than in the east so that isohalines are
aligned generally from north-north east to south-southwest. The difference between the two sides
in the same latitude sometimes amounts to as much as 1 %.
The inflow current from the Red Sea at the surface is a less saline, whereas the more saline
(denser) waters, resulting from the large evaporation precipitation ratio, sinks and forms a
counter flow to the south. A sill at the Strait of Tiran (depth 252 m) separates the Gulf of Aqaba
from the Red Sea and restricts deep circulation. The salinity increases from south to north in the
Gulf of Aqaba. Low winter and high summer values of salinity are observed.
Dissolved Oxygen
The measured dissolved oxygen concentration in the surface water of the Red Sea is near to
saturation values. The saturation values are in the range of 4.8 to 6.5 ml of oxygen per liter
depending on temperature and salinity values. The saturated layer in the Red Sea extends to
about 100 m depth. Below 100 m in the Red Sea, the dissolved oxygen concentration values drop
to only 10 to 25 % of the saturation values. The Gulf of Suez resembles the Gulf of Aden in
many others of its characteristics, and has no oxygen minimum, while in the Gulf of Aqaba,
there is a gradual decline with depth but never to lower than about 50 % saturation. The
dissolved oxygen in the water of Sharm El-Shiekh area showed more or less homogeneous
distribution. However, the oxygen content at 100 m layer was significantly lower in spring, yet
still indicating a well oxygenated condition (5.3 mg/l).
Horizontal distribution of dissolved oxygen concentrations in summer at the surface of the
lagoons in Sharm El-Sheikh showed values ranging from 4.3 to 4.8 mg/l and from 96 % to 108
% saturation. In winter, oxygen distribution showed higher values (5.3 to 5.7 mg/l) than that of
summer, which may be attributed to lower temperatures. Super-saturation of oxygen values is
shown in Sharm El-Maya Bay in summer due to photosynthetic activity.
pH Values
The distribution of pH values at the surface water in summer showed values ranging from 8.3 to
8.4 reflecting low variation. In winter, pH values were lower than that recorded in summer with a
variation range of 8.0 to 8.2. The observed higher pH values at surface water in summer could be
attributed to the photosynthetic activity due to higher temperature and long light span.
Eutrophication
Most of the Red Sea water has been considered oligotrophic with the exception of small
areas off the Sinai Peninsula. The upper waters of the Red Sea are nutrient-poor, with
nitrate being depleted more than phosphate. High levels of nitrite and ammonia have been
recorded in the upper waters, which can be considered as an indicator of high bacterial activity.
Seasonal variations occur in dissolved nutrient concentrations near shore and that local
eutrophication is resulting from anthropogenic inputs. Water in the Gulf of Aqaba and Gulf of
Suez is poor in nutrients compared with the Indian Ocean.
3.1.3 Habitats and Biological Communities
The Red Sea's ecosystems (includes habitats and species) are highly productive and generate an
array of marine and coastal renewable resources. Hence they function as 'coastal food factories'.It is highly significant that most of the Egyptian Red Sea's productivity is confined to a narrow
coastal strip. However, this coastal strip is also the area associated with greatest human activity
and hence environmental pressures (Galal, 2003).
In the Red Sea coast, wetlands include the extensive coastal plain areas with mangroves and
other coastal vegetation, intertidal flats and many shallow water enclosed habitat. Coastal
vegetation is considered as an important ecological component of the Red Sea. This vegetation
includes:
1. Date palms, reed swamps and other freshwater-dependent vegetation;
2. Salt-tolerant vegetation (halophytes);
3. Mangroves.
These ecosystems stabilize the shorelines and help prevent erosion.
The Red Sea contains representatives of all major tropical marine communities except estuaries,
which cannot be formed due to lack of permanent fresh water source (Galal, 2003).
Halophyte ecosystems
Vegetation of the salt-marsh ecosystem generally occurs in zones parallel the shoreline. Salt
marshes are commonly found in low lying inshore areas, where the salt water is close to the
surface. This community is dominated by three or four plant species (e.g. Halocnemon
strabilaceum, Zygophyllum album, Z. simplex and Zilla spiuosa) (GEF/TDA/EEAA/RSG, 1997).
Mangrove ecosystems
Of the four mangrove species known for the Arabian region, Avicennia marina is by far the
common. Mangrove stands in Egypt are, in general, relatively small (Figure 22). They are
dispersed along the Egyptian Red Sea coastline in sheltered bays and lagoons protected behind
coral reefs. The mangrove stands along the Gulf of Aqaba and the Egyptian Red Sea coastlines
cover a total area exceeding 550 hectares. They are predominantly mono-specific, consisting
only of Avicennia marina, except for a few stands in the southern Sudanese border area where
Rhizophora mucronata coexists along with Avicennia marina. From a geographical point of
view, the Egyptian mangroves may be divided into the Sinai mangroves, and mangroves growing
on the Egyptian-African Red Sea coast (PERSGA/GEF, 2004).
The Sinai mangrove thickets are found only on the south-eastern tip of the Sinai Peninsula. They
consist of five stands. One of these includes a small group of Avicennia trees growing along a
channel that cuts across Ras Mohammed at the southern extension of the peninsula. The other
four stands are denser and are found along a 20km stretch of coast on the alluvial fan of Wadi
Kid, to the north of Nabq Oasis.
In Hurghada area, the northern most stands along the coast of the Egyptian Red Sea is at El-
Gonah, located 25 km north of Hurghada. This stand is a cluster of scattered trees parallel to the
shoreline. It is considered the most severely damaged of all stands on the whole coast due to
extensive cutting. This same geographical area also contains the mangrove stand on Abu Monkar
Island, which covers about 40% of the island area (Figure 23).You can also read