Mississippi Section of the American Society of Civil Engineers - INFRASTRUCTUREREPORTCARD.ORG/MISSISSIPPI - THINK IT. GROW IT. INVEST IN IT ...
←
→
Page content transcription
If your browser does not render page correctly, please read the page content below
REPORT CARD FOR
2020
                                    THINK IT. GROW IT. INVEST IN IT.
                                    THAT’S THE MISSISSIPPI WAY.
            INFRASTRUCTURE          Let’s invest in Mississippi’s infrastructure now.

  Mississippi Section of the American Society of Civil Engineers
  INFRASTRUCTUREREPORTCARD.ORG/MISSISSIPPI
AVIATION BRIDGES DAMS DRINKING WATER ENERGY W
 EVEES RAIL ROADS RAIL SOLID WASTE PORTS WASTEW
 RIDGES DAMS DRINKING WATER ENERGY WASTE LEVE
ROADS RAIL SOLID WASTE PORTS WASTEWATER AVIATI
DAMS DRINKING WATER ENERGY WASTE LEVEES LEVEE
RAIL PORTS WASTEWATER AVIATION BRIDGES DAMS D
WATER ENERGY WASTE LEVEES LEVEES RAIL ROADS R
WASTE PORTS WASTEWATER AVIATION DAMS DRINKIN
 NERGY WASTE LEVEES LEVEES RAIL ROADS RAIL SOL
 ORTS WASTEWATER AVIATION BRIDGES DAMS DRINK
 NERGY WASTE LEVEES LEVEES RAIL ROADS RAIL SOL
 ORTS WASTEWATER AVIATION BRIDGES DAMS DRINK
 NERGY WASTE LEVEES LEVEES RAIL ROADS RAIL SOL
 ORTS WASTEWATER AVIATION BRIDGES DAMS DRINK
 NERGY WASTE LEVEES LEVEES RAIL ROADS RAIL SOL
 ORTS WASTEWATER AVIATION BRIDGES DAMS DRINK
 NERGY WASTE LEVEES LEVEES RAIL ROADS RAIL SOL
 ORTS WASTEWATER AVIATION BRIDGES DAMS DRINK
 NERGY WASTE LEVEES LEVEES RAIL ROADS RAIL SOL
 ORTS WASTEWATER AVIATION BRIDGES DAMS DRINK
WATER ENERGY WASTE LEVEES LEVEES RAIL ROADS R
 OLID WASTE PORTS WASTEWATER AVIATION BRIDGES
DRINKING WATER ENERGY WASTE LEVEES LEVEES RAIL
RAIL SOLID WASTE PORTS WASTEWATER AVIATION BRID
DAMS DRINKING WATER ENERGY WASTE LEVEES LEVEE
ROADS RAIL SOLID WASTE PORTS WASTEWATER AVIATI
 RIDGES DAMS DRINKING WATER ENERGY WASTE LEVE
 EVEES RAIL ROADS RAIL SOLID WASTE PORTS WASTEW
AVIATION BRIDGES DAMS DRINKING WATER ENERGY W
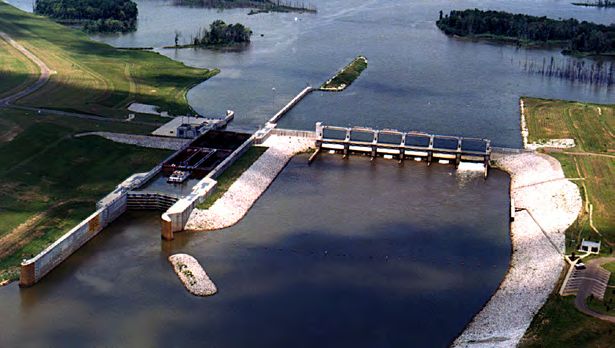
TABLE OF CONTENTS
   2020 MISSISSIPPI REPORT CARD COMMITTEE.......................................................................4

   EXECUTIVE SUMMARY........................................................................................................................5

          SOLUTIONS TO RAISE THE GRADE......................................................................................5

   2020 REPORT CARD FOR MISSISSIPPI’S INFRASTRUCTURE............................................6

   ABOUT THE INFRASTRUCTURE REPORT CARD..................................................................... 7

          GRADING CRITERIA.................................................................................................................... 7

          GRADING SCALE...........................................................................................................................8

   INFRASTRUCTURE GRADES BY CATEGORY.............................................................................9

          AVIATION..........................................................................................................................................9

          BRIDGES.......................................................................................................................................... 15

          DAMS............................................................................................................................................... 22

          DRINKING WATER.....................................................................................................................30

          ENERGY.......................................................................................................................................... 36

          INLAND WATERWAYS ............................................................................................................. 43

          LEVEES............................................................................................................................................48

          PORTS.............................................................................................................................................. 54

          RAIL................................................................................................................................................... 59

          ROADS............................................................................................................................................ 64

          SOLID WASTE.................................................................................................................................71

          WASTEWATER.............................................................................................................................. 78

                                                                                                              INFRASTRUCTUREREPORTCARD.ORG/MISSISSIPPI—3
REPORT CARD FOR
2020

                INFRASTRUCTURE

       2020 MISSISSIPPI INFRASTRUCTURE
       REPORT CARD COMMITTEE
   REPORT CARD CHAIRS:                                                                              ASCE STAFF CONTRIBUTION:
   Report Card Committee Chair – Jacob               Editing Chair – Grace McMahen Rushing          Grace Wiley
   Forrester                                         Student Support Chair – Dennis Truax           Christy Prouty
   Public Relations Chair – Sarah McEwen                                                            Anna Denecke
   Government Relations Chair – Jennifer Sloan
   Ziegler

   AUTHORS/CONTRIBUTORS:
   Aviation:                                         Energy                                         Rails
   Chair – Will Pentecost                            Chair – Edith Martinez-Guerra                  Chair - Isaac Howard
   Support Professional – Jim Hall                   AJ Elhaj                                       Graduate Student Support – Amanda Huff
   Will Thaggard                                     Will McCorkle                                  Josh Broadhead
   Dylan Elkins                                      Tyler Bowling                                  Alex Price
   Toler Presley                                     Adrian Sanchez                                 Kevin Henson
   Maggie Smith                                                                                     Blake Gibson
                                                     Inland Waterways
   Bridges:                                          Chair – Ned Mitchell                           Roads
   Chairs – Wayne Black and Seamus Freyne            Support Professional – Steve Puryear           Chair – Dan Eckenrode and John Hannon
   Joel Cummins                                      Caroline Cordell                               Graduate Student Support – Carl Pittman
   Blake Stacy                                       Callie Olszak                                  Brady Yarbrough
   Chancellor Strange                                Chase Dabbs                                    Cory Qualls
   Matthew Crittle                                   Taylor Buie                                    Cody A. Smith
   Garret Chapin                                                                                    Matthew Phillips
                                                     Levees
   Dams                                              Chair – Brian Deschamp                         Solid Waste
   Chair – Quincy Alexander                          Nicki Haines                                   Chair – Jennifer Sloan Ziegler
   Luke Baker                                        Jennifer Deignan                               Willie Thomas, Jr.
   William Head                                      Keifer Wolfe                                   Anthony Gibson
   Ben Spiller                                       Bryant Hensleigh                               John Bates
   Chereese Willingham                                                                              Ryan Moore
                                                     Ports
   Drinking Water                                    Chairs – Shawn Wozencraft and Jennifer Sloan   Wastewater
                                                     Ziegler                                        Chair – Mark Peterson
   Chair – Jacob Forrester
                                                     Eric Blackmon                                  Sarah McLellan
   James Steele
                                                     Chase Gibson                                   Brittni Cooper
   Quan Portis
                                                     Cole Carson                                    Lauren Smith
   Morgan Cowles
                                                     Ben Sellers                                    Claire Ray
   Jenna Lovorn

                                                 INFRASTRUCTUREREPORTCARD.ORG/MISSISSIPPI
                                                                   4
REPORT CARD FOR
2020

                 INFRASTRUCTURE

       EXECUTIVE SUMMARY
       Mississippi’s infrastructure systems play a critical role in the state’s economic prosperity and help preserve – and can enhance – the
       quality of life for all Mississippians. However, over the past 15 years, our infrastructure systems have faced numerous, unprecedent-
       ed challenges in the form of hurricanes, tornadoes, droughts, and floods. Yet, every time Mississippians are faced with a challenge,
       they rise to meet it. Our infrastructure systems have helped us meet these challenges; now it’s our time to help our infrastructure
       systems. To continue to raise, retain, and attract the best and brightest, Mississippi must invest in strategic infrastructure efforts.
       After all, we want Mississippi to continue its long-standing tradition of hospitality, good Lord willing, even if the creek does rise.

       This is why local engineers with the Mississippi Section of the American Society of Civil Engineers (ASCE) have conduct-
       ed an exhaustive evaluation of Mississippi’s infrastructure, based on publicly available data, reports, analyses, and conver-
       sations with state and local agencies. The 2020 Report Card for Mississippi’s Infrastructure was developed as a public service
       to citizens and policymakers to inform them of the infrastructure needs in 12 different categories in the state.

                 Mississippi’s ASCE report card committee of engineering experts assessed the overall GPA as a D+.

       The group found that when there is investment in Mississippi’s infrastructure, there are more jobs which means more eco-
       nomic growth. However, Mississippi faces challenges due to aging infrastructure, lack of routine maintenance, inconsistent
       data collection, and limited funding. These issues impact residents’ quality of life and pose threats to nearby businesses. Fortu-
       nately, though, Mississippi is seeing that where the private sector has made investments – in the energy grid and parts of the
       freight system like ports and rail – economically productive and community capacity building results can be seen.

       Given the analysis of this report, the committee makes the following recommendations to raise the grade:

         1. Ensure that infrastructure investment is strategically focused on efforts that maximize good-paying jobs, promote the
            state’s economic competitiveness, and enhance usability so that all Mississippians continue to proudly call our state home.

         2. Design, operate, maintain, and expand infrastructure in accordance with federal leadership by using consensus-based
            codes, specifications, and standards that reduce the potential loss of jobs, economic opportunity, and critical natural
            resources. Under President Trump’s Administration, FEMA and other federal agencies have begun to pivot toward
            mitigation measures to ensure better use of taxpayer dollars, which is a strategy Mississippi should also employ.

         3. Develop a comprehensive education campaign on the true costs and savings associated with investment in critical
            infrastructure and disseminate around the state through publicly accessible channels and platforms such as Mis-
            sissippi Public Broadcasting and social media forums.

         4. Establish a grant program for 21st century technical career training in the drinking water and wastewater sectors
            that retains Mississippi’s talent and mainstreams tools for data-driven decision-making, such as asset management
            software, life-cycle cost analysis, and affordable rate structuring.

         5. Mississippi’s highways and scenic back roads are the state’s critical arteries to our homes, businesses, and outdoor recreation,
            so users must contribute a fair share to aid in maintenance and fill the gap that isn’t covered by state spending.

                                             INFRASTRUCTUREREPORTCARD.ORG/MISSISSIPPI
                                                               5
REPORT CARD FOR
2020

          INFRASTRUCTURE

       2020 REPORT CARD FOR
       MISSISSIPPI’S INFRASTRUCTURE

            AVIATION                                       LEVEES

            BRIDGES                                         PORTS

            DAMS                                            RAIL

            DRINKING                                       ROADS
            WATER

            ENERGY                                         SOLID WASTE

            INLAND                                         WASTEWATER
            WATERWAYS

                        INFRASTRUCTUREREPORTCARD.ORG/MISSISSIPPI
                                          6
REPORT CARD FOR
2020

                  INFRASTRUCTURE

       ABOUT THE
       INFRASTRUCTURE
       REPORT CARD
       GRADING CRITERIA
       ASCE-MS’s 2020 Report Card Committee is a group of dedicated civil and
       environmental engineers from Mississippi, who volunteered their time to col-
       lect and analyze data, prepare, review, and revise each section, and develop
       the final Report Card. The committee worked with ASCE’s Committee on
       America’s Infrastructure and ASCE Infrastructure Initiative staff to provide
       Mississippi with a snapshot of the state of our infrastructure, as it relates to
       us at home, and on a national basis.

       The Report Card Sections are analyzed based on the following eight criteria:

       CAPACITY Does the infrastructure’s capacity meet cur-               PUBLIC SAFETY To what extent is the public’s safety
       rent and future demands?                                            jeopardized by the condition of the infrastructure and
                                                                           what could be the consequences of failure?
       CONDITION What is the infrastructure’s existing and
       near-future physical condition?                                     RESILIENCE What is the infrastructure system’s ca-
                                                                           pability to prevent or protect against significant multi-
       FUNDING What is the current level of funding from all
                                                                           hazard threats and incidents? How able is it to quickly
       levels of government for the infrastructure category as
                                                                           recover and reconstitute critical services with minimum
       compared to the estimated funding need?
                                                                           consequences for public safety and health, the economy,
       FUTURE NEED What is the cost to improve the infrastruc-             and national security?
       ture? Will future funding prospects address the need?
                                                                           INNOVATION What new and innovative techniques,
       OPERATION AND MAINTENANCE What is the                               materials, technologies, and delivery methods are being
       owners’ ability to operate and maintain the infrastruc-             implemented to improve the infrastructure?
       ture properly? Is the infrastructure in compliance with
       government regulations?

                                            INFRASTRUCTUREREPORTCARD.ORG/MISSISSIPPI
                                                              7
REPORT CARD FOR
2020

           INFRASTRUCTURE

       GRADING SCALE
           EXCEPTIONAL: FIT FOR THE FUTURE
           The infrastructure in the system or network is generally in excellent condition, typically new or recently rehabilitated, and
           meets capacity needs for the future. A few elements show signs of general deterioration that require attention. Facilities meet
           modern standards for functionality and are resilient to withstand most disasters and severe weather events.

           GOOD: ADEQUATE FOR NOW
           The infrastructure in the system or network is in good to excellent condition; some elements show signs of general deteriora-
           tion that require attention. A few elements exhibit significant deficiencies. Safe and reliable with minimal capacity issues and
           minimal risk.

           MEDIOCRE: REQUIRES ATTENTION
           The infrastructure in the system or network is in fair to good condition; it shows general signs of deterioration and requires
           attention. Some elements exhibit significant deficiencies in conditions and functionality, with increasing vulnerability to risk.

           POOR: AT RISK
           The infrastructure is in poor to fair condition and mostly below standard, with many elements approaching the end of their
           service life. A large portion of the system exhibits significant deterioration. Condition and capacity are of significant concern
           with strong risk of failure.

           FAILING/CRITICAL: UNFIT FOR PURPOSE

       F
           The infrastructure in the system is in unacceptable condition with widespread advanced signs of deterioration. Many of the
           components of the system exhibit signs of imminent failure.

                                       INFRASTRUCTUREREPORTCARD.ORG/MISSISSIPPI
                                                         8
AVIATION
BIG PASSENGER AIRPLANE TAKING OFF AND FLYING FROM AN AIRPORT.
SOURCE: BIGSTOCKPHOTO.COM

                                                                                 AVIATION
                                                                                 GRADE: C

                                                                EXECUTIVE SUMMARY
                                                                Mississippi’s aviation system is critical to the state’s economy; the industry employs over 20,000 people with a total payroll of $721
                                                                million and a total economic output of $2.5 billion. There are 73 public use airports in the National Plan of Integrated Airport Systems
                                                                (NPIAS), 68 of which are non-primary and five are primary. Of the five primary airports, two - Jackson and Gulfport - have performed
                                                                runway overlay projects over the last five years. Aviation infrastructure in Mississippi is heavily dependent on support from the federal
                                                                government. The state experienced a 34% decline in passengers from 2007 to 2017, which impacts the amount of funding for aviation
                                                                infrastructure the state receives from passengers and the federal government. As popular airports experience less demand, the life of
                                                                the existing infrastructure is extended which leaves no significant operation and maintenance (O&M) needs unmet. However, O&M
                                                                is not eligible for federal funding and, as a result, is deferred in more rural and low-income communities.

                                                                                                       INFRASTRUCTUREREPORTCARD.ORG/MISSISSIPPI
                                                                                                                         9
REPORT CARD FOR
2020

                   INFRASTRUCTURE

       INTRODUCTION
       Mississippi has 73 public-use airports within the National Plan of Integrated Airport Systems (NPIAS). There are eight commercial
       service airports in the state that accommodate nearly one million passengers annually, half of which are federally subsidized through
       the Essential Air Service (EAS) Program. These EAS airports include Greenville Mid-Delta, Hattiesburg-Laurel Regional, Key Field
       (Meridian), and Tupelo Regional. The largest airport in the state is Jackson–Medgar Wiley Evers International Airport and it is the only
       Small-Hub airport in the state. According to NPIAS, “hub” is a term used by Federal Aviation Authority (FAA) indicating the extent to
       which the airport is trafficked for commercial services. In 2018, the Jackson-Medgar Wiley Evers International Airport secured new low-
       cost carriers (Frontier, Sun Country, and Allegiant) which is helping the airport recover some of the leakage of passengers to New Orleans
       and Memphis. The remaining 68 airports are considered general aviation facilities, supporting localized air service rather than commercial
       needs. According to a 2014 Mississippi Department of Transportation (MDOT) Aeronautics Division report, Mississippi’s aviation system
       employs over 20,000 people with a total payroll of more than $720 million and an economic output of over $2.5 billion.

       CONDITION
       In Mississippi, there is currently no statewide database that contains information about the condition of the airports. In other states,
       however, the aviation division of transportation agencies have conducted statewide pavement condition index (PCI) surveys to quantify
       runway pavement of the airport system. This process standardizes the results across every airport and allows state and federal aviation
       officials to efficiently allocate funding to airports based on need and activity. While Jackson and Gulfport have recently received runway
       pavement rehabilitation projects, many other smaller airports are struggling to maintain their infrastructure due to inadequate funding.
       Lack of funding has led to pavement conditions deteriorating, navigation equipment outages, and outdated passenger and pilot facilities.

       CAPACITY
       The lack of low-cost carriers and direct routes to other areas of the country has resulted in a significant amount of passenger leakage to both
       New Orleans and Memphis, reducing enplanements. Figure 1 depicts NPIAS data for total enplaned passengers from 2001 to 2017 and
       illustrates an approximate 34% decline in passengers across the highest and lowest spread – from 1,320,096 in 2007 to 874,226 in 2017.
       While many commercial service airports and general aviation airports in the state have multiple runways, given the existing commercial traffic
       demand and the fact that none meet the current capacity requirements of 130,000 annual operations, the facilities have excess capacity.

                                                   FIGURE 1- HISTORICAL ENPLANEMENTS

                                                INFRASTRUCTUREREPORTCARD.ORG/MISSISSIPPI
                                                                  10
REPORT CARD FOR
2020
INFRASTRUCTURE
OPERATION & MAINTENANCE
All of Mississippi’s general aviation airports are inspected by MDOT which frequently notes maintenance items on the generalized
inspection reports, such as navigation equipment outages, runway light deficiencies, excessive grass or tree heights, or pavement
deterioration and debris on the airfield. The majority of the general aviation airports in Mississippi do not have full-time maintenance
staff, so the maintenance regimen is more reactive than proactive.
FUNDING AND FUTURE NEED
Mississippi airports’ operation and maintenance (O&M) costs remain challenging for the aviation industry in the state. Not all O&M
costs are eligible for federal funding through the FAA Airport Improvement Program (AIP) and specific state grant programs. Some
of these O&M costs can be offset by aeronautical revenues, but airports are generally not financially independent and rely on the
local government for support. Furthermore, airport infrastructure projects are generally funded through a mixture of local, state, and
federal funding streams and/or grants.
Local funds include bonds, loans, airport revenue from landing fees, fuel sales or hangar rent, or general city funds. The majority of
Mississippi airports are only guaranteed $150,000 per year in non-primary entitlement through the AIP if the airport has nine or
more aircraft stored at the airport. General aviation airports can save this money for a period of four years for a larger $600,000
project, but in many cases, that funding is still not enough to fund a major runway or taxiway rehabilitation. Airports are eligible to
compete for a larger amount of discretionary funds through the FAA AIP but must compete against other airports in the state and in
the southern region. If the AIP was not continued by the federal government, Mississippi would lose their primary funding source for
aviation improvement.
The Passenger Facility Charge (PFC) is an available source of income for commercial services airports. The PFC is regulated through
the FAA, but the authorized amount for Mississippi airports has been decreasing over the last few years as total enplaned passengers
have decreased as shown in Figure 1. This decrease is limiting the funding of airports in the state.
Considering funding from the state, until the most recent 2018 omnibus bill, the FAA AIP funding remained flat for the last 17 years.
This stagnation resulted in a backlog of needed but unfunded projects. The new supplemental discretionary funding announced in
the 2018 omnibus resulted in three projects in Mississippi being funded for a total amount of $18 million. Additionally, MDOT has
a multimodal grant program that provides the MS airport system with $3.4 million annually and generally funds revenue producing
projects such as terminals, hangars, fuel farms, or the local match required for a federal grant.
Overall, the current NPIAS five-year plan shows a demand of $350 million in capital improvements and large maintenance projects
needed for Mississippi’s airports. The NPIAS needs do not figure in normal O&M. Over the last five years, Mississippi airports have
received $35 million per year on average. However, the rising costs of construction has resulted in a greater dependence on state and
federal funding for needed projects, so if these cost and funding trends continue it will result in an estimated shortfall of $175 million
over the next five years.
INFRASTRUCTUREREPORTCARD.ORG/MISSISSIPPI
11REPORT CARD FOR
2020
INFRASTRUCTURE
PUBLIC SAFETY
The Safety and Standards Branch of the Southern Region Airports Division of the FAA is primarily responsible for ensuring the
safety and certifications, operations, and safe practices of airports in Mississippi. The FAA sets design standards to ensure safe aircraft
operations. The design standards include airfield geometry, pavement strength, wayfinding signage, lighting, navigational aids, stabilized
safety areas, and clear approaches. All airports that receive federal funds are required to meet standards as a condition of each grant.
Standards for Aircraft Rescue and Firefighting (ARFF) are also required to be followed at all commercial service airports.
Wildlife strikes are one of the most difficult aspects of Mississippi aviation safety to control. These strikes are a threat to human
safety. The FAA conducted a study to characterize reported strikes with civil aircraft in Mississippi from 1990 to 2010. This study
summarized 381 reported strikes (366 birds, 14 mammals, and 1 reptile) compromising over 42 species and show collisions between
wildlife and aircraft have been increasing. Airports in Mississippi are exposed to migratory birds traveling along the Mississippi and
Atlantic Flyways. Mississippi airports with the most reported strikes are among the state’s largest and busiest: Jackson-Medgar Wiley
Evers International (Jackson, MS), Gulfport Biloxi Regional (Biloxi, MS), and Golden Triangle Regional (Columbus, MS). Fortunately,
none of these strikes have caused major human injury or property loss in Mississippi. Each commercial service airport is required to
have a wildlife hazard management plan created by a certified airport wildlife biologist. Each plan is designed specifically for the airport
and the airports are required to employ mitigation approaches outlined in the plan.
INNOVATION
Mississippi is becoming more innovative in its aviation systems. The state is incrementally implementing satellite-based navigation systems
to help improve the process of tracking and planning air travel. Many general aviation airports now support RNAV GPS approaches. This
system is being adopted throughout the country and is changing the way air travel can be monitored. In addition to using new aviation
technology, Mississippi schools are supplying the industry with professionals. Delta State University in Cleveland, Mississippi offers a
Bachelor and Master of Commercial Aviation. Other institutions offer technology programs which include Unmanned Aviation Systems
(UAS) and aircraft maintenance. As UAS becomes more popular in the nation, rules and regulations must be established. Mississippi State
University is the state’s leading researcher on this issue and directs the FAA’s UAS Center of Excellence. This center is designed to safely
and efficiently integrate UAS regulations into the aviation system such as the Golden Triangle Regional Airport (Columbus) and Trent Lott
International Airport (Moss Point) which houses UAS production and testing facilities.
RESILIENCE
Mississippi’s commercial airports are required to conduct emergency preparedness training and have on-site fire and emergency
response units. However, Mississippi’s 68 general aviation airports depend largely on their local first responders to address emergency
needs. With additional funding, training, and planning Mississippi’s aviation industry, infrastructure, and assets could be leveraged to
comprehensively build the state’s resilience before, during, and after disasters.
For example, while southern Mississippi’s airports face the continued threat of hurricanes and tropical storms coming from the Gulf
of Mexico airports such as Jackson and Meridian are further inland and share their facilities with National Guard installations making
them the ideal locations for staging hurricane relief operations.
INFRASTRUCTUREREPORTCARD.ORG/MISSISSIPPI
12AVIATION
RECOMMENDATIONS
TO RAISE THE GRADE
• Mississippi should adopt a statewide pavement condition index to allow
airports to be systematically graded and prioritized for funding in order to
efficiently address the most dangerous and deteriorated areas.
• Funding for operations and maintenance is one of the largest hurdles facing
Mississippi’s airports. A possible solution for bridging the funding gap would
be to explore third-party funding including public- private partnerships.
• Finally, PFCs should be increased to support the increased costs of construction,
operations and maintenance. While this is a federal issue, Mississippi should
support changes to federal law to increase the current cap on PFC’s or better
yet, eliminate the cap altogether.
• More funding for training and planning should be set aside for Mississippi’s
aviation industry, infrastructure, and assets to comprehensively build the
state’s resilience in light of increasingly frequent and severe disasters.
INFRASTRUCTUREREPORTCARD.ORG/MISSISSIPPI
13AVIATION
FIND OUT MORE
CDM Smith. Economic Impacts of Mississippi Airports. Economic Impacts of
Mississippi Airports, Mississippi Department of Transportation.
Charlie Leocha. “Mississippi Flyers Don’t Need Higher Airport Fees.” The
Clarion Ledger, The Clarion-Ledger, 26 Jan. 2018, www.clarionledger.com/story/
opinion/columnists/2018/01/26/mississippi-flyers-dont-need-higher-airport-
fees/1069983001/.
Coffelt, Graham. “Enplanement History.” Graham Coffelt, 19 January 2017.
Drey, Kelsey M., et al. “Interactions Between Wildlife and Civil Aircraft in
Mississippi.” Southeastern Naturalist, vol. 13, 2014, pp. 1 – 165.
“Federal Aviation Administration.” United States Department of Transportation, 9
Apr. 2018, www.faa.gov/.
“On the Ground or in the Air: GIS for Aviation – ESRI.” Airport Technology, 31 Aug.
2006, www.airport-technology.com/features/feature760/.
Team, ITS Web Development, “Officials: New FAA UAS Rules Good for MSU
Research.” Mississippi State University, 28 June 2016, www.msstate.edu/newsroom/
article/2016/06/officials-new-faa-uas-rules-good-msu-research/.
WTOK. “FAA Approves Mississippi Airport Grants.” Content, 2 June 2017, www.
wtok.com/content/news/FAA-approves-Mississippi-airport-grants-425959654.html.
https://www.enotrans.org/wp-content/uploads/2019/05/membersOnly-FY20-DOT-
House-Account-Table.pdf
INFRASTRUCTUREREPORTCARD.ORG/MISSISSIPPI
14BRIDGES
BRIDGES
GRADE: D-
EXECUTIVE SUMMARY
Mississippi has 17,072 bridges. More than 400 timber pile bridges have been closed to the public since 2018, when the federal gov-
ernment determined these structures had been insufficiently inspected and posed a risk to the traveling public. A total of 3,127 of
Mississippi’s bridges are weight-restricted; some are posted for a four-ton load, approximately the average weight of a pick-up truck.
To address safety concerns, the Mississippi Legislature convened a special session in August 2018 and voted to provide approximately
$100 million annually for bridge maintenance and rehabilitation. While this additional funding is helpful, it does not come close to
addressing the $1.6 billion funding gap for bridges in the state or reversing the years of underinvestment.
INFRASTRUCTUREREPORTCARD.ORG/MISSISSIPPI
15REPORT CARD FOR
2020
INFRASTRUCTURE
CONDITION AND CAPACITY
The 17,072 bridges in Mississippi are either owned by the state, counties, towns, cities, the federal government, other agencies, or pri-
vate owners. In 2018, 1,603 bridges (9.4%) were structurally deficient. This compares unfavorably with the 7.6% of bridges nationwide
that were identified as structurally deficient the same year. While not unsafe, structurally deficient bridges signal the need for sig-
nificant maintenance, rehabilitation, or replacement. Under current funding structures, Mississippi lacks resources for the necessary
renovations to bring every bridge up to a “good condition” rating. Despite the lack of funds, there have been improvements made to
the current condition of Mississippi’s bridges. According to an analysis by the American Road & Transportation Builders Association,
the state identified needed repairs on 7,397 bridges in 2018, a slight improvement from the 7,506 bridges that needed repairs in 2014.
Another way to understand the condition of Mississippi’s bridges is to consider the percentage of bridges in good, fair, and poor condi-
tion. Table 1 shows the breakdown in condition across the state. Fair bridges require attention and funding in order to avoid falling into
poor condition. A “poor” classification is roughly equivalent with a structurally deficient classification previously mentioned. In 2018,
63% of bridges were in good condition, 28% were in fair condition, and 9% were in poor condition.
TABLE 1: MISSISSIPPI BRIDGE CONDITIONS
AMOUNT AND CLASSIFICATIONS
All Good Fair Poor
17,071 10,711 4,757 1,603
PERCENTAGES
All Good Fair Poor
100% 65% 28% 9%
The age of a bridge can also impact the condition of the structure. According to Federal Highway Administration (FHWA), 4,682
bridges (27.4%) were built in Mississippi before 1970, meaning they are 60 years or older and have surpassed their original design
life. While bridge design life can be extended through regular maintenance, adequate funding is required. Table 2 below shows the
number of bridges, their age, and their percentage of the total bridges.
TABLE 2: MISSISSIPPI BRIDGE AGES
MISSISSIPPI BRIDGE AGES
AgeREPORT CARD FOR
2020
INFRASTRUCTURE
PUBLIC SAFETY
Pile-timber brides are a significant safety concern across the state. In 2018, FHWA determined that these structures had been im-
properly inspected for several years and posed a safety risk to the traveling public. As a result, Governor Phil Bryant declared a state of
emergency and ordered the closure of 83 bridges in the state. The number was later updated to 455 bridges, and closures impacted almost
every county in the state. Closed bridges affect emergency vehicle routes and delay residents that are traveling to their jobs and schools.
Pile-timber bridges aside, 3,127 of Mississippi’s bridges are weight-restricted, 18.3% of the state’s total bridges. In fact, in some areas
there are posted for a four ton load or less, the average weight of a pick-up truck.
FUNDING
In 1987, the Mississippi Legislature passed a $1.6 billion long-range highway bill to build roads and bridges. While one of the largest
highway bills of the time, the legislation did not consider the need for future maintenance and rising construction costs. MDOT reports
that between 1989 and 2017, the construction cost index increased over 300%. Meanwhile, the state’s fuel tax that funds most of
the state’s road work, has remained at $0.18 per gallon, on par with the national gas tax of $0.184 per gallon (unraised since 1993).
According to Mississippi Economic Council’s Blueprint Mississippi, prior to the 2018 special legislative session an estimated $375
million a year is needed to repair and maintain bridges and roads. To help address the funding shortfall, the Mississippi Legislature
passed a $180 million bond bill in 2015. Close to $85 million was spent to fix 13 bridges between Clarksdale and Marks and $36 million
for 13 bridges in Tallahatchie County. Lawmakers again agreed to borrow $50 million for the state’s local bridge repair program that
began July 1, 2018. While bonding can help provide funding for bridges and roads, loans must be repaid. Additionally, as evidenced by
the large number of bridge closures since 2018, existing funding is insufficient for current bridge needs. Additional revenue is needed.
Some states have utilized a gas tax increase or other similar fees to help increase available funding for bridge repairs and replacements.
Recently, the State Legislature identified several new limited revenue sources to help pay for necessary surface transportation infra-
structure repairs. Spurred by the bridge closures, the Mississippi State Legislature convened a special session and passed the Mississippi
Infrastructure Modernization Act of 2018. This legislation diverts a portion of the tax assessed for online purchases to cities and coun-
ties to pay for needed infrastructure improvements, including bridge repairs. Furthermore, the legislation imposes fees on electric and
hybrid vehicles. By fiscal year 2022, the legislation will provide more than $100 million annually for bridge and road infrastructure.
Finally, the Mississippi Infrastructure Modernization Act creates an emergency fund for MDOT to use when paying for emergency
repairs on bridges. The Special Session also authorized $250 million in bonds for necessary bridge repairs.
FUTURE NEED
While the additional revenue for bridges and transportation is helpful, it will not close the funding gap. Mississippi’s $0.18 per gallon
gasoline tax has not been raised since 1987, and in the subsequent years’ inflation has eroded the tax’s purchasing power. The American
Road and Transportation Builder’s Association estimates $1.6 billion is needed for bridge repairs throughout the state.
INFRASTRUCTUREREPORTCARD.ORG/MISSISSIPPI
17REPORT CARD FOR
2020
INFRASTRUCTURE
Legislators in Mississippi have proposed several partial solutions to address the surface transportation funding gap. In addition to intro-
ducing legislation to raise the gas tax, lawmakers have suggested reallocating budgets in favor of bridge maintenance, borrowing money
from the federal government and other entities, and tax increases on tobacco and incomes.
OPERATION & MAINTENANCE
Maintenance in Mississippi is primarily reactive. According to MDOT’s Annual Report in 2019, $408.6 million was spent on road
and bridge contracts and awarded 172 bridge repair and replacement projects. The agency spent nearly $3.8 million on routine bridge
maintenance and $306,884 on bridge repairs due to accidental vehicle impacts. Because of the high cost of bridge maintenance and
the lack of funding, MDOT is shifting its resources from new projects to 10 to 15-year maintenance item.
INNOVATION
Mississippi is capitalizing on innovative bridge research, including bridge scour monitoring and optimization of Mississippi aggregates
for concrete bridge decks. Bridge scour and other hydraulic processes make up around 60% of bridge failures. MDOT continues to
research tools that can measure the depth of scour from the deck of the bridge. These tools also analyze the application of probabilistic
framework to quantify bridge scour uncertainties. Another focus of research and implementation has prioritized aggregates used in
the concrete of bridge decks. MDOT has recently begun placing more stringent upper and lower limits on aggregate gradations used
in the design of concrete bridge decks in order to produce more durable surfaces using locally sourced Mississippi gravel aggregates.
RESILIENCE
As bridges across the state are replaced, a no rise analysis is conducted to ensure the new bridge will not have a negative impact on wa-
ter levels around the structure. As storms become more intense and bring more rain year after year, the average precipitation changes
causing more water to flow through rivers and creeks. As such, generally when new bridges are built they are higher than the bridge
they are replacing to take into account the changing water levels due to changing weather patterns. While this method represents an
incremental rise in the bridge heights, it does not explicitly incorporate future climate trends.
INFRASTRUCTUREREPORTCARD.ORG/MISSISSIPPI
18BRIDGES
RECOMMENDATIONS
TO RAISE THE GRADE
Mississippi’s bridges can greatly benefit from improvements. Some recommendations
to see improvements and raise the state’s grade for bridge infrastructure include:
• Increase annual funding for bridge repair and replacement. The simplest
method to do this would be to increase the gas and diesel user fees across the
state. Research shows that every sitting governor for a state that has increased
the gas and diesel user fees have been reelected if they run, regardless of
political affiliation. Additional sources of income include continuing to utilize
revenue from internet taxes and lotteries for repairs, replacements, and routine
maintenance of bridges.
• To prevent future funding problems, any legislative language regarding
increasing the gas and diesel user fees should also include language that
would automatically index for inflation over time.
• MDOT should consider a prioritization method to determine how to split
funding between operation and maintenance and new construction across the
state.
• Extra efforts should be made to educate the public regarding how they are
impacted by deteriorating or closed bridges and the continued failure to act on
infrastructure investment.
INFRASTRUCTUREREPORTCARD.ORG/MISSISSIPPI
19BRIDGES
FIND OUT MORE
2018 National Bridge Inventory. (2019). Retrieved from https://www.fhwa.dot.gov/
bridge/nbi.cfm
Cook, Wesley, “Bridge Failure Rates, Consequences, and Predictive Trends” (2014). All
Graduate Theses and Dissertations. 2163. https://digitalcommons.usu.edu/etd/2163
D. Aldridge, WJTV12, 12 4 2018. [Online]. Available: http://www.wjtv.com/news/
state/additional-bridges-in-mississippi-added-to-list-of-closures/1115831075.
[Accessed 16 4 2018].
FHWA/MS-DOT-RD-13-229. (2013, December). Retrieved from MDOT: http://mdot.
ms.gov/documents/research/Reports/Interim%20and%20Final%20Reports/State%20
Study%20229%20-%20Instrumentation%20and%20Computational%20Modeling%20
for%20Evaluation%20of%20Bridge%20Substructures%20Across%20Waterways.pdf
“Join MEC.” Blueprint Mississippi - Mississippi Economic Council, www.msmec.com/
blueprint-mississippi.
K. Ablaza, “Mississippi Today,” 10 4 2018. [Online]. Available: https://
mississippitoday.org/2018/04/10/bryant-orders-83-bridges-closed-in-emergency-
declaration/. [Accessed 16 4 2018].
MDOT Annual Report 2017. (2018). Retrieved from MDOT: http://mdot.ms.gov/
documents/public_affairs/documents/annual-report-2017/annual-report-2017/
FLASH/index.html
MDOT Fact Sheet. (2017). Retrieved from MDOT: http://mdot.ms.gov/documents/
public_affairs/documents/mdot-fact-sheet-2017.pdf
MDOT Official: Latest Roads Plan Relies On ‘Unstable’ Funding Source. (2018, March
13). Retrieved from Mississippi Today: https://mississippitoday.org/2018/03/13/mdot-
official-latest-roads-plan-relies-on-unstable-funding-source/
National Bridge Inventory. (2018, April 3). Retrieved from U.S. Department of
Transportation Federal Highway Administration: https://www.fhwa.dot.gov/
bridge/nbi.cfm
Pender, G. (2017, August 25). Roads, bridges, taxes: Mississippi lawmakers mull
numbers. Retrieved April 17, 2018, from https://www.clarionledger.com/story/news/
politics/2017/08/25/roads-bridges-taxes-lawmakers/602269001/
INFRASTRUCTUREREPORTCARD.ORG/MISSISSIPPI
20BRIDGES
FIND OUT MORE (CONT.)
Pender, Geoff. “Governor Declares Emergency, Orders County Bridges Closed.” The
Clarion Ledger, The Clarion-Ledger, 11 Apr. 2018, www.clarionledger.com/story/
news/2018/04/10/governor-orders-bridges-closed/502490002/.
Project Summary: The New Bridge. (2009). Retrieved from US 82 Greenville Bridge:
http://www.greenvillebridge.com/2b_2006.htm
Road and Bridge Data by State. (2015, July 09). Retrieved April 17, 2018, from
https://www.transportation.gov/policy-initiatives/grow-america/road-and-bridge-
data-state
Senate Bill 3046. (2018, March 24). Retrieved from Mississippi Legislature 2018
Regular Season: http://billstatus.ls.state.ms.us/2018/pdf/history/SB/SB3046.xml
“Statewide Transportation Improvement Program.” Mississippi Department of
Transportation, 16 July 2016.
“The State of the State’s Roads and Bridges.” Mississippi Department of
Transportation, April 2018.
“U.S. Department of Transportation - Federal Highway Administration - Bridges &
Structures,” [Online]. Available: https://www.fhwa.dot.gov/bridge/nbi/ascii2017.cfm.
[Accessed 20 3 2018].
Vicory, Justin. “Counties Face Critical Infrastructure Funding Shortages.” The
Clarion Ledger, The Clarion-Ledger, 16 Dec. 2017, www.clarionledger.com/
story/news/politics/2017/12/16/counties-face-critical-infrastructure-funding-
shortages/919044001/.
MDOT Annual Report 2019. https://mdot.ms.gov/documents/Administration/
Reports/FY%202019/Annual%20Report%202019.pdf
Varner, Robert L. Influence of Fly Ash, Slag Cement, and Specimen Curing on
Shrinkage of Bridge Deck Concrete (2014).
https://mdot.ms.gov/documents/Research/Reports/Interim%20&%20Final/State%20
Study%20247%20-%20Influence%20of%20Fly%20Ash,%20Slag%20Cement%20and%20
Specimen%20Curing%20on%20Shrinkage%20of%20Bridge%20Deck%20Concrete.pdf
https://www.osarc.ms.gov/Docs/idx/idx-x.html?https://www.osarc.ms.gov/Docs/data/
Br-x.htm
INFRASTRUCTUREREPORTCARD.ORG/MISSISSIPPI
21DAMS
AERIAL VIEW OF ABERDEEN LOCK AND DAM ON THE TOMBIGBEE RIVER
NEAR ABERDEEN, MONROE COUNTY, MISSISSIPPI, USA.
DAMS
GRADE: D
EXECUTIVE SUMMARY
Mississippi’s dams provide flood control, navigation, water supply, recreation, and other benefits to the state’s population. The National
Inventory of Dams (NID) records 6,081 known dams in Mississippi that are owned by a variety of federal, state, or municipal agencies,
as well as private owners. 381 of these dams are high hazard potential, a classification not reflective of condition, but rather indicates
that should the dam fail, loss of life and significant economic damage is expected. 130 of Mississippi’s high hazard potential dams
need repair and more than 90% depend on the scarce financial resources of local governments or private owners. To best prepare
downstream communities for possible failure, all high hazard potential dams should have emergency action plans (EAPs). However, in
Mississippi, just 71% have EAPs on record. Also of concern is that 36% of state-owned dams are in poor or unsatisfactory condition.
Approximately $1.21 billion dollars is needed to repair Mississippi’s non-federally owned dams.
INFRASTRUCTUREREPORTCARD.ORG/MISSISSIPPI
22REPORT CARD FOR
2020
INFRASTRUCTURE
INTRODUCTION
Dams are used for irrigation, flood control, navigation, water supply, fire protection, fish and wildlife habitat, debris control, and tailings
associated with mining activity. In Mississippi, 85% of the state’s dams are relied upon for recreational purposes. The Mississippi
Department of Environmental Quality (MDEQ) regulates the state’s dams. However, not all dams, namely those less than 8 feet in
height, that impound less than 25 acre-feet of water, or do not retain a continuous flow of water are regulated.
Mississippi classifies its regulated dams as either a high, significant, or low hazard. If a low hazard dam fails, it would result in damage
to agricultural land, farm buildings (excluding residences), or minor roads. If a significant hazard dam fails, it would pose no threat
to human life, but may cause significant damage to main roads, minor railroads, and/or cause interruption of use or service of public
utilities. If a high hazard dam fails, it may cause loss of life, serious damage to residential, industrial, or commercial buildings; or damage
to, or disruption of, important public utilities or transportation facilities such as major highways or railroads.
CONDITION AND CAPACITY
There are currently 6,081 dams in Mississippi and 5,868 are state regulated. A breakdown of dam ownership in the United States and
Mississippi, by owner category, is shown in Figure 1.
FIGURE 1: DAM OWNERSHIP IN MISSISSIPPI
Dams may be classified as high hazard, significant hazard, low hazard, or undetermined. There are 381 high hazard dams, 73 significant
hazard dams, 3,586 low hazard dams, and 2,041 dams that remain undetermined. The Mississippi Department of Environmental
Quality (MDEQ) Dam Safety Division has been working since 2017 to reclassify both significant/low hazard and unclassified/
undetermined dams. Since 2017, MDEQ has increased the number of structures carrying high-hazard classification from 256
structures to 381 structures. These additional 125 dams will be required to undergo formal review, perform annual inspections, and put
together Emergency Action Plans (EAPs) for the first time. Hazard classification is defined in the public safety section below.
The Association of State Dam Safety Officials’ 2018 Dam Safety Performance Report for Mississippi collected information about the
condition of state-regulated high hazard potential dams. Figure 2 shows that approximately 39.1% are rated as satisfactory, 21% are
fair, 21.3% are poor, and 13.9% are in unsatisfactory condition; 4.7% are not rated, likely due to incomplete data.
INFRASTRUCTUREREPORTCARD.ORG/MISSISSIPPI
23REPORT CARD FOR
2020
INFRASTRUCTURE
FIGURE 2: 2018 CONDITION RATING OF STATE-REGULATED HIGH HAZARD POTENTIAL DAMS
Source: Association of State Dam Safety Officials – Dam Safety Performance Report: Mississippi (2018)
Of the dams in Mississippi with a known age, the average age is 45 years. However, only 2,019 dams have a known age, which means
that the ages of the remaining 4,062 dams are unknown. Historically, dams were designed for a 50 to 100-year lifespan. This means
that it is probable that many of those 4,062 dams with unknown ages have exceeded their design lifespan.
OPERATION & MAINTENANCE
The Dam Safety Division of MDEQ regulates all the dams in the state except for five owned and operated by the U.S. Army Corp of
Engineers (USACE) and one owned and operated by the Bureau of Indian Affairs. However, MDEQ oversees all dam inspections in
the state, even for the six over which it does not have regulatory authority.
Although the MDEQ oversees regulation of dams and maintenance of inspection records, it is the responsibility of dam owners to
maintain their dams, have them inspected as needed, and submit their inspection reports to MDEQ. These inspections involve a
periodic visual inspection to spot any developing problems. Informal inspections require that personnel conducting the inspection be
knowledgeable about the dam and its accessories. An informal inspection must be performed every 60 days for high and significant
hazard dams as well as after significant storm events. In addition to having their dams inspected periodically, owners must also ensure
that the EAP for their dams are updated at regular intervals and distributed to downstream stakeholders.
INFRASTRUCTUREREPORTCARD.ORG/MISSISSIPPI
24REPORT CARD FOR
2020
INFRASTRUCTURE
According to the Association of State Dam Safety Officials’ Dam Safety Performance Report for Mississippi, Figures 3 and 4 show
the total personnel, personnel per dam (4a), and personnel per high hazard dams (4b), respectively. Although the Dam Safety Division
of MDEQ has an overall increase in staffing (Figure 3), staffing is much lower than the national average full time equivalent (FTE)
personnel per state-regulated dams (overall) and state-regulated high hazard potential dams. Additionally, further challenges are
present regarding MDEQ’s regulation and inspection of dams. For instance, private owners, many of whom do not acquire permits nor
notify the Dam Safety Division, continue to construct new dams. This increases the difficulty for the Dam Safety Division to maintain
updated records of all the dams in the state, potentially contributing to the large number of unclassified dams. Also of concern are
insufficient/inadequate inspection reports, which are due to inspections being performed by unqualified persons on behalf of the
owner. According to Mississippi law, only high hazard and significant hazard dams must be inspected by a professional engineer.
FIGURE 3: TOTAL STAFF (FTE) FOR DAM SAFETY
Source: Association of State Dam Safety Officials – Dam Safety Performance Report: Mississippi (2018)
FIGURE 4: (A) STATE-REGULATED DAMS PER FTE (BLUE) AND NATIONAL AVERAGE (RED); (B) STATE-
REGULATED HIGH HAZARD POTENTIAL DAMS PER FTE (BLUE) AND NATIONAL AVERAGE (RED)
Source: Association of State Dam Safety Officials – Dam Safety Performance Report: Mississippi (2018)
INFRASTRUCTUREREPORTCARD.ORG/MISSISSIPPI
25REPORT CARD FOR
2020
INFRASTRUCTURE
PUBLIC SAFETY
MDEQ regulations require an EAP to be developed for all High Hazard Dams. A well-prepared and maintained EAP can greatly reduce
the potential risk of loss of life in the event of a dam breach. Between 2010 and 2018, MDEQ’s efforts have increased the number
of high hazard dams with documented EAPs from 141 to 270, or upwards of 70%. However, this coverage remains below that of the
national average of more than 80% according to the Association of State Dam Safety Officials’ Dam Safety Performance Report for
Mississippi and is an overall reduction over prior years due to the reclassification of 125 dams as high hazard.
To date, Mississippi has not experienced a dam failure resulting in loss of life; however, in 2004 the Big Bay Lake Dam, located in Lamar
County, failed resulting in the destruction of 48 homes. Of the 381 high hazard dams, only 270 (71%) have an Emergency Action Plan.
FUNDING
Funding is necessary for inspection and regulation of dams as well as the repair and maintenance of dams. The funding available for
maintenance and repair will differ according to whether a dam is federally owned, state-owned, municipally owned, or privately-owned.
The funding available for specific dams even within the same classification can differ depending on which federal agency, municipality,
or person owns the dam.
The funding for federally-owned dams in Mississippi depends on the budget available to the federal agency that owns and is tasked with
the dam’s maintenance and repair. There are 43 federally owned dams in Mississippi. Of these dams, one is owned by the Bureau of
Indian Affairs (BIA), two by the Department of the Navy, 13 by the Forest Service, three by the Fish and Wildlife Service, and 24 by
the USACE.
Funding is generally insufficient for the repair of federally owned dams. One case that exemplifies this is an issue faced by the BIA.
Although Congress authorized the Water Infrastructure Improvement Act in 2016, through which $35 million per year would be
appropriated for dams owned by the BIA, Congress has not yet appropriated these funds. The BIA is therefore only able to meet the
most critical needs regarding its dams. For this reason, the Lake Pushmataha dam, which should have a risk of failure no greater than
0.01%, has a 5% risk of failure. This lack of funding is also observed in dams owned by the Fish and Wildlife Service, which is only able
to cover routine yearly maintenance and utility bills with its funding. Another consequence is an inability for the dam owner to perform
repairs that prevent deteriorating conditions and could lead to a proactive approach to operation and maintenance of its dams. While
these funding challenges and their consequences are significant, of the 43 federally owned dams, only one has been judged to be in
poor condition. The rest of the dams are currently in an acceptable condition but are expected to need additional maintenance funding
in the near future.
Funding for state-owned dams can come from different sources. However, the primary four funding sources are the Land and Water
Conservation Fund, the Natural Resources Conservation Service (NRCS), bonds, and the budget of the state agency responsible for
the specific dams. Of the 62 state-owned dams in Mississippi, only one is currently on record as needing repair.
INFRASTRUCTUREREPORTCARD.ORG/MISSISSIPPI
26REPORT CARD FOR
2020
INFRASTRUCTURE
The majority of funding for municipally owned dams comes from local taxes and is limited by the municipality’s budgets. Of the 665
municipally owned dams, 85 dams are currently in need of repair. However, municipalities have limited resources and may be swayed
by the public’s opinion to support other immediate funding requests, leaving dams farther down the priority and funding list. As dams
are often out of sight and out of mind until significant flooding or failure occurs, it is often too late to catalyze more funding for
rehabilitation by the time the public advocates for it. Consequently, it is important to increase the public’s knowledge of dams, where
they are located, the purposed they serve, the risk they pose, and their need for increased funding.
The majority of the dams in Mississippi are privately owned, and the responsibility for maintaining and repairing these dams falls on the
owners. This means that the funding needs for most of Mississippi’s dams are primarily associated with private entities which do not
have the same financial resources as federal and state-owned dams. Currently, of the 5,297 privately-owned dams in the state, 76 need
repairs.
FUTURE NEED
According to a report published by the Association of State Dam Officials in 2019, the total cost to rehabilitate the state’s non-
federally owned dams is approximately $1.21 billion, which is the same need estimated in 2012. The cost to rehabilitate Mississippi’s
federally owned dams is approximately $200 million. There are 381 high hazard dams in the state, and 130 of these need repairs. It is
roughly estimated that the total cost to repair these 130 high hazard dams would be $16 million. Since there is only one federally owned
high hazard dam that needs repair and only one state-owned high hazard dam that needs repair, it is evident that the majority of those
in need of repair are local government and privately-owned.
INNOVATION
The Dam Safety Division of MDEQ has established standards for the design of dams according to their hazard level classifications.
MDEQ has also established a list of inspection criteria for owners who are responsible for having their dams inspected. Regarding
inspection and regulation, however, there has been an innovative change on the part of the Dam Safety Division of MDEQ in the last
three years in prioritizing dams according to their risk. This prioritization ranking is based on the hazard ranking of the dam as well as the
population at risk downstream. Because of this, MDEQ is able to better determine which dams should be given first priority in repair.
INFRASTRUCTUREREPORTCARD.ORG/MISSISSIPPI
27You can also read


