A Call to Action for Iowa's Infrastructure - Infrastructure Report ...
←
→
Page content transcription
If your browser does not render page correctly, please read the page content below
Photo Credit: Brian Barkley of Barkley Photography

A Call to Action for Iowa's Infrastructure
IOWA'S 2015 GRADE: C -
Why a 2015 Report Card for                                               Inland Waterways: D                          Pages 10 - 12
                                                                         Iowa’s two river inland waterway transportation system is
Iowa's Infrastructure?                                                   safe, efficient, and sustainable. But with no long-term funding
The 2015 Report Card for Iowa's Infrastructure has been                  for maintenance or modernization its future serviceability and
prepared to acquaint Iowans with the extent, condition and               capacity will be constrained.
importance of the capital assets that support modern life.
It is hoped that this information, along with the grades, will           Section author: Andy McCoy, Project Manager, HDR, Inc.,
encourage awareness of and concern for these often under-                Des Moines
appreciated facilities. Iowa’s ASCE members hope that the
grades will alert citizens, media agencies, business leaders,
and elected officials to the needs of the infrastructure and             Roads: C-		                                  Pages 13 - 20
induce a commitment to giving it proper care and upkeep.                 Traffic volumes have been increasing on Iowa roads but
Lastly, the grades provide a benchmark for detecting, in the             reduced purchasing power has left road agencies unable to
future, how things are trending.                                         prevent loss of condition. The system requires at least an
                                                                         additional $215 million per year to address its most critical
The 2015 Report Card for Iowa's Infrastructure contains                  needs. The road use tax funding mechanism is losing its
one grade B, seven Cs, and three Ds. Readers are invited                 efficacy so a search is on for methods more appropriate to
to consider if this is good enough or if Iowa ought to strive            the times.
for better scores. Our daily lives and economic activities
depend on the safe, reliable, taken-for-granted presence                 Section author: Dave Mulholland, Transportation Engineer,
of infrastructure. If we make the commitment to improve                  Ames
the grades, we’ll experience benefits in both personal and
business activities. If we let the facilities’ adequacy decline,         Co-author: Mark Crawford, Project Manager, CGA Engineering,
we’ll face higher costs with less reliability. What sort of future       Marshalltown
do we want and what path should be taken to arrive there?

                                                                         Bridges: D+		                                Pages 21 - 25
Aviation: C-		                                   Pages 1 - 4             One in every five bridges in Iowa is rated structurally deficient
Iowa’s air transportation capacity, operations, and resilience           giving our state the third worst rating in the nation. Reducing
are currently in good standing; however, the condition,                  the number of structurally deficient bridges is a priority of the
funding, and innovation were found only to be average. Safety            IDOT, Counties and Cities. While there has been progress,
and future needs are concerning with the lack of a long-term             the pace of repair and replacement must be quickened if
funding strategy.                                                        the backlog is to be noticeably reduced. Road agencies are
                                                                         exploring accelerated construction techniques to as one way
Section author: Rob Garber,           Project   Manager,    CGA          to speed things up.
Associates, Marshalltown
                                                                         Section author: Dave Mulholland, Transportation Engineer,
                                                                         Ames
Rail: C 		                                       Pages 5 - 9
Iowa’s freight rail system features good capacity, condition,            Co-author: Mike Vander Wert, President, Calhoun-Burns &
operations, and maintenance for current traffic levels. The              Associates, Inc., West Des Moines
outlook is for fewer but larger shipping points with a smaller
rail system as funding to maintain the full current network is
inadequate in the long-term. Passenger rail languishes at a              Dams: D		                                    Pages 26 - 28
minimal service level.                                                   Iowa dams are struggling due to a lack of funding, not only for
                                                                         maintenance and repair, but for safety programs as well. With
Section author: Steve De Vries, Executive Director, Iowa                 nearly 50% of the dams privately owned in the state, private
County Engineers Association Service Bureau, Des Moines                  property owners are faced with the reality of self-funding any
                                                                         needed dam maintenance or improvement projects as there
                                                                         are no state loan or grant programs for dam owners.

                                                                         Section author: Gary Reed, Principal, CDA, Inc., Grimes
                                                                     i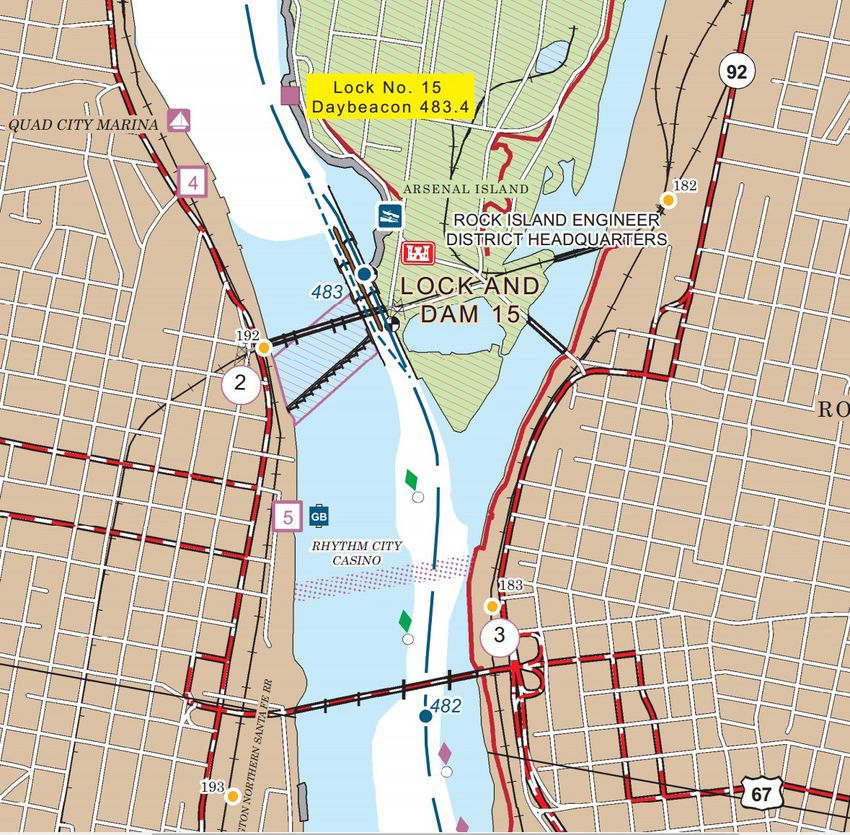
Levees: C-		                                 Pages 29 - 32                Solid Waste: B+		                             Pages 45 - 48
The majority of Iowa’s levees are currently functioning                   Iowa is performing well in the area of solid waste; however,
adequately with typical stream flows, but issues frequently               several new techniques and technologies provide an
occur when design flows are experienced. There appears                    opportunity to further enhance solid waste management in
to be thorough oversight of the permitting process; however,              the state. Continued waste reduction education and increased
there is no follow-up maintenance program at the state level              diversion opportunities would benefit the state as well.
for constructed levees.
                                                                          Section author: Aaron Granquist, Project Manager, McClure
Section author: Kari Sebern, Principal, Sebern Structural,                Engineering, North Liberty
Panora
                                                                          Co-author: Aaron Moniza, Lead Civil Engineer, Foth
Drinking Water: C+                           Pages 33 - 36
                                                                          Infrastructure & Environment, LLC, Cedar Rapids
Iowa’s drinking water supply infrastructure is in relatively good
                                                                          Co-author: Riley Quinn, Civil Engineer, Shive-Hattery, Inc.,
condition, has adequate capacity, and a good safety record.
                                                                          West Des Moines
Funding for system operation and maintenance is generally
sufficient, but additional revenue is needed to enable water              The resulting grades should be evaluated as follows:
line replacement and treatment plant modernization. Water                 A All criteria are met; facilities are fully adequate both for both
ultilities are adopting computerized control systems to                     today and the future. Fully resilient and safe.
improve quality and reliability. Nitrates in surface water require
expensive additional treatment.                                           B Most criteria are met; facilities OK for today but not on a
                                                                            trajectory to meet all future needs. Some weaknesses.
Section author: Steve De Vries, Executive Director, Iowa                  C Marginally adequate for current use; needs additional
County Engineers Association Service Bureau, Des Moines                     investment just to remain marginal. Medium resilience.
With special assistance from John Dunn, City of Ames
                                                                          D Falls short of fully meeting current needs; at risk of falling
                                                                            further behind in the future. Weak resilience.
Wastewater: C-		                             Pages 37 - 40                F Inadequate for today; likely to fall seriously short in the
Iowa has an aging wastewater infrastructure which requires                  future. Likely to fail when stressed.
significant funding. In the long-term, the state must modernize
and build new facilities in a targeted and strategic manner.              The grades presented in this report represent a professional
By employing strategies to use every dollar resourcefully and             assessment of seven criteria:
by deploying creative solutions to infrastructure development,            • Capacity: Do the facilities have enough capacity to serve
the state can implement the right projects in an efficient and              today’s needs and future demands?
economical manner.
                                                                          • Condition: Are the assets being kept in good, reliable
                                                                            condition and will they remain that way?
Section author: David Claman, Chief Hydraulics Engineer,
Ames                                                                      • Funding: Is the category adequately funded and will future
                                                                            revenues suffice?

Electrical Energy: C                         Pages 41 - 44                • Operations and Maintenance: Are the assets being
                                                                            actively maintained by people with the necessary skills,
Upgrading and expanding existing transmission and
                                                                            tools, action plans, and resources?
distribution infrastructure, along with a rational implementation
of existing and new regulations, is vital to preserving the               • Public Safety: Is the public being adequately protected
continued dependability of electrical power in Iowa and                     from disease, injury, death, and/or loss of property through
protecting grid stability and resilience. The need for a national           the design and function of the infrastructure?
energy plan is great.                                                     • Resilience: Can the facilities continue in operation during
                                                                            or recover quickly after major disruptions, such as floods,
Section author: Michael Shimkus, Staff Engineer, WHKS,                      storms, breakdowns, or accidents?
Ames
                                                                          • Innovation: Are improved construction, process, and
                                                                            control technologies being deployed?

                                                                     ii
C-                                                                                                  AVIATION
Summary                                                              Capacity and Condition
Iowa’s air transportation capacity, operations, and resilience       Capacity is a measure of the maximum number of aircraft
are currently in good standing; however, the condition,              operations that can be accommodated on an airport in an
funding, and innovation were found only to be average. Safety        hour with continuous demand. Nationally, the active general
and future needs are concerning with the lack of a long term         aviation fleet is projected to increase at an average annual
funding strategy. Based on the information presented, Iowa           rate of 0.5% between 2013 and 2033. The turboprop fleet is
Aviation receives a grade of C -.                                    projected to grow by 2.8%, on average, per year with the jet
                                                                     fleet increasing by 3.5%. Piston powered aircraft are projected
                                                                     to decrease by an average annual rate of 0.2%. The 2014
                                                                     FAA forecast calls for U.S. carrier passenger growth over the
                                                                     next 20 years to average 2.2% per year.2 For Iowa, the fleet
                                                                     is expected to increase from 2,514 in 2014 to 2,954 aircraft
                                                                     by 2035. Total aircraft operations are projected to increase by
                                                                     3.7% by 2030.1 Capacity for Iowa's airports is currently above
                                                                     average; however, airports need to be ready to accommodate
                                                                     the anticipated long term growth.

                                                                     Airports in Iowa serve varying types of users and levels of
                                                                     demand. Five roles were identified to classify airports based
                                                                     upon the function they serve as well as their capability of
                                                                     supporting general types of aircraft. Each role is defined by a
                                                                     set of criteria based upon the level of infrastructure and services
                                                                     provided at each airport. The five airport classifications are:
Background
Aviation is an integral part of                                      • Commercial Service – Scheduled commercial airline
Iowa’s economy and way of life.                                        service.
Air transportation provides needed
connectivity and moves people and                                    • Enhanced Service – Airports with runways 5,000 feet or
goods to their destinations quickly                                    greater with facilities and services that can accommodate a
and efficiently. Support of flight                                     full range of general aviation activity.
operations can stimulate the need for a broad range of               • General Service – Airports with runways 4,000 feet or
products and services that create jobs. Significant levels of          greater with facilities and services that can accommodate
economic activity occur in every category of aviation in Iowa          most general aviation activity.
including commercial, military, and general aviation.
                                                                     • Basic Service – Airports with runways 3,000 feet or greater
                                                                       with facilities and services customized to meet local aviation
Iowa has a long and varied aviation history. Early pioneers
                                                                       demands.
such as Clyde Cessna, the Wright Brothers, and Amelia
Earhart lived in Iowa in their childhood years. Balloon and          • Local Service – Airports supporting local aviation activity
glider flights began in Iowa in the 1880s. In 1910, just seven         with little or no services; i.e. turf runways.
years after the first powered flight by the Wright Brothers,
the first powered flight took place in Iowa. The remainder of        Facility and service targets were established to help airports,
the 20th century witnessed the development of a mature air           within a specific role, meet the needs of their users. Airports
transportation system throughout Iowa and around the globe.          are encouraged to meet or exceed suggested targets for their
                                                                     role to satisfy local and aviation system needs. The targets
Currently, Iowa has eight commercial service and 100 general         are separated into two main categories: airside and landside
aviation airports that are publicly owned. Of Iowa’s 108             facilities and services. Targets for each role vary based on the
publicly owned airports, 79 are listed in the Federal Aviation       needs of aviation users for that role. The Enhanced Service
Administration (FAA) National Plan of Integrated Airport             airports, for example, will have more targets to meet the needs
System (NPIAS). There are 2,514 aircraft based in Iowa               of business users. There are fewer targets for Local Service
making approximately 840,350 operations in 2014. Iowa’s air          airports since they serve users with fewer requirements
transportation system contributes about $5.4 billion a year to       for operation. Targets required for inclusion in a role are
Iowa’s economy and supports an estimated 47,034 jobs.1               highlighted in gray in the following facility and service table:

                                                                 1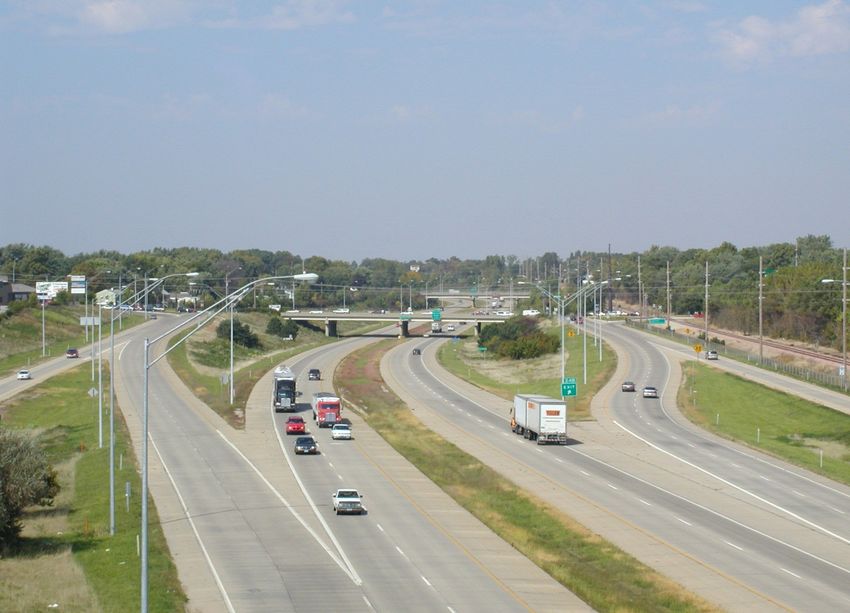
C-                                                                                                     AVIATION
Table 1- Airport classifications
   Target Description        Commercial/Enhanced             General Service                Basic Service           Local Service
                               Service Targets                  Targets                       Targets                 Targets

                                                               Airside
    Airport Reference                    C-II                           B-II                 B-I or below                 A-I
          Code
    Primary Runway                 Minimum 5,000 ft          Minimum 4,000 ft                   3,000 ft           Not an objective
        Length
 Primary Runway Width              Minimum 100 ft             Minimum 75 ft                 Minimum 60 ft           Minimum 50 ft
     Type of Parallel                Full parallel          Turnarounds meet               Exits as needed         Not an objective
        Taxiway                                           standards (both ends)
     Type of Runway                Vertical guidance          Non-precision                     Visual                  Visual
        Approach
    Runway Lighting                     *MIRL                       *MIRL                        *LIRL             Not an objective
    Taxiway Lighting                    *MITL                       *MITL                  Not an objective        Not an objective
 Visual Guidance Slope        Both runway ends (or          Both runway ends               Not an objective        Not an objective
        Indicator                     *ILS)
 Runway End Identifier        Both runway ends (or          Both runway ends               Not an objective        Not an objective
  Lights - as required                *ILS)
    Rotating Beacon                      Yes                            Yes                       Yes              Not an objective
 Lighted Wind Indicator      Yes - multiple as needed                   Yes                If open for night       If open for night
     *RCO Facilities               Tower or *RCO             Not an objective              Not an objective        Not an objective
    Wind coverage or           Crosswind runway or         Crosswind runway or             Not an objective        Not an objective
    crosswind runway          95% wind coverage for       95% wind coverage for
                                 *NPIAS facilities           *NPIAS facilities
                                                             Landside
    Covered storage           100% of based aircraft      100% of based aircraft        100% of based aircraft     Not an objective
  Overnight storage for          Typical average         Typical average aircraft/         Not an objective        Not an objective
    business aircraft         aircraft/business user     business user demand
                                      demand

      Aircraft apron          100% of average daily       100% of average daily            50% of average          Not an objective
                                   transients                  transients                  daily transients

 Terminal/administration                 Yes                            Yes                  Waiting area          Not an objective
        building
  Paved entry/terminal                   Yes                            Yes                Not an objective        Not an objective
       parking
Only 61% of Iowa airports meet all the facility targets for their        overall health of the pavement. The Iowa Department of
airport role. However, 70% of airports meet at least 75% of              Transportation (DOT) has set the Critical PCI at 65 for
service targets for their role, and 78% of airports store all            runways, 60 for taxiways, and 55 for aprons. In general terms,
based aircraft in hangars.1 Therefore, the conditions at Iowa            pavements with a PCI of 65 to 100 that are not exhibiting
Airports are considered average.                                         significant load related distress will benefit from preventive
                                                                         maintenance actions, such as crack sealing and surface
                                                                         treatments. Pavements with a PCI of 40 to 65 may require
Operations and Maintenance                                               major rehabilitation, such as an overlay. Often, when the PCI
Airports must maintain their facilities, hangars, and most               is less than 40, reconstruction is the only viable alternative
importantly, their runways. Iowa has regular Pavement                    due to the substantial damage to the pavement structure.
Condition Index (PCI) inspections to determine the                       Eighty-nine percent (89%) of Iowa’s primary runways have a
                                                                    2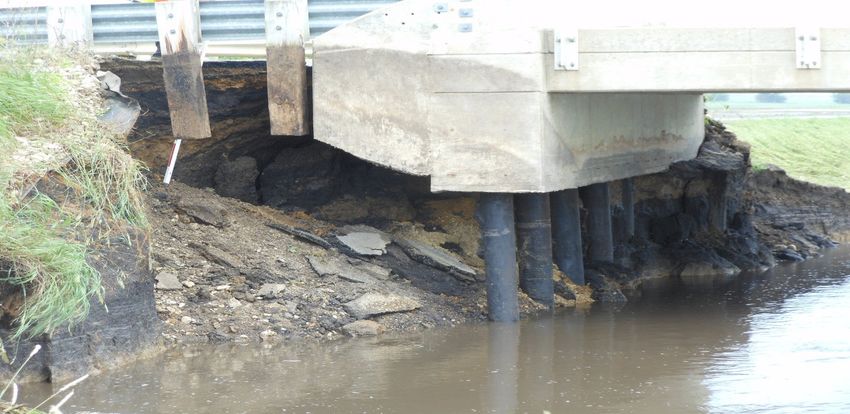
C-                                                                                                 AVIATION
Pavement Condition Index (PCI) of 70 or greater.
                                                                     Funding and Future Need
                                                                     As the economy recovers from the most serious economic
Iowa airports are protecting their airspace and operational
                                                                     downturn and slow recovery in recent history, aviation will
environment by having an Airport Land Use and Height Overlay
                                                                     continue to grow over the long run. Fundamentally, demand
Zoning Ordinance. The Ordinance regulates what, where, or
                                                                     for aviation is driven by economic activity. As economic growth
if, a structure can be located near an airport. However, only
                                                                     picks up, so will growth in aviation demand. It is for this reason
43% of airports have city or county comprehensive planning
                                                                     Iowa should work toward meeting the infrastructure needs of
that address compatible land use around airports.1
                                                                     the growth in aviation.

Public Safety                                                        Significant funding has been invested into the existing
Safety is very important to the aviation community in a              infrastructure of Iowa airports. Between 2005 and 2010,
variety of ways including maintenance, communication, and            $290 million has been invested through federal, state, and
protocol. A key safety concern is an obstruction, which is any       local sources to develop and maintain the aviation system.1
fixed object that penetrates the airport’s approach surface.         In order to maintain the level of service at these airports and
Typically, in Iowa, obstructions are trees, power poles, and         invest in appropriate future development, funding from the
barns. Eighty percent (80%) of Iowa’s airports have height           federal Airport Improvement Program (AIP), the state, and
zoning ordinances.1 This protects the public by not allowing         local communities continues to be necessary. Typically, the
homes, schools, or other gathering places too close to the           local share for federal grants is 10%, and for state grants, the
airport. Also, wind turbines and cell towers located near            local share is 15% to 30%. The local share is generally funded
an airport are an obvious concern. When an obstruction is            by municipal government or by public/private partnership.
identified it may or may not be determined to be a hazard and        Iowa has 79 airports eligible for the federal program, which is
can be marked and lighted. If it is a hazard, the obstruction        funded exclusively with aviation user fees and administered
should be removed or the runway threshold will have to be            by the FAA.
relocated or displaced, losing landing and takeoff distances.
Only 36% of airports have no obstructions to all runway ends.1       It is estimated that Iowa’s airports will need $816 million
                                                                     over the next 20 years to meet needs.1 This is spread over a
                                                                     number of project types such as runway construction, hangar
                                                                     development, planning studies, and obstruction removal.

                                                                            Figure 1- System needs by category 2011-2030

                                                                                                                               14%
                                                                                                                              $113M

                                                                                                                               5%
                                                                                                                              $37M

                                                                                                                               5%
                                                                                                                              $42M

                                                                                                                               7%
                                                                                                                              $58M
                                                                                           69%
In addition, Iowa’s airports should be establishing regular                               $566M
communications programs, pilot safety programs, and
education.

Accessibility
Iowa’s system of airports is adequately accessible from both             Airside Development                 Airside Safety
the ground and the air. Most Iowans are within a 30-minute               Landside Development                Revenue Producing
drive time to a Commercial Service or Enhanced Service
                                                                         Panning
airport and 78% of employment in Iowa is within a 30-minute
drive time to a Commercial Service or Enhanced Service                Iowa Aviation System Plan 2010-2030 Executive Summary
airport.1

                                                                 3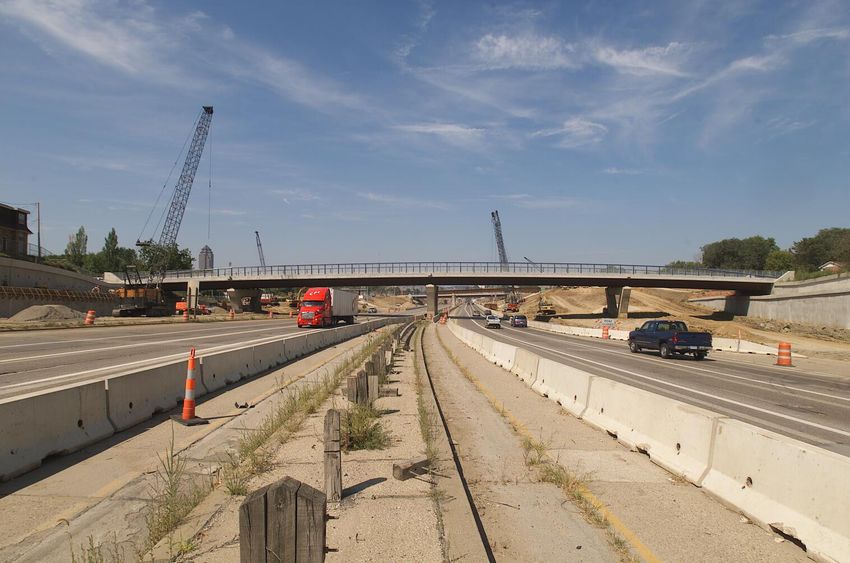
C-                                                                                                                 AVIATION
Innovation                                                               Continue regular PCI inspections and pavement preservation.
                                                                         Increase passenger facility charges (PFCs) to aid funding for
The NextGen system is the transformation of the National
                                                                         aviation infrastructure.
Airspace System (NAS) from a ground based system of
air traffic control to a satellite based system of air traffic
                                                                         Removing the PFC cap would allow airports to raise necessary
management. The evolution of the airport system is important
                                                                         funds locally for improving the nation’s aviation infrastructure.
to meet future user demand and to avoid gridlock in the air and
on the ground. The NextGen system will support continued
growth and increased safety of aircraft operations while                 Resources
reducing the environmental impact of aviation operations.                1
                                                                          IOWA Aviation System Plan 2010-2030:
                                                                         h t t p : / / w w w. i o w a d o t . g o v / a v i a t i o n / s t u d i e s r e p o r t s /
Several technologies will support the NextGen system including           systemplanreports.html
the Global Positioning System (GPS), advances in weather
forecasting, data networking, and digital communications.                2
                                                                          Federal Aviation Administration Terminal Area Forecast,
When NextGen becomes fully operational for and available                 FY 2013 – 2040:        http://www.faa.gov/about/office_org/
to the entire aviation community, it will allow a greater number         headquarters_offices/apl/aviation_forecasts/taf_reports/
of aircraft to safely fly closer together on more direct routes.         media/TAF_Summary_Report_FY2013-2040.pdf
This will result in reduced delays and benefits for the economy
and environment through reduced carbon emissions and fuel                3
                                                                          National Plan of Integrated Airport Systems (NPIAS) 2015-
consumption.                                                             2019:    http://www.faa.gov/airports/planning_capacity/npias/
                                                                         reports/media/npias-2015-2019-report-narrative.pdf
Conclusions                                                              *MIRL - Medium Intensity Runway Light
Iowa’s 108 publically owned airports support 2,514 based
                                                                         *RCO - Remote Communication Outlet
aircraft which make around 840,000 operations per year.
                                                                         *ILS - Instrument Landing System
Eight airports support commercial air services providing
                                                                         *LIRL - Low Intensity Runway Light
nearly 4/5ths of all citizens with 30-minute access to air travel.
                                                                         *MITL - Medium Intensity Taxiway Light
While capacity is adequate today, substantial growth can be
                                                                         *NPIAS - National Plan of Integrated Airport Systems
expected over the next 20 years. Only 61% of the State’s
airports meet all the requirements of their service level. Work
remains to be done in the area of landing and takeoff corridors
of potential flight obstructions, with only 43% of all airports
protected by land use ordinances. Estimated needs over the
next twenty years total $816 million, or about $41 million per
year. Improved GPS based navigation controls will help boost
airport capacities.

Recommendations
It is recommended to include the following for Iowa airports
along with local/state/federal governments:

Airports should be engaged in local community planning
efforts: Airports should be integrated in strategic community
activities and provide perspective on their needs and protect
against incompatible development.

Provide consistent funding for the national aviation program:
The continuing resolution for Airport Improvement Program
(AIP) funding is a concern. State and federal government
should implement a six year funding program for development
and maintenance of airports.

Continue approach obstruction mitigation to clear runway
approaches.

                                                                     4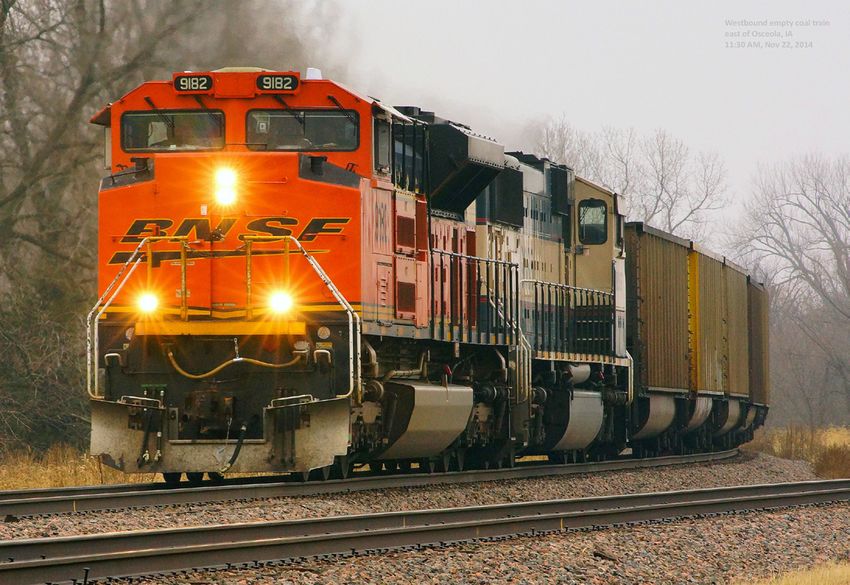
C                                                                                                                     RAIL
Summary                                                                 Railroads have played an important role in Iowa’s economy
                                                                        since the state was founded. While they originally served as
Iowa’s rail system has dropped from about 10,000 miles in
                                                                        general purpose carriers serving all citizens and businesses
1980 to 3,800 today with major private railroads owning 82%
                                                                        in nearly every community, they have since evolved into
of the trackage. The share of freight movement moving by
                                                                        specialists who efficiently transport large quantities to and
rail has declined from 43.5% in 1987 down to 37.5% in 2002,
                                                                        from high volume terminals.
yet railroad traffic has physically doubled. Iowa’s rail system
features good capacity, condition, as well as operations and
                                                                        At the peak of local service around 1913, 10,000 miles of
maintenance for current traffic levels. However, increasing
                                                                        rail lines crisscrossed Iowa and handled almost all freight
congestion on key main lines, escalating costs, and rapid
                                                                        movement plus a large volume of passengers. Due to
growth of oil, frack-sand, and agricultural commodity transport
                                                                        competition from other modes of transportation, regulations,
may test the rail industry’s ability to deliver reliable service.
                                                                        inefficient use of labor, and changes in the agricultural
                                                                        economy, many lines became uneconomical leading to a
While safety statistics are trending better overall, new concerns
                                                                        general decline of the rail system and service. Track and
regarding tank car trains have developed and are not yet fully
                                                                        facility maintenance was deferred, track speeds slowed, and
addressed. Funding to maintain freight service, while currently
                                                                        many railroad companies became at risk of bankruptcy. These
acceptable for major Class I railroads, is inadequate in the long
                                                                        trends culminated in the 1980s with the collapse of the Rock
term for the full rail network. Existing and potential passenger
                                                                        Island and Milwaukee railroads in the Midwest and a near
services languish without public consensus on how to finance
                                                                        shut-down of major eastern carriers.
them. While it is estimated farmers save 10 cents a bushel due
to the availability of the rail system, agriculture and rail need
                                                                        In response, Congress deregulated the remaining railroads of
to work together to economically deliver an ever increasing
                                                                        many constraints that had prevented efficient operation and
grain harvest to world markets at a competitive price. This will
                                                                        adequate revenue generation. Iowa’s surviving railroads then
require innovation in tracks, terminals, cars, locomotives, and
                                                                        aggressively right-sized their systems and adopted a focus on
operating practices. Some main lines have become so heavily
                                                                        hauling large volumes of freight in unit trains. Rail line mileage
used that service levels are hard to maintain and double or
                                                                        fell drastically, to 3,800 miles, but operational factors, such
triple tracking may be needed. There will be fewer but larger
                                                                        as track and rolling stock utilization, improved substantially.
shipping points in the future serviced with a still smaller rail
                                                                        Long deferred maintenance work was caught up and most
system; abandonment of low use lines will be balanced by
                                                                        remaining lines were actually improved with ribbon rail and
upgrades of others.
                                                                        revamped yards.

Background                                                              The rail industry, which had not only had too many miles of
Rail transportation is important to Iowa’s economy. It helps            underused track but also too many small, weak corporations,
deliver products of Iowa agriculture to world markets at                consolidated. The top lines – including UP, BNSF, NS, CN and
competitive prices. It delivers the lion’s share of thermal             CP – took over Iowa lines of national importance. New regional
coal to utilities that generate electricity used in the state and       and local carriers, like Iowa Interstate, Iowa Northern, and
transports Iowa produced motor fuels to external markets. It            Burlington Junction Railway, sprang up to keep the remaining
provides jobs for several thousand citizens, buys products              lines of state/local significance in service.
and services from Iowa companies, and pays property taxes
that support schools and local government.                              After all these changes, Iowa is today served by an efficient
                                                                        and reasonably profitable rail system. It links the state to
Figure 1- Rail transportation                                           distant markets, transports energy products in and out, and
                                                                        provides our agricultural sector with cost savings that help
                                                                        keep Iowa’s harvest competitive in world markets.

                                                                        All this change has not been without adverse effect. Many
                                                                        communities lost all access to rail service. Single carload
                                                                        shippers now find themselves at the back of the line as rail
                                                                        companies focus their resources on maximizing track and
                                                                        equipment utilization. Passenger service has dwindled to two
                                                                        pairs of long distance trains operating out of aged depots.
                                                                        These trains are often behind schedule and don’t run through
                                                                        Iowa’s population centers. While public interest in upgrading
                                                                        and expanding passenger service exists, the question of how

                                                                    5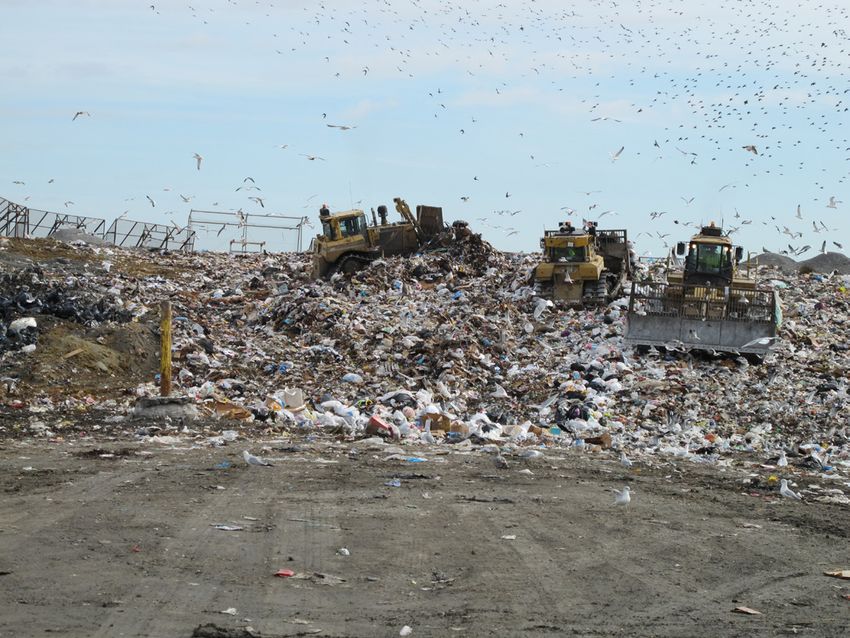
C RAIL
to fund both capital improvements and ongoing expenses has 250,000 Figure 3- Carloads terminated in Iowa per year
inhibited any action.
Class III
Capacity and Condition 200,000 Class II
Iowa’s rail capacity and condition are reasonably good and Class I
still improving. Line utilization is considerably better than was
150,000
the case in the 1980s and the number of possible further
abandonments is much reduced. From 1985 to 2011, total ton
miles carried per year has increased by 217%, even as the
100,000
track mileage dropped 17%, down to 3,800 miles.
Seventy percent (70%) of the freight moving on Iowa rails is
50,000
pass-through traffic that both originates and terminates out of
state. However, Iowa itself originates 56.2 million tons (mostly
agricultural, energy, and chemical products) per year and
0
receives 42.9 million tons (mostly coal for electrical generation
el rals
at s
ls
M Min s
za ts
En s
s
Pr gy
ac r
em l
and chemicals).
Ch tura
e
u
re
l
ou
ia
ica
Ha uc
an mb
eo
er
tu
er
e
rd
od
Ra an
ul
u
Figure 2- Iowa originated carloads per year
ric
L
250,000
M
l
uf
Ag
od
isc
w
M
Fo
Class III
200,000 Seventy percent (70%) of all tracks are rated at 40 mph or
Class II
better, with key transcontinental routes on the UP and BNSF
Class I
rated up to 79 mph – although freights usually travel at no
150,000 more than 60 mph maximum. Most track is in acceptable to
good condition for the traffic levels carried.
Figure 4- Track miles by maximum allowable
100,000 1600 speeds
1450
1400
50,000
1200
0 1000
el rals
at s
ls
M Min s
za ts
En s
s
Pr gy
ac r
em l
808
Ch tura
e
u
re
l
ou
ia
800
ica
Ha uc
an mb
eo
er
tu
er
e
rd
od
Ra an
ul
u
ric
L
M
l
uf
600
Ag
od
isc
w
490
M
474
Fo
440
400 395
Photo 1- Rail 293
200
133
29
0
ss
79
s
s
s
s
70
90
s
30
60
40
20
50
Le
or
15
Rolling stock usage is also much improved since the 1980s.
Locomotive miles travelled per year have increased by 147%,
cars per locomotive are up from 23 to 31, and car capacity is
up by 18%. These gains have been achieved by concentrating
service on fewer lines with a limited number of shipping points,
which enable the railroads to reduce load/unload times and
maximize car utilization.
6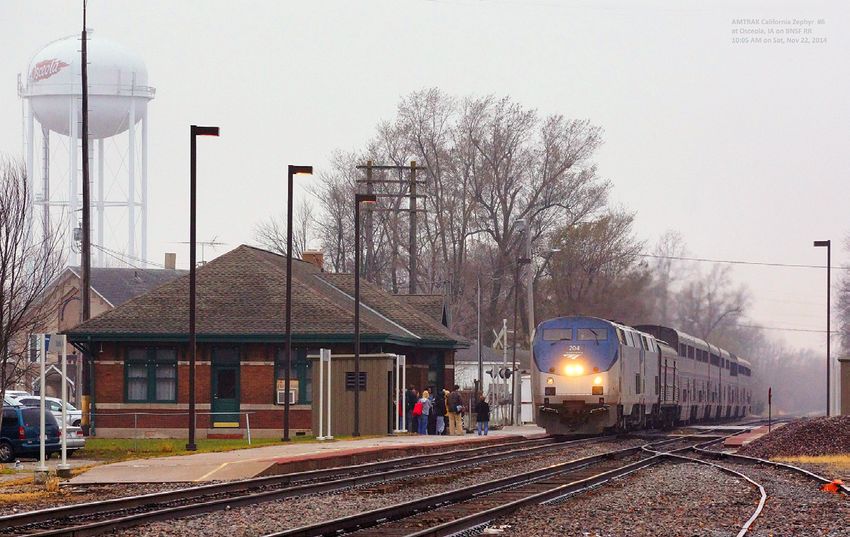
C                                                                                                                       RAIL
However, only two long distance Amtrak lines run through
Iowa, boarding about 60,000 passengers at six depots each
                                                                           Public Safety
                                                                           Railroad safety is at an all-time high, when measured in terms
year. Unfortunately, the lines cross through the state’s less
                                                                           of mishaps per ton-miles hauled. Even with the tripling of total
populated southern counties and the once per day schedules
                                                                           traffic in the last 30 years, the absolute number of accidents
preclude using the service for business trips.
                                                                           and derailments is down as well. Safety improvements at, and
                                                                           the reduction in number of, rail-highway grade crossings have
Operations and Maintenance                                                 reduced the number of train-vehicle accidents. Investments
Six Class I (national scale), one Class II (regional), and 11              in better track maintenance have likewise made derailments
Class III (local) firms operate Iowa’s rail network. The Class I           much less frequent.
firms hold 82% of the trackage and carry 97% of the rail ton-
miles. Operations are not uniformly distributed. According to              Yet new risks have arisen that are not yet fully dealt with. The
the Iowa DOT (2011 Iowa’s Rail System Trends), “One-fourth                 mass transports of energy liquids, such as ethanol and crude
of Iowa’s rail miles carried a majority of the rail traffic in 2011.       oil, have brought about the potential for even a small accident
Only 1,066 miles (27%) carried 88% of the gross ton-miles                  to have disastrous consequences. Recent derailment/
hauled in the state in 2011. Conversely, the remaining 2,914               explosions (outside Iowa) have shown the need for safer tank
miles (73%) accounted for the other 12% of the gross ton-                  cars and observation of special operating rules in moving
miles.”                                                                    such trains. The Federal Railroad Agency (FRA) and the rail
                                                                           industry are making a good effort to minimize these new risks,
Per a 2012 report prepared by the Iowa Department of                       but the process is not yet complete.
Transportation (DOT), “Iowa railroads spent an estimated
$233.3 million or an average of about $60,000 per mile to                  On an industry wide basis, railroads are adopting and installing
maintain the Iowa rail system in 2011 (See Figure 15). This                a system called Positive Train Control (PTC) to prevent train
compares to an average of about $23,500 per mile spent in                  accidents. Once in place, PTC could eliminate over speed,
1987. In addition, Iowa railroads spent an estimated $253.0                train-on-train collision and other mishaps caused by train-
million in 2011 to upgrade their tracks, an increase of $216.2             crew error or equipment failure. This won’t, however, eliminate
million over 1987.”                                                        vehicle-train crashes where the highway driver is at fault.

Amtrak operates two passenger train routes across Iowa.
One daily route goes across southern Iowa to link Chicago
                                                                           Resilience
                                                                           The rail system’s physical resilience appears good at this
and San Francisco. The other runs from Chicago, across the
                                                                           time. Most lines have been tested by flood events over the
desert southwest, to Los Angeles. These trains usually have
                                                                           last decade and weaknesses revealed by the high waters
two coaches, two sleepers, a lounge car, and a dining car.
                                                                           have been addressed. Perhaps the most crucial infrastructure
The full length trips take about 36 hours. Westbound trains
                                                                           vulnerability for rail in this regard is bridges. Many lines are
stop at Iowa stations in the evening; eastbound runs stop in
                                                                           operating with bridges built nearly 100 years ago. The loss
the mornings.
                                                                           of a structure over a major river can substantially interrupt
                                                                           traffic for extended time periods. Class I railroads have been
Figure 5- Amtrack routes in Iowa                                           addressing this issue proactively, with new structures over
                                                                           the Missouri and Mississippi either planned or built. The UP
                                                                           rebuilt the Kate Shelly span across the Des Moines River
                                                                           Valley in 2009, clearing a major bottleneck in their east-west
                                                                           main line. Smaller Class II and III lines, however, remain at
                                                                           risk of disruption or shut down if key structures are ever lost.

                                                                           On the other hand, the system’s operational resilience
                                                                           was found to be lacking during the winter of 2013-14 when
                                                                           extreme winter conditions slowed train movements and
                                                                           clogged terminals. Whether this was a one-time event or an
                                                                           indicator the system has only marginal amounts of surplus
                                                                           capacity available in times of stress or growth remains to be
                                                                           seen. It appears that future traffic increases will not be able
                                                                           to be accommodated just by enhancing the train capacity of
                                                                           existing track, it will become necessary to double or even
                                                                           triple track certain main line segments.

                                                                       7
C RAIL
Funding Ever increasing grain yields plus growing transcontinental
traffic will test the rail transport system capacity. To meet
Rail traffic in and across Iowa generates $2 billion in
the challenge, rail will need to upgrade many tracks to carry
transportation charges per year. After deducting operating
heavier cars, add spur tracks and participate in establishment
costs, the remainder is available to pay for maintenance,
of “shuttle train terminals,” where dedicated trains cycle in and
upgrades, profit, and taxes. In recent years, all railroads have
out 15 to 20 times a year. These setups can save 9 to 12 cents
had low enough operating ratios (cost of train operations as
per bushel when delivering grain to distant points.
a percentage of total revenue) to allow maintenance and
upgrade of tracks, bridges, and signals. The operating ratios
The changes in how railroads do business have tended to
of Class I firms have been holding steady, but those of the
work against smaller, less-than-trainload shippers, but that
Class II and III firms have been rising, putting their long term
may change. Recently, in 2014, there has been discussion of
viability into question. Coupled with the fact that rail costs
creating a “rail-port” in Des Moines. If constructed, this facility
are rising faster than rail revenues, this creates mild concern
would enable interchange of shipments between highway and
about the future.
rail and give low volume shippers access to rail service.
Passenger rail funding is inadequate to provide more than
The largest cloud on rail’s horizon is main line capacity. This
marginally acceptable continuance of existing service. Ticket
is an issue that affects both freight and passenger operations.
sales alone are unlikely to be able to directly pay the full cost
When the railroads began their long recovery after the 1980s,
of capital and operating needs. Other funding sources such
it was easy to accept new business because all trackage was
as the state, communities, and benefitting businesses may
underutilized. Traffic increases could be absorbed simply
be necessary to help with initial capital improvements and on-
by scheduling more trains. Today, however, some main line
going costs. Should the financial resources be found, in Iowa
segments have reached nearly 100% of physical capacity. At
and surrounding states, it would be possible to expand routes
that level of usage, even slight interruptions of the flow can
and services.
quickly cascade into major service disruptions. Further signal
and dispatch improvements may help, but, at some point,
Figure 6- the only way to accommodate the traffic will be to double or
triple track the line. This will make absorption of future traffic
increases much more expensive than has been the case over
the last 30 years. Freight charges will have to rise to permit
the investment.
Photo 2- BNSF
Future Need and Innovation Conclusion
While now less intense, the trends that have driven railroading
Iowa’s rail infrastructure has been awarded a C grade. Current
over the last 30 years can be expected to continue; the
capacity, condition, and operations are adequate for existing
network will shrink further as the industry works to serve
traffic, but key main lines can quickly coagulate if adverse
fewer but larger shipping terminals with more efficient train
circumstances interrupt train movements or if the train count
operations. Abandonment of lesser used lines will be balanced
exceeds practical track capacity. Resilience and safety are
by upgrades to the ones that remain.
up, but some oil transport accident potential and declining
8C RAIL
operating ratios are concerns. Heavier cars will necessitate
upgrades to branch lines – or induce their abandonment.
Passenger service and funding is very limited and prospects
for improvement are not imminent. The rail industry has
aggressively worked to become more efficient, with great
results, but will find itself challenged to accommodate future
traffic growth without increased rates, which could induce
calls for re-regulation.
Photo 3- Osceola Amtrak station
Recommendations
Because railroad infrastructure is primarily owned and
operated by private sector businesses, Iowa must work with
the railroads to address issues and influence outcomes. Iowa
should support the industry's effort to obtain the capital needed
to maintain and improve service. Rail crossing safety programs
managed through the Iowa DOT should be continued, and
Iowa’s leaders should monitor the implementation of tank
car safety rules and positive train control. State and local
assistance for new spur lines and high volume terminals is
encouraged, as rail companies often require shippers to
pay for new connections. Iowans should seek to come to
a consensus on passenger rail needs, identify where the
support for those needs are, and then find ways to fund it.
Resources:
Iowa State Rail Plan, Iowa Department of Transportation,
2009, http://www.iowadot.gov/iowainmotion/rail.html
Iowa Rail Transport web site, Iowa Department of
Transportation, 2014, http://www.iowadot.gov/iowarail/index.
htm
Website, American Association of Railroads, 2014, https://
www.aar.org/
Website, Federal Railroad Administration, US Department of
Transportation, http://www.fra.dot.gov/Page/P0001
9D INLAND WATERWAYS
Summary Background
Inland waterways are vital to the economy of the United Iowa is in the unique position of being the only state bordered
States as they provide means for efficient movement of goods by two navigable waterways - the Mississippi and Missouri
up and down the rivers, to and from coastal water bodies. Rivers. Along the Iowa border on the Mississippi River, Lock
Specific to Iowa, the Mississippi River connects Iowa products and Dam 9 is the furthest upstream; Lock and Dam 19 is the
and exports to world-wide markets. Grain exports to Asia furthest downstream. The total tonnage transported through
are expected to increase with the expansion of the Panama Lock and Dam 19 on the Mississippi River, in 2011, was 20
Canal and will help to stimulate and grow the U.S. economy million tons with an economic value of over $3 billion. Goods
into the future. Even though, compared to other modes of shipped included grain, coal, chemicals, and gravel among
transportation, barge transport results in fewer accidents, loss other commodities. The total value of commodities shipped on
of life, and greenhouse gas emissions, barge transport along the Mississippi River has been falling in recent years, mainly
Iowa’s inland waterway system has decreased in recent years due to system performance and reliability issues. Comparably,
due to reliability and performance issues. Several studies have the economic value of the commodities shipped to and from
shown the lock and dam system on the Upper Mississippi Iowa on the Missouri River has fallen to zero. Between 1999
River, including the facilities bordering Iowa, is operating and 2006 the total tonnage of goods shipped to and from Iowa
on the Missouri River was cumulatively 2.5 million tons and
Figure 1- Lock and dam had actually fallen to zero by 2004. Though it is navigable, the
Missouri River has not largely been involved in the transport
of goods to and from Iowa in recent years, due to fluctuating
water levels. However, due to above normal releases at the
lower four dams on the Missouri River, increases in shipping
north toward Sioux City are being seen for the first time in 11
years.
Based on macro economic trends, Iowa freight flows are
expected to increase from 453 million tons in 2010 to 620
million tons in 2040, or an increase of nearly 37%. The share
of Iowa’s freight traveling on inland waterways is expected to
increase from 6.9 million tons in 2010 to 9.7 million tons in
2040, an increase of nearly 41%.
International competitiveness depends on being able to ship
goods at low cost. In 2011, shipping a metric ton of soybeans
from Iowa to China was 18% of the total cost to the Chinese
consumer compared to 32% of the total cost to the Chinese
consumer of shipping from Brazil to China. As transportation
costs increase, the competitive advantage will disappear.
long past design life. Facilities are undersized compared
to the size of modern barges and unexpected repairs have Capacity and Condition
been hindering the use of the lock and dam system, forcing The major issue with the expected increase in goods
shippers to use rail and truck transport for their goods. transported by Iowa’s inland waterways system is the current
Despite the fact this mode of transport is safe, efficient, and system is taxed beyond its capacity to effectively meet the
sustainable, no long term funding source has been identified current demand for shipping via barge. Without significant
to fund the modernization of the inland waterway system changes in capacity, it will be impractical to meet the increase
that will help keep Iowa and the United States competitive in demand for Iowa products. With the exception of Lock and
in the global economy. Modernization of the inland waterway Dam 19, the lock and dams that make up the Iowa inland
system is a very challenging and capital intensive task. waterways system were designed and opened in 1940 and
Stakeholder organizations from across the Upper Midwest as before. Lock and Dam 19 was opened in 1957. The entire
well as the Iowa Department of Transportation (DOT) and the system has exceeded its design life by an average of more than
United States Army Corps of Engineers (USACE) have been 20 years. All but one lock along Iowa border are undersized
diligently working to identify cost-effective, environmentally by half for today’s barges. Of the 13 locks and dams along the
sensitive, and safe solutions for modernization of the U.S. Iowa border, only one, at Lock and Dam 19, is long enough
inland waterway system. to accommodate the modern tow length (1,200 ft). The other
12 are only 600 ft. long. This results in longer shipping times
10D INLAND WATERWAYS
as the cumulative impact of shipping delays along the Iowa a sincere interest in seeing the continued maintenance,
border can be longer than five hours. operations, and modernization of our nations’ inland waterway
navigation system. However, it is clear that the existing, inland
Grain comprises the highest commodity tonnage transported waterway navigation system is at a critical juncture for funding
on Iowa’s inland waterway system. However, from 2006 repairs, maintenance and system enhancements that will
through 2010, the total grain export tonnage transported be required to remain economically competitive. As such, it
by barge decreased by 20% at a time when overall crop was proposed the State of Iowa undertake activities that may
production was increasing. The average delay at locks along help realize improvements to the inland waterway navigation
Iowa’s border is 1.5 hours per barge leading to increased system.
costs for shipping.
No increase in the current funding plan will result in loss of
The average age of the lock and dams along the Iowa border
is more than 70 years old. This is more than 20 years past Photo 1
the average design life. Between the years 2001 to 2010,
unscheduled repairs to locks along the Iowa border accounted
for more than 50% of total repairs resulting in major delays to
the supply chain and increased costs to consumers.
On a per ton per mile basis, barge traffic has lower greenhouse
gas emissions than rail or truck freight transportation
Operations and Maintenance
The US Army Corps of Engineers operates and maintains
the fixed base that supports river transport: locks and dams,
navigational markers, dredging, obstruction removal and
regulates docks, landings, and terminals. Simultaneously,
large sections of natural refuge are managed to preserve
habitats for various species found along the river corridors. economic benefits and a missed opportunity for Iowa to take
economic advantage of the plans for expansion of the Panama
Funding Canal (i.e., opportunities to increase grain shipments).
Current national funding levels can support only $7 billion
through 2020 and $16 billion through 2040. To maintain Leveraging increased funding from traditional sources is the
current levels of services and based on existing data trends, only practical option to deal with the funding issues in the
$13 billion will be required by 2020 and $28 billion by 2040. short term.
Federal funding levels for the inland waterway system have
been decreasing since 2006 despite an increase in production
of commodities that can be shipped via barge.
Recommendations
The State of Iowa should encourage the U.S. Congress to
ensure the existence of opportunities for pilot programs
Public Safety that would allow non-federal sponsors the ability to
rehabilitate, improve, operate, and maintain federal projects.
Due to unscheduled maintenance issues and decreased
performance and reliability of the inland waterway system, It is recommended that such opportunities be identified and
barge tonnage has decreased while truck tonnage has presented to legislators for sponsorship.
increased. This leads to an increase in truck mileage. The
cost of accidents per mile due to truck traffic is 327 times the Encourage Congress to ensure opportunities for alternative
cost of accidents per mile due to barge traffic. Fatalities per project delivery and funding mechanisms (user fees,
billion ton miles due to truck traffic are 254 times the fatalities private investments) for existing and proposed civil works
per billion ton miles due to barge traffic. and navigation projects. There has been continued dialog
between Iowa DOT, USACE, and other states regarding ways
to utilize 2014 Water Resources Reform and Development
Conclusions Act (WRRDA) provisions for P3 and pilot projects.
Several key findings and recommended actions were outlined
in the Iowa DOT report (Iowa DOT 2013) to address the funding Pursue adequate funding for both ongoing and pilot USACE
gaps in the inland waterways system. The State of Iowa has Civil Works and Navigation programs. There has been
11D INLAND WATERWAYS
continued dialog between Iowa DOT, USACE, and other Photo 2
states regarding ways to utilize 2014 WRRDA provisions for
P3 and pilot projects.
Ask Congress to raise the excise tax on diesel fuel from $0.20
per gallon to $0.30 per gallon and index the tax for inflation,
to provide more adequate funding for the Inland Waterway
Trust Fund.
Authorize the USACE to study additional funding mechanisms
(recreational fees, lockage fees, tonnage fees, etc.) to provide
for more adequate funding for the inland waterway system.
Iowa should form a coalition of Upper Mississippi River states
(Minnesota, Wisconsin, Iowa, Illinois, and Missouri) and inland
waterway interest groups (agriculture producers/businesses,
barge operators, shippers, environmental stakeholders) to
drive a legislative agenda in Washington, DC, to address
funding and legislative changes needed to modernize the
Upper Mississippi River System. A TIGER grant application
in 2013 was a recent example of cooperation by this coalition.
Resources:
American Society of Civil Engineers (2012). “Failure to Act:
The Economic Impact of Current Investment
http://www.asce.org/uploadedFiles/Infrastructure/Failure_to
Act/Failure To Act Ports Economic
Inland Rivers Ports and Terminals (2014). October 20th,
2014. http://www.irpt.net/missouri-river-booming/
Iowa Department of Transportation (2012). “Iowa in Motion –
Planning Ahead 2040.”
Iowa Department of Transportation (2013). “ U.S. Inland
Waterway Modernization Reconnaissance Study.”
Soy Transportation Coalition (2012). “Land of Two Rivers.”
Moving Iowa forward Conference. April 24, 2012.
Texas Transportation Institute (2009), “A Modal Comparison
of Domestic Freight Transportation Effects on the General
Public.” Center for Ports and Waterways. (2009): 1-83
Available online at http://www.americanwaterways.com
press_room/news_releases/NWFSTudy.pdf.
Trends in Airports, Inland Waterways, and Marine Ports
(2012): 1-48. Web.
United States Government Accountability Office (2009).
“Missouri River Navigation: Data on Commodity Shipments
for Four States Served by the Missouri River and Two States
Served by Both the Missouri and Mississippi Rivers.”
12C- ROADS
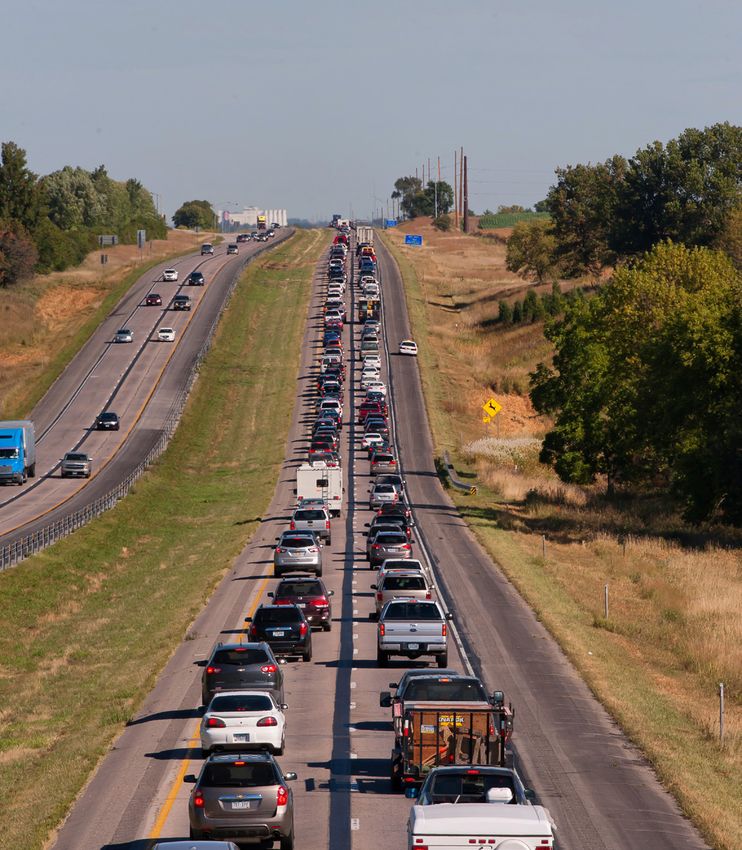
Summary Photo 1
A majority of Iowa’s roadways were built 50 to 60 years
ago and the design life of these streets and highways has
been met or exceeded. Traffic volumes, most notably truck
traffic, have increased by approximately 123% on primary
roadways over the last 30 years, and pavement conditions are
deteriorating across the system. About one quarter of Iowa’s
primary roadways fails to meet a sufficiency rating considered
minimally acceptable. The rural Interstate system in Iowa was
ranked 38th in the nation in 2010 which was a six point decline
from its 32nd rating in 2006. On a positive note, the number
of fatalities and major injuries on Iowa roadways has been
decreasing over the last 10 years. The uncertainties in funding
the state has experienced on the local, state, and federal level
are not beneficial to a system that requires an additional $215
million per year to address its most critical needs and is facing
a total annual shortfall of $1.6 billion for all roadway needs.
36% since 1990.
Background While traffic volumes have been increasing, the condition of
Iowa’s roadway system is the major means of travel and the roads has been decreasing. A significant portion of the
commerce for the state. Iowa’s roadways include six lane pavement condition of the primary system is below acceptable
interstates, four lane divided thoroughfares, multilane urban levels, and approximately one quarter of the primary system
streets, paved secondary roads, gravel streets, and city does not meet acceptable sufficiency ratings.
streets. The public system includes more than 114,000 miles
of roads, which places Iowa 13th in the nation in terms of total
roadway miles. Based on the information presented in this Capacity
report, the roadway system in the state of Iowa receives a Capacity is a measure of a roadway’s ability to meet current and
grade of C -. future vehicular travel demands. Capacity can be evaluated
by several means including the volume/capacity ratio, travel
Three interstate highways cross this state in the heartland time, traffic speed relative to posted speed, and costs from
of America, connecting customers and suppliers throughout delays for excess gas consumption and unproductive time.
the United States. Interstate 80 is a coast-to-coast interstate In Iowa there are 9,400 miles of primary (interstate, U.S.
connecting California to New York City. Interstate 35 is a routes, and state routes) roadway, 89,866 miles of secondary
vital north/south route from Minnesota to Texas. Interstate roadway, and 14,887 miles of municipal roadways.
29 connects the Kansas City, Missouri, metro area to the
Canadian border. These transcontinental interstates make A majority of the rural areas served by the roadway system do
Iowa a major hub of goods and services movements in the not have capacity deficiencies except during holiday periods
U.S. In 2012, it is estimated that motor vehicles on the public on some of the primary routes. Most of the rural areas of Iowa
roadway system traveled over 31 billion miles. Of the almost are served by a roadway network that has roads spaced on a
8% of roadway mileage managed by the Iowa Department of one mile grid.
Transportation (DOT), those roads carried almost 62% of all
vehicular traffic in 2012. The primary system makes up approximately 8% of the total
roadway system, but it carries 62% of the total vehicle miles
The roadway system plays a major role in the state’s economic traveled (VMT) in the state. The primary system also carries
competitiveness, and it is the primary means by which all approximately 92% of the total large truck VMT. Large truck
transportation within the state is linked. Businesses locate traffic is projected to increase on Iowa’s highways. Large truck
near the highway system in order to efficiently move goods traffic on the primary system has increased 123% over the
and people. The roadway system also enables the growth of last 30 years with the greatest truck traffic on Interstate 80
the biofuels and wind energy industries which are crucial to in eastern Iowa. Truck traffic on the secondary system has
Iowa’s role in the alternative fuel/energy sector of the economy. also increased substantially. Based on current trends, large
Although the extent of the roadway system in Iowa has not truck traffic will increase about 66% between now and 2040
increased considerably for several years, the amount of traffic (see Figure 1). This increase in truck traffic will have a definite
has increased significantly. Truck traffic has increased 42% impact on Iowa’s highways via increased congestion and
since 1990, and total travel on Iowa’s roadways has increased pavement deterioration.
13C- ROADS
4500 Figure 1- Large truck VMT by jurisdiction, 1980-2040
4000 Municipal
Secondary
3500 Primary
3000
2500
2000
1500
1000
500
0
10
80
00
20
30
90
40
20
19
20
20
20
19
20
Condition Figure 2-
Condition is a measure of the physical soundness of the
components of a roadway system. The components of a
roadway system can include pavement, signage, drainage
structures, bridges, erosion control measures, buildings, and
vegetation. This section will focus on the roadway surface
only since it is a major component of virtually all roadway
systems. In Iowa, roadways are graded using two methods:
the International Roughness Index (IRI) and the Pavement
Condition Index (PCI).
The IRI is essentially an indicator of the smoothness of
a pavement. The IRI can vary by season and in Iowa the
roughness is generally greater in the winter than the other
times of the year. The IRI is one of the most commonly used
systems for evaluating pavement roughness in the world,
and it is required by the Federal Highway Administration
(FHWA) for pavement data submission. The IRI is obtained
from measurements of the longitudinal profile of a roadway.
In Iowa, the primary roadways have been classified as good,
fair, and poor based on IRI data.
Many of Iowa’s roadways were constructed in the 1940s,
The PCI uses a scale of 0 to 100 to quantify the condition of 1950s, and 1960s. These roadway pavements are meeting
a pavement. A rating of good, fair, or poor is then assigned to or exceeding their design life spans and thus a large part
a pavement based on the scale value. A value greater than or of the system is in need of repair and replacement. A study
equal to 80 receives a good grade, a value between 60 and published by the Reason Foundation compared the roadways
80 receives a fair rating, and values less than 60 receive a of each state using data that was submitted to the FHWA.
poor mark. Approximately 46.5% of primary roadways in Iowa Table 2 lists Iowa’s ranking in the nation in several measures
receive a good rating. Figure 2 illustrates the combined IRI (a ranking of 1 is best and 50 is worst).
and PCI ratings for primary roadways in Iowa. A summary of
the ratings is shown in Table 1. The rural arterial condition improved somewhat between 2006
and 2008. Conditions in the other categories either remained
The PCI rating of the primary road system has been decreasing, the same or decreased with the exception of the urban
and a large portion of the system is below acceptable PCI interstate condition.
ratings (see Figure 3).
14You can also read