Review article: How does glacier discharge affect marine biogeochemistry and primary production in the Arctic? - The Cryosphere
←
→
Page content transcription
If your browser does not render page correctly, please read the page content below
The Cryosphere, 14, 1347–1383, 2020
https://doi.org/10.5194/tc-14-1347-2020
© Author(s) 2020. This work is distributed under
the Creative Commons Attribution 4.0 License.

Review article: How does glacier discharge affect marine
biogeochemistry and primary production in the Arctic?
Mark J. Hopwood1 , Dustin Carroll2 , Thorben Dunse3,4 , Andy Hodson3,5 , Johnna M. Holding6 , José L. Iriarte7 ,
Sofia Ribeiro8 , Eric P. Achterberg1 , Carolina Cantoni9 , Daniel F. Carlson14 , Melissa Chierici5,10 , Jennifer S. Clarke1 ,
Stefano Cozzi9 , Agneta Fransson11 , Thomas Juul-Pedersen12 , Mie H. S. Winding12 , and Lorenz Meire12,13
1 GEOMAR       Helmholtz Centre for Ocean Research Kiel, Kiel, Germany
2 Moss   Landing Marine Laboratories, San José State University, Moss Landing, CA
3 Western Norway University of Applied Sciences, Sogndal, Norway
4 The University of Oslo, Oslo, Norway
5 The University Centre in Svalbard, Longyearbyen, Svalbard
6 Department of Bioscience, Aarhus University, Silkeborg, Denmark
7 Instituto de Acuicultura and Centro Dinámica de Ecosistemas Marinos de Altas Latitudes – IDEAL,

Universidad Austral de Chile, Puerto Montt, Chile
8 Geological Survey of Denmark and Greenland, Copenhagen, Denmark
9 CNR-ISMAR Istituto di Scienze Marine, Trieste, Italy
10 Institute of Marine Research, Fram Centre, Tromsø, Norway
11 Norwegian Polar Institute, Fram Centre, Tromsø, Norway
12 Greenland Climate Research Centre, Greenland Institute of Natural Resources, Nuuk, Greenland
13 Royal Netherlands Institute for Sea Research, and Utrecht University, Yerseke, the Netherlands
14 Institute of Coastal Research, Helmholtz-Zentrum Geesthacht, Centre for Materials and Coastal Research,

Geesthacht, Germany

Correspondence: Mark J. Hopwood (mhopwood@geomar.de)

Received: 3 June 2019 – Discussion started: 18 June 2019
Revised: 27 January 2020 – Accepted: 27 February 2020 – Published: 24 April 2020

Abstract. Freshwater discharge from glaciers is increas-          tic case studies (Nuup Kangerlua/Godthåbsfjord, Kongsfjor-
ing across the Arctic in response to anthropogenic climate        den, Kangerluarsuup Sermia/Bowdoin Fjord, Young Sound
change, which raises questions about the potential down-          and Sermilik Fjord), the interconnected effects of freshwa-
stream effects in the marine environment. Whilst a combi-         ter discharge on fjord–shelf exchange, nutrient availability,
nation of long-term monitoring programmes and intensive           the carbonate system, the carbon cycle and the microbial
Arctic field campaigns have improved our knowledge of             food web are investigated. Key findings are that whether
glacier–ocean interactions in recent years, especially with re-   the effect of glacier discharge on marine primary produc-
spect to fjord/ocean circulation, there are extensive knowl-      tion is positive or negative is highly dependent on a com-
edge gaps concerning how glaciers affect marine biogeo-           bination of factors. These include glacier type (marine-
chemistry and productivity. Following two cross-cutting dis-      or land-terminating), fjord–glacier geometry and the lim-
ciplinary International Arctic Science Committee (IASC)           iting resource(s) for phytoplankton growth in a specific
workshops addressing the importance of glaciers for the ma-       spatio-temporal region (light, macronutrients or micronu-
rine ecosystem, here we review the state of the art con-          trients). Arctic glacier fjords therefore often exhibit dis-
cerning how freshwater discharge affects the marine en-           tinct discharge–productivity relationships, and multiple case-
vironment with a specific focus on marine biogeochem-             studies must be considered in order to understand the net ef-
istry and biological productivity. Using a series of Arc-         fects of glacier discharge on Arctic marine ecosystems.

Published by Copernicus Publications on behalf of the European Geosciences Union.
1348                                                                     M. J. Hopwood et al.: Effects of glaciers in the Arctic

1   Introduction                                                   glacier catchments with different characteristics (Fig. 1), we
                                                                   provide answers to three questions arising from two interdis-
Annual freshwater discharge volume from glaciers has in-           ciplinary workshops on the importance of Arctic glaciers for
creased globally in recent decades (Rignot et al., 2013; Bam-      the marine ecosystem under the umbrella of the International
ber et al., 2018; Mouginot et al., 2019) and will continue to      Arctic Science Committee (IASC).
do so across most Arctic regions until at least the middle
of this century under a Representative Concentration Path-             1. Where and when does glacial freshwater discharge pro-
way (RCP) 4.5 climate scenario (Bliss et al., 2014; Huss and              mote or reduce marine primary production?
Hock, 2018). This increase in discharge (surface runoff and
                                                                       2. How does spatio-temporal variability in glacial dis-
subsurface discharge into the ocean) raises questions about
                                                                          charge affect marine primary production?
the downstream effects in marine ecosystems, particularly
with respect to ecosystem services such as carbon seques-              3. How far-reaching are the effects of glacial discharge on
tration and fisheries (Meire et al., 2015, 2017; Milner et al.,           marine biogeochemistry?
2017). In order to understand the effect of glaciers on the
present-day marine environment and under future climate
scenarios, knowledge of the physical and chemical perturba-        2    Fjords as critical zones for glacier–ocean interactions
tions occurring in the water column as a result of glacier dis-
charge and the structure, function, and resilience of ecosys-      In the Arctic and sub-Antarctic, most glacial discharge enters
tems within these regions must be synthesized.                     the ocean through fjord systems (Iriarte et al., 2014; Straneo
   Quantifying the magnitude of environmental perturbations        and Cenedese, 2015). The strong lateral gradients and sea-
from glacial discharge is complicated by the multiple concur-      sonal changes in environmental conditions associated with
rent, and occasionally counteracting, effects that glacial dis-    glacial discharge in these coastal environments differentiate
charge has in the marine environment. For example, ice-rock        these ecosystems from offshore systems (Arendt et al., 2013;
abrasion means that glacially fed rivers can carry higher sed-     Lydersen et al., 2014; Krawczyk et al., 2018). Fjords can be
iment loads than temperate rivers (Chu et al., 2009; Overeem       efficient sinks for organic carbon (Smith et al., 2015) and
et al., 2017). Extensive sediment plumes where glacier dis-        CO2 (Rysgaard et al., 2012; Fransson et al., 2015), sustain
charge first enters the ocean limit light penetration into the     locally important fisheries (Meire et al., 2017) and are critical
water column (Murray et al., 2015; Halbach et al., 2019),          zones for deep mixing which dictate how glacially modified
and ingestion of glacial flour particles can be hazardous, or      waters are exchanged with the coastal ocean (Mortensen et
even fatal, to zooplankton, krill and benthic fauna (White         al., 2014; Straneo and Cenedese, 2015; Beaird et al., 2018).
and Dagg, 1989; Włodarska-Kowalczuk and Pearson, 2004;             Fjord-scale processes therefore comprise an integral part of
Arendt et al., 2011; Fuentes et al., 2016). However, these         all questions concerning how glacial discharge affects Arctic
plumes also provide elevated concentrations of inorganic           coastal primary production (Arimitsu et al., 2012; Renner et
components such as calcium carbonate, which affects sea-           al., 2012; Meire et al., 2017).
water alkalinity (Yde et al., 2014; Fransson et al., 2015),           Fjords act as highly stratified estuaries and provide a path-
and dissolved silicic acid (hereafter Si) (Brown et al., 2010;     way for the exchange of heat, salt, and nutrients between
Meire et al., 2016a) and iron (Fe) (Statham et al., 2008; Lip-     near-glacier waters and adjacent coastal regions (Mortensen
piatt et al., 2010), which can potentially increase marine pri-    et al., 2014, 2018; Straneo and Cenedese, 2015). In deep
mary production (Gerringa et al., 2012; Meire et al., 2016a).      fjords, such as those around much of the periphery of Green-
   The impacts of glacier discharge can also depend upon the       land, warm, saline water is typically found at depth (>
spatial and temporal scales investigated (van de Poll et al.,      200 m), overlaid by cold, fresher water and, during summer,
2018). In semi-enclosed Arctic coastal regions and fjord sys-      a thin layer (∼ 50 m or less) of relatively warm near-surface
tems, summertime discharge typically produces strong, near-        water (Straneo et al., 2012). The injection of freshwater into
surface stratification. This results in a shallow, nutrient-poor   fjords from subglacial discharge (Xu et al., 2012; Carroll et
layer which reduces primary production and drives phyto-           al., 2015) and terminus (Slater et al., 2018) and iceberg melt
plankton biomass deeper in the water column (Rysgaard et           (Moon et al., 2018) can drive substantial buoyancy-driven
al., 1999; Juul-Pedersen et al., 2015; Meire et al., 2017).        flows in the fjord (Carroll et al., 2015, 2017; Jackson et al.,
On broader scales across continental shelves, freshening can       2017), which amplify exchange with the shelf system as well
similarly reduce vertical nutrient supply throughout summer        as submarine melting and the calving rates of glacier termini.
(Coupel et al., 2015) but may also impede the breakdown of         To date, such modifications to circulation and exchange be-
stratification in autumn, thereby extending the phytoplank-        tween glacier fjords and shelf waters have primarily been
ton growing season (Oliver et al., 2018). Key research ques-       studied in terms of their effects on ocean physics and melt-
tions are how and on what spatial and temporal timescales          ing at glacier termini, yet they also have profound impacts on
these different effects interact to enhance, or reduce, marine     marine productivity (Meire et al., 2016a; Kanna et al., 2018;
primary production. Using a synthesis of field studies from        Torsvik et al., 2019).

The Cryosphere, 14, 1347–1383, 2020                                                     www.the-cryosphere.net/14/1347/2020/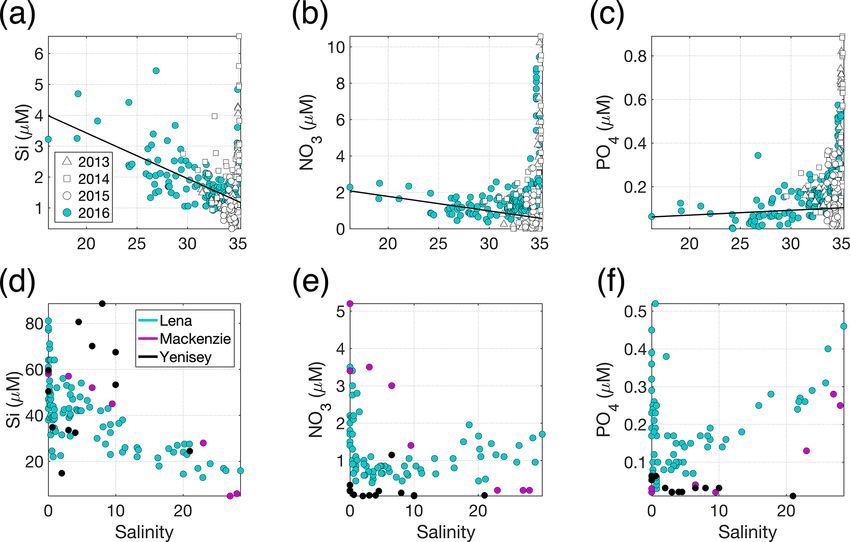
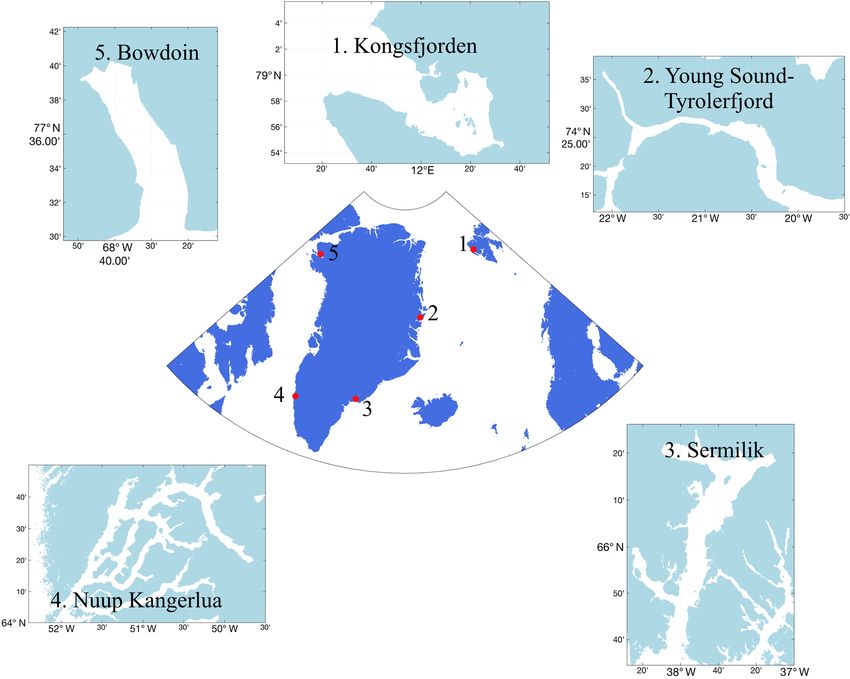
M. J. Hopwood et al.: Effects of glaciers in the Arctic                                                                              1349

Figure 1. Locations of five key Arctic field sites, where extensive work bridging the glacier and marine domains has been conducted,
discussed herein in order to advance understanding of glacier–ocean interactions. 1: Kongsfjorden (Svalbard); 2: Young Sound (E Greenland);
3: Sermilik (SE Greenland); 4: Nuup Kangerlua/Godthåbsfjord (SW Greenland); 5: Bowdoin Fjord/Kangerluarsuup Sermia (NW Greenland).

   While renewal of fjord waters from buoyancy-driven                   These changes affect the availability of the resources which
processes is mainly thought to occur over seasonal to                   constrain local primary production (Meire et al., 2016b;
sub-annual timescales (Gladish et al., 2014; Mortensen                  Arimitsu et al., 2016; Calleja et al., 2017).
et al., 2014; Carroll et al., 2017), energetic shelf forcing
(i.e. from coastal/katabatic winds and coastally trapped
waves) can result in rapid exchange over synoptic timescales
(Straneo et al., 2010; Jackson et al., 2014; Moffat, 2014)
and similarly also affect marine productivity (Meire et al.,
2016b). Katabatic winds are common features of glaciated
fjords. Down-fjord wind events facilitate the removal of
low-salinity surface waters and ice from glacier fjords, as
well as the inflow of warmer, saline waters at depth (Johnson
et al., 2011). The frequency, direction and intensity of wind
events throughout the year thus adds further complexity to                 Fjord–shelf processes also contribute to the exchange of
the effect that fjord geometry has on fjord–shelf exchange              active cells and microbial species’ resting stages, thus pre-
processes (Cushman-Roisin et al., 1994; Spall et al., 2017).            conditioning primary production prior to the onset of the
Topographic features such as sills and lateral constrictions            growth season (Krawczyk et al., 2015, 2018). Protists (uni-
can exert a strong control on fjord–shelf exchange (Gladish             cellular eukaryotes) are the main marine primary produc-
et al., 2014; Carroll et al., 2017, 2018). Ultimately, circu-           ers in the Arctic. This highly specialized and diverse group
lation can thereby vary considerably depending on fjord                 includes species that are ice-associated (sympagic) and/or
geometry and the relative contributions from buoyancy, wind             pelagic. Many protists in fjords and coastal areas of the Arc-
and shelf forcing (Straneo and Cenedese, 2015; Jackson                  tic maintain diverse seed banks of resting stages, which pro-
et al., 2018). Some variability in the spatial patterns of              motes the resilience and adaptability of species on timescales
primary production is therefore expected between Arctic                 from seasons to decades (Ellegaard and Ribeiro, 2018). Yet
glacier fjord systems as differences in geometry and forcing            seawater inflow into fjords can still change the dominant
affect exchange with the shelf and water column structure.              species within a single season. In Nuup Kangerlua (Godthåb-

www.the-cryosphere.net/14/1347/2020/                                                           The Cryosphere, 14, 1347–1383, 2020
1350                                                                       M. J. Hopwood et al.: Effects of glaciers in the Arctic

                                                                          Large inter- and intra-fjord differences in primary produc-
                                                                       tion are demonstrated by field observations around the Arctic
                                                                       which show that glacier fjords range considerably in produc-
                                                                       tivity from very low (< 40 mg C m−2 d−1 ) to moderately pro-
                                                                       ductive systems (> 500 mg C m−2 d−1 ) during the meltwater
                                                                       season (e.g. Jensen et al., 1999; Rysgaard et al., 1999; Hop et
                                                                       al., 2002; Meire et al., 2017). For comparison, the pan-Arctic
                                                                       basin exhibits a mean production of 420 ± 26 mg C m−2 d−1
                                                                       (mean March–September 1998–2006) (Pabi et al., 2008),
                                                                       which has increased across most regions in recent decades
                                                                       due to reduced summertime sea-ice coverage (Arrigo and van
                                                                       Dijken, 2015), and summertime (May–August) Arctic shelf
Figure 2. Primary production for Arctic glacier fjord systems in-      environments exhibit a range of 360–1500 mg C m−2 d−1
cluding Disko Bay (Andersen, 1977; Nielsen and Hansen, 1995;
                                                                       (Pabi et al., 2008). So is it possible to generalize how pro-
Jensen et al., 1999; Nielsen, 1999; Levinsen and Nielsen, 2002),
Godthåbsfjord (Juul-Pedersen et al., 2015; Meire et al., 2017),
                                                                       ductive Arctic glacier fjords are?
Kangerlussuaq (Lund-Hansen et al., 2018), Kongsfjorden (Hop et            Extensive measurements of primary production through-
al., 2002; Iversen and Seuthe, 2011; Hodal et al., 2012; van de Poll   out the growth season in glacier fjords are only available
et al., 2018), Nordvestfjord/Scoresby Sund (Seifert et al., 2019),     for Godthåbsfjord (Juul-Pedersen et al., 2015; Meire et al.,
Hornsund (Smoła et al., 2017), Young Sound (Rysgaard et al.,           2017), Young Sound (Rysgaard et al., 1999; Meire et al.,
1999; Meire et al., 2017; Holding et al., 2019), the Canadian Arc-     2017; Holding et al., 2019), Glacier Bay (Alaska, Reisdorph
tic Archipelago (Harrison et al., 1982) and Glacier Bay (Reis-         and Mathis, 2015), Hornsund (Svalbard, Smoła et al., 2017)
dorph and Mathis, 2015). Circles represent glacier fjords, trian-      and Kongsfjorden (Iversen and Seuthe, 2011; van de Poll et
gles are sites beyond glacier fjords and bold markers are < 80 km      al., 2018). Observations elsewhere are sparse and typically
from a marine-terminating glacier. Error bars are standard devia-      limited to summertime-only data. Generalizing across mul-
tions for stations where multiple measurements were made at the
                                                                       tiple Arctic glacier fjord systems therefore becomes chal-
same station. Dashed line is the pan-Arctic mean primary produc-
tion (March–September). Shaded area is the pan-Arctic shelf range
                                                                       lenging due to the paucity of data and the different ge-
of primary production for May–August (Pabi et al., 2008).              ographic and seasonal context of individual primary pro-
                                                                       duction data points (Fig. 2). Furthermore there are poten-
                                                                       tially some methodological implications when comparing
sfjord), the spring phytoplankton bloom is typically domi-             direct measurements of primary production using 14 C up-
nated by Fragilariopsis spp. diatoms and Phaeocystis spp.              take (e.g. Holding et al., 2019), with estimates derived from
haptophytes. Unusually prolonged coastal seawater inflow               changes in water column macronutrient (e.g. Seifert et al.,
in spring 2009 led to the mass occurrence of chain-forming             2019) or dissolved inorganic carbon (e.g. Reisdorph and
Thalassiosira spp. diatoms and the complete absence of the             Mathis, 2015) inventories.
normally abundant Phaeocystis spp. (Krawczyk et al., 2015)                Nevertheless, some quantitative comparison can be made
– a pattern which has been found elsewhere in the Arctic,              if we confine discussion to months where a meltwater signal
including Kongsfjorden (Hegseth and Tverberg, 2013).                   may be evident in most glaciated regions (July–September).
                                                                       All available data for Arctic glaciated regions can then be
                                                                       pooled according to whether it refers to primary production
3   Pelagic primary production in Arctic glacier fjords                within a glacier fjord and whether or not it could plausibly
                                                                       be influenced by the presence of a marine-terminating glacier
Key factors controlling rates of primary production across             (see Sect. 5). For the purposes of defining the spatial extent
Arctic marine environments are light availability, nutrient            of individual glacier fjords, we consider broad bay areas such
availability and grazing (Nielsen, 1999; Taylor et al., 2013;          as the lower and central parts of Glacier Bay (Etherington
Arrigo and van Dijken, 2015; Tremblay et al., 2015). Sea-              and Hooge, 2007; Reisdorph and Mathis, 2015), Scoresby
sonal changes in the availability of bioessential resources, the       Sund (Scoresby Sound in English; Seifert et al., 2019) and
structure of the water column and the feeding patterns of zoo-         Disko Bay (Jensen et al., 1999; Nielsen, 1999) to be be-
plankton thereby interact to produce distinct bloom periods            yond the scale of the associated glacier fjords on the basis of
of high primary production shouldered by periods of low pri-           the oceanographic interpretation presented in the respective
mary production. In glacier fjords, strong lateral and vertical        studies. Defining the potential spatial influence of marine-
gradients in some, or all, of these factors create a far more dy-      terminating glaciers is more challenging. Using observations
namic situation for primary producers than in the open ocean           from Godthåbsfjord, where primary production is found to be
(Etherington and Hooge, 2007; Arendt et al., 2010; Murray              affected on a scale of 30–80 km down-fjord from the marine-
et al., 2015).                                                         terminating glaciers therein (Meire et al., 2017), we define

The Cryosphere, 14, 1347–1383, 2020                                                        www.the-cryosphere.net/14/1347/2020/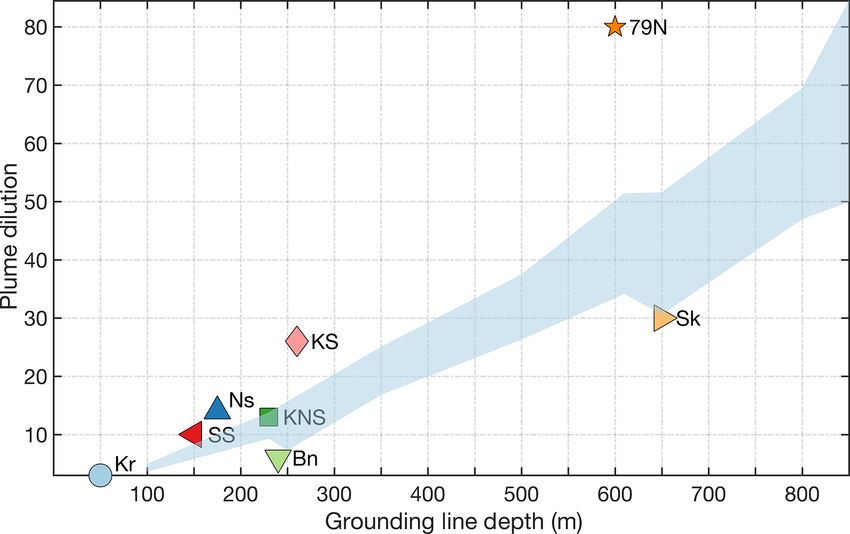
M. J. Hopwood et al.: Effects of glaciers in the Arctic                                                                     1351

a region < 80 km downstream of calving fronts as being po-
tentially influenced by marine-terminating glaciers.
   Four exclusive categories of primary production data re-
sult (Table 1). Primary production for group I is significantly
higher than any other group, and group II is also signifi-
cantly higher than group IV (p < 0.025). Primary production
is higher in regions designated as having a potential marine-
terminating glacier influence. On the contrary, other near-
glacier regions (i.e. with land-terminating glaciers) seem to
have low summertime primary productivity, irrespective of            A notable feature of glacial freshwater outflows into the
how mean Arctic primary production is defined (Table 1).          ocean is the high turbidity that occurs in most Arctic glacier
What processes could lead to such differences? In the next        fjords. High turbidity in surface waters within glacier fjords
sections of this review we discuss the biogeochemical fea-        arises from the high sediment transport in these drainage sys-
tures of glacier-affected marine regions that could potentially   tems (Chu et al., 2012), from iceberg melting and also from
explain such trends if they do not simply reflect data defi-      the resuspension of fine sediments (Azetsu-Scott and Syvit-
ciency.                                                           ski, 1999; Zajaczkowski
                                                                                  ˛           and Włodarska-Kowalczuk, 2007;
                                                                  Stevens et al., 2016). The generally high sediment load of
                                                                  glacially derived freshwater is evident around Greenland,
4   Effects of glacial discharge on marine resource               which is the origin of ∼ 1 % of annual freshwater discharge
    availability                                                  into the ocean yet 7 %–9 % of the annual fluvial sediment
                                                                  load (Overeem et al., 2017). Sediment load is however spa-
One of the most direct mechanisms via which glacial dis-          tially and temporally variable, leading to pronounced inter-
charge affects downstream marine primary production is by         and intra-catchment differences (Murray et al., 2015). For
altering the availability of light, macronutrients (such as ni-   example, satellite-derived estimates of sediment load for 160
trate, NO3 ; phosphate, PO4 ; and silicic acid, Si) and/or mi-    Greenlandic glacier outflows suggest a median sediment load
cronutrients (such as iron and manganese) in the ocean. The       of 992 mg L−1 , but some catchments exhibit > 3000 mg L−1
chemical composition of glacial discharge is now relatively       (Overeem et al., 2017). Furthermore it is suggested that >
well constrained, especially around Greenland (Yde et al.,        25 % of the total annual sediment load is released in a single
2014; Meire et al., 2016a; Stevenson et al., 2017), Alaska        outflow (from the Sermeq glacier) (Overeem et al., 2017).
(Hood and Berner, 2009; Schroth et al., 2011) and Svalbard           The extent to which high turbidity in glacier outflows lim-
(Hodson et al., 2004, 2016). Whilst high particle loads (Chu      its light availability in downstream marine environments is
et al., 2012; Overeem et al., 2017) and Si are often associ-      therefore highly variable between catchments and with dis-
ated with glacially modified waters (Fig. 3a) around the Arc-     tance from glacier outflows (Murray et al., 2015; Mascaren-
tic (Brown et al., 2010; Meire et al., 2016a), the concentra-     has and Zielinski, 2019). The occurrence, and effects, of sub-
tions of all macronutrients in glacial discharge (Meire et al.,   surface turbidity peaks close to glaciers is less well studied.
2016a) are relatively low and similar to those of coastal sea-    Subsurface turbidity features may be even more spatially and
water (Fig. 3a, b and c).                                         temporally variable than their surface counterparts (Stevens
   Macronutrient concentrations in Arctic rivers can be           et al., 2016; Kanna et al., 2018; Moskalik et al., 2018). In
higher than in glacier discharge (Holmes et al., 2011)            general, a spatial expansion of near-surface turbid plumes
(Fig. 3d, e and f). Nevertheless, river and glacier meltwater     is expected with increasing glacier discharge, but this trend
alike do not significantly increase the concentration of PO4      is not always evident at the catchment scale (Chu et al.,
in Arctic coastal waters (Fig. 3c and f). River water is,         2009, 2012; Hudson et al., 2014). Furthermore, with long-
relatively, a much more important source of NO3 (Cauwet           term glacier retreat, the sediment load in discharge at the
and Sidorov, 1996; Emmerton et al., 2008; Hessen et al.,          coastline is generally expected to decline as proglacial lakes
2010), and in river estuaries this nutrient can show a sharp      are efficient sediment traps (Bullard, 2013; Normandeau et
decline with increasing salinity due to both mixing and           al., 2019).
biological uptake (Fig. 3e). Patterns in Si are more variable        In addition to high turbidity, the low concentration of
(Cauwet and Sidorov, 1996; Emmerton et al., 2008; Hessen          macronutrients in glacier discharge relative to saline waters
et al., 2010). Dissolved Si concentration at low salinity is      is evidenced by the estuarine mixing diagram in Kongsfjor-
higher in rivers than in glacier discharge (Fig. 3a and d),       den (Fig. 3) and confirmed by extensive measurements of
yet a variety of estuarine behaviours are observed across         freshwater nutrient concentrations (e.g. Hodson et al., 2004,
the Arctic. Peak dissolved Si occurs at a varying salinity,       2005). For PO4 (Fig. 3c), there is a slight increase in concen-
due to the opposing effects of Si release from particles and      tration with salinity (i.e. discharge dilutes the nutrient con-
dissolved Si uptake by diatoms (Fig. 3d).                         centration in the fjord). For NO3 , discharge slightly increases

www.the-cryosphere.net/14/1347/2020/                                                   The Cryosphere, 14, 1347–1383, 2020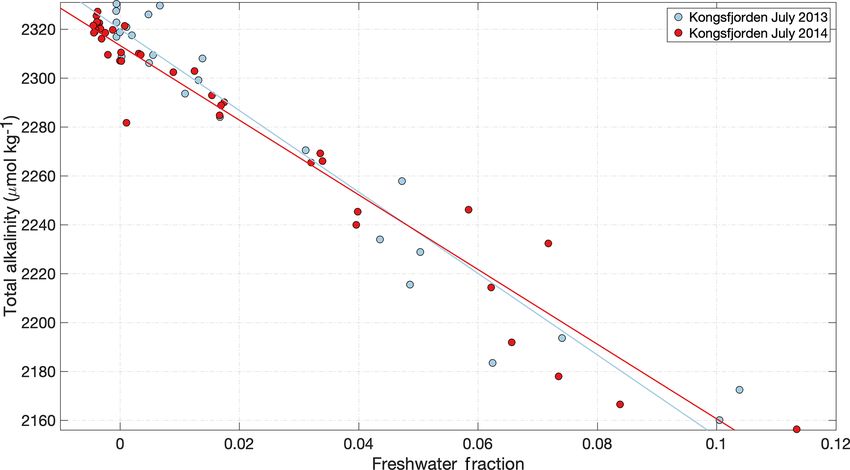
1352                                                                          M. J. Hopwood et al.: Effects of glaciers in the Arctic

Table 1. July–September marine primary production (PP) data from studies conducted in glaciated Arctic regions. PP data points are cate-
gorised into four groups according to whether or not they are within 80 km of a marine-terminating glacier and whether or not they are within
a glacier fjord. Data sources as per Fig. 2. n is the number of data points; where studies report primary production measurements at the same
station for the same month at multiple time points (e.g. Juul-Pedersen et al., 2015) a single mean is used in the data compilation (i.e. n = 1
irrespective of the historical extent of the time series).

                                                           Mean PP
                                                     (± standard deviation)
             Category                                   mg C m−2 d−1             n   Data from
             (I) Marine-terminating glacier                 847 ± 852           11   Disko Bay, Scoresby Sund, Glacier
             influence, non-fjord                                                    Bay, North Greenland, Canadian Arctic
                                                                                     Archipelago
             (II) Marine-terminating glacier                480 ± 403           33   Godthåbsfjord, Kongsfjorden, Scoresby
             influence, glacier fjord                                                Sund, Glacier Bay, Hornsund,
             (III) No marine-terminating glacier            304 ± 261           42   Godthåbsfjord, Young Sound, Scoresby
             influence, non-fjord                                                    Sund, Disko Bay, Canadian Arctic
                                                                                     Archipelago
             (IV) No marine-terminating glacier             125 ± 102           35   Godthåbsfjord, Young Sound, Kangerlus-
             influence, glacier fjord                                                suaq, Disko Bay

Figure 3. (a) Si, (b) NO3 and (c) PO4 distributions across the measured salinity gradient in Kongsfjorden in summer 2013 (Fransson et al.,
2016), 2014 (Fransson et al., 2016), 2015 (van de Poll et al., 2018) and 2016 (Cantoni et al., 2019). Full depth data are shown, with a linear
regression (black line) for glacially modified waters (S < 34.2) during summer 2016. The position of stations varies between the datasets,
with the 2016 data providing the broadest coverage of the inner fjord. Linear regression details are shown in Table S1 in the Supplement.
(d) Si, (e) NO3 and (f) PO4 distributions in surface waters of three major Arctic river estuaries: the Lena, Mackenzie and Yenisey (Cauwet
and Sidorov, 1996; Emmerton et al., 2008; Hessen et al., 2010). Note the different y- and x-axis scales.

the concentration in the upper-mixed layer (Fig. 3b). For Si, a             Whilst dissolved macronutrient concentrations in glacial
steady decline in Si with increasing salinity (Fig. 3a) is con-          discharge are relatively low, a characteristic of glaciated
sistent with a discharge-associated Si supply (Brown et al.,             catchments is extremely high particulate Fe concentrations.
2010; Arimitsu et al., 2016; Meire et al., 2016a). The spa-              High Fe concentrations arise both directly from glacier dis-
tial distribution of data for summer 2013–2016 is similar and            charge (Bhatia et al., 2013a; Hawkings et al., 2014) and also
representative of summertime conditions in the fjord (Hop et             from resuspension of glacially derived sediments throughout
al., 2002).                                                              the year (Markussen et al., 2016; Crusius et al., 2017). Total

The Cryosphere, 14, 1347–1383, 2020                                                            www.the-cryosphere.net/14/1347/2020/
M. J. Hopwood et al.: Effects of glaciers in the Arctic                                                                           1353

dissolvable Fe (TdFe) concentrations within Godthåbsfjord              moval of > 80 % DFe between salinities of 0–30 (Hopwood
are high in all available datasets (May 2014, August 2014 and          et al., 2016), and similar losses of approximately 98 % for
July 2015) and strongly correlated with turbidity (linear re-          Kongsfjorden and 85 % for the Copper river/estuary (Gulf
gression: R 2 = 0.88, R 2 = 0.56 and R 2 = 0.88, respectively,         of Alaska) system have been reported (Schroth et al., 2014;
Hopwood et al., 2016, 2018). A critical question in oceanog-           Zhang et al., 2015).
raphy, in both the Arctic and Antarctic, is to what extent this           Conversely, Si can be released from particulate phases dur-
large pool of particulate Fe is transferred into open-ocean en-        ing estuarine mixing, resulting in non-conservative addition
vironments and thus potentially able to affect marine primary          to dissolved Si concentrations (Windom et al., 1991), al-
production in Fe-limited offshore regions (Gerringa et al.,            though salinity–Si relationships vary between different estu-
2012; Arrigo et al., 2017; Schlosser et al., 2018). The mech-          aries due to different extents of Si release from labile particu-
anisms that promote transfer of particulate Fe into bioavail-          lates and Si uptake by diatoms (e.g. Fig. 3d). Where evident,
able dissolved phases, such as ligand-mediated dissolution             this release of dissolved Si typically occurs at low salinities
(Thuroczy et al., 2012) and biological activity (Schmidt et al.,       (Cauwet and Sidorov, 1996; Emmerton et al., 2008; Hessen
2011), and the scavenging processes that return dissolved Fe           et al., 2010), with the behaviour of Si being more conser-
to the particulate phase are both poorly characterized (Tagli-         vative at higher salinities and in estuaries where pronounced
abue et al., 2016).                                                    drawdown by diatoms is not evident (e.g. Brown et al., 2010).
   Fe profiles around the Arctic show strong spatial vari-             Estimating release of particulate Si from Kongsfjorden data
ability in TdFe concentrations, ranging from unusually high            (Fig. 3c) as the additional dissolved Si present above the
concentrations of up to 20 µM found intermittently close to            conservative mixing line for runoff mixing with unmodified
turbid glacial outflows (Zhang et al., 2015; Markussen et              saline water that is entering the fjord (via linear regression)
al., 2016; Hopwood et al., 2018) to generally low nanomo-              suggests a Si enrichment of 13 % ± 2 % (Fig. 3a). This is
lar concentrations at the interface between shelf and fjord            broadly consistent with the 6 %–53 % range reported for es-
waters (Zhang et al., 2015; Crusius et al., 2017; Cape et              tuarine gradients evident in some temperate estuaries (Win-
al., 2019). An interesting feature of some of these profiles           dom et al., 1991). Conversely, Hawkings et al. (2017) sug-
around Greenland is the presence of peak Fe at ∼ 50 m                  gest a far greater dissolution downstream of Leverett Glacier,
depth, perhaps suggesting that much of the Fe transport                equivalent to a 70 %–800 % Si enrichment, and thus propose
away from glaciers may occur in subsurface turbid glacially            that the role of glaciers in the marine Si cycle has been under-
modified waters (Hopwood et al., 2018; Cape et al., 2019).             estimated. Given that such dissolution is substantially above
The spatial extent of Fe enrichment downstream of glaciers             the range observed in any other Arctic estuary, the apparent
around the Arctic is still uncertain, but there is evidence of         cause is worth further consideration.
global variability downstream of glaciers on the scale of 10–
100 km (Gerringa et al., 2012; Annett et al., 2017; Crusius et
al., 2017).

4.1   Non-conservative mixing processes for Fe and Si

A key reason for uncertainty in the fate of glacially derived
Fe is the non-conservative behaviour of dissolved Fe in saline
waters. In the absence of biological processes (i.e. nutrient
assimilation and remineralization), NO3 is expected to ex-                The general distribution of Si in surface waters for Kongs-
hibit conservative behaviour across estuarine salinity gradi-          fjorden (Fransson et al., 2016), Godthåbsfjord (Meire et al.,
ents (i.e. the concentration at any salinity is a linear function      2016a), Bowdoin Fjord (Kanna et al., 2018), Sermilik (Cape
of mixing between fresh and saline waters). For Fe, how-               et al., 2019) and along the Gulf of Alaska (Brown et al.,
ever, a classic non-conservative estuarine behaviour occurs            2010) is similar; Si shows pseudo-conservative behaviour de-
due to the removal of dissolved Fe (DFe1 ) as it flocculates           clining with increasing salinity in surface waters. The limited
and is absorbed onto particle surfaces more readily at higher          reported number of zero-salinity, or very low salinity, end-
salinity and pH (Boyle et al., 1977). Dissolved Fe concen-             members for Godthåbsfjord and Bowdoin are significantly
trations almost invariably exhibit strong (typically ∼ 90 %)           below the linear regression derived from surface nutrient and
non-conservative removal across estuarine salinity gradients           salinity data (Fig. 4). In addition to some dissolution of par-
(Boyle et al., 1977; Sholkovitz et al., 1978), and glaciated           ticulate Si, another likely reason for this is the limitation of
catchments appear to be no exception to this rule (Lippiatt            individual zero-salinity measurements in dynamic fjord sys-
et al., 2010). Dissolved Fe in Godthåbsfjord exhibits a re-            tems where different discharge outflows have different nu-
                                                                       trient concentrations (Kanna et al., 2018), especially given
    1 For consistency, dissolved Fe is defined throughout opera-
                                                                       that subglacial discharge is not directly characterized in ei-
tionally as < 0.2 µ m and is therefore inclusive of ionic, complexed   ther location (Meire et al., 2016a; Kanna et al., 2018). As
and colloidal species.

www.the-cryosphere.net/14/1347/2020/                                                         The Cryosphere, 14, 1347–1383, 2020
1354 M. J. Hopwood et al.: Effects of glaciers in the Arctic
al., 2018), but this is often challenging due to mixing and
overlap between different sources. Back-calculating the inte-
grated freshwater endmember (e.g. from regression, Fig. 4)
can potentially resolve the difficulty in accounting for data-
deficient freshwater components and poorly characterized es-
tuarine processes. As often noted in field studies, there is a
general bias towards sampling of supraglacial meltwater and
runoff in proglacial environments and a complete absence of
chemical data for subglacial discharge emerging from large
marine-terminating glaciers (e.g. Kanna et al., 2018).
Macronutrient distributions in Bowdoin, Godthåbsfjord
and Sermilik unambiguously show that the primary
macronutrient supply to surface waters associated with
glacier discharge originates from mixing rather than from
freshwater addition (Meire et al., 2016a; Kanna et al., 2018;
Cape et al., 2019), which emphasizes the need to consider
fjord inflow/outflow dynamics in order to interpret nutrient
distributions. The apparently anomalous extent of Si dissolu-
tion downstream of Leverett Glacier (Hawkings et al., 2017)
may therefore largely reflect underestimation of both the
saline (assumed to be negligible) and freshwater endmem-
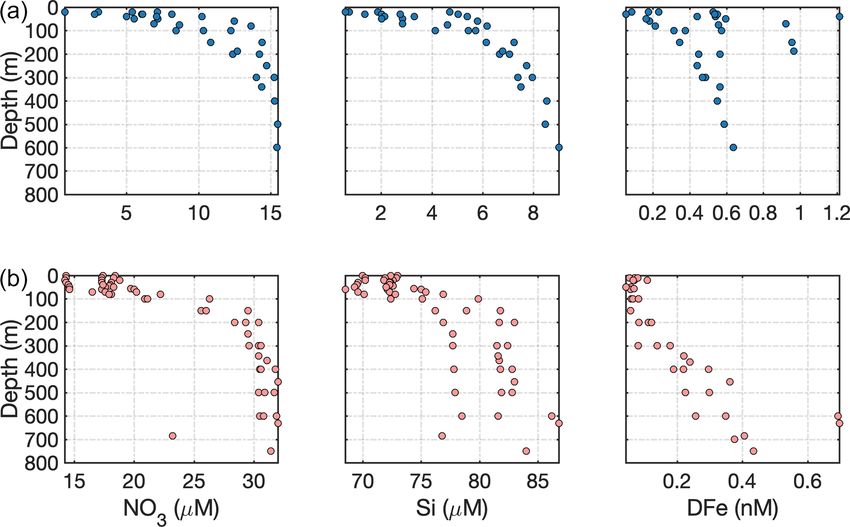
Figure 4. Dissolved Si distribution vs. salinity for glaciated Arc- bers rather than unusually prolific particulate Si dissolution.
tic catchments. Data are from Bowdoin Fjord (Kanna et al., 2018),
In any case, measured Si concentrations in the Kangerlus-
Kongsfjorden (Fransson et al., 2016; van de Poll et al., 2018), Ser-
suaq region are within the range of other Arctic glacier estu-
milik Fjord (Cape et al., 2019), Kangerlussuaq (Hawkings et al.,
2017; Lund-Hansen et al., 2018), Godthåbsfjord (Hopwood et al., aries (Fig. 4), making it challenging to support the hypothesis
2016; Meire et al., 2016b), and the Gulf of Alaska (Brown et al., that glacial contributions to the Si cycle have been underesti-
2010). Linear regressions are shown for large surface datasets only. mated elsewhere (see also Tables 2 and 3).
Linear regression details are shown in Table S1. Closed markers in-
dicate surface data (< 20 m depth), and open markers indicate sub- 4.2 Deriving glacier–ocean fluxes
surface data.
In the discussion of macronutrients herein we have focused
on the availability of the bioavailable species (e.g. PO4 , NO3
demonstrated by the two different zero-salinity Si endmem- and silicic acid) that control seasonal trends in inter-annual
bers in Kongsfjorden (iceberg melt of ∼ 0.03 µM and surface marine primary production (Juul-Pedersen et al., 2015; van
runoff of ∼ 5.9 µM), pronounced deviations in nutrient con- de Poll et al., 2018; Holding et al., 2019). It should be noted
tent arise from mixing between various freshwater endmem- that the total elemental fluxes (i.e. nitrogen, phosphorus and
bers (surface runoff, ice melt and subglacial discharge). For silicon) associated with lithogenic particles are invariably
example, total freshwater input into Godthåbsfjord is 70 %– higher than the associated macronutrients (Wadham et al.,
80 % liquid, with this component consisting of 64 % ice sheet 2019), particularly for phosphorus (Hawkings et al., 2016)
runoff, 31 % land runoff, and 5 % net precipitation (Langen and silicon (Hawkings et al., 2017). Lithogenic particles are
et al., 2015) and being subject to additional inputs from ice- however not bioavailable, although they may to some extent
berg melt along the fjord (∼ 70 % of calved ice also melts be bioaccessible, depending on the temporal and spatial scale
within the inner fjord, Bendtsen et al., 2015). involved. This is especially the case for the poorly quantified
In a marine context at broad scales, a single freshwa- fraction of lithogenic particles that escapes sedimentation in
ter endmember that integrates the net contribution of all inner-fjord environments, either directly or via resuspension
freshwater sources can be defined. This endmember includes of shallow sediments (Markussen et al., 2016; Hendry et al.,
iceberg melt, groundwater discharge, surface and subsur- 2019). It is hypothesized that lithogenic particle inputs from
face glacier discharge, and (depending on location) sea-ice glaciers therefore have a positive influence on Arctic marine
melt, which are challenging to distinguish in coastal waters primary production (Wadham et al., 2019), yet field data to
(Benetti et al., 2019). Close to glaciers, it may be possible support this hypothesis are lacking. A pan-Arctic synthesis
to observe distinct freshwater signatures in different water of all available primary production data for glaciated regions
column layers and distinguish chemical signatures in wa- (Fig. 2 and Table 1), spatial patterns in productivity along
ter masses containing subglacial discharge from those con- the west Greenland coastline (Meire et al., 2017), popula-
taining primarily surface runoff and iceberg melt (e.g. in tion responses in glacier fjords across multiple taxonomic
Godthåbsfjord, Meire et al., 2016a; and Sermilik, Beaird et groups (Cauvy-Fraunié and Dangles, 2019) and sedimentary
The Cryosphere, 14, 1347–1383, 2020 www.the-cryosphere.net/14/1347/2020/M. J. Hopwood et al.: Effects of glaciers in the Arctic 1355
records from Kongsfjorden (Kumar et al., 2018) consistently et al., 2017). Conversely, estimates of DOM export (quanti-
suggest that glaciers, or specifically increasing volumes of fied as DOC) are confined to a slightly narrower range of 7–
glacier discharge, have a net negative, or negligible, effect 40 Gmol yr−1 , with differences arising from changes in mea-
on marine primary producers – except in the specific case of sured DOM concentrations (Bhatia et al., 2013b; Lawson et
some marine-terminating glaciers where a different mecha- al., 2014b; Hood et al., 2015). The characterization of glacial
nism seems to operate (see Sect. 5). DOM, with respect to its lability, C : N ratio and implications
Two linked hypotheses can be proposed to explain these for bacterial productivity in the marine environment (Hood et
apparently contradictory arguments. One is that whilst al., 2015; Paulsen et al., 2017), is however not readily appar-
lithogenic particles are potentially a bioaccessible source of ent from a simple flux calculation.
Fe, P and Si, they are deficient in bioaccessible N. As NO3 A scaled-up calculation using freshwater concentrations
availability is expected to limit primary production across (C) and discharge volumes (Q) is the simplest way of
much of the Arctic (Tremblay et al., 2015), this creates a determining the flux from a glaciated catchment to the
spatial mismatch between nutrient supply and the nutrient ocean. However, discharge nutrient concentrations vary
demand required to increase Arctic primary production. A re- seasonally (Hawkings et al., 2016; Wadham et al., 2016),
lated, alternative hypothesis is that the negative effects of dis- often resulting in variable C–Q relationships due to changes
charge on marine primary production (e.g. via stratification in mixing ratios between different discharge flow paths;
and light limitation from high turbidity) more than offset any post-mixing reactions; and seasonal changes in microbial
positive effect that lithogenic particles have via increasing behaviour in the snowpack, on glacier surfaces, and in
nutrient availability on regional scales prior to extensive sed- proglacial forefields (Brown et al., 1994; Hodson et al.,
imentation occurring. A similar conclusion has been reached 2005). Therefore, full seasonal datasets from a range of
from analysis of primary production in proglacial streams representative glaciers are required to accurately describe
(Uehlinger et al., 2010). To some extent this reconciliation C–Q relationships. Furthermore, as the indirect effects
is also supported by considering the relative magnitudes of of discharge on nutrient availability to phytoplankton via
different physical and chemical processes acting on different estuarine circulation and stratification are expected to be a
spatial scales with respect to global marine primary produc- greater influence than the direct nutrient outflow associated
tion (see Sect. 10). with discharge (Rysgaard et al., 2003; Juul-Pedersen et
The generally low concentrations of macronutrients and al., 2015; Meire et al., 2016a), freshwater data must be
dissolved organic matter (DOM) in glacier discharge, relative coupled to physical and chemical time series in the coastal
to coastal seawater (Table 2), have an important methodolog- environment if the net effect of discharge on nutrient
ical implication because what constitutes a positive NO3 , availability in the marine environment is to be understood.
PO4 or DOM flux into the Arctic Ocean in a glaciological Indeed, the recently emphasized hypothesis that nutrient
context can actually reduce short-term nutrient availability fluxes from glaciers into the ocean have been significantly
in the marine environment. It is therefore necessary to con- underestimated (Hawkings et al., 2016, 2017; Wadham et al.,
sider both the glacier discharge and saline endmembers that 2016) is difficult to reconcile with a synthesis and analysis of
mix in fjords, alongside fjord-scale circulation patterns, in available marine nutrient distributions (Sect. 4) in glaciated
order to constrain the change in nutrient availability to ma- Arctic catchments, especially for Si (Fig. 4).
rine biota (Meire et al., 2016a; Hopwood et al., 2018; Kanna
et al., 2018).
Despite the relatively well constrained nutrient signature
of glacial discharge around the Arctic, estimated fluxes of
some nutrients from glaciers to the ocean appear to be sub-
ject to greater variability, especially for nutrients subject to
non-conservative mixing (Table 3). Estimates of the Fe flux
from the Greenland Ice Sheet, for example, have an 11-fold
difference between the lowest (> 26 Mmol yr−1 ) and highest
(290 Mmol yr−1 ) values (Hawkings et al., 2014; Stevenson et
al., 2017). However, it is debatable if these differences in Fe
flux are significant because they largely arise in differences
A particularly interesting case study concerning the
between definitions of the flux gate window and especially
link between marine primary production, circulation and
how estuarine Fe removal is accounted for. Given that the
discharge-derived nutrient fluxes is Young Sound. It was ini-
difference between an estimated removal factor of 90 % and
tially stipulated that increasing discharge into the fjord in re-
99 % is a factor of 10 difference in the calculated DFe flux,
sponse to climate change would increase estuarine circula-
there is overlap in all of the calculated fluxes for Greenland
tion and therefore macronutrient supply. Combined with a
Ice Sheet discharge into the ocean (Table 3) (Statham et al.,
longer sea-ice-free growing season as Arctic temperatures
2008; Bhatia et al., 2013a; Hawkings et al., 2014; Stevenson
www.the-cryosphere.net/14/1347/2020/ The Cryosphere, 14, 1347–1383, 20201356 M. J. Hopwood et al.: Effects of glaciers in the Arctic
Table 2. Measured/computed discharge and saline endmembers for well-studied Arctic fjords (ND, not determined/not reported; BD, below
detection).
Fjord Dataset Salinity NO3 (µM) PO4 (µM) Si (µM) TdFe (µM)
Kongsfjorden Summer 2016 0.0 (ice melt) 0.87 ± 1.0 0.02 ± 0.03 0.03 ± 0.03 33.8 ± 100
(Svalbard) (Cantoni et al., 2019) 0.0 (surface discharge) 0.94 ± 1.0 0.057 ± 0.31 5.91 ± 4.1 74 ± 76
34.50 ± 0.17 1.25 ± 0.49 0.20 ± 0.06 1.00 ± 0.33 ND
Nuup Kangerlua/ Summer 2014 0.0 (ice melt) 1.96 ± 1.68 0.04 ± 0.04 13 ± 15 0.31 ± 0.49
Godthåbsfjord (Hopwood et al., 2016; 0.0 (surface discharge) 1.60 ± 0.44 0.02 ± 0.01 12.2 ± 16.3 13.8
(Greenland) Meire et al., 2016a) 33.57 ± 0.05 11.5 ± 1.5 0.79 ± 0.04 8.0 ± 1.0 ND
Sermilik Summer 2015 0.0 (subglacial discharge) 1.8 ± 0.5 ND 10 ± 8 ND
(Greenland) (Cape et al., 2019) 0.0 (ice melt) 0.97 ± 1.5 ND 4±4 ND
34.9 ± 0.1 12.8 ± 1 ND 6.15 ± 1 ND
Bowdoin Summer 2016 0.0 (surface discharge) 0.22 ± 0.15 0.30 ± 0.20 BD ND
(Greenland) (Kanna et al., 2018) 34.3 ± 0.1 14.7 ± 0.9 1.1 ± 0.1 19.5 ± 1.5 ND
Young Sound Summer 2014 (Runoff July–August) 1.2 ± 0.74 0.29 ± 0.2 9.52 ± 3.8 ND
(Greenland) (Paulsen et al., 2017) (Runoff September–October) 1.0 ± 0.7 0.35 ± 0.2 29.57 ± 10.9 ND
33.6 ± 0.1 (July–August) 6.4 ± 1.1 1.18 ± 0.5 6.66 ± 0.4 ND
33.5 ± 0.04 (September–October) 5.6 ± 0.2 0.62 ± 0.2 6.5 ± 0.1 ND
increase, this would be expected to increase primary pro- secondary productivity in areas where primary production is
duction within the fjord (Rysgaard et al., 1999; Rysgaard low (Lydersen et al., 2014).
and Glud, 2007). Yet freshwater input also stratifies the fjord It is debatable to what extent shifts in these feeding pat-
throughout summer and ensures low macronutrient availabil- terns could have broadscale biogeochemical effects. Whilst
ity in surface waters (Bendtsen et al., 2014; Meire et al., some species are widely described as ecosystem engineers,
2016a), which results in low summertime productivity in the such as Alle alle (the little auk) in the Greenland North Wa-
inner and central fjord (< 40 mg C m−2 d−1 ) (Rysgaard et ter Polynya (González-Bergonzoni et al., 2017), for changes
al., 1999, 2003; Rysgaard and Glud, 2007). Whilst annual in higher-trophic-level organisms’ feeding habits to have sig-
discharge volumes into the fjord have increased over the past nificant direct chemical effects on the scale of a glacier fjord
two decades, resulting in a mean annual 0.12±0.05 (practical system would require relatively large concentrations of such
salinity units) freshening of fjord waters (Sejr et al., 2017), animals. Nevertheless, in some specific hotspot regions this
shelf waters have also freshened. This has potentially im- effect is significant enough to be measurable. There is am-
peded the dense inflow of saline waters into the fjord (Boone ple evidence that birds intentionally target upwelling plumes
et al., 2018) and therefore counteracted the expected increase in front of glaciers as feeding grounds, possibly due to the
in productivity. stunning effect that turbid, upwelling plumes have upon prey
such as zooplankton (Hop et al., 2002; Lydersen et al., 2014).
4.3 How do variations in the behaviour and location of This feeding activity therefore concentrates the effect of
higher-trophic-level organisms affect nutrient avian nutrient recycling within a smaller area than would
availability to marine microorganisms? otherwise be the case, potentially leading to modest nutri-
ent enrichment of these proglacial environments. Yet, with
With the exception of some zooplankton and fish species the exception of large, concentrated bird colonies, the effects
that struggle to adapt to the strong salinity gradients and/or of such activity are likely modest. In Kongsfjorden, bird pop-
suspended particle loads in inner-fjord environments (Wçs- ulations are well studied, and several species are associated
lawski and Legezytńska, 1998; Lydersen et al., 2014), with feeding in proglacial plumes yet still collectively con-
higher-trophic-level organisms (including mammals and sume only between 0.1 % and 5.3 % of the carbon produced
birds) are not directly affected by the physical/chemical by phytoplankton in the fjord (Hop et al., 2002). The esti-
gradients caused by glacier discharge. However, their food mated corresponding nutrient flux into the fjord from birds is
sources, such as zooplankton and some fish species, are 2 mmol m−2 yr−1 nitrogen and 0.3 mmol m−2 yr−1 phospho-
directly affected, and therefore there are many examples rous.
of higher-level organisms adapting their feeding strategies
within glacier fjord environments (Arimitsu et al., 2012;
Renner et al., 2012; Laidre et al., 2016). Strong gradients
in physical/chemical gradients downstream of glaciers, par-
ticularly turbidity, can therefore create localized hotspots of
The Cryosphere, 14, 1347–1383, 2020 www.the-cryosphere.net/14/1347/2020/M. J. Hopwood et al.: Effects of glaciers in the Arctic 1357
Table 3. Flux calculations for dissolved nutrients (Fe, DOC, DON, NO3 , PO4 and Si) from Greenland Ice Sheet discharge. Where a flux
was not calculated in the original work, an assumed discharge volume of 1000 km3 yr−1 is used to derive a flux for comparative purposes
(ASi, amorphous silica; LPP, labile particulate phosphorous). For DOM, PO4 and NO3 , non-conservative estuarine behaviour is expected
to be minor or negligible. Note that whilst we have defined “dissolved” herein as < 0.2 µm, the sampling and filtration techniques used,
particularly in freshwater studies, are not well standardized, and thus some differences may arise between studies accordingly. Clogging of
filters in turbid waters reduces the effective filter pore size; DOP, DON, NH4 and PO4 concentrations often approach analytical detection
limits which, alongside field/analytical blanks, are treated differently; low concentrations of NO3 , DON, DOP, DOC, NH4 and DFe are easily
inadvertently introduced to samples by contamination, and measured Si concentrations can be significantly lower when samples have been
frozen.
Freshwater
endmember
concentration
Nutrient (µM) Flux Estuarine modification Data
Fe 0.13 > 26 Mmol yr−1 Inclusive, > 80 % loss Hopwood et al. (2016)
1.64 39 Mmol yr−1 Assumed 90 % loss Stevenson et al. (2017)
0.053 53 Mmol yr−1 Discussed, not applied Statham et al. (2008)
3.70 180 Mmol yr−1 Assumed 90 % loss Bhatia et al. (2013a)
0.71 290 Mmol yr−1 Discussed, not applied Hawkings et al. (2014)
DOC 16–100 6.7 Gmol yr−1 Not discussed Bhatia et al. (2010, 2013b)
12–41 11–14 Gmol yr−1 Not discussed Lawson et al. (2014b)
15–100 18 Gmol yr−1 Not discussed Hood et al. (2015)
2–290 24–38 Gmol yr−1 Not discussed Csank et al. (2019)
27–47 40 Gmol yr−1 Not discussed Paulsen et al. (2017)
DON 4.7–5.4 5 Gmol yr−1 Not discussed Paulsen et al. (2017)
1.7 0.7–1.1 Gmol yr−1 Not discussed Wadham et al. (2016)
Si 13–28 22 Gmol yr−1 Inclusive Meire et al. (2016a)
9.6 4 Gmol yr−1 Discussed Hawkings et al. (2017)
(+190 Gmol yr−1 ASi)
PO4 0.23 0.10 Gmol yr−1 Discussed Hawkings et al. (2016)
(+0.23 Gmol yr−1 LPP)
0.26 0.26 Gmol yr−1 Not discussed Meire et al. (2016a)
NO3 1.4–1.5 0.42 Gmol yr−1 Not discussed Wadham et al. (2016)
0.5–1.7 0.5–1.7 Gmol yr−1 Not discussed Paulsen et al. (2017)
1.79 1.79 Gmol yr−1 Not discussed Meire et al. (2016a)
5 Critical differences between surface and subsurface production (Table 1). Multiple glacier fjord surveys have
discharge release shown that fjords with large marine-terminating glaciers
around the Arctic are normally more productive than their
land-terminating glacier fjord counterparts (Meire et al.,
2017; Kanna et al., 2018), and, despite large inter-fjord vari-
ability (Fig. 2), this observation appears to be significant
across all available primary production data for Arctic glacier
fjords (Table 1). A particularly critical insight is that fjord-
scale summertime productivity along the west Greenland
coastline scales approximately with discharge downstream of
marine-terminating glaciers but not land-terminating glaciers
(Meire et al., 2017). The primary explanation for this phe-
Critical differences arise between land-terminating and nomenon is the vertical nutrient flux associated with mixing
marine-terminating glaciers with respect to their effects on driven by subglacial discharge plumes, which has been quan-
water column structure and associated patterns in primary tified in field studies at Bowdoin glacier (Kanna et al., 2018),
www.the-cryosphere.net/14/1347/2020/ The Cryosphere, 14, 1347–1383, 20201358 M. J. Hopwood et al.: Effects of glaciers in the Arctic Sermilik Fjord (Cape et al., 2019), Kongsfjorden (Halbach et exclusively by new NO3 (rather than recycling) and equally al., 2019) and in Godthåbsfjord (Meire et al., 2016a). distributed across the entire fjord surface. Whilst this is con- As discharge is released at the glacial grounding line sistent with observations suggesting relative stability in mean depth, its buoyancy and momentum result in an upwelling annual primary production in Godthåbsfjord from 2005 to plume that entrains and mixes with ambient seawater (Car- 2012 (103.7±17.8 g C m−2 yr−1 ; Juul-Pedersen et al., 2015), roll et al., 2015, 2016; Cowton et al., 2015). In Bowdoin, Ser- despite pronounced increases in total discharge into the fjord, milik and Godthåbsfjord, this nutrient pump provides 99 %, this does not preclude a much stronger influence of entrain- 97 % and 87 %, respectively, of the NO3 associated with ment on primary production in the inner-fjord environment. glacier inputs to each fjord system (Meire et al., 2016a; The time series is constructed at the fjord mouth, over 120 km Kanna et al., 2018; Cape et al., 2019). Whilst the pan- from the nearest glacier, and the estimates of subglacial dis- Arctic magnitude of this nutrient pump is challenging to charge and entrainment used by Meire et al. (2017) are both quantify because of the uniqueness of glacier fjord systems unrealistically low. If the same conservative estimate of en- in terms of their geometry, circulation, residence time and trainment is assumed to only affect productivity in the main glacier grounding line depths (Straneo and Cenedese, 2015; fjord branch (where the three marine-terminating glaciers are Morlighem et al., 2017), it can be approximated in generic located), for example, the lower bound for the contribution of terms because plume theory (Morton et al., 1956) has been entrainment becomes 3 %–33 % of total N supply. Similarly, used extensively to describe subglacial discharge plumes in in Kongsfjorden – the surface area of which is considerably the marine environment (Jenkins, 2011; Hewitt, 2020). Com- smaller compared to Godthåbsfjord (∼ 230 km2 compared to puted estimates of subglacial discharge for the 12 Greenland 650 km2 ) – even the relatively weak entrainment from shal- glacier fjord systems where sufficient data are available to low marine-terminating glaciers (Fig. 5) accounts for approx- simulate plume entrainment (Carroll et al., 2016) suggest imately 19 %–32 % of N supply. An additional mechanism that the entrainment effect is at least 2 orders of magni- of N supply evident there, which partially offsets the inef- tude more important for macronutrient availability than di- ficiency of macronutrient entrainment at shallow grounding rect freshwater runoff (Hopwood et al., 2018). This is con- line depths, is the entrainment of ammonium from shallow sistent with limited available field observations (Meire et al., benthic sources (Halbach et al., 2019), which leads to unusu- 2016a; Kanna et al., 2018; Cape et al., 2019). As macronu- ally high NH4 concentrations in surface waters. Changes in trient fluxes have been estimated independently using differ- subglacial discharge, or in the entrainment factor (e.g. from ent datasets and plume entrainment models in two of these a shift in glacier grounding line depth, Carroll et al., 2016), glacier fjord systems (Sermilik and Illulissat), an assessment can therefore potentially change fjord-scale productivity. of the robustness of these fluxes can also be made (Table 4) A specific deficiency in the literature to date is the ab- (Hopwood et al., 2018; Cape et al., 2019). Exactly how these sence of measured subglacial discharge rates from marine- plumes, and any associated fluxes, will change with the com- terminating glaciers. Variability in such rates on diurnal and bined effects of glacier retreat and increasing glacier dis- seasonal timescales is expected (Schild et al., 2016; Fried et charge remains unclear (De Andrés et al., 2020) but may al., 2018), and intermittent periods of extremely high dis- lead to large changes in fjord biogeochemistry (Torsvik et al., charge are known to occur, for example from ice-dammed 2019). Despite different definitions of the macronutrient flux lake drainage in Godthåbsfjord (Kjeldsen et al., 2014). Yet (Table 4; “A” refers to the out-of-fjord transport at a defined determining the extent to which these events affect fjord- fjord cross-section window, whereas “B” refers to the ver- scale mixing and biogeochemistry, as well as how these rates tical transport within the immediate vicinity of the glacier), change in response to climate forcing, will require further the fluxes are reasonably comparable and in both cases un- field observations. Paradoxically, one of the major knowl- ambiguously dominate macronutrient glacier-associated in- edge gaps concerning low-frequency, high-discharge events put into these fjord systems (Hopwood et al., 2018; Cape et is their biological effects; yet these events first became char- al., 2019). acterized in Godthåbsfjord after observations by a fisherman Whilst large compared to changes in macronutrient avail- of a sudden Sebastes marinus (Redfish) mortality event in ability from discharge without entrainment (Table 3), it the vicinity of a marine-terminating glacier terminus. These should be noted that these nutrient fluxes (Table 4) are still unfortunate fish were propelled rapidly to the surface by as- only intermediate contributions to fjord-scale macronutrient cending freshwater during a high-discharge event (Kjeldsen supply compared to total annual consumption in these en- et al., 2014). vironments. For example, in Godthåbsfjord mean annual pri- A further deficiency, yet to be specifically addressed in mary production is 103.7 g C m−2 yr−1 , equivalent to biolog- biogeochemical studies, is the decoupling of different mixing ical consumption of 1.1 mol N m−2 yr−1 . Entrainment from processes in glacier fjords. In this section we have primar- the three marine-terminating glaciers within the fjord is con- ily considered the effect of subglacial discharge plumes on servatively estimated to supply 0.01–0.12 mol N m−2 yr−1 NO3 supply to near-surface waters downstream of marine- (Meire et al., 2017), i.e. 1 %–11 % of the total N supply re- terminating glaciers (Fig. 5). Yet a similar effect can arise quired for primary production if production were supported from down-fjord katabatic winds which facilitate the out- The Cryosphere, 14, 1347–1383, 2020 www.the-cryosphere.net/14/1347/2020/
You can also read