Twenty-first century ocean warming, acidification, deoxygenation, and upper-ocean nutrient and primary production decline from CMIP6 model ...
←
→
Page content transcription
If your browser does not render page correctly, please read the page content below
Biogeosciences, 17, 3439–3470, 2020
https://doi.org/10.5194/bg-17-3439-2020
© Author(s) 2020. This work is distributed under
the Creative Commons Attribution 4.0 License.

Twenty-first century ocean warming, acidification, deoxygenation,
and upper-ocean nutrient and primary production decline from
CMIP6 model projections
Lester Kwiatkowski1 , Olivier Torres2 , Laurent Bopp2 , Olivier Aumont1 , Matthew Chamberlain3 ,
James R. Christian5 , John P. Dunne6 , Marion Gehlen7 , Tatiana Ilyina8 , Jasmin G. John6 , Andrew Lenton3,4 ,
Hongmei Li8 , Nicole S. Lovenduski9 , James C. Orr7 , Julien Palmieri10 , Yeray Santana-Falcón11 , Jörg Schwinger12 ,
Roland Séférian11 , Charles A. Stock6 , Alessandro Tagliabue13 , Yohei Takano8,14 , Jerry Tjiputra12 , Katsuya Toyama15 ,
Hiroyuki Tsujino15 , Michio Watanabe16 , Akitomo Yamamoto16 , Andrew Yool10 , and Tilo Ziehn3
1 LOCEAN     Laboratory, Sorbonne Université-CNRS-IRD-MNHN, Paris, 75005, France
2 LMD-IPSL,    CNRS, Ecole Normale Supérieure/PSL Res. Univ, Ecole Polytechnique,
Sorbonne Université, Paris, 75005, France
3 CSIRO Oceans and Atmosphere, Hobart, TAS 7000, Australia
4 Australian Antarctic Partnership Program, IMAS, University of Tasmania, Hobart, Australia
5 Fisheries and Oceans Canada, Canadian Centre for Climate Modelling and Analysis, Victoria, BC, Canada
6 NOAA/OAR Geophysical Fluid Dynamics Laboratory, Princeton, NJ, USA
7 Laboratoire des Sciences du Climat et de l’Environnement, LSCE-IPSL, CEA-CNRS-UVSQ,

Université Paris Saclay, Gif-sur-Yvette, 91190 France
8 Max Planck Institute for Meteorology, Bundesstraße 53, 20146 Hamburg, Germany
9 Department of Atmospheric and Oceanic Sciences and Institute of Arctic and Alpine Research,

University of Colorado, Boulder, CO, USA
10 National Oceanography Centre, European Way, Southampton, SO14 3ZH, UK
11 CNRM, Université de Toulouse, Météo-France, CNRS, Toulouse, 31057, France
12 NORCE Norwegian Research Centre, Bjerknes Centre for Climate Research, Bergen, Norway
13 School of Environmental Sciences, University of Liverpool, Liverpool, L69 3GP, UK
14 Los Alamos National Laboratory, Los Alamos, NM, USA
15 Meteorological Research Institute, Japan Meteorological Agency, Tsukuba, Japan
16 Research Center for Environmental Modeling and Application, Japan Agency for Marine-Earth

Science and Technology (JAMSTEC), Yokohama, Japan

Correspondence: Lester Kwiatkowski (lester.morgan-kwiatkowski@locean-ipsl.upmc.fr)

Received: 21 January 2020 – Discussion started: 27 January 2020
Revised: 28 April 2020 – Accepted: 25 May 2020 – Published: 6 July 2020

Abstract. Anthropogenic climate change is projected to lead    CMIP6 Shared Socioeconomic Pathways (SSPs). Projections
to ocean warming, acidification, deoxygenation, reductions     are compared to those from the previous generation (CMIP5)
in near-surface nutrients, and changes to primary produc-      forced under the Representative Concentration Pathways
tion, all of which are expected to affect marine ecosystems.   (RCPs). A total of 10 CMIP5 and 13 CMIP6 models are used
Here we assess projections of these drivers of environmental   in the two multi-model ensembles. Under the high-emission
change over the twenty-first century from Earth system mod-    scenario SSP5-8.5, the multi-model global mean change
els (ESMs) participating in the Coupled Model Intercompar-     (2080–2099 mean values relative to 1870–1899) ± the inter-
ison Project Phase 6 (CMIP6) that were forced under the        model SD in sea surface temperature, surface pH, subsurface

Published by Copernicus Publications on behalf of the European Geosciences Union.
3440                                        L. Kwiatkowski et al.: Twenty-first century marine biogeochemistry in CMIP6

(100–600 m) oxygen concentration, euphotic (0–100 m) ni-          the upper 2000 m of the ocean has increased from 0.55 to
trate concentration, and depth-integrated primary production      0.68 J m−2 s−1 since 1991 (Cheng et al., 2019).
is +3.47 ± 0.78 ◦ C, −0.44 ± 0.005, −13.27 ± 5.28, −1.06 ±           Earth system models project twenty-first century increases
0.45 mmol m−3 and −2.99 ± 9.11 %, respectively. Under the         in SST under all of the Representative Concentration Path-
low-emission, high-mitigation scenario SSP1-2.6, the corre-       ways (RCPs; Bopp et al., 2013). While certain marine or-
sponding global changes are +1.42±0.32 ◦ C, −0.16±0.002,          ganisms may have the potential to acclimate to rising ocean
−6.36±2.92, −0.52±0.23 mmol m−3 , and −0.56±4.12 %.               temperatures, poleward range shifts of many species have
Projected exposure of the marine ecosystem to these drivers       already been observed (Gregory et al., 2009; Sorte et al.,
of ocean change depends largely on the extent of future emis-     2010), with associated declines in tropical diversity projected
sions, consistent with previous studies. The ESMs in CMIP6        (Thomas et al., 2012). Concurrently, the frequency, intensity,
generally project greater warming, acidification, deoxygena-      and duration of ocean heat waves has increased in the ob-
tion, and nitrate reductions but lesser primary production de-    servational record and is projected to substantially increase
clines than those from CMIP5 under comparable radiative           in the future (Frölicher et al., 2018). This has already had
forcing. The increased projected ocean warming results from       serious impacts on marine foundation taxa such as corals,
a general increase in the climate sensitivity of CMIP6 models     seagrasses, and kelps (Garrabou et al., 2009; Hobday et al.,
relative to those of CMIP5. This enhanced warming increases       2016; Smale et al., 2019).
upper-ocean stratification in CMIP6 projections, which con-          A consequence of ocean warming is an increase in vertical
tributes to greater reductions in upper-ocean nitrate and sub-    density gradients and enhanced stratification. This results in
surface oxygen ventilation. The greater surface acidification     a reduction in the supply of nutrients to the euphotic zone,
in CMIP6 is primarily a consequence of the SSPs having            with enhanced nutrient limitation generally leading to ob-
higher associated atmospheric CO2 concentrations than their       served declines in net primary production (Behrenfeld et al.,
RCP analogues for the same radiative forcing. We find no          2001; Behrenfeld et al., 2006). Earth system model projec-
consistent reduction in inter-model uncertainties, and even       tions consistently show enhanced stratification and associ-
an increase in net primary production inter-model uncertain-      ated reductions in euphotic zone nutrient concentrations un-
ties in CMIP6, as compared to CMIP5.                              der scenarios of climate change (Bopp et al., 2001; Sarmiento
                                                                  et al., 2004; Cabré et al., 2014; Fu et al., 2016). This gener-
                                                                  ally results in projected global reductions in net primary pro-
                                                                  duction that are driven by enhanced phytoplankton nutrient
1     Introduction                                                limitation in the low-latitude oceans (Steinacher et al., 2010;
                                                                  Bopp et al., 2013; Krumhardt et al. 2017; Kwiatkowski et al.,
1.1    Ocean warming, acidification, deoxygenation,               2017; Moore et al., 2018). The projected magnitude of net
       nutrient stress, and reduced primary production            primary production declines is highly uncertain across model
                                                                  ensembles (Bopp et al., 2013; Krumhardt et al., 2017), in part
Since the pre-industrial period the global oceans have expe-      due to concurrent changes in phytoplankton light and tem-
rienced fundamental changes in physical and biogeochemi-          perature limitation, as well as altered top-down grazing, all
cal conditions as a result of anthropogenic climate change.       of which can compensate for nutrient-driven production de-
Although these changes reflect the climate services that the      clines (Taucher and Oschlies, 2011; Laufkötter et al., 2015).
oceans provide through heat and carbon storage, they also         However, declines in phytoplankton primary production are
have major implications for the health of marine ecosystems.      consistently amplified in higher trophic levels such as zoo-
Ocean ecosystems are affected by the direct and indirect con-     plankton (Chust et al., 2014; Stock et al., 2014; Kwiatkowski
sequences of climate change. Atmospheric warming and ris-         et al., 2018) and fish (Lotze et al., 2019).
ing CO2 concentrations drives ocean warming and acidifi-             Dissolved oxygen in the ocean exerts a strong control on
cation, while these direct factors cause changes that modu-       marine ecosystems. At low O2 levels, marine animals are un-
late other important components of the ocean system, such         able to sustain aerobic metabolism, which can lead to mor-
as oxygenation, nutrient levels, and net primary production.      tality (Vaquer-Sunyer and Duarte, 2008). Oxygen levels also
   Temperature is a principal determinant of biological           affect many oceanic biogeochemical cycles through an im-
metabolism in the ocean (e.g. Eppley, 1972) and plays a ma-       pact on redox reactions and microbial metabolism (e.g. on
jor role in shaping the global distribution of marine species     the nitrogen cycle, Gruber, 2004). Global warming is driving
(e.g. Thomas et al., 2012; Sunagawa et al., 2015). The ra-        a global decline of dissolved oxygen in the ocean, referred
diative forcing associated with greenhouse gas emissions re-      to as ocean deoxygenation, because of a warming-induced
sults in an accumulation of heat in the Earth system, most of     reduction in O2 solubility and increased stratification and re-
which is taken up by the oceans (Frölicher et al., 2014). Glob-   duced ventilation (Keeling et al., 2010; Oschlies et al., 2018).
ally averaged sea surface temperature (SST) has increased         A recent assessment, based on three different analyses (Helm
by +0.7 ◦ C over the last 100 years (Bindoff et al., 2007),       et al., 2011; Schmidtko et al., 2017; Ito et al., 2017), con-
with observations indicating that the heat content trend in       cluded that the oxygen content over the first 1000 m of the

Biogeosciences, 17, 3439–3470, 2020                                                  https://doi.org/10.5194/bg-17-3439-2020
L. Kwiatkowski et al.: Twenty-first century marine biogeochemistry in CMIP6                                                3441

ocean has decreased by 0.5 to 3.3 % (or 0.7 to 3.5 % be-          to exacerbate negative impacts on photosynthesis, calcifica-
tween 100 and 600 m) over 1970–2010 (Bindoff, et al., in          tion, reproduction, and survival of marine organisms (Har-
press). In coastal systems, this warming effect is exacerbated    vey et al., 2013), while compound exposure to acidification
by the effects of increased loading of nutrients and organic      and low oxygen can also have synergistic effects (McBryan
matter, which also lead to oxygen decline and an increase in      et al., 2013) and may reduce the thermal tolerance of certain
coastal ocean dead zones (Breitburg et al., 2018). Earth Sys-     species (Pörtner, 2010).
tem model projections consistently show continuing declines          Here we assess future projections of climate-related
in oxygen over the twenty-first century as a function of the      drivers of marine impacts within the Coupled Model Inter-
employed scenario (Bopp et al., 2013; Cocco et al., 2013),        comparison Project Phase 6 (CMIP6; Eyring et al., 2016;
with large uncertainties in the tropics and for the evolution     O’Neill et al., 2016) simulations, evaluating how these dif-
of oxygen minimum zones (Cabré et al., 2015).                     fer from previous CMIP5 (Taylor et al., 2011) simulations.
   The uptake of carbon by the oceans affects marine chem-        We focus on projected changes in ocean temperature, pH,
istry via ocean acidification (Gattuso and Buddemeier, 2000;      dissolved O2 and NO−    3 concentration, and net primary pro-
Orr et al., 2005; Doney et al., 2009), a process that increases   duction across 13 CMIP6 and 10 CMIP5 Earth system mod-
seawater concentrations of CO2 , H+ , and HCO−       3 and re-    els. Expanding on previous CMIP intercomparison studies
duces pH and CO2−    3  ion concentrations.  The   oceans  have   (e.g. Steinacher et al., 2010; Bopp et al., 2013; Cocco et al.,
absorbed approximately 30 % of anthropogenic carbon emis-         2013), which typically concentrate on upper-ocean mean
sions since the pre-industrial era (Sabine et al., 2004; Khati-   state changes in biogeochemistry, we also assess benthic im-
wala et al., 2009, 2013; Gruber et al., 2019), resulting in       pacts and changes in seasonal cycles.
global surface pH declines of approximately 0.1 units (Bind-
off et al., 2007). Declines in global open ocean surface pH       1.2   Ocean biogeochemical model development since
are 0.018 units per decade over 1991–2011 (Lauvset et al.               CMIP5
2015), with individual time series stations exhibiting de-
clines of 0.017 to 0.027 units per decade (Bindoff, et al.,       A comprehensive assessment of changes between CMIP5
in press). Earth system models have projected twenty-first        and CMIP6 in the ocean biogeochemical components of
century global surface ocean pH declines of up to 0.33 units      Earth system models (ESMs) and their associated skill is
under previous high-emissions scenarios (Bopp et al., 2013),      provided in Séférian et al. (2020). Since CMIP5, CMIP6
with associated changes in the seasonal cycles of seawater        has seen a general increase in the horizontal grid resolution
carbonate chemistry (McNeil and Sasse, 2016; Kwiatkowski          of physical ocean models and a limited increase in verti-
and Orr, 2018; Landschützer et al., 2018).                        cal resolution. The latter may be particularly important for
   The impact of ocean acidification on marine species is ex-     ecosystem projections as it directly affects simulated strat-
tensive and diverse. Calcifying species, such as echinoderms,     ification, a key factor influencing changes in ocean impact
bryozoans, and cnidarians, exhibit depressed calcification,       drivers (Capotondi et al., 2012; Bopp et al., 2013; Laufköt-
growth, and survival under acidification (Kroeker et al.,         ter et al., 2015; Kwiatkowski et al., 2017) and their impact
2010; Albright et al., 2016; Kwiatkowski et al., 2016), al-       on higher trophic levels (Stock et al., 2014; Chust et al.,
tering the competitive balance in ecosystems (Kroeker et al.,     2014; Kwiatkowski et al., 2018; Lotze et al., 2019). Up-
2013). In teleost fish and marine invertebrates, ion exchange     dates in the representation of ocean biogeochemical pro-
is reduced under acidification, depressing protein synthe-        cesses between CMIP5 and CMIP6 have generally included
sis and metabolic rates (Langenbuch et al., 2006; Pörtner,        increases in model complexity (Séférian et al., 2020). Specif-
2008). Physiological and behavioural functioning is also sen-     ically, CMIP6 models provide more widespread inclusion
sitive to acidification, with olfactory discrimination (Mun-      of dissolved oxygen, micronutrients, such as iron, variable
day et al., 2009) and predator–prey responses (Watson et al.,     stoichiometric ratios, and improved representation of lower
2014, 2017) shown to be impaired under more acidified con-        trophic levels including heterotrophic bacteria and the cy-
ditions.                                                          cling and sinking of organic matter (Séférian et al., 2020).
   Marine organisms typically experience changes in mul-             Relative to CMIP5, the CMIP6 Earth system models dis-
tiple physical and geochemical conditions simultaneously,         play an improved ability to reproduce the modern mean-
with impacts determined by the interactions between poten-        state distribution of a number of key biogeochemical trac-
tial stressors. For example, the combined effect of warming       ers (Séférian et al., 2020). Although global-scale totals of
and deoxygenation is projected to force poleward and ver-         ocean carbon flux and net primary production estimates have
tical contractions of metabolically viable habitat for marine     been improved in CMIP6 with respect to CMIP5, the simu-
ectotherms (Deutsch et al., 2015). At the physiological level,    lated geographical distribution of present-day mean state air–
experimental studies indicate that synergistic effects between    sea CO2 fluxes and surface chlorophyll concentrations show
potential marine stressors are common (Gunderson et al.,          only moderate improvements between CMIP5 and CMIP6.
2016). Compound warming and acidification has been shown          There are also moderate improvements in the representation
                                                                  of subsurface dissolved oxygen concentrations in most ocean

https://doi.org/10.5194/bg-17-3439-2020                                                  Biogeosciences, 17, 3439–3470, 2020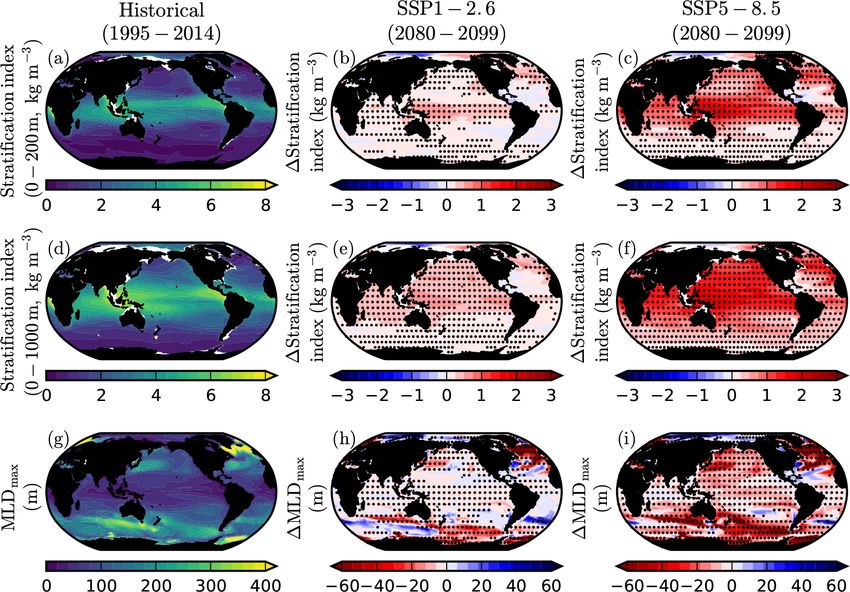
3442                                          L. Kwiatkowski et al.: Twenty-first century marine biogeochemistry in CMIP6

basins. Model skill in the representation of surface macronu-        et al., 2016; Krumhardt et al. 2017; Freeman et al., 2018).
trient concentrations in CMIP6 has improved for dissolved            Two of the CMIP6 models included in our analysis (GFDL-
silicate but declined slightly for nitrate.                          CM4 and ACCESS-ESM1.5) do not include NO−            3 as a prog-
                                                                     nostic tracer. Hence, their NO−   3 concentrations   were calcu-
                                                                     lated from modelled total dissolved inorganic phosphorus as-
2     Methodology                                                    suming a constant Redfield ratio of 16 : 1.
                                                                        To facilitate intercomparison, model output on each na-
The analysis of projected multiple ocean impact drivers pre-         tive grid was regridded to the same regular 1◦ × 1◦ horizon-
sented here focuses on three key depth levels: the upper             tal grid using distance weighted average remapping (climate
ocean, the thermocline, and the benthic zone. The surface            data operators; remapdis). Model outputs were kept on their
zone is where most biological activity is concentrated in the        native vertical grids, with vertical discretisation ranging from
oceans and where impacts from climate change are typically           40 (MPI-ESM1.2) to 75 (IPSL-CM6A-LR, CNRM-ESM2-1
the greatest. Specifically, we assess projections of surface         and UKESM1-0-LL) levels, except for models using hybrid
ocean temperature, surface ocean pH, subsurface dissolved            or isopycnic vertical coordinates for which model outputs
O2 concentration (averaged between 100 and 600 m), upper-            were vertically regridded to 35 (GFDL-ESM4, GFDL-CM4)
ocean NO−   3 concentration (averaged between 0 and 100 m)
                                                                     and 70 (NorESM2-LM) levels. Following generally adopted
and net primary production (depth integrated over the full           practice (e.g. Bopp et al., 2013), all models were given equal
water column). The choice of vertical range for O2 reflects          weighting in the respective CMIP6 and CMIP5 ensemble
the potential importance of the expansion of oxygen mini-            mean. However, within the CMIP6 ensemble two modelling
mum zones, which are more prominent at such depths. The              groups contributed two ESMs and within the CMIP5 ensem-
choice of vertical range for NO−   3 reflects its importance as
                                                                     ble three modelling groups contributed two ESMs, which is
a critical macronutrient supporting primary production in the        likely to influence the extent of model independence (Mas-
euphotic zone. Both vertical ranges are chosen to be compat-         son and Knutti, 2011; Knutti et al., 2015; Sanderson et al.,
ible with the recent assessment of marine drivers in the IPCC        2015; Lovenduski and Bonan, 2017).
Special Report on the Ocean and Cryosphere (Bindoff, et al.,            The CMIP5 historical simulations had variable start dates
in press). Additionally, for the CMIP6 models we assess ben-         between 1850 and 1861, all of which finished in 2005; the
thic ecosystem drivers, focussing on projections of bottom           subsequent RCP simulations started in 2006 and were run
temperature, pH, and O2 concentration. The benthic level is          until at least 2099. In CMIP6, there is greater temporal con-
defined as the bottom-ocean model layer at each grid point.          sistency. All CMIP6 historical simulations were made over
As such, its exact depth depends on vertical discretisation          1850–2014, while the subsequent SSP scenarios started in
and bathymetry, which differs across the CMIP6 ensemble.             2015 and ran until at least 2100. To facilitate comparison
All benthic model outputs were corrected for potential drift         between CMIP5 and CMIP6, the historical and future pro-
at the grid cell level (e.g. Gehlen et al., 2014; Séférian et al.,   jections of ocean impact drivers in both phases of CMIP are
2016) using coincident pre-industrial control simulations.           presented as anomalies relative to 1870–1899 mean values
                                                                     of their respective historical simulations. When solely eval-
2.1    Processing and analysis of model outputs                      uating twenty-first century projections in the SSPs, however,
                                                                     the last 20 years of the CMIP6 historical simulations (1995–
All ESMs assessed in the CMIP5 and CMIP6 ensembles (Ta-              2014) are used as a baseline period. Throughout the analysis,
bles 1 and 2) include physical ocean models and coupled              the uncertainty associated with global mean projections is as-
ocean biogeochemistry schemes that account for some or               sessed using the inter-model SD (given ± uncertainties). At
all of the potential ocean impact drivers: temperature, pH,          regional scales, projection robustness is evaluated using pre-
O2 , NO−3 , and net primary production. A total of 10 CMIP5          viously adopted approaches (e.g. Bopp et al., 2013), includ-
and 13 CMIP6 models are assessed with the model ensemble             ing whether the magnitude of the multi-model mean anomaly
size differing among scenarios depending on contributions            exceeds the inter-model SD or if there is at least 80 % model
from each model group. The CMIP5 ensemble is the same                sign agreement. The interquartile range of regional projec-
as that used in the comprehensive assessment of projected            tions is given in the annexes.
ocean drivers provided by Bopp et al. (2013). Only one en-
semble member per model is used for a given scenario. That           2.2   From Representative Concentration Pathways to
is, in CMIP terminology we typically use ensemble member                   Shared Socioeconomic Pathways
“r1i1p1” from each CMIP5 model and “r1i1p1fx” from each
CMIP6 model (where “fx” is the recommended set of ex-                Aside from changes in ESMs, a fundamental difference be-
ternal forcings employed by the various modelling groups).           tween CMIP5 and CMIP6 is that they differ in the future
Consequently, we do not assess the role of internal variabil-        scenarios used for anthropogenic emissions and land use
ity in the emergence of climate-related changes in marine            change. Those scenarios are derived from integrated assess-
ecosystems drivers (e.g. Frölicher et al., 2016; Lovenduski          ment models and based on plausible future pathways of so-

Biogeosciences, 17, 3439–3470, 2020                                                     https://doi.org/10.5194/bg-17-3439-2020
L. Kwiatkowski et al.: Twenty-first century marine biogeochemistry in CMIP6                                                                        3443

Table 1. The CMIP6 Earth system models used in this study; their individual components used to represent ocean, sea ice, and marine
biogeochemistry; and the ocean impact drivers and simulations that were assessed.

 Model and reference        Ocean and sea ice   Marine biogeo-   Drivers                 Simulations                       Data DOI
                                                chemistry
 ACCESS-ESM1.5              MOM5, CICE4         WOMBAT           T, pH, O2 , NO−
                                                                               3 , NPP   Historical, SSP1-2.6, SSP2-4.5,   Ziehn et al. (2019a, b)
 (Ziehn et al., 2020)                                                                    SSP3-7.0, SSP5-8.5
 CanESM5                    NEMO 3.4.1-LIM2     CMOC             T, pH, O2 , NO−
                                                                               3         Historical, SSP1-2.6, SSP2-4.5,   Swart et al. (2019b, c)
 (Swart et al., 2019a)                                                                   SSP3-7.0, SSP5-8.5
 CESM2                      POP2-CICE5          MARBL-BEC        T, pH, NO−
                                                                          3 , NPP        Historical, SSP1-2.6, SSP2-4.5,   Danabasoglu (2019a, b)
                                                                                         SSP3-7.0, SSP5-8.5
 CESM2-WACCM                POP2-CICE5          MARBL-BEC        T, pH, NO−
                                                                          3 , NPP        Historical, SSP1-2.6, SSP2-4.5,   Danabasoglu (2019c, d)
                                                                                         SSP3-7.0, SSP5-8.5
 CNRM-ESM2-1                NEMOv3.6-           PISCESv2-gas     T, pH, O2 , NO−
                                                                               3 , NPP   Historical, SSP1-2.6, SSP2-4.5,   Séférian (2018, 2019)
 (Séférian et al., 2019)    GELATOv6                                                     SSP3-7.0, SSP5-8.5
 GFDL-CM4                   MOM6, SIS2          BLINGv2          T, pH, O2 , NO−
                                                                               3         Historical, SSP2-4.5, SSP5-8.5    Guo et al. (2018a, b)
 (Held et al., 2019;
 Dunne et al., 2020a)
 GFDL-ESM4                  MOM6, SIS2          COBALTv2         T, pH, O2 , NO−
                                                                               3 , NPP   Historical, SSP1-2.6, SSP2-4.5,   Krasting et al. (2018);
 (Dunne et al., 2020b;                                                                   SSP3-7.0, SSP5-8.5                John et al. (2018)
 Stock et al., 2020)
 IPSL-CM6A-LR               NEMOv3.6-LIM3       PISCESv2         T, pH, O2 , NO−
                                                                               3 , NPP   Historical, SSP1-2.6, SSP2-4.5,   Boucher et al. (2018,
 (Boucher et al., 2020)                                                                  SSP3-7.0, SSP5-8.5                2019)
 MIROC-ES2L                 COCO                OECO2            T, pH, O2 , NO−
                                                                               3 , NPP   Historical, SSP1-2.6, SSP2-4.5,   Hajima et al. (2019);
 (Hajima et al., 2020)                                                                   SSP3-7.0, SSP5-8.5                Tachiiri et al. (2019)
 MPI-ESM1.2-HR              MPIOM               HAMOCC6          T, pH, O2 , NO−
                                                                               3 , NPP   Historical, SSP1-2.6, SSP2-4.5,   Schupfner et al. (2019);
 (Müller et al., 2018;                                                                   SSP3-7.0, SSP5-8.5                Jungclaus et al. (2019)
 Mauritsen et al., 2019)
 MRI-ESM2                   MRICOM4             NPZD             T, pH, O2 , NO−
                                                                               3         Historical, SSP5-8.5              Yukimoto et al. (2019b, c)
 (Yukimoto et al., 2019a)
 NorESM2-LM                 BLOM- CICE5         iHAMOCC          T, pH, O2 , NO−
                                                                               3 , NPP   Historical, SSP1-2.6, SSP2-4.5,   Seland et al. (2019a, b)
 (Tjiputra et al., 2020)                                                                 SSP3-7.0, SSP5-8.5
 UKESM1-0-LL                NEMO v3.6, CICE     MEDUSA-2         T, pH, O2 , NO−
                                                                               3 , NPP   Historical, SSP1-2.6, SSP2-4.5,   Good et al. (2019); Tang
 (Sellar et al., 2019)                                                                   SSP3-7.0, SSP5-8.5                et al. (2019)

cietal development. In CMIP6, the Shared Socioeconomic                     first century (Kriegler et al., 2017). Given that differences
Pathways (SSPs) provided via the Scenario Model Intercom-                  among projections of surface ocean acidification are dom-
parison Project (ScenarioMIP) are used instead of the RCPs                 inated by scenario uncertainty, with relatively little inter-
that were used in CMIP5 (O’Neill et al., 2016). The SSPs                   model uncertainty and internal variability (e.g. Bopp et al.,
provide revised emission and land use scenarios relative to                2013; Frölicher et al., 2016), such changes in atmospheric
the RCPs (Riahi et al., 2017).                                             concentrations of CO2 are expected to have a large impact on
   In this study, we confine our assessment of ocean im-                   projections of ocean pH and related carbonate system vari-
pact drivers to concentration-driven simulations, focussing                ables.
on Tier 1 SSPs of ScenarioMIP (O’Neill et al., 2016), that                    Alongside the assessment of the SSP concentration-driven
is SSP1-2.6, SSP2-4.5, SSP3-7.0, and SSP5-8.5, which re-                   model outputs, outputs from models forced under the four
sult in end-of-century approximate total radiative forcing lev-            RCPs (RCP2.6, RCP4.5, RCP6.0 and RCP8.5) are also as-
els of 2.6, 4.5, 7.0, and 8.5 W m−2 , respectively. The SSPs               sessed in parallel. This allows some comparison with past
have generally higher associated concentrations of atmo-                   CMIP5 assessments (e.g. Bopp et al., 2013). However,
spheric CO2 and lower associated atmospheric concentra-                    RCP6.0 has no direct SSP analogue, while SSP3-7.0 has no
tions of CH4 and N2 O relative to their RCP counterparts                   direct RCP analogue.
(O’Neill et al., 2016; Meinshausen et al., 2019). This is
particularly the case for SSP5-8.5, which in comparison to
RCP8.5 assumes that coal constitutes a greater proportion
of the primary energy mix in the second half of the twenty-

https://doi.org/10.5194/bg-17-3439-2020                                                                Biogeosciences, 17, 3439–3470, 2020
3444                                          L. Kwiatkowski et al.: Twenty-first century marine biogeochemistry in CMIP6

Table 2. The CMIP5 Earth system models used in this study; their individual components used to represent ocean, sea ice, and marine
biogeochemistry; and the simulations that were assessed. All models provided temperature, pH, oxygen, nitrate, and NPP outputs, as in Bopp
et al. (2013).

       Model and reference           Ocean and sea ice    Marine biogeochemistry     Simulations
       CESM1-BGC                     POP2-CICE4           BEC                        Historical, RCP4.5, RCP8.5
       (Gent et al., 2011)
       CMCC-CESM                     OPA8-2-LIM2          PELAGOS                    Historical, RCP8.5
       (Vichi et al., 2011;
       Cagnazzo et al., 2013)
       GFDL-ESM2G                    GOLD                 TOPAZ2                     Historical, RCP2.6, RCP4.5, RCP6.0, RCP8.5
       (Dunne et al., 2012)
       GFDL-ESM2M                    MOM5                 TOPAZ2                     Historical, RCP2.6, RCP4.5, RCP6.0, RCP8.5
       (Dunne et al., 2012)
       HadGEM2-ES                    UM                   Diat-HadOCC                Historical, RCP2.6, RCP4.5, RCP6.0, RCP8.5
       (Collins et al., 2011)
       IPSL-CM5A-LR                  NEMOv3.2-LIM2        PISCES                     Historical, RCP2.6, RCP4.5, RCP6.0, RCP8.5
       (Dufresne et al., 2013)
       IPSL-CM5A-MR                  NEMOv3.2-LIM2        PISCES                     Historical, RCP2.6, RCP4.5, RCP8.5
       (Dufresne et al., 2013)
       MPI-ESM-LR                    MPIOM                HAMOCC5-2                  Historical, RCP2.6, RCP4.5, RCP8.5
       (Giorgetta et al., 2013)
       MPI-ESM-MR                    MPIOM                HAMOCC5                    Historical, RCP2.6, RCP4.5, RCP8.5
       (Giorgetta et al., 2013)
       NorESM1-ME                    MICOM-CICE4          HAMOCC5.1                  Historical, RCP2.6, RCP4.5, RCP6.0, RCP8.5
       (Bentsen et al., 2013)

3     Results and discussion                                           2010 (90 % confidence range; Bindoff, et al., in press) en-
                                                                       compasses the CMIP6 multi-model mean response over the
3.1    Comparison with historical global trends                        corresponding years. Given the performance of the CMIP6
                                                                       models at reproducing ocean biogeochemical mean condi-
Observed historical trends in global mean surface ocean                tions (Séférian et al., 2020) and trends, they are deemed ap-
temperature, pH, and subsurface oxygen were compared                   propriate to project future trends in biogeochemistry under
with the multi-model mean of the CMIP6 ensemble over                   the SSPs.
the corresponding years of historical simulations (Table 3).
Global observations of historical trends in euphotic-zone              3.2   Global upper-ocean projections
nitrate concentrations and integrated primary production
were deemed insufficiently robust, given the associated                Under all SSPs, global multi-model mean sea surface tem-
interannual–decadal variability, to be assessed in the mod-            perature is projected to increase, while surface pH, subsur-
els (Elsworth et al. 2020). The observed 1901–2012 SST                 face dissolved oxygen concentration, euphotic-zone nitrate
warming of +0.06 ◦ C per decade is well reproduced in the              concentration and net primary production are projected to de-
CMIP6 ensemble, although SST warming between 1979 and                  cline during the twenty-first century (Fig. 1). The projected
2012 is warm-biased in the multi-model mean. Global sur-               change in the five ocean impact drivers increases with as-
face ocean acidification of −0.018 units per decade between            sociated radiative forcing across the four SSPs. Under the
1991 and 2011 is also well reproduced by the CMIP6 mod-                high-mitigation SSP1-2.6 scenario, the end-of-century model
els, particularly considering that the observed trend is a re-         mean changes (2080–2099 mean values relative to 1870–
construction based on discrete surface ocean f CO2 measure-            1899) in sea surface temperature, surface pH, subsurface
ments and alkalinity estimates that are derived from temper-           oxygen concentration, euphotic nitrate concentration, and
ature and salinity (Lauvset et al., 2015). Finally, with respect       net primary production are +1.42 ± 0.32 ◦ C, −0.16 ± 0.002,
to subsurface deoxygenation, the observed dissolved oxygen             −6.36±2.92, −0.52±0.23 mmol m−3 , and −0.56±4.12 %,
trend of −0.30 to −1.52 mmol m−3 per decade from 1970 to               respectively. Under the high-emissions scenario SSP5-8.5,

Biogeosciences, 17, 3439–3470, 2020                                                        https://doi.org/10.5194/bg-17-3439-2020
L. Kwiatkowski et al.: Twenty-first century marine biogeochemistry in CMIP6                                                           3445

Table 3. Historical trends in ocean impact drivers in observations and CMIP6 models. Observed multi-decadal historical trends in global
mean sea surface temperature, surface pH, and subsurface O2 (averaged between 100 and 600 m) and the corresponding trend in the CMIP6
ensemble. Uncertainty estimates are the inter-model SD.

  Variable         Years         Observed trend and reference                                           CMIP6 trend
  SST              1901–2012     +0.06 (◦ C decade−1 ; Hartmann et al., 2013)                           +0.055 ± 0.015 (◦ C decade−1 )
  SST              1979–2012     +0.095 (◦ C decade−1 ; Hartmann et al., 2013)                          +0.152 ± 0.042 (◦ C decade−1 )
  Surface pH       1991–2011     −0.018 (units decade−1 ; Lauvset et al., 2015)                         −0.016 ± 0.0003 (units decade−1 )
  Subsurface O2    1970–2010     −0.30 to −1.52 (mmol m−3 decade−1 ; Helm et al., 2011;                 −0.49 ± 0.097
                                 Schmidtko et al., 2017; Ito et al., 2017; Bindoff, et al., in press)   (mmol m−3 decade−1 )

the corresponding changes are 3.47± 0.78 ◦ C, −0.44±0.005,               and euphotic-zone nitrate concentrations, inter-model un-
−13.27±5.28, −1.06±0.45 mmol m−3 , and −2.99±9.11 %                      certainty is greater still and can exceed scenario uncer-
(Table 4), respectively. Across these two scenarios, the sep-            tainty. This greater inter-model uncertainty is a result of oxy-
aration between CMIP6 projections of sea surface tempera-                gen and nitrate concentrations being strongly influenced by
ture and pH and to a lesser extent oxygen and nitrate, further           both physical changes (e.g. changes in solubility, circula-
demonstrate the effectiveness of intense mitigation strategies           tion, and mixing) and changes in biological sources and sinks
in limiting twenty-first century marine ecosystem exposure               (Stramma et al., 2012; Fu et al., 2016; Bopp et al., 2017; Os-
to potential stress. This is in agreement with assessments of            chlies et al., 2018).
previous multi-model projections (e.g. CMIP5; Bopp et al.,                  The inter-model uncertainty associated with CMIP6 net
2013).                                                                   primary production projections is consistently larger than the
   Following previous assessments (Bopp et al., 2013), inter-            scenario uncertainty. Indeed, for each SSP, individual mod-
model uncertainty is estimated as the inter-model SD. Al-                els project both increases and decreases in global primary
though some of this model spread is due to internal variabil-            production, with the inter-model SD encompassing positive
ity, this contribution is limited for global averages and its            and negative anomalies (Fig. 1). This is a consequence of
relative contribution to inter-model uncertainty is expected             net primary production changes reflecting a diverse and del-
to decline throughout the twenty-first century (Frölicher et             icately balanced suite of bottom-up and top-down ecological
al., 2016). Relative to scenario uncertainty, which is esti-             processes, which are variously parameterised across models.
mated as the maximum difference between mean SSP pro-                    Bottom-up changes in phytoplankton growth rates are typi-
jections, inter-model uncertainty is extremely low for surface           cally driven by a combination of enhanced nutrient limita-
pH projections, which show distinct separation between the               tion and reduced temperature and light limitation (Doney,
SSPs prior to 2050. The low inter-model uncertainty asso-                2006; Steinacher et al., 2010; Taucher and Oschlies, 2011),
ciated with projections of surface ocean pH is well charac-              while top-down changes in zooplankton grazing rates can si-
terised and associated with the identical CO2 forcing used               multaneously influence the stock of phytoplankton biomass
by all ESMs in concentration-driven SSP and RCP projec-                  (Laufkötter et al., 2015). The accurate simulation of many of
tions (Lovenduski et al., 2016), a weak climate–pH feed-                 the biogeochemical tracers upon which net primary produc-
back (Orr et al., 2005; McNeil and Matear, 2007), limited in-            tion (NPP) depends (e.g. the distribution of iron; Tagliabue
terannual variability, and consistently adopted standards for            et al., 2016) represents a significant and ongoing challenge
ESM ocean carbonate chemistry equations (Orr et al., 2017).              to ESMs (Séférian et al., 2020).
Surface ocean pCO2 and corresponding carbonate chemistry
generally follow changes in atmospheric CO2 with a global                3.3    Regional patterns of upper-ocean change
mean equilibration time of approximately 8 months (Gattuso
and Hansson, 2011). The differences between projected sur-               Global-scale projections of end-of-century upper-ocean im-
face pH across the SSPs therefore reflect the divergence of              pact drivers (2080–2099 anomalies relative to 1995–2014
prescribed atmospheric CO2 concentrations, i.e. the different            mean values) exhibit spatial variability that is both ocean
scenarios.                                                               impact driver and SSP dependent (Fig. 2). CMIP6 projec-
   In comparison to pH, projections of SST exhibit greater               tions of SST show near global increases under both SSP1-
inter-model uncertainty (Fig. 1). This uncertainty is likely             2.6 and SSP5-8.5, with generally high regional robustness
to result from differences in climate sensitivity between                across the model ensemble. The greatest warming is evident
models. Historically, such differences have been attributed              in the Northern Hemisphere, particularly the Arctic Ocean
to diversity in cloud feedbacks and to a lesser extent wa-               and high-latitude North Pacific, where multi-model mean
ter vapour and lapse-rate feedbacks (Andrews et al., 2012;               warming can exceed 2 ◦ C in SSP1-2.6 and 5 ◦ C in SSP5-8.5.
Vial et al., 2013). For projections of subsurface oxygen                 This Arctic amplification is well established in both obser-
                                                                         vations (Bekryaev et al., 2010) and models, and thought to

https://doi.org/10.5194/bg-17-3439-2020                                                            Biogeosciences, 17, 3439–3470, 2020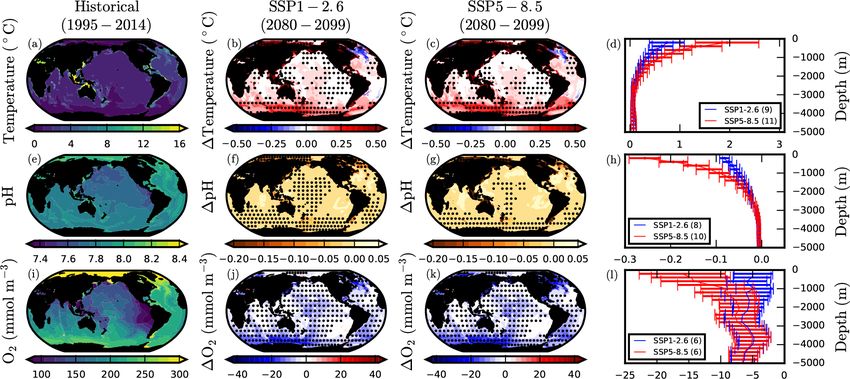
3446                                           L. Kwiatkowski et al.: Twenty-first century marine biogeochemistry in CMIP6

Table 4. Global mean changes in multiple ocean impact drivers across the CMIP6 and CMIP5 ensembles. Global mean anomalies of
sea surface temperature, surface ocean pH, subsurface dissolved O2 concentration (averaged between 100 and 600 m), upper-ocean NO−
                                                                                                                                 3
(averaged between 0–100 m), and depth-integrated net primary production for the CMIP6 SSPs and CMIP5 RCPs. Anomalies are given as
2080–2099 mean values relative to the 1870–1899 mean. Uncertainty estimates are the inter-model standard deviation.

                         RCP2.6          RCP4.5          RCP6.0          RCP8.5        SSP1-2.6        SSP2-4.5        SSP3-7.0        SSP5-8.5
                                              CMIP5                                                           CMIP6
 1SST (◦ C)         +1.15 ± 0.33    +1.74 ± 0.44    +1.82 ± 0.54    +3.04 ± 0.62    +1.42 ± 0.32    +2.10 ± 0.43    +2.89 ± 0.61    +3.47 ± 0.78
 1pH               −0.14 ± 0.001   −0.21 ± 0.002   −0.27 ± 0.004   −0.38 ± 0.005   −0.16 ± 0.002   −0.26 ± 0.003   −0.35 ± 0.003   −0.44 ± 0.005
 1O2 (mmol m−3 )    −3.71 ± 2.47    −6.16 ± 2.86    −6.56 ± 3.27    −9.51 ± 2.13    −6.36 ± 2.92    −8.14 ± 4.08   −12.44 ± 4.40   −13.27 ± 5.28
 1NO−         −3
     3 (mmol m )    −0.38 ± 0.15    −0.51 ± 0.14    −0.60 ± 0.18    −0.66 ± 0.49    −0.52 ± 0.23    −0.65 ± 0.32    −0.86 ± 0.43    −1.06 ± 0.45
 1NPP− ( %)         −3.42 ± 2.47    −5.06 ± 3.56    −4.82 ± 3.60    −8.54 ± 5.88    −0.56 ± 4.12    −1.13 ± 5.81    −1.40 ± 7.25    −2.99 ± 9.11

be primarily driven by temperature and surface albedo feed-                Helm et al., 2011; Schmidtko et al., 2017; Ito et al., 2017),
backs (Screen and Simmonds, 2010; Pithan and Mauritsen,                    with an assessed range of 3.0 to 8.3 % between 1970 and
2014). The notable exception to warming is in the subpo-                   2010 (Bindoff et al., in press), though it has been suggested
lar North Atlantic where there is minor cooling in SSP1-2.6                that such observations are the result of climate variability
and limited warming in SSP5-8.5. Although it is associated                 (Deutsch et al., 2011; Bindoff et al., in press). These sub-
with high inter-model uncertainty (Figs. 2b,c and A1), this                surface O2 increases are, however, consistent with previous
“warming hole” is well documented in both observations and                 projections, including those from CMIP5, which have high-
models and typically related to a slow down in the Atlantic                lighted that coarse-resolution models struggle to reproduce
meridional overturning circulation (Drijfhout et al., 2012;                subsurface ventilation pathways in these regions (Stramma
Menary and Wood, 2018). Spatial patterns of SST anoma-                     et al., 2012; Andrews et al., 2013; Busecke et al., 2019).
lies are broadly consistent with those of the CMIP5 ensemble                  For a subset of the CMIP6 models (CanESM5, CNRM-
(Bopp et al., 2013).                                                       ESM2-1, GFDL-CM4, IPSL-CM6A-LR, MIROC-ES2L,
   Anomalies in surface ocean pH are ubiquitously negative                 MPI-ESM1.2-HR and UKESM1-0-LL), projected changes
under both SSP1-2.6 and SSP5-8.5, with very low associ-                    in subsurface O2 concentration under SSP5-8.5 were decom-
ated inter-model uncertainty (Figs. 2e and f and A1). Consis-              posed into changes in O2 saturation (O2 sat ) and apparent
tent with past model projections (McNeil and Matear, 2007;                 oxygen utilisation (AOU), where 1O2 = 1O2 sat − 1AOU
Steinacher et al., 2009; Bopp et al., 2013), the greatest de-              (Fig. 3). O2 sat was computed from model temperature and
clines in pH are projected in the higher latitudes and the                 salinity outputs and represents the effect of oxygen solubility
Arctic Ocean in particular, where model mean declines can                  changes on dissolved O2 concentration, while AOU was cal-
exceed 0.45 in SSP5-8.5 (2080–2099 anomalies relative to                   culated as 1AOU = 1O2 sat − 1O2 , and is affected by both
1995–2014; Fig. 2e, f). The enhanced Arctic Ocean acidifi-                 changes in biological consumption of O2 and in ventilation
cation reflects both the large surface ocean warming in the                and stratification. The heightened reductions in subsurface
Arctic, which acts to decrease pH, as well as the related                  O2 in the North Pacific and North Atlantic are shown to be
loss of permanent and semi-permanent sea ice (McNeil and                   the result of consistent reductions in O2 sat and increases in
Matear, 2007; Steinacher et al., 2009). Sea ice melt increases             AOU, which act to reinforce O2 concentration declines. In
anthropogenic carbon uptake and decreases pH by both pro-                  contrast, the projected increases in O2 in the tropical Indian
viding a greater surface area for air–sea gas exchange and                 and Atlantic Oceans are shown to be the result of reductions
simultaneously enhancing air–sea CO2 fluxes by dilution of                 in AOU that lower oxygen demand more than the concurrent
dissolved inorganic carbon concentrations with freshwater                  reductions in O2 sat . These tropical reductions in AOU are
(Yamamoto-Kawai et al., 2009; Yamamoto et al., 2012).                      generally robust across the model ensemble despite this not
   Although global mean subsurface (100–600 m) O2 con-                     being the case for the coincident increases in O2 . The spa-
centration is projected to decline under all SSPs, there is                tial patterns of CMIP6 projected changes in subsurface O2 sat
a high degree of variability in projections at regional scales             and AOU under SSP5-8.5 are similar to that of the CMIP5
(Fig. 2h,i). The largest declines in subsurface O2 generally               models under RCP8.5 (Bopp et al., 2017). The general re-
occur at higher latitudes and in particular in the North Pa-               duction in O2 sat has been shown to be predominantly due
cific, where declines in the multi-model mean can exceed                   to warming-driven reductions in solubility, while the height-
45 mmol m−3 in SSP5-8.5. In equatorial regions of the At-                  ened AOU declines in the North Pacific and North Atlantic
lantic and Indian Ocean and upwelling regions of the Pacific,              have been primarily attributed to reductions in ventilation
increases in subsurface O2 concentration are projected un-                 and an increase in the age of these waters (Bopp et al., 2017;
der both SSP1-2.6 and SSP5-8.5. However, these increases                   Tjiputra et al., 2018).
have high inter-model uncertainty and are at odds with histor-                CMIP6 multi-model mean projections of NO−      3 concentra-
ical observations of OMZ expansion (Stramma et al., 2008;                  tions in the euphotic zone (0–100 m) show variable regional

Biogeosciences, 17, 3439–3470, 2020                                                           https://doi.org/10.5194/bg-17-3439-2020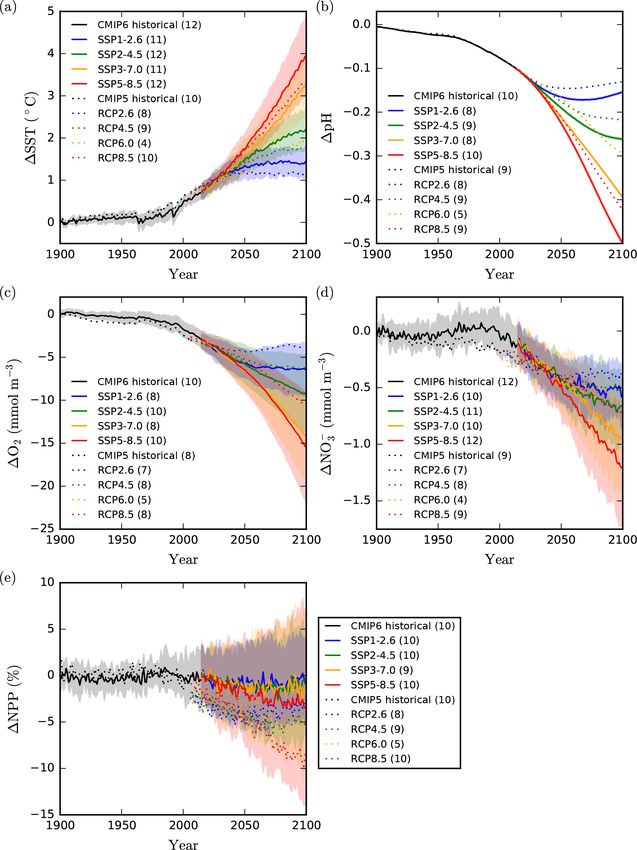
L. Kwiatkowski et al.: Twenty-first century marine biogeochemistry in CMIP6                                                          3447

Figure 1. Global mean projections of upper-ocean impact drivers. Global mean projections of (a) sea surface temperature (◦ C), (b) surface
ocean pH, (c) subsurface dissolved O2 concentration (averaged between 100–600 m; mmol m−3 ), (d) euphotic-zone NO−    3 (averaged between
0–100 m; mmol m−3 ), and (e) depth-integrated net primary production ( %). Values are anomalies relative to the 1870–1899 reference period.
CMIP6 mean anomalies for the historical and SSP simulations are shown as solid lines with shading representing the inter-model SD. CMIP5
projections only show the multi-model mean. The model ensemble size for each scenario is given in parentheses.

declines under SSP1-2.6 and SSP5-8.5 (Fig. 2k,l). These pro-               Projections of primary production anomalies are highly di-
jected declines are robust and largest in the Arctic Ocean,             verse across regions (Fig. 2n,o). The global CMIP6 multi-
equatorial eastern Pacific, North Atlantic, and North Pacific,          model mean decline in primary production is shown to be pri-
where they can exceed 3 mmol m−3 in SSP5-8.5. NO−     3 con-            marily driven by declines in the North Atlantic and the west-
centrations show limited anomalies in the subtropical gyres             ern equatorial Pacific, which can exceed 40 gC m−2 y−1 un-
where concentrations are already very low. The CMIP6 spa-               der SSP5-8.5. In the high latitudes, primary production gen-
tial pattern of euphotic-zone NO−  3 anomalies is in broad              erally increases, with anomalies approaching 20 gC m−2 y−1
agreement with CMIP5 projections (Fu et al., 2016).                     in parts of the Arctic and Southern Oceans under SSP5-
                                                                        8.5. Such changes have historically been associated with

https://doi.org/10.5194/bg-17-3439-2020                                                         Biogeosciences, 17, 3439–3470, 2020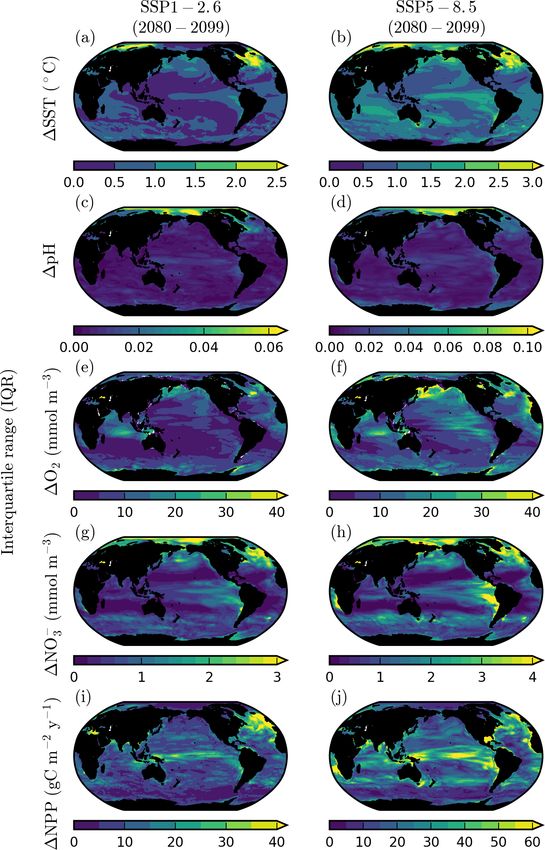
3448                                          L. Kwiatkowski et al.: Twenty-first century marine biogeochemistry in CMIP6

Figure 2. Projections of multiple upper-ocean impact drivers under SSP1-2.6 and SSP5-8.5. CMIP6 mean historical climatologies and
twenty-first century anomalies in (a–c) sea surface temperature (◦ C), (d–f) surface ocean pH, (g–i) subsurface dissolved O2 concentration
(averaged between 100 and 600 m; mmol m−3 ), (j–l) euphotic-zone NO−                                                 −3
                                                                          3 (averaged between 0 and 100 m; mmol m ), and (m–o) depth-
                                        −2   −1
integrated net primary production (gC m y ). Anomalies are 2080–2099 mean values relative to the 1995–2014 baseline period. Stippling
designates areas of projection robustness. For temperature and pH this is defined as the magnitude of the mean anomaly exceeding the inter-
model SD. For O2 , NO3 , and NPP this is defined as at least 80 % model sign agreement.

Figure 3. Change in subsurface oxygen saturation and apparent oxygen utilisation under SSP5-8.5. CMIP6 multi-model mean changes in
(a) subsurface dissolved O2 concentration (averaged between 100 and 600 m; mmol m−3 ), (b) subsurface O2 saturation (O2 sat ), and (c)
subsurface apparent oxygen utilisation (AOU) in 2080–2099 of SSP5-8.5 relative to 1995–2014. Stippling designates robustness, as defined
by at least 80 % model sign agreement (only a subset of CMIP6 models were considered).

Biogeosciences, 17, 3439–3470, 2020                                                         https://doi.org/10.5194/bg-17-3439-2020
L. Kwiatkowski et al.: Twenty-first century marine biogeochemistry in CMIP6 3449
enhanced stratification as the upper ocean warms (Doney, associated with heightened increases in stratification, notably
2006). In tropical and mid-latitude waters, where phyto- in the upper 200 m of the water column. In these regions, par-
plankton are nutrient limited, this tends to reduce the ver- ticularly the North Atlantic, the maximum mixed-layer depth
tical nutrient supply and exacerbate nutrient stress. In con- also shoals. As such, there is strong evidence that reduced
trast, in high-latitude waters, where phytoplankton are typi- vertical mixing and entrainment of nutrients into the upper
cally light limited, enhanced stratification can reduce mixing ocean is, at least partially, responsible for these regional de-
below the euphotic depth and therefore result in reduced light clines in primary production. However, similar increases in
stress. However, the simplicity of this paradigm has been stratification and reductions in mixed-layer depth occur in
challenged by observations, which show regionally variable regions such as the North Pacific and Indian Ocean, where
coupling between changes in stratification and primary pro- declines in primary production are largely absent. There-
duction on interannual timescales (Lozier et al., 2011; Dave fore, further assessment of simultaneous changes in pro-
and Lozier, 2013), with recent studies demonstrating the ad- cesses such as nutrient advection (e.g. Whitt, 2019), nitro-
ditional importance of changes to the horizontal advection of gen fixation (Riche and Christian, 2018), the microbial loop
nutrients (Whitt, 2019) and zooplankton grazing (Laufköt- (e.g. Schmittner et al., 2008; Taucher and Oschlies, 2011),
ter et al., 2015) in shaping regional primary production re- and top-down grazing pressure (e.g. Laufkötter et al., 2015)
sponses. are required to fully understand the regional primary produc-
Although the general pattern of NPP changes is similar in tion response in CMIP6.
CMIP6 compared to CMIP5, regional declines are reduced in
magnitude, less spatially extensive, and are typically less ro-
3.5 Compound stressors
bust. This is particularly notable in the Indian Ocean and sub-
tropical North Pacific, which were regions of consistent NPP
decline in CMIP5 projections (Bopp et al., 2013) but exhibit The projected occurrence of multiple potential ecosystem
limited robust trends in CMIP6. The projected increase in stressors in the upper ocean was determined across the SSPs
NPP in the high latitudes is, however, broadly consistent with using prescribed thresholds of surface warming (> +2 ◦ C),
previous model intercomparisons (Steinacher et al., 2010; surface acidification (< −0.2 units), subsurface deoxygena-
Bopp et al., 2013), which have attributed these increases to tion (< −30 mmol m−3 ) and euphotic-zone NO− 3 decline
the retreat of sea ice, reduced deep mixing and corresponding (< −1 mmol m−3 ), with anomalies calculated as 2080–2099
reductions in light limitation. mean values relative to 1995–2014 (Fig. 5). It should be
noted that our choice of stressor thresholds, based on the
3.4 Stratification and mixed-layer depth magnitude of biogeochemical anomalies, are somewhat arbi-
trary. Indeed, it could be argued that absolute biogeochemical
The difference between densities at the surface, 200, and thresholds, for example as defined for hypoxia or oligotro-
1000 m are used as stratification indices in the CMIP6 pro- phy, may better reflect potential ecosystem stress. Moreover,
jections and given alongside changes in the maximum mixed- the thresholds take no account of regional differences in nat-
layer depth (Fig. 4). Global multi-model mean stratification ural temperature, pH, O2 , and NO− 3 variability, which may
is consistently projected to increase over the twenty-first cen- mediate ecosystem responses to changes in mean conditions
tury, with greater increases under SSPs that have higher ra- (e.g. Kroeker et al., 2020). That being said, a single thresh-
diative forcing. Under SSP1-2.6, the global change in strat- old that encompasses the variety of ecosystem responses to
ification index is +0.13 ± 0.05 kg m−3 between the surface a particular stressor likely does not exist.
and 200 m and +0.26±0.08 kg m−3 between the surface and The concurrent exceedance of multiple thresholds in-
1000 m, while under SSP5-8.5 this increase to +0.58 ± 0.11 creases with associated radiative forcing across the SSPs,
and +0.90 ± 0.20 kg m−3 , respectively. Over the same pe- indicative of greater potential compound ecosystem stres-
riod, the global mean maximum annual mixed-layer depth sors. The tropical and subtropical oceans are generally char-
shoals by 7.0 ± 3.3 m in SSP1-2.6 and 19.5 ± 2.6 m in SSP5- acterised by projected compound warming and acidifica-
8.5. With the exception of the Arctic Ocean, multi-model tion under SSP3-7.0 and SSP5-8.5, with additional nutrient
projections of increasing stratification are typically consis- thresholds exceeded in regions of equatorial upwelling. The
tent across most regions, with robustness increasing under North Pacific is characterised by high sensitivity to potential
SSP5-8.5 and when the upper 1000 m of the water column is compound stressors, with all thresholds of warming, acidifi-
considered. Projected shoaling of the maximum mixed-layer cation, deoxygenation, and nutrient decline exceeded under
depth is also generally robust across the multi-model ensem- SSP5-8.5. In contrast, the projected occurrence of compound
ble, albeit with slightly less model consistency, as would be stressors is limited in the Southern Ocean, where only the
expected given the coincident climatic changes in wind stress acidification threshold is consistently exceeded. The North
and surface heat fluxes (Fig. 4h,i). Atlantic is characterised by sensitivity to combined acidifi-
The regions of projected primary production decline in the cation and nutrient stress, while the Arctic Ocean is sensitive
North Atlantic and western equatorial Pacific are typically to compound warming, acidification, and nutrient stress.
https://doi.org/10.5194/bg-17-3439-2020 Biogeosciences, 17, 3439–3470, 20203450 L. Kwiatkowski et al.: Twenty-first century marine biogeochemistry in CMIP6
Figure 4. Change in stratification and mixed-layer depth in SSP1-2.6 and SSP5-8.5. CMIP6 mean historical climatologies and anomalies
in (a–c) stratification index between 200 m and the surface (kg m−3 ), (d–f) stratification index between 1000 m and the surface (kg m−3 ),
and (g–i) maximum annual mixed-layer depth (m). Anomalies are 2080–2099 mean values relative to 1995–2014. The stratification index is
defined as the difference in density between given depths and the surface. Stippling designates robustness, as defined by the magnitude of
the mean anomaly exceeding the inter-model SD.
3.6 CMIP6 vs. CMIP5 projections The enhanced acidification in CMIP6 relative to CMIP5 is
consistent across models (Fig. 6, Table 4) and attributable to
higher prescribed atmospheric CO2 levels in the forcing of
While the temporal behaviour of changes in ocean impact the SSP scenarios relative to the RCP scenarios with equiva-
drivers is similar across the CMIP5 and CMIP6 model en- lent radiative forcing (Meinshausen et al., 2019). Year 2100
sembles (Fig. 1), the CMIP6 Earth system models generally atmospheric CO2 levels are 1135.2, 602.8, and 445.6 ppm in
project greater global surface ocean warming, acidification, SSP5-8.5, SSP2-4.5, and SSP1-2.6, respectively. The corre-
subsurface deoxygenation, and euphotic zone NO3 reduc- sponding levels in RCP8.5, RCP4.5, and RCP2.6 are 936,
tions than the CMIP5 projections performed with compa- 538, and 421 ppm, respectively (Meinshausen et al., 2011).
rable radiative forcing (Fig. 6, Table 4). The CMIP6 mod- Therefore, although the SSP and RCP simulation pairs have
els, however, project reduced global primary production de- analogous end-of-century radiative forcing, the higher CO2
clines relative to comparable CMIP5 simulations. There is no levels in the SSPs result in greater acidification for the
consistent reduction in inter-model uncertainty in CMIP6. In CMIP6 projections.
fact, with respect to projections of primary production, inter- The greater euphotic-zone NO− 3 concentration declines in
model uncertainty is substantially increased in CMIP6. SSPs compared to their RCP analogues are likely a conse-
The projected end-of-century SST increase (2080–2099 quence of the enhanced surface warming in CMIP6 models.
minus 1870–1899) in SSP1-2.6, SSP2-4.5, and SSP5-8.5 is This warming results in a greater increase in upper-ocean
higher than in RCP2.6, RCP4.5 and RCP8.5, respectively. stratification than that projected in CMIP5 models (Cabré
This enhanced CMIP6 warming is attributable to generally et al., 2014; Fu et al., 2016). At the global scale, models
greater climate sensitivity in the CMIP6 model ensemble have been shown to consistently exhibit strong negative cor-
relative to the CMIP5 ensemble (Forster et al., 2019). In- relations between relative stratification anomalies and rel-
deed, the same version of a reduced complexity climate ative NO− 3 anomalies on interannual timescales (Fu et al.,
model (MAGICC7.0) run with CMIP5 and CMIP6 forcings, 2016). The greater increases in stratification in CMIP6 there-
projects marginally greater warming of near-surface air tem- fore result in greater reductions in mixing and entrainment of
peratures in the RCPs than comparative SSPs (Meinshausen nutrient-rich deep waters into the euphotic zone in compari-
et al., 2019), underlining that the greater SST increases in son with CMIP5.
CMIP6 are likely driven by changes to models and not forc-
ing datasets.
Biogeosciences, 17, 3439–3470, 2020 https://doi.org/10.5194/bg-17-3439-2020L. Kwiatkowski et al.: Twenty-first century marine biogeochemistry in CMIP6 3451
across the SSPs and are primarily responsible for both the
reduced multi-model mean declines and the large increase
in inter-model SD. Global increases in net primary pro-
duction have been previously documented in other model
studies (Schmittner et al., 2008; Taucher and Oschlies,
2011; Laufkötter et al., 2015) and attributed to temperature-
dependent intensification of the microbial loop increasing re-
generated production. Further analysis of the CMIP6 models
that project primary production increases is clearly required
to determine whether this is also the case or additional pro-
cesses (e.g. the temporal evolution of nitrogen fixation or iron
limitation) explain why they differ from previous generations
of the same Earth system model family.
3.7 Global benthic ocean projections
On average, bottom waters are consistently projected
to warm, acidify, and deoxygenate across the twenty-
first century (Fig. 7). Under SSP1-2.6, the end-of-
century model mean changes (2080–2099 relative to 1870–
1899) in bottom-water temperature, pH, and dissolved
Figure 5. Compound upper-ocean impact drivers. Regions where
O2 are +0.12 ± 0.03 ◦ C, −0.018 ± 0.001, and −5.14 ±
projected CMIP6 sea surface warming exceeds 2 ◦ C, euphotic-zone
2.04 mmol m−3 , respectively. Under SSP5-8.5 the corre-
(0–100 m) NO− −3
3 decline exceeds 1 mmol m , surface ocean pH
decline exceeds 0.2, and subsurface (100–600 m) dissolved O2 con- sponding changes are +0.22 ± 0.04 ◦ C, −0.030 ± 0.002, and
centration decline exceeds 30 mmol m−3 in (a) SSP1-2.6, (b) SSP2- −6.04 ± 2.19 mmol m−3 (Table 5). Thus, even for bottom
4.5, (c) SSP3-7.0, and (d) SSP5-8.5. The exceedance of driver waters, CMIP6 projections highlight that intense mitigation
thresholds is determined from 2080 to 2099 anomalies relative to strategies can limit ecosystem exposure to potential warming
1995–2014 values. and acidification stress during the twenty-first century (e.g.
Tittensor et al., 2010; Levin and Le Bris, 2015).
The magnitude of projected changes in bottom waters is
The enhanced subsurface deoxygenation in the SSPs rela- less than in surface and upper-ocean waters, while bottom-
tive to comparable RCPs is likely the consequence of both water uncertainties for a given scenario are larger (Fig. 7).
physical and biogeochemical processes (e.g. Bopp et al., This contrast is particularly evident for pH projections with
2017; Oschlies et al., 2018). The greater warming in CMIP6 the SSPs, whose ranges of uncertainty fully separate before
projections results in a greater reduction in O2 solubility, 2050 in the surface ocean (Fig. 1) but still have some over-
while also affecting the ventilation and transport of O2 within lap in 2080 for bottom waters. This relative increase in inter-
the ocean interior. In addition, concurrent changes in biolog- model uncertainty results from surface ocean chemistry be-
ical production, export and respiration can either mitigate or ing in equilibrium with the same atmospheric CO2 concen-
exacerbate physically driven subsurface deoxygenation (Os- trations for all models. Conversely, benthic pH changes are
chlies et al., 2018). strongly influenced by ocean circulation, which transports
The reduced declines in global net primary production anthropogenic carbon from the upper ocean to the seafloor
projected for the twenty-first century in the SSPs, relative and is variably impacted by climate change across models
to comparable RCPs, combined with large increases in the (e.g. Gregory et al., 2005; Cheng et al., 2013). The increased
associated inter-model uncertainty, is striking (Fig. 6e), par- uncertainty in pH projections with depth has been previously
ticularly given that declines in euphotic zone NO− 3 concen- noted for CMIP5 projections in the North Atlantic (Gehlen
trations are typically greater in the SSPs. This suggests that et al., 2014) and Arctic Ocean (Steiner et al., 2014). For pro-
the temporal evolution of phytoplankton resource limitation jected global deoxygenation in bottom waters, inter-model
and grazing pressure under climate change may have sig- uncertainty is substantially larger than scenario uncertainty
nificantly altered between CMIP5 and CMIP6. In previous in CMIP6. As with projections of subsurface dissolved O2 ,
CMIP biogeochemistry intercomparisons, all models pro- this larger model uncertainty results from the isolation of
jected global primary production declines, albeit with large bottom waters from the atmosphere. Thus, bottom waters at
inter-model uncertainty (Steinacher et al., 2010; Bopp et al., a given temperature and salinity may deviate substantially
2013). However, in CMIP6, four of the models (CESM2, from the value that would be determined by their solubility
CESM2-WACCM, CNRM-ESM2-1, and IPSL-CM6A-LR) and air–sea equilibrium due to effects from other physical
consistently project global increases in primary production and biogeochemical processes (e.g. Oschlies et al., 2018).
https://doi.org/10.5194/bg-17-3439-2020 Biogeosciences, 17, 3439–3470, 2020You can also read