Elk Monitoring in Mount Rainier and Olympic National Parks 2008 - 2017 Synthesis Report
←
→
Page content transcription
If your browser does not render page correctly, please read the page content below
National Park Service
U.S. Department of the Interior

Natural Resource Stewardship and Science

Elk Monitoring in Mount Rainier and Olympic
National Parks
2008 – 2017 Synthesis Report
Natural Resource Report NPS/NCCN/NRR—2021/2284
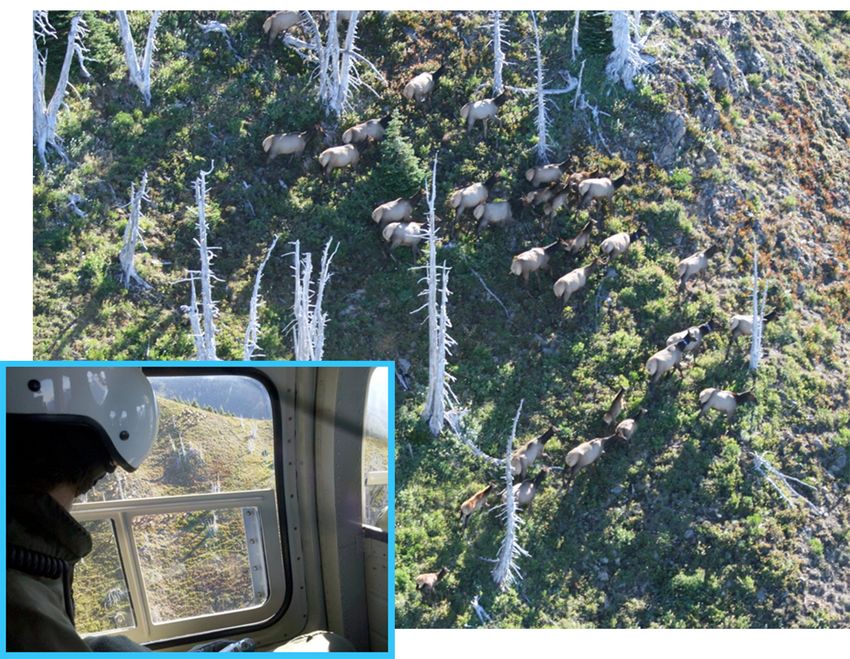
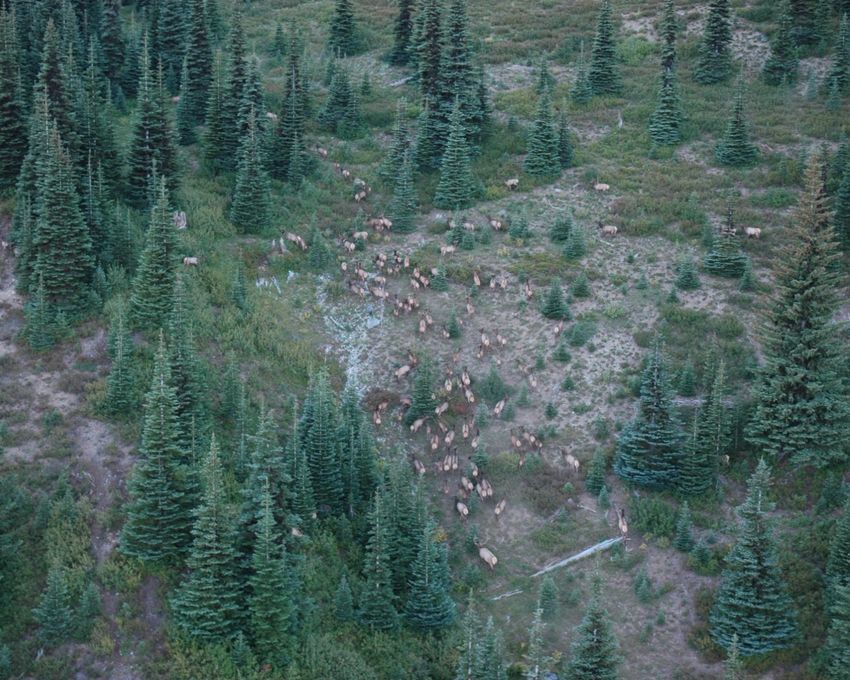
ON THIS PAGE
Elk, Cervus elaphus, in Mount Rainier National Park, WA.
Photograph by: Muckleshoot Indian Tribe.

ON THE COVER
Elk in Olympic National Park, August 2012. Inset, view of observer counting same group from inside the helicopter.
Photograph by: NPS I&M program.
Elk Monitoring in Mount Rainier and Olympic
National Parks
2008 – 2017 Synthesis Report
Natural Resource Report NPS/NCCN/NRR—2021/2284

K. J. Jenkins1, B. C. Lubow2, P. J. Happe3, K. Braun4, J. Boetsch4, W. Baccus4,
T. Chestnut5, D. J. Vales6, B. J. Moeller7, M. Tirhi8, E. Holman9, P. C. Griffin1,10

1
 U.S. Geological Survey, Forest & Rangeland Ecosystem Science Center, Port Angeles, WA
2
 1821 Willow Springs Way, Fort Collins, CO
3
 National Park Service, Olympic National Park, Port Angeles, WA
4
 National Park Service, North Coast and Cascades Network, Port Angeles, WA
5
 National Park Service, Mount Rainier National Park, Ashford, WA
6
 Muckleshoot Indian Tribe, Auburn, WA
7
 Puyallup Tribe of Indians, Puyallup, WA
8
 Washington Department of Fish and Wildlife, Lakewood, WA
9
 Washington Department of Fish and Wildlife, Ridgefield, WA
10
 Bureau of Land Management, Fort Collins, CO

July 2021

U.S. Department of the Interior
National Park Service
Natural Resource Stewardship and Science
Fort Collins, Colorado
The National Park Service, Natural Resource Stewardship and Science office in Fort Collins,
Colorado, publishes a range of reports that address natural resource topics. These reports are of
interest and applicability to a broad audience in the National Park Service and others in natural
resource management, including scientists, conservation and environmental constituencies, and the
public.

The Natural Resource Report Series is used to disseminate comprehensive information and analysis
about natural resources and related topics concerning lands managed by the National Park Service.
The series supports the advancement of science, informed decision-making, and the achievement of
the National Park Service mission. The series also provides a forum for presenting more lengthy
results that may not be accepted by publications with page limitations.

All manuscripts in the series receive the appropriate level of peer review to ensure that the
information is scientifically credible, technically accurate, appropriately written for the intended
audience, and designed and published in a professional manner.

This report received formal peer review by subject-matter experts who were not directly involved in
the collection, analysis, or reporting of the data, and whose background and expertise put them on par
technically and scientifically with the authors of the information. This report has been peer reviewed
and approved for publication consistent with USGS Fundamental Science Practices
(http://pubs.usgs.gov/circ/1367/).

Views, statements, findings, conclusions, recommendations, and data in this report do not necessarily
reflect views and policies of the National Park Service, U.S. Department of the Interior. Mention of
trade names or commercial products does not constitute endorsement or recommendation for use by
the U.S. Government.

This report is available in digital format from the North Coast and Cascades Network Inventory and
Monitoring website and the Natural Resource Publications Management website. If you have
difficulty accessing information in this publication, particularly if using assistive technology, please
email irma@nps.gov.

Please cite this publication as:

Jenkins, K. J., B. C. Lubow, P. J. Happe, K. Braun, J. Boetsch, W. Baccus, T. Chestnut, D. J. Vales,
B. J. Moeller, M. Tirhi, E. Holman, and P. Griffin. 2021. Elk monitoring in Mount Rainier and
Olympic national parks: 2008 ‒ 2017 synthesis report. Natural Resource Report NPS/NCCN/NRR—
2021/2284. National Park Service, Fort Collins, Colorado. https://doi.org/10.36967/nrr-2286864.

NPS 105/176843, 149/176843, July 2021
 ii
Contents
 Page

Figures.................................................................................................................................................... v

Tables .................................................................................................................................................... vi

Executive Summary ............................................................................................................................viii

Acknowledgments................................................................................................................................ xii

List of Terms .......................................................................................................................................xiii

Introduction ............................................................................................................................................ 1

 Elk as a Vital Sign .......................................................................................................................... 1

 History of Elk Monitoring in Mount Rainier and Olympic National Parks ................................... 3

 Monitoring and Reporting Objectives ............................................................................................ 4

Elk Populations and Study Areas ........................................................................................................... 5

 Mount Rainier National Park.......................................................................................................... 5

 Olympic National Park ................................................................................................................... 7

Methods................................................................................................................................................ 10

 Survey Design .............................................................................................................................. 10

 Survey Methods ............................................................................................................................ 10

 Aerial Surveys ......................................................................................................................... 10

 Data Management.................................................................................................................... 11

 Data Analysis................................................................................................................................ 12

 Introduction to Aerial-Bias-Correction Models ...................................................................... 12

 Development of MDSH Models ................................................................................................ 13

 Estimation of Elk Abundance and Population Composition ................................................... 18

 Trends in Abundance............................................................................................................... 19

 Trends in Spatial Distribution ................................................................................................. 22

 Trends in Population Composition .......................................................................................... 22

Results .................................................................................................................................................. 24

 Aerial Surveys .............................................................................................................................. 24
 iii
Contents (continued)
 Page

 MDSH Models................................................................................................................................. 24

 Elk Population Trends in Trend Count Areas of Mount Rainier National Park........................... 31

 Abundance ............................................................................................................................... 32

 Distribution .............................................................................................................................. 37

 Population Composition .......................................................................................................... 43

 Elk Population Trends in Trend Count Areas of Olympic National Park .................................... 49

 Abundance ............................................................................................................................... 49

 Distribution .............................................................................................................................. 52

 Population Composition .......................................................................................................... 58

Discussion ............................................................................................................................................ 62

 Elk Population Trends in MORA and OLYM Trend Count Areas .............................................. 62

 Elk Monitoring Challenges........................................................................................................... 66

 Future Needs and Opportunities ................................................................................................... 67

Conclusions .......................................................................................................................................... 70

Literature Cited .................................................................................................................................... 71

 iv
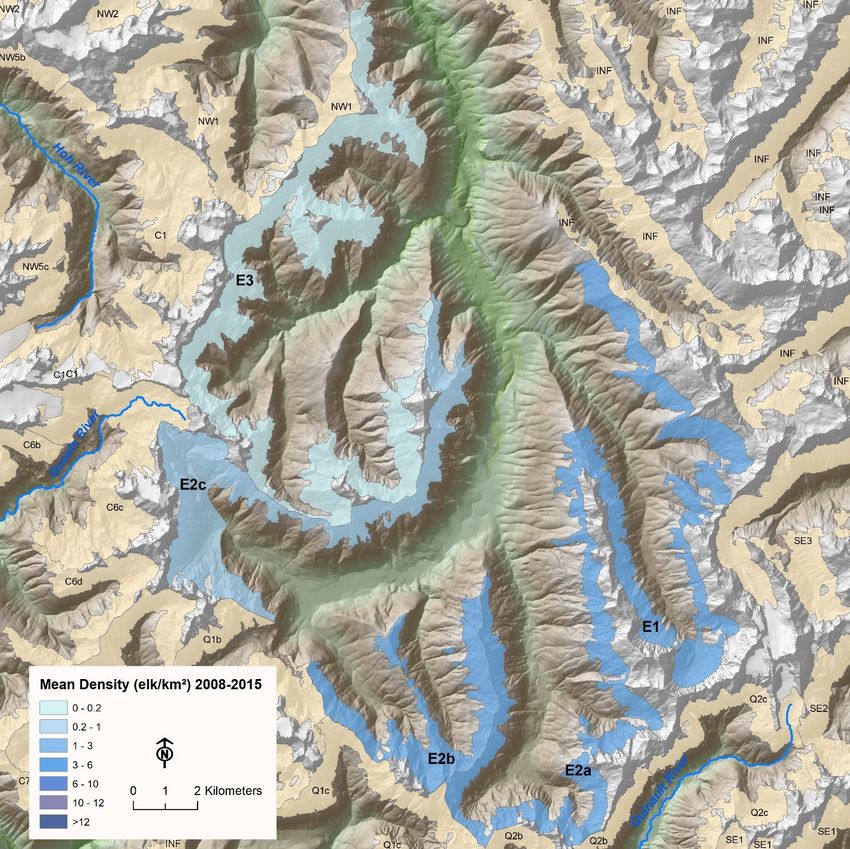
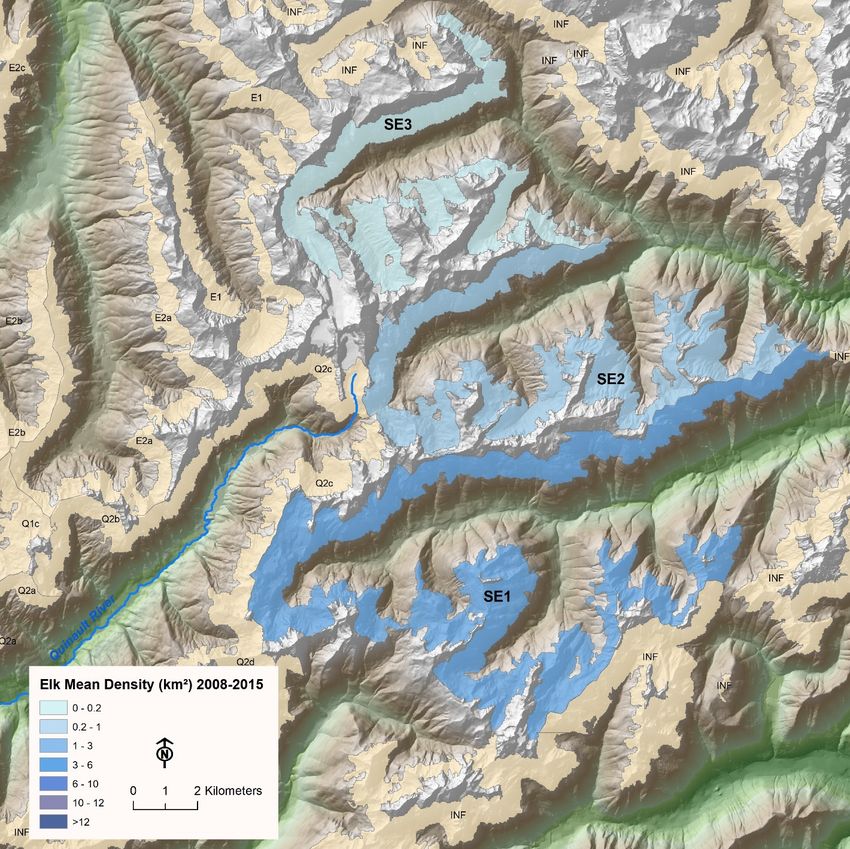
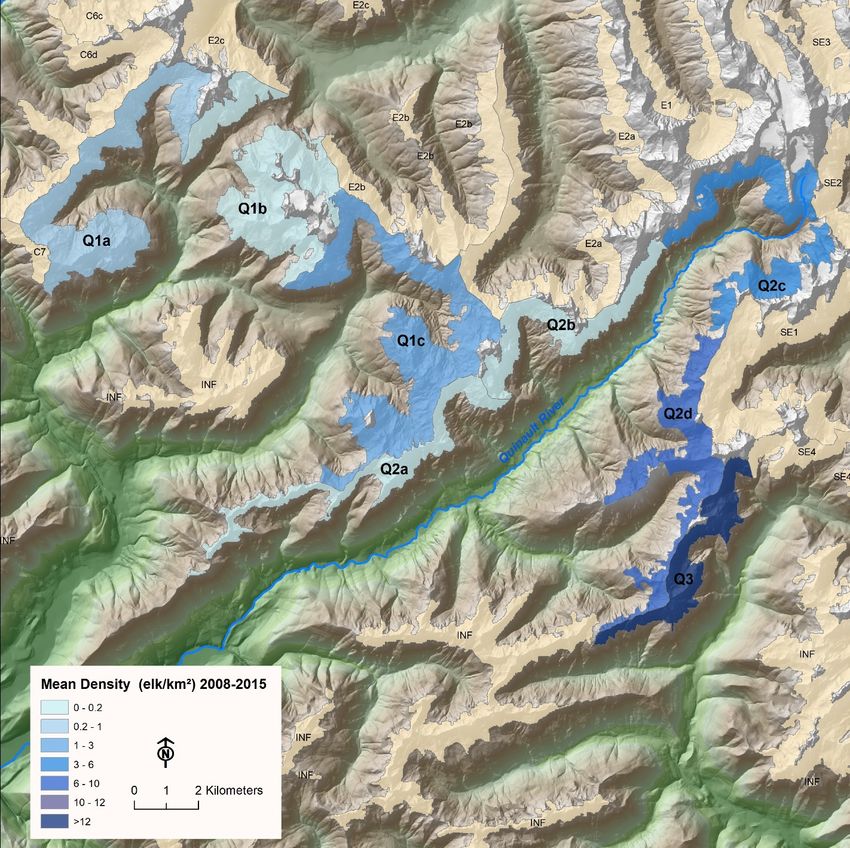
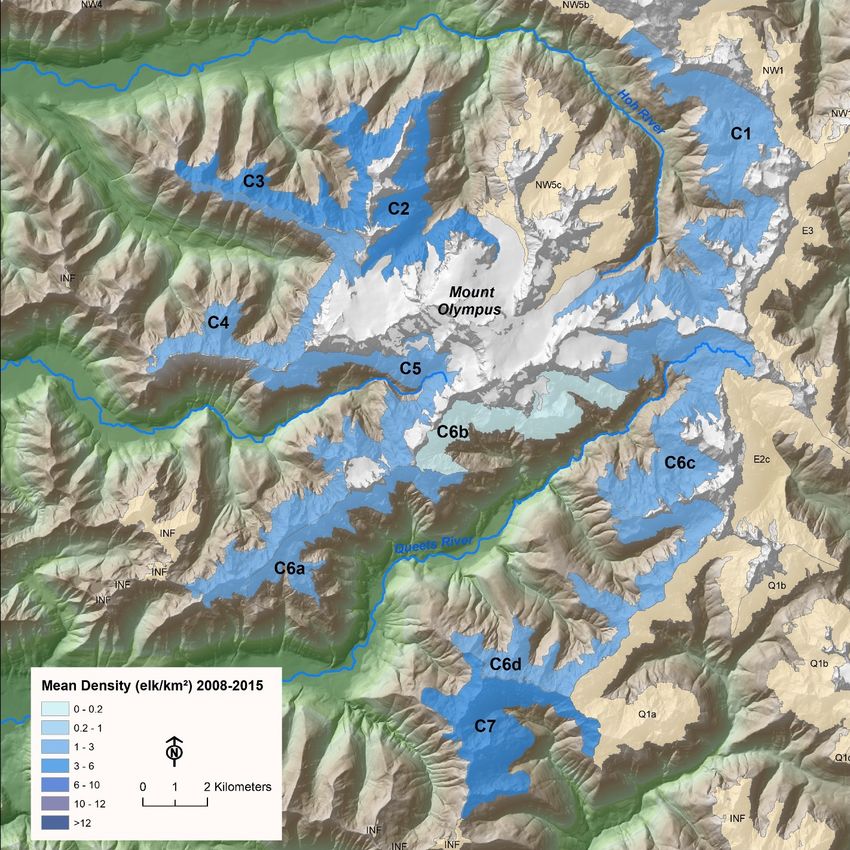
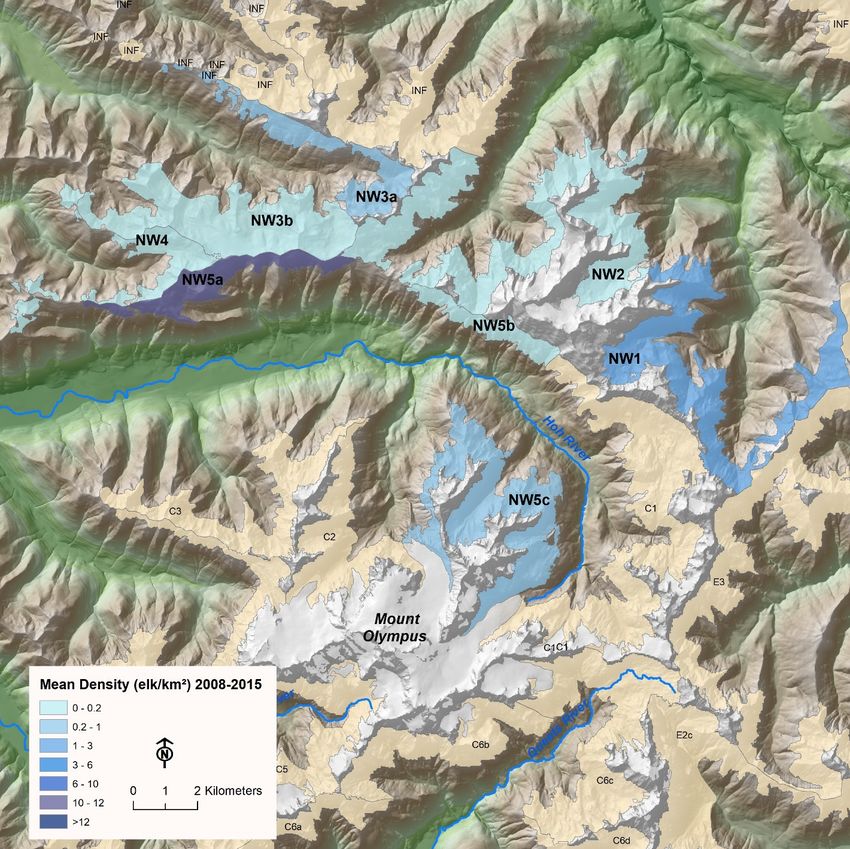
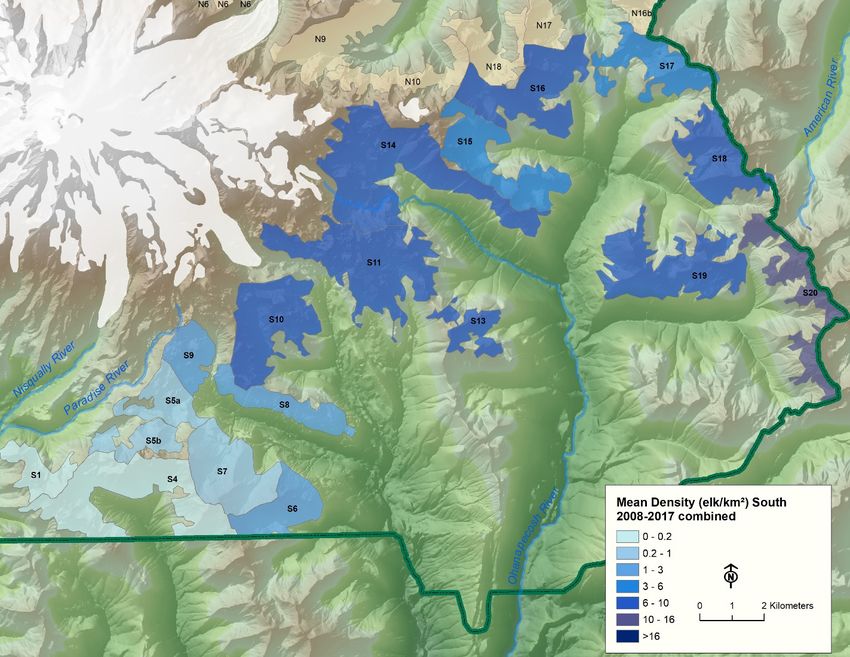
Figures
 Page

Figure 1. Approximate annual ranges of migratory components of North Rainier and
South Rainier elk herds that use MORA during summer. ..................................................................... 5

Figure 2. Summer trend count areas (TCA) in MORA, including North Rainier TCA and
South Rainier TCA ................................................................................................................................ 7

Figure 3. Map of OLYM and surrounding areas of the Olympic Peninsula, showing the
approximate distributions of elk that use OLYM during all or part of the year. ................................... 8

Figure 4. Trend count areas in OLYM, including Core TCA (surveyed annually) and
four alternate TCAs surveyed once every fourth year. .......................................................................... 9

Figure 5. Trends in estimated elk abundance in North and South Rainier TCAs, 2008-
2017...................................................................................................................................................... 36

Figure 6. Mean estimated elk density in survey units of North Rainier TCA, 2008-2017. ................ 38

Figure 7. Mean estimated elk density in survey units of South Rainier TCA, 2008-2017. ................ 39

Figure 8. Trends in sex and age ratios of elk in the North Rainier TCA, 2008-2017. ........................ 47

Figure 9. Trends in sex and age ratios of elk in the South Rainier TCA, 2008-2017. ........................ 48

Figure 10. Trends in estimated elk abundance in Core TCA, OLYM, 2008-2015. ............................ 50

Figure 11. Mean estimated elk density in survey units of Core TCA in OLYM, 2008-
2015...................................................................................................................................................... 52

Figure 12. Mean estimated elk density in survey units of Quinault TCA in OLYM, 2008-
2015...................................................................................................................................................... 54

Figure 13. Mean estimated elk density in survey units of Northwest TCA in OLYM,
2008-2015. ........................................................................................................................................... 55

Figure 14. Mean estimated elk density in survey units of Elwha TCA in OLYM, 2008-
2015...................................................................................................................................................... 56

Figure 15. Mean estimated elk density in survey units of Southeast TCA in OLYM,
2008-2015. ........................................................................................................................................... 57

Figure 16. Trends in sex and age ratios of elk in Core TCA in OLYM, 2008-2015. ......................... 61

Figure 17. Correlations of Summer Heat Index and Maximum Temperature with time
during years of study from 2008-2017 in the North and South Rainier TCAs in MORA
and 2008-2015 in the Core TCA in OLYM. ........................................................................................ 63

 v
Tables
 Page

Table 1. Model components, their interpretation, and rationale used to model detection
probabilities during aerial elk surveys in Mount Rainier and Olympic National Park,
2008-2017. ........................................................................................................................................... 15

Table 2. Descriptions of models fit to estimates of elk abundance in North Rainier and
South Rainier TCAs in MORA and Core TCA in OLYM, 2008-2017 ............................................... 20

Table 3. Descriptions of models fit to composition ratios of elk in North Rainier and
South Rainier TCAs in MORA and Core TCA in OLYM .................................................................. 23

Table 4. Flight summary statistics for aerial surveys of elk in North and South Rainier
trend count areas in MORA, 2008-2017. ............................................................................................. 25

Table 5. Flight summary statistics for aerial surveys of elk in trend count areas of
OLYM, 2008-2011. ............................................................................................................................. 26

Table 6. Coefficient estimates and model support statistics for each of 16 contributing
MDSH models used in model averaging. ............................................................................................ 28

Table 7. Raw counts and estimated abundance of elk in surveyed units in MORA, 2008-
2011...................................................................................................................................................... 32

Table 8. Model selection results for covariates that potentially affect elk abundance
estimates in North and South Rainier TCAs during aerial surveys in MORA, 2008-2017. ................ 34

Table 9. Mean abundance, relative density, and trends in relative density of elk in survey
units of North and South Rainer TCAs, 2008-2017............................................................................. 40

Table 10. Ratios of sex and age classes of elk in Trend Count Areas in MORA, 2008–17................ 44

Table 11. Candidate linear regression models of factors affecting composition ratios of
elk in North Rainier TCA and South Rainier TCA, based on all available estimates from
2008-2017, and associated ∆AICc values, model weights, and evidence ratios. ................................. 46

Table 12. Raw counts and total estimated abundance of elk and associated standard error
in surveyed units in OLYM TCAs, 2008-2015.................................................................................... 49

Table 13. Model selection results for covariates that potentially affect elk abundance
estimates in Core TCA during aerial surveys in OLYM, 2008-2015. ................................................. 51

Table 14. Mean abundance, relative density, and trends in relative density of elk in
survey units of North and South Rainer TCAs, 2008-2017. ................................................................ 53

Table 15. Estimated relative abundance of sex and age classes of elk in Trend Count
Areas of OLYM, 2008–17. .................................................................................................................. 59

 vi

Tables (continued)
 Page

Table 16. Candidate linear regression models of factors potentially affecting composition
ratios of elk in TCAs of OLYM, based on all available estimates from 2008-2017, and
associated ∆AICc values, model weights, and evidence ratios. ........................................................... 60

 vii
Executive Summary
In 2008, the U.S. Geological Survey (USGS) began collaborating with the National Park Service
(NPS)-North Coast and Cascades Network (NCCN), the Muckleshoot Indian Tribe (MIT), Puyallup
Tribe of Indians (PTOI), and Washington Department of Fish and Wildlife (WDFW) to develop a
standard survey protocol for monitoring long-term changes in the abundance, distribution, and
population composition of elk on key summer ranges within Mount Rainier National Park (MORA)
and Olympic National Park (OLYM). In MORA, surveys were conducted in two trend count areas
(TCAs) that correspond with primary summer ranges used by the North Rainier Herd, which winters
outside the park to the North, and the South Rainier Herd, which winters outside the park primarily to
the South. In OLYM, we defined five TCAs including an Olympic Core TCA (hereafter, Core TCA)
that encompasses summer ranges on the flanks of Mount Olympus, and four TCAs that encompass
other primary summer ranges throughout the park.

The standard protocol allows for estimating aerial survey detection biases and adjusting raw survey
counts to account for elk that were likely present but not seen during surveys. Previously, we
developed a suite of aerial-bias-correction models for use in estimating aerial detection biases and
adjusting raw counts of elk in MORA based on sighting conditions related to elk group size,
vegetation density, lighting conditions, elk movement, as well as combinations of these and other
factors. The models were based on independent sighting records of elk groups by front-seat and
back-seat observer pairs in a helicopter, including detection records of some radio-collared elk
groups.

Here, we analyze results of the first 10 years of elk monitoring in MORA (2008-2017) and 8 years in
OLYM (2008-2015). In a previous report covering surveys conducted from 2008-2011, data were not
sufficient to model detection biases of aerial surveys conducted in OLYM; hence, analyses of elk
population trends were based on counts adjusted for detection biases in MORA, whereas trends in
OLYM were based on raw, unadjusted counts (Griffin et al. 2013, Jenkins et al. 2015).

Our objectives for the current summary were to:

 (1) incorporate additional data to update aerial-bias-correction models previously developed for
 use in MORA to include corrections for aerial detection bias in both MORA and OLYM,
 (2) examine trends in elk abundance, distribution, and population composition estimates for
 subalpine summer ranges within MORA and OLYM, and
 (3) estimate effects of seasonal variation and weather on elk abundance and population
 composition estimates for subalpine summer ranges in both parks.
We updated previously developed aerial-bias-correction models based on 148 simultaneous double-
observer sightability (DO-S) trials associated with elk groups containing radio-collared elk (45 in
OLYM and 103 in MORA) and 1,653 simultaneous double-observer (DO) trials based on groups
without radio-collared elk (288 in OLYM and 1,365 in MORA) acquired from 2008 to 2015. Aerial
sightability varied among years, between parks, and in relation to individual sighting conditions,

 viii
particularly elk group size and movement, vegetation cover, and lighting conditions. We estimated
elk abundance and population composition by model-averaging individual estimates derived from 16
different bias-correction models, each including a variety of single variable and interactive effects.

We conducted 13 surveys of North Rainer TCA and 15 of South Rainier TCA from 2008-2017. We
estimated a mean of 359 (SE=34.6) elk present in North Rainier TCA and 477 (SE=50.2) elk in
South Rainier TCA during surveys, which corresponds with mean densities of 3.5 and 5.3 elk/km2 in
North (103.1 km2) and South Rainier (89.3 km2) TCAs, respectively.

Elk abundance in North Rainier TCA increased at an estimated instantaneous annual rate (ro) of
0.039 (SE=0.028; 95% confidence interval [CI]=-0.02, 0.09) during the 10-year span, although the
trend was not statistically significant. Multi-model comparisons indicated that statistical support for
population growth over time was small compared to support for competing models that related
population changes to weather variability, notably an increasing trend in maximum temperatures
measured on survey days.

Replicated surveys of South Rainier TCA revealed a curvilinear (quadratic) trend in elk abundance in
South Rainier TCA from 2008-2017. Estimated abundance increased initially from 2008-2011, but
subsequently declined resulting in no significant net change over the 10-year period (ro=-0.021;
SE=0.031; 95% CI=-0.12, 0.08). Although abundance appeared to be negatively influenced by
increasing summer heat index (SHI) from 2008-2017 in South Rainier TCA, evidence for the
observed quadratic trend in elk abundance outweighed that of combined weather effects.

Calf ratios remained approximately constant at about 42 and 36 calves:100 adult females (AF) in
North and South Rainier TCAs, respectively. There was a mean total of 41 males:100 AF in both
North and South Rainier TCAs. The ratio of males:100 AF tended to increase during the middle
years of the time series in South Rainier TCA but remained nearly constant in the later years. The
ratio of mature males:100 AF increased in a linear fashion over time in South TCA.

In OLYM, we surveyed Core TCA six times from 2008-2015, and we completed one or two surveys
each in Elwha, Northwest, Southeast, and Quinault TCAs from 2011-2014. We estimated a mean of
236 (SE=17.8) elk present during surveys of Core TCA or 2.3 elk/km2. Mean elk densities in less-
surveyed TCAs ranged from 0.2-2.9 elk/km2, with highest densities recorded in Quinault TCA.

Elk abundance estimated in Core TCA appeared to decline steeply over the 8-years sampled in
OLYM (ro=-0.157; 95% CI=-0.32, -0.03); however, statistical support for this trend was weak due to
the small number of estimates and considerable unexplained year-to-year variability in estimates. A
comparison of statistical support among the 16 models examined indicated there was strongest
statistical support for no change in elk abundance. To the extent there was support for declining
abundance, it was most closely associated (negatively) with annual variation in SHI.

Elk population composition remained constant from 2008-2015 in OLYM’s Core TCA. The
weighted mean calf ratio was 36:100 AF (SE=1.6) in Core TCA, whereas the weighted mean ratio of
all male classes combined was 60:100 AF (SE=7.5) and the weighted mean ratio of mature males

 ix
was 48:100 AF (SE=28.9) in the remaining TCAs. The weighted mean ratio of mature males was
49:100 AF (SE=7.2) in Core TCA.

There was considerable variation in densities of elk among subsample units within each TCA in both
parks. Elk densities ranged from
Moreover, importance of elk as keystone species affecting park ecosystems and cultural significance
of elk to multiple user groups is not in question, and perturbations to future elk populations due to
changing climate, predator regimes, and diseases are likely imminent. Although funding support,
logistical constraints, and analytical challenges all present obstacles to continuing existing elk survey
methods, promising new tools for estimating elk abundance are being developed continuously, and
each of the partners contributing to the current elk monitoring program share common interests in
understanding elk population trends at varying scales. We conclude that a group reexamination of
future options for elk monitoring in and around National Parks in NCCN would help to clarify new
monitoring directions and potential areas of interest for continued collaboration around both parks.

 xi
Acknowledgments
Elk monitoring in MORA and OLYM is a component of the Inventory and Monitoring Program of
the NPS North Coast and Cascades Network (NPS-NCCN; Weber et al. 2009). We would like to
thank the following agencies and tribes for providing substantial funding, personnel, and support of
elk monitoring in both parks: NPS (including NCCN, MORA, and OLYM), USGS (former National
Parks Monitoring Program, Forest and Rangeland Ecosystem Science Center), MIT, PTOI, WDFW,
and Washington’s National Park Fund. We are grateful for long-standing support of NPS, USGS,
MIT, PTOI, and WDFW, whose collaboration developed and sustained this monitoring program. We
would particularly like to thank each and every crew member who participated in these surveys,
either as observers and/or aviation managers: Peter Ellis, Brian Hasebe, Alyssa Herr, Glen Kessler,
Rich Lechleitner, Rebecca Lofgren, Dave Manson, James Montgomery, Ellen Myers, Julie Okita,
Larissa Perez, Mason Reid, Alison Robb, Steve Scott, Jessica Sherwood, Sarah Yates (NPS); Mike
Middleton, Mike Hilden, Mike McDaniel, Paul Rodarte (MIT); Eric Anderson, Paul Arnold, Tony
Benson, Don Coats, Phillip Dillon, Than Ehrlich, Elsie Wescott, Jason Wrolson (PTOI); Chris
Anderson, Stephanie Bergh, Brooke George, Brian Calkins, Brock Hoenes, Sandra Jonker, Scott
McCorquodale, Anne Marie Prince, Tammi Schmidt, Mike Smith, Nicholle Stephens (WDFW) and
Delbert Shoop (Northwest Helicopters). We thank the following pilots and animal capture crew for
their assistance: Doug Uttecht, Jess Hagerman, Rob Olmstead, John Peden, Trever Walker, Mike
Everett, Steve Goodman (Northwest Helicopters); Curt Cousins (Olympic Air); Jon Bourke, Zaron
Welch (Helicopter Express); Jim Pope, Mike Atchison, Grant Cadwallader, Wes Livingston, Coburn
Noear, Luke Rinebold, Jeannie Ross, DVM (Leading Edge Aviation). Thanks to the
Communications, Dispatch, and Fire and Aviation offices in MORA and OLYM for their help in
planning safe aviation and assisting during aviation operations. We are grateful to Matthew Clement,
Kyle Garrison, and Jason Ransom for providing many helpful comments on earlier drafts of this
manuscript. Any use of trade, product or firm names is for descriptive purposes only and does not
imply endorsement by the U.S. Government.

 xii
List of Terms
Aerial detection bias: Estimation error inherent in aerial surveys resulting from failure of observers
to detect all animals present during a survey, or from potentially recording some animals more than
once if they move undetected during the survey.

Aerial-bias-correction model: A general term for statistical models used to estimate probability of
aerial survey crews sighting groups of animals, which in turn is used to correct raw counts for aerial
detection bias. Different models can be developed from observational trials of various types
elaborated below.

Sightability trials/data: In sightability trials a single aerial observer (or multiple observers working
as a team) attempts to detect animal groups known to be present (either through radio-telemetry or
independent observation) under varying environmental, habitat, or survey-specific conditions that are
recorded as covariates.

Simultaneous double-observer (DO) trials/data: DO trials are attempts made by front- and back-
seat observer pairs in an aircraft to independently detect animal groups that do not contain any radio-
collared animals. These groups are conditionally present in the data set only if they were detected by
at least one observer. Although detection history is always collected, sometimes exclusively, it is
more common to also record corresponding covariate data that may help explain sighting probability
variation among groups to reduce bias due to lack of independence among groups.

Simultaneous double-observer sightability (DO-S) trials/data: DO-S trials are a combination of
both DO and sightability trials. DO-S trials are attempts by front- and back-seat observer pairs to
observe animal groups known to be present within the survey area and that contained at least one
radio-collared animal. DO-S trials allow for unconditional estimation of detection probability
because inclusion of DO-S trials in the data set is not contingent on any circumstance other than that
the group was present in the surveyed area. DO-S trials of groups containing collared animals are
assumed to be a random sample of all groups, with respect to recorded covariates.

 xiii
Introduction
In 2007, the North Coast and Cascades Network (NCCN) of the National Park Service (NPS) began
developing and implementing a program for monitoring trends in abundance, sex and age
composition, and distribution of elk (Cervus elaphus) populations within Mount Rainier National
Park (MORA) and Olympic National Park (OLYM). Elk populations were selected as one of 12
‘vital signs’ within NCCN—each intended to represent overall condition of park resources, effects of
environmental stressors, or specific natural resources of important human value (NPS,
https://www.nps.gov/im/vital-signs.htm, Accessed 18 May 2020). Because elk populations have such
extraordinary value to several agencies and sovereign Native American Tribes, monitoring protocols
were developed collaboratively with NPS, Muckleshoot Indian Tribe (MIT), Puyallup Tribe of
Indians (PTOI), and Washington Department of Fish and Wildlife (WDFW). This is the only
monitoring program within NCCN that was developed collaboratively with several agencies and that
is supported by funding and personnel from each collaborating agency and Tribe. We completed and
published the peer reviewed elk monitoring protocol in 2012 (Griffin et al. 2012) and synthesized
results of the first four years of monitoring in both parks (2008-2011) in 2015 (Jenkins et al. 2015).
Here, we build on the previous synthesis by adding four to six years to the data set (depending on
park) and reexamining trends in elk abundance, distribution and population composition on high-
elevation summer ranges in both parks throughout the 8-10-yr monitoring period.

Elk as a Vital Sign
As key components of lowland and mountain ecosystems in the Pacific Northwest, elk are tightly
woven into ecological, historical, and cultural fabrics of MORA and OLYM. Historically, Roosevelt
elk (Cervus elaphus roosevelti), the Pacific coastal subspecies of elk, were abundant in floodplains
and riparian forests along most major river systems in western Washington (Raedeke and Taber
1982). During summer, many herds migrated to subalpine meadows in adjoining mountains
(Schwartz and Mitchell 1945, Starkey et al. 1982). Although ethnographic records clearly indicate
that elk are indigenous to both Olympic Mountains and Cascades Ranges, elk had become rare or
absent around Mount Rainier prior to Euro-American settlement in the mid-1800s (Gustafson 1983,
Schullery 1983). By the start of the 20th century, unregulated elk hunting for meat, antlers, and trophy
‘ivory’ teeth had widely decimated elk populations throughout accessible and settled areas of Oregon
and Washington (Harper and colleagues 1985, Murie 1951). A notable exception occurred on
Washington’s Olympic Peninsula where a largely inaccessible wilderness helped protect a remnant
stronghold of native Roosevelt elk (Schwartz and Mitchell 1945).

Mount Rainier National Park was created in 1899 to preserve sights and ecosystems associated with
Mount Rainier, including its fish, wildlife, and renowned subalpine meadows. The area that would
become OLYM was set aside first as Mount Olympus National Monument in 1909 when elk
populations in the Pacific Northwest may have been at their nadir. The monument was established
explicitly to protect the last stronghold of Roosevelt elk and its native forested habitat. Concurrently,
elk were protected from hunting throughout Washington in the early 1900s and an active campaign
was waged to eradicate wolves (Canis lupus) and reduce other predator populations, notably cougar
(Puma concolor), to restore elk populations throughout Washington. Rocky Mountain elk (Cervus

 1
elaphus nelsoni) were reestablished in the Cascades Range in and around MORA through several
translocations of elk from Yellowstone and Grand Teton National Parks from 1912-15 and 1932-33
(Bradley 1982).

Elk Numbers increased in both parks during the early 20th century in response to coordinated
enhancement efforts. In Mount Olympus National Monument, over-browsing was reported in
western rainforest valleys as early as 1915, and large numbers of elk were reported dying during
severe winters beginning in 1918 (Schwartz 1939). During the 1930s, biologists reported abundant
elk populations and concerns about overgrazing on several key wintering areas of what is now
OLYM (Murie 1935a, Murie 1935b, Sumner 1938, Schwartz 1939). Elk were observed in MORA in
1915, and by the 1930s elk inhabited the primary summer ranges used by elk today (Bradley 1982).
During the 1950s to 1970s, widespread logging of elk winter and spring ranges adjoining MORA
improved winter and spring forage conditions and stimulated population growth of migratory elk
herds wintering adjacent to and summering within the park (Raedeke and Lehmkuhl 1985, Jenkins
and Starkey 1996). As elk populations continued to grow adjacent to MORA during the 1970s,
increasing signs of trailing, trampling, and grazing impacts led to questions of whether elk herds
using the park during summer were adversely affecting ecological conditions in subalpine meadows
(Bradley 1982, Ripple et al. 1988).

Elk were chosen as a vital sign in both MORA and OLYM in large measure because of their strong
ecological interactions with vegetation communities and history of concerns over adverse effects of
elk on signature resources of each park. There has been nearly a century of concern and debate over
potential impacts of naturally regulated elk populations and high levels of herbivory in low-elevation
temperate rainforests in OLYM. Recent research has demonstrated the ongoing significant ecological
role of elk and deer herbivory in shaping both structure and composition of the park’s renowned
rainforest communities (Happe 1993, Woodward et al. 1994, Schreiner et al. 1996). The ongoing
debate over negative impacts of elk on ecosystem properties in OLYM currently focuses on whether
excessive elk populations have impaired riparian vegetation communities and altered river channel
characteristics (Beschta and Ripple 2008, East et al. 2017). Concerns over ecological effects of elk
on subalpine communities in MORA have abated during the last two decades, but renewed
population growth would likely reignite concerns over elk grazing and trampling effects on subalpine
ecosystems.

There are complex processes and interactions at play with potential to influence elk populations in
both MORA and OLYM in the future. Changing land uses, hunting, disease, climate, and predator
management programs on lands adjacent to these parks all have potential to influence elk population
trends and ecosystem dynamics within. There have been recent proposals to reintroduce wolves to
OLYM (Ratti et al. 2004) and natural wolf recolonization in Washington is occurring, with wolves
from Canada and Idaho now reproducing in Washington (Wiles et al. 2011). Wolf packs have
established territories north and east of MORA and WDFW has begun installing camera stations to
better track wolf colonization in response to a growing number of wolf reports in and around MORA
(M. Tirhi, Wildlife Biologist, WDFW, personal communication). The colonization of wolves in the
region would likely affect both elk abundance and distribution (Fieberg and Jenkins 2005). Further,

 2
as climate continues to change in the Pacific Northwest, elk populations may be influenced by shifts
in temperature, precipitation and snowpack (Salathé et al. 2009); forest disturbance regime (Dale et
al. 2001, Westerling et al. 2006); and vegetation (Zolbrod and Peterson 1999). Nationally, increased
prevalence and proliferation of diseases (e.g., chronic wasting disease, paratuberculosis, and
brucellosis) is a growing concern for wildlife managers (Daszak et al. 2000, Angers et al. 2006). In
Washington State, recent emergence and spread of Treponeme Associated Hoof Disease (TAHD) in
elk presents a very real concern for managers of elk populations throughout western Washington
(https://wdfw.wa.gov/species-habitats/diseases/elk-hoof, Accessed 9 January 2020).

None of these issues is simple, and all have implications for policy and management. Obtaining
reliable information on elk population trends is a critical first step in discussing and addressing elk
conservation and management across agency and Tribal jurisdictions. Over time, elk monitoring
results may be used to help the parks evaluate effects of climate change, external impacts, and other
stressors that may influence elk populations across park boundaries. These same results are useful to
Tribes and agencies in the Mount Rainier area in meeting their population management objectives.
Further, improved understanding of elk population trends is needed to interpret effects of NPS
policies on natural regulation of ungulate populations and associated ecosystem effects and to
communicate these trends to a diverse and interested public.

History of Elk Monitoring in Mount Rainier and Olympic National Parks
For over 30 years, the MIT, PTOI, NPS, and WDFW have worked together to monitor trends in
abundance and composition of elk herds that migrate into MORA during summer. Historically, MIT,
PTOI, NPS, and WDFW surveyed elk nearly annually in subalpine summer ranges of MORA from
either fixed wing airplanes or helicopters during evenings in late summer and early fall. Survey
crews recorded numbers of elk seen within survey units defined by Bradley (1982). Bradley (1982)
recommended an index of abundance, ‘E4’, multiplied by two, as a standard metric for comparison
of elk abundance over time. The index ‘E4’ was the mean of three different ad hoc indices, which are
described fully in the previous synthesis report (Jenkins et al. 2015). The multiplier was intended to
account for aerial detection biases (i.e., elk present but not seen by aerial survey crews) and was
based on comparisons of aerial survey counts with densities of elk computed from pellet group
surveys in Cedar River Watershed (Schoen 1977). Abundant research has shown, however, that
aerial detection biases are influenced by variations in vegetation density, elk behavior and other
factors that are not likely to be constant among areas or over time (Samuel et al. 1987,
McCorquodale et al. 2013, Griffin et al. 2013)

Olympic National Park does not have the same history of surveying elk on summer ranges as
MORA. Rather, early focus for elk monitoring in OLYM was on winter and spring ranges in western
valleys of the park in response to historical concerns about elk-vegetation dynamics on heavily
utilized winter ranges as well as other management concerns near park boundaries (Houston et al.
1987, Jenkins et al. 2015). Elk were surveyed on key wintering areas on the west side of OLYM
annually from 1985-91, and as funding permitted from 1992-2010. These early-spring surveys were
discontinued in 2010 due to funding and logistical constraints, not due to lack of park interest in
gaining a better understanding of elk population trends. In 2008, OLYM began conducting surveys of

 3
elk in high-elevation subalpine habitats using the same methods as MORA to yield comparable
survey results in both parks.

Monitoring and Reporting Objectives
The goal of elk monitoring in MORA and OLYM is to detect changes in abundance, spatial
distribution, and herd composition of elk that use selected summer range areas when elk are
seasonally concentrated and highly visible in both parks. Here, we report trends in each of these
measures on selected Trend Count Areas (TCA) corresponding with key summer range areas for elk
in each park. Estimates are based on surveys conducted from 2008-2015 in OLYM and 2008-2017 in
MORA.

Objectives of this 10-year reporting interval are to:
 (1) incorporate new data to update aerial-bias-correction models previously developed for use in
 MORA to include corrections for aerial detection bias in both MORA and OLYM;
 (2) examine trends in estimated elk abundance, distribution, and population composition on
 subalpine summer ranges within MORA and OLYM; and
 (3) estimate effects of seasonal variation and weather on elk abundance and population
 composition on subalpine summer ranges in both parks.

 4
Elk Populations and Study Areas
Mount Rainier National Park
We monitored trends in two migratory elk herds that summer in MORA—a North and a South Herd.
These herds refer collectively to elk that congregate on summer ranges within northeastern and
southeastern quadrants of MORA, respectively, and that migrate to fall-winter-spring ranges largely
outside park boundaries to the north and south (Figure 1).

Figure 1. Approximate annual ranges of migratory components of North Rainier (blue) and South Rainier
(yellow) elk herds that use MORA during summer. These elk migrate from MORA to lower elevations
outside the park during winter. Winter ranges may also be used by nonmigratory elk and elk from other
adjacent high-elevation summer ranges.

The migratory herds of MORA are subsets of Washington’s North and South Rainier Herds that are
managed by WDFW and Native American Tribes. The ‘greater’ North Rainier Herd inhabits
primarily the Snoqualmie, Green, and White River Valleys in Pierce and King Counties (WDFW
2020). The portion of North Rainier Herd that summers in MORA, the focus of this study, is
recognized by WDFW and MIT as the White River sub-herd. Approximately 50% of the White River

 5
sub-herd migrates annually into MORA during summer (MIT, unpublished data). This population
segment migrates to lower elevations in the White River valley for winter (Figure 1), where it mixes
with elk from other migratory subpopulations as well as a resident population component that stays
year-around at low elevations.

The ‘greater’ South Rainier Herd inhabits primarily the Cowlitz Valley in Thurston and Lewis
Counties (Huang et al. 2002, Moeller 2010). The portion of the South Rainier Herd monitored in
MORA migrates to winter range near the city of Packwood where it mixes with elk from other
migratory herds and elk that reside year-round at low elevations (Moeller 2010). The exact
proportion of the Packwood sub-herd that migrates to MORA is not known, but approximately 46%
of this sub-herd migrates north of Packwood onto summer ranges in and near the Park boundary
(Moeller 2010). A small number of the adjacent Yakima Elk Herd have also been identified using
summer ranges in and near Mount Rainier during summer (Moeller 2010). Consequently, elk from
the Yakima Herd may be represented occasionally in our counts.

We monitored elk in two Trend Count Areas (TCAs) corresponding with the summer ranges of the
North and South herds in MORA (Figure 2). The TCAs corresponded closely with herd units first
defined by Bradley (1982) and used historically as the framework for all subsequent surveys (Figure
2). The North Rainier TCA (103 km2) is between 1,500 and 2,100 m elevation. The South Rainier
TCA (89 km2) is between 1,350 and 2,100 m elevation, except on some southwest-facing slopes
where past landslides and wildfires maintained open parklands down to 1,200 m. Within these
defined survey areas, we referred to satellite-derived estimates of vegetation cover and type (Pacific
Meridian Resources 1996) and excluded areas of continuously dense forest canopy, rock, or
permanent snow from the study area (Griffin et al. 2012). The TCAs encompassed primarily
subalpine woodlands and meadows consisting of mosaics of subalpine parkland forests dominated by
subalpine fir (Abies lasiocarpa) and mountain hemlock (Tsuga mertensiana), subalpine meadows,
and low shrublands (Franklin et al. 1988). The tallest trees in subalpine parklands were generally
Figure 2. Summer trend count areas (TCA) in MORA, including North Rainier TCA (103 km2; survey
units in blue) and South Rainier TCA (89 km2; survey units in yellow).

Olympic National Park
Spanning elevations from sea level to over 2,400 m, OLYM encompasses summer ranges and many
winter ranges used by migratory elk herds on the Olympic Peninsula, particularly in western
drainages. Additionally, there are low-elevation resident herds in western and northern valleys that
remain at low to middle elevations throughout the year (Figure 3).

 7
Figure 3. Map of OLYM and surrounding areas of the Olympic Peninsula, showing the approximate
distributions of elk that use OLYM during all or part of the year. Red shading indicates approximate
combined summer and winter range areas occupied by migratory elk herds that that reside in the park
throughout the year. Yellow indicates approximate areas used by migratory herds that summer in the park
and winter outside the park (non-resident migratory). Blue indicates area occupied by non-migratory elk
herds. The shaded tones of red, blue and yellow on the periphery of each distribution indicate they are
approximations lacking identifiable boundaries. The annual ranges of many herds overlap; this map does
not show ranges of all elk herds on the Olympic Peninsula.

We surveyed elk in five TCAs that encompassed most summer ranges used by migratory elk herds in
OLYM (Figure 4). Subalpine habitats extend to lower elevations in OLYM than in MORA;
consequently, we defined summer TCAs as ranging between 1,200 m and 1,650 m elevation. This
elevation range was confirmed by data collected from GPS-collared elk (NPS, unpublished data). As
in MORA, the TCAs in OLYM comprised a mosaic of subalpine fir and mountain hemlock forests,
and a diversity of high elevation meadow and shrub communities (Fonda and Bliss 1969, Kuromoto
and Bliss 1970).

 8
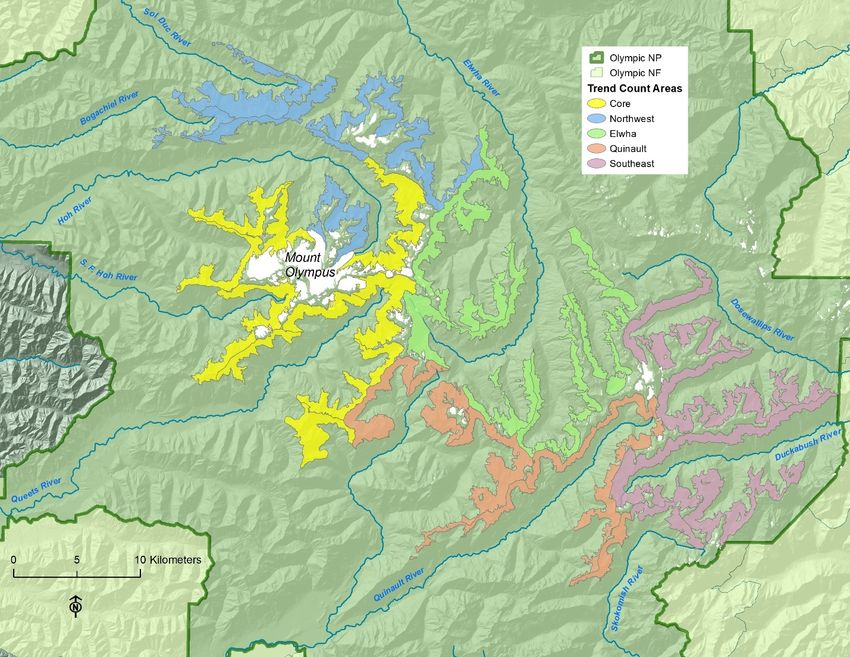
Figure 4. Trend count areas in OLYM, including Core TCA (surveyed annually) and four alternate TCAs
surveyed once every fourth year. Core, Northwest, Elwha, Quinault, and Southeast TCAs are
approximately 100, 81, 73, 79, and 86 km2, respectively.

 9
Methods
Survey Design
In MORA, our initial goal was to complete two replicate aerial surveys in both North and South
TCAs annually. Due to funding and logistical constraints, however, we did not always complete
replicated surveys of both TCAs. As a cost-saving measure, in 2011, we adopted a reduced sampling
goal of completing two replicate surveys of each TCA on alternating years and one survey in
intervening years (Griffin et al. 2012).

We devised a different sampling schedule in OLYM to ensure complete coverage of important
summer ranges over several survey years. Each survey year, we attempted to survey the Olympic
Core TCA (hereafter, Core TCA) plus one of four non-core TCAs, thereby completing surveys in all
TCAs over a 4-year span. A longer sampling interval was required in OLYM than in MORA to
survey the larger summer range area on a fixed budget. The sampling design at OLYM summer
TCAs achieves widespread sampling over OLYM summer ranges and documents changes in
abundance in Core TCA in each year of survey.

Survey Methods
Aerial Surveys
We surveyed elk in each TCA by helicopter (Bell 206BIII, Bell Helicopter, Hurst, TX; or Hughes
500D, MacDonnell-Douglas Helicopters, Inc., Mesa, AZ) from 13 August–19 September 2008–
2017. In MORA, all survey flights were conducted during evenings, beginning as early as four hours
before sunset and ending as late as 30 minutes after sunset, when elk tend to be most visible during
evening feeding bouts. The goal was to survey an entire TCA on a single evening using two
helicopters and survey crews operating simultaneously in complementary halves of a TCA, but
logistical issues sometimes required surveying over multiple days. In OLYM, due to larger areas
covered and use of a single helicopter, surveys were conducted during evenings (same prescriptions
as in MORA) and mornings (30 minutes before to four hours after local sunrise) often over multiple
days. In both parks, elk were surveyed from approximately 100–150 m above ground level along
flight lines approximately 250–500 m apart. Flight speed was approximately 85 km/hr with a search
intensity of approximately 0.35 km2/min. Each TCA was subdivided into smaller survey units to
facilitate communication between two helicopters operating simultaneously, ensure complete survey
coverage, and to allow examination of spatial patterns of elk use within TCAs (Figures 2 and 4).

Although it is desirable to retain consistent crews for all surveys, due to logistic constraints it was
often necessary in MORA to substitute one or more observers between surveys. As a result, there
were numerous observers with insufficient sample size to estimate sighting probability differences
among individual observers. This limitation, requiring reliance on sighting probabilities averaged
over observers, likely increased the overall estimated measurement error rate.

Survey crews consisted of a pilot and three experienced observers, one seated beside the pilot in a
front seat, and two in the rear seats. The pilot and front-seat observer had views to the front, sides,
and below the flight path. Each back-seat observer had a view to one side of the flight path. Although

 10
the pilots’ attention was focused always on flying safely, pilots also detected elk. While searching for
elk, observers recorded elk groups that were detected up to 300 m outside survey unit boundaries.
This allowed for more careful determination later of whether observed groups near TCA boundaries
were inside or out of count areas based on GPS coordinates. Abundance estimates were based on elk
locations confirmed within TCA boundaries, but we included elk groups up to 300 m from TCA
boundaries in estimating population composition.

In-flight procedures required each observer to search independently for elk but to collaborate in
determining group size, composition, and covariates of detected groups. Individual survey team
members recorded elk observations independently. This was accomplished by each observer
maintaining separate records of their elk sightings without communicating with one another until the
helicopter had flown sufficiently past an observed elk group to ensure that each observer in the
helicopter had a chance to spot it independently. We noted rare occasions when observations were
not independent between front- and back-seat observer pairs (i.e., through inadvertent
communications); we omitted non-independent observations from the data set used for model fitting
but retained them for abundance estimation.

We determined and recorded whether each observed elk group was seen by a front-seat observer,
back-seat observer, or both, and whether there were radio-collared elk in the group. We recorded
locations of each group using a GPS unit. We classified each elk in the group as an adult female,
young of the year (i.e., calves), yearling male, subadult male, or adult male based on antler
characteristics and body size (Griffin et al. 2012). If a motion-stabilizing camera was available, we
photographed groups containing ≥20 individuals to reduce bias in group size estimation and sex-age
determinations (Cogan and Diefenbach 1998, Schoenecker et al. 2006). We recorded the following
covariates associated with each observed elk group: group size and composition, percent concealing
vegetation within 10 m of any elk in the group (V; using five interval classes: 0, 1–25, 26–50, 51–75,
or 76–100%), whether the group was standing on herbaceous vegetation (H; yes or no), whether the
group was in forest vegetation (F; yes or no), lighting conditions (L; flat or high contrast), and group
activity when first detected (M; moving or not). We noted whether each elk group was detected to
the left, right, or both sides of the helicopter’s flight path. We noted when an elk group was directly
below the helicopter’s flight path and not visible to back-seat observers (C; centerline yes or no). A
separate covariate denoted whether the elk group was on the same side of the helicopter as the pilot
(P; yes, if group on same side as a pilot-observer). After completing the count of a survey unit, we
used radio-telemetry to identify and locate any radio-collared elk that were missed during the
surveys. We recorded the same covariates for missed groups as for groups detected during the
survey.

Data Management
The Project Lead entered field survey data into the project’s relational database and reviewed and
verified the data. Database records were verified for complete and accurate transcription by
retrieving and visually comparing entered data against the original forms. Aerial photographs of elk
groups were examined and, if necessary, composition classifications of groups were amended. Once
data for the season were entered and verified, we identified and corrected inconsistencies in the data

 11
(i.e., missing or out-of-range values) by running a set of pre-built validation queries. We used a
structured procedure to impute missing covariate values based on modal or median values recorded
for each covariate. For observations with missing data for group size or activity, we substituted the
median group size computed from all groups that contained ≥1 adult female and were detected in the
same category of percent concealing vegetation. For observations with no percent concealing
vegetation recorded, we used median group size and vegetation cover score based on all observed
groups with ≥1 adult female. For observations missing a value for light level, we used the same light
level as recorded in the preceding and subsequent observations. We used audio recordings of cockpit
conversation and global positioning system (GPS) records of the survey flight path to determine on
which side of the helicopter an elk group was located when that information was not recorded on
paper in flight. To enhance accuracy in model development we did not use observations with
imputed covariate values in model fitting, unless those observed groups contained at least one radio-
collared elk. We included observations with imputed covariate values for radio-collared groups to
bolster sample size of DO-S trials used in modeling. We used all elk groups observed during surveys
in computing abundance estimates regardless of whether covariate values were imputed so as not to
unnecessarily bias estimates by excluding observed groups with missing covariates.

Project spatial data were stored in a geodatabase (ESRI, Redlands, California) that contained several
feature datasets, each of which contained sets of point, polygon, or line feature classes. The main
feature datasets were for navigation, survey area boundaries, records of survey flight paths, records
of animal observations, and spatial analyses. Spatial features in the geodatabase were linked with the
projects relational database records via primary key relationships maintained in the relational
database.

We processed spatial data collected in the field as soon as possible after a survey. At the end of a
field season, final coordinate data for group observations were derived from matching GPS flight line
time stamps with time stamps recorded in the field and making any necessary final adjustments by
matching available photographs with digital orthorectified aerial photography. These final
coordinates were then stored in the relational database. The relational database is the long-term
repository for observation coordinates where additional processing and quality assurance procedures
are documented.

Data Analysis
Introduction to Aerial-Bias-Correction Models
A large array of methods exists for modeling aerial survey detection biases. To understand our choice
of methods, it is useful to review some key modeling approaches and their relative strengths and
limitations. The reader is referred to the list of terms on Page 1 for additional definitions of data
collection methods used in developing aerial-bias-correction models.

Sightability model (MS):
A statistical model (commonly based on logistic regression) that is fit to data from DO-S trials and
used to estimate the probability of sighting a group of animals as a function of covariates that affect
detection bias, which is then used to correct raw observations for aerial-detection-bias. Sightability

 12
You can also read