2018 Kansas Integrated Water Quality Assessment - March 30, 2018 Bureau of Water KDHE Division of Environment 1000 Southwest Jackson Street, Suite ...
←
→
Page content transcription
If your browser does not render page correctly, please read the page content below
2018 Kansas Integrated
Water Quality Assessment
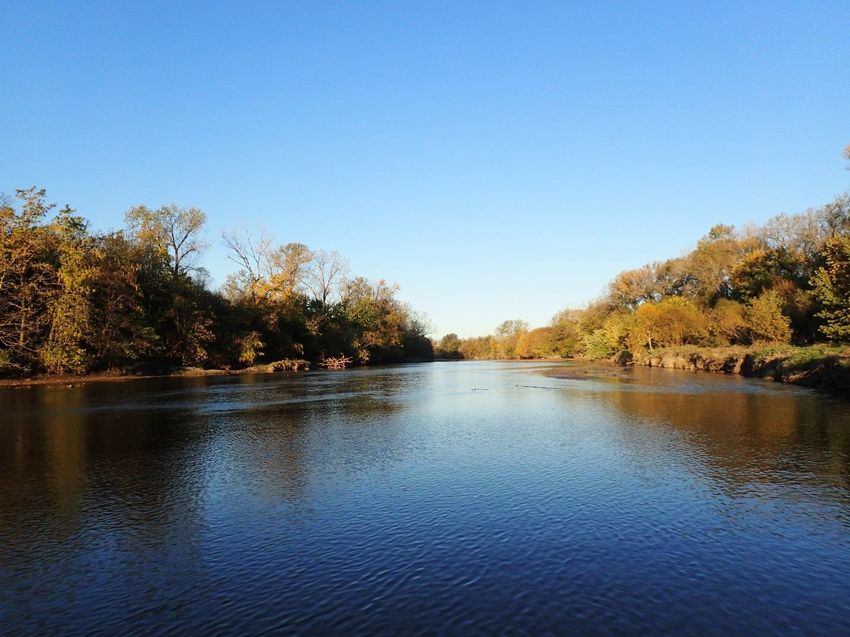
Republican River in Cloud County, KS – October 2017
March 30, 2018
Bureau of Water
KDHE Division of Environment
1000 Southwest Jackson Street, Suite 420
Topeka, Kansas 66612-1367
This page intentionally left blank.

                2
TABLE OF CONTENTS
List of Tables 5
List of Figures 6
Executive Summary 7
Part A: Introduction 9
Purpose 9
General Assessment Approach 9
Organization of Report 9
Part B. Background 11
Total Waters 11
Water Pollution Control Program 11
I. Point Source Pollution Control 11
II. Nonpoint Source Pollution Control 13
Cost/Benefit Assessment 18
Special Concerns and Recommendations 19
I. Agricultural Concerns 19
II. Municipal and industrial concerns 21
III. Nuisance aquatic species 23
IV. Variation In Flow Regimes 24
V. Conclusions 25
Part C. Surface Water Monitoring and Assessment 28
Monitoring Programs 28
I. Targeted Lake and Wetland Monitoring Program 28
II. Targeted Stream Chemistry Monitoring Program 29
III. Targeted Stream Biological Monitoring Program 31
IV. Probabilistic Stream Monitoring Program 32
V. Fish Tissue Contaminant Monitoring Program (Targeted and Probabilistic) 34
VI. Compliance Monitoring Program 35
VII. Subwatershed Monitoring Program 35
VIII. Special Projects 36
Assessment Methodology 38
I. 305(b) Assessment Methodology for Streams 38
II. 305(b) and 314 Assessment Methodology for Lakes and Wetlands 42
III. 303(d) Assessment Methodology 43
3Assessment Results 47
I. 305(b) Assessment Results for Streams and Rivers (Probabilistic Data) 47
II. 305(b) and 314 Assessment Results for Lakes and Wetlands 53
III. 303(d) Assessment Results 66
Public Health Issues 66
I. Drinking Water Use 67
II. Beach Use (Harmful Algal Blooms and Algal Toxins) 68
III. Fish Consumption 70
IV. Other Considerations 71
Part D. Groundwater Monitoring and Assessment 73
Overview 73
Groundwater Monitoring by Other Agencies 73
Groundwater Monitoring by KDHE 74
Groundwater Monitoring associated with Public Water Supply Systems 80
Part E. Public Participation 83
Sources Cited 84
Appendices 88
Appendix A. Routine and Supplemental Parameters 88
I. Appendix A-1: Water Chemistry Parameters 88
II. Appendix A-2: Fish Tissue Parameters 92
Appendix B. 303(D) LIST 93
I. Appendix B-1: Summary of 2018 Changes to Impaired Waters List 94
II. Appendix B-2: 2018 Delisted Waters 98
III. Appendix B-3: 2018 303(d) List 127
4LIST OF TABLES
Table 1. Geographic information on the total waters of Kansas................................................... 11
Table 2. Number of active KWPC and NPDES permits as of January 1, 2018 ........................... 12
Table 3. Permit compliance for discharging wastewater treatment facilities, 2016-2017 ............ 13
Table 4. KDHE cooperative funding for construction and expansion of municipal wastewater
treatment facilities ....................................................................................................... 19
Table 5. Types of data applied to assessment of designated use support for streams and rivers,
2011-2015 ................................................................................................................... 39
Table 6. Aquatic life use non-support thresholds for biological metrics across three stream
classes ......................................................................................................................... 40
Table 7. Escherichia coli criteria used in recreational use assessments ....................................... 41
Table 8. Mean chlorophyll-a thresholds used as support criteria for six designated uses ............ 43
Table 9. Probabilistic stream assessment fact sheet...................................................................... 47
Table 10. Allocation of designated uses among classified streams .............................................. 48
Table 11. Support of individual designated uses in streams (in miles) ........................................ 49
Table 12. Detailed account of use support for streams (in miles) ................................................ 49
Table 13. Major causes of water quality impairments in streams (in miles) ................................ 50
Table 14. Major sources of water quality impairments in streams .............................................. 51
Table 15. Categories of data used in ALUS assessments for lakes (in acres) .............................. 54
Table 16. Summary of Fully Supporting, Threatened, and Impaired Lakes ................................. 54
Table 17. Individual use summary for lakes (in acres) ................................................................. 55
Table 18. Total lake area impacted by various cause categories (in acres) .................................. 55
Table 19. Total lake area impaired by various source categories (in acres) ................................. 56
Table 20. Lakes with identifiable point and nonpoint source pollution contributions ................. 56
Table 21. Trophic status of lakes during this reporting cycle ....................................................... 58
Table 22. Trophic state trends in lakes ......................................................................................... 59
Table 23. Individual use summary for wetlands (in acres) ........................................................... 63
Table 24. Total wetland acres impacted by various cause categories (in acres) ........................... 64
Table 25. Total wetland acres impacted by various source categories ......................................... 64
Table 26. Trophic status in wetlands ............................................................................................ 65
Table 27. Trophic state trends in wetlands ................................................................................... 65
Table 28. Summary of 2016-2017 spill events ............................................................................. 71
Table 29. Summary of fishkill events investigated by KDHE 2016-2017 ................................... 72
Table 30. Summary of state groundwater protection programs .................................................... 76
Table 31. Major sources of groundwater contamination for Kansas ............................................ 78
Table 32. Groundwater contamination: statewide cumulative summary through December 31,
2017............................................................................................................................. 79
Table 33. Results of groundwater monitoring associated with Public Water Supply Systems,
2014-2016 ................................................................................................................... 82
5LIST OF FIGURES
Figure 1. Kansas WRAPS Projects as of December 2017 ............................................................ 15
Figure 2. Targeted Lake and Wetland Monitoring Sites............................................................... 29
Figure 3. Targeted Stream Chemistry Monitoring Program Sites ................................................ 30
Figure 4. Targeted Stream Biological Monitoring Program Sites ................................................ 31
Figure 5. Probabilistic Stream Monitoring Sites, 2011-2015 ....................................................... 33
Figure 6. Sixteen priority watersheds for nutrient TMDL development 2014-2022 .................... 45
Figure 7. Percent land area of Kansas affected by drought, 2010-2015 ....................................... 52
Figure 8. Aquatic macroinvertebrate assemblage health, shown by sample year. ....................... 53
Figure 9. Number of Kansas Lakes confirmed affected by Harmful Algal Blooms .................... 70
6EXECUTIVE SUMMARY
This report, the Kansas Integrated Water Quality Assessment (2018), was prepared by the
Kansas Department of Health and Environment (KDHE) in response to water quality reporting
requirements contained in sections 303(d), 305(b), and 314(a) of the federal Clean Water Act
(CWA). Section 303(d) calls for the development of a list of waterbodies currently failing to
meet established water quality standards, whereas sections 305(b) and 314(a) require information
concerning the overall status of the state’s surface waters and the programs responsible for water
quality monitoring and pollution abatement.
The Kansas 2018 list of impaired waters (i.e., 303(d) list) is included as an appendix to this
report. This list is based primarily on data collected by the KDHE targeted surface water
monitoring programs and secondarily on information obtained from outside sources. For this
assessment, watersheds containing targeted stream chemistry and/or stream biological
monitoring stations represented the assessment units for flowing waters. Monitored lakes and
wetlands represented the assessment units for standing waterbodies. The state’s 2018 303(d) list
identifies 498 station/pollutant combinations of water quality impairment on lakes, wetlands, and
stream systems (watersheds), encompassing 2,437 stream segment/pollutant combinations, and
needing the development of Total Maximum Daily Load plans (TMDLs) to address the
offending pollutants. The 2018 list also identifies 480 station/pollutant combinations of waters
that were previously cited as impaired in prior lists but now meet water quality standards, with
19 of these being new in 2018.
Requirements related to Section 305(b) were addressed, in part, using data obtained through a
stream monitoring program implemented in 2006. This program employs a probabilistic survey
design to estimate the stream mileage supporting those uses recognized in section 101(a) of the
CWA: aquatic life support, food procurement, and contact recreation. The program’s target
population for monitoring and assessment included all classified streams that contained water
during the summer low-flow periods of 2011-2015. Owing largely to climate variation during
this assessment window, only about 64% of the state’s classified stream mileage was represented
in the target population for assessment. Lake and wetland assessments for Section 305(b) as well
as Section 314 reporting requirements were addressed using data from the targeted lake and
wetland program, which uses a near-census approach in its monitoring.
Monitoring data obtained during this reporting cycle indicated that approximately 16% of the
state’s designated stream mileage fully supported all three section 101(a) uses, whereas 84% was
impaired for one or more uses. Aquatic life, contact recreation, and food procurement uses were
supported, respectively, in 33%, 80%, and 66% of the stream miles designated for these uses.
The two major causes or observed effects that demonstrated non-support for streams were
suboptimal aquatic macroinvertebrate community metrics, which is an indicator of aquatic life
support, and mercury in fish tissue, which is an indicator of food procurement use. Presence of
contaminants such as bacteria, metals, and pesticides in water comprised a third category of
causes. The most widespread discernible sources responsible for use impairments and/or
pollutant loadings were generalized anthropogenic influences (e.g., erosion and sedimentation,
atmospheric deposition of contaminants), followed by agriculture (both crop and livestock
7production), and other sources (including natural sources and unknown sources). Urban
influences (both point and nonpoint sources) were less widespread, an unsurprising result given
the ratio of urban to rural land use in Kansas.
Approximately 3.5% of the assessed lake acreage fully supported all designated uses, whereas
over 96% was impaired for one or more designated uses. Approximately 63% of the assessed
lake acreage exhibited no recent change in trophic condition, less than 1% exhibited some
improvement in trophic state, and 34% experienced a measurable deterioration in trophic state
(with 3% unknown). Approximately 73% of wetland acreage was assessed. Of this population,
less than 1% fully supported aquatic life and recreational uses. Major causes of impairment in
both lakes and wetlands included nutrient enrichment, siltation and turbidity, and zebra mussel
(Dreissena polymorpha) infestations; flow alterations and presence of sulfates also affected
wetlands. Agriculture, hydromodification, natural sources, and municipal point sources were the
primary sources of these impairments.
Kansas experienced some flooding in 2010 followed by significant and extended statewide
droughts in 2011-2013; 2014 marked the beginning of drought recovery. The combined effects
of these dramatic weather-related events doubtless exacerbated many of the water quality
impairments documented in the past decade.
8PART A: INTRODUCTION
Purpose
This document fulfills specific water quality reporting requirements placed on the State of
Kansas by sections 303(d), 305(b), and 314(a) of the Federal Clean Water Act. Sections 305(b)
and 314(a) require a summary of the status of the state’s surface waters. Section 303(d) calls for
development of a list of waterbodies currently failing to meet established water quality standards,
which are regarded collectively as “impaired waters.” Kansas is required under the CWA to take
actions that improve the condition of impaired waters. These actions may include the
development and implementation of TMDLs, water quality based permit requirements, and/or
nonpoint source (NPS) pollution control measures. This report presents an integrated response to
the requirements of sections 303(d), 305(b), and 314(a) and contains information relevant to
upcoming water quality planning, monitoring, permitting, and pollution abatement initiatives in
the state.
General Assessment Approach
KDHE administers several programs that collectively satisfy the environmental monitoring and
reporting requirements of the CWA (KDHE 2010). These programs also provide the technical
data needed to respond to existing and emerging water pollution problems. Departmental
monitoring operations currently focus on the condition of the state’s surface waters (rather than
groundwater) and involve two different but complementary conceptual approaches. The first
involves a targeted survey design that focuses on selected lakes, wetlands, and stream reaches.
The second approach involves a probabilistic survey design that assesses randomly chosen
stream reaches and extrapolates the monitoring results to the entire population of classified
streams in the state. Targeted monitoring operations accommodate the development and
refinement of the Kansas 303(d) list, whereas both targeted and probabilistic data are used to
meet section 305(b) and 314(a) Clean Lakes Program reporting requirements.
Within KDHE, activities related to sections 305(b), 314(a), and 303(d) sections of the CWA are
performed by the Watershed Planning, Monitoring, and Assessment Section of the Bureau of
Water (BOW). Portions of this report addressing sections 305(b) and 314(a) characterize the
overall condition of the state’s streams, lakes, and wetlands, including both water quality and the
prevalence of bioaccumulative contaminants in fish. They also describe the major monitoring
networks and regulatory programs involved in the tracking, management, and abatement of
surface water pollution. The 303(d) analysis differs from the 305(b) and 314(a) assessments in
terms of statistical approach and monitoring period of interest. Moreover, under the provisions of
the CWA, the 303(d) list is subjected to public comment and review as well as approval by the
U.S. Environmental Protection Agency (EPA).
Organization of Report
The remainder of this report is divided into several major parts. Part B contains background
information on surface water resources within the state, describes the governmental programs
9primarily responsible for improving water quality, considers the overall costs and benefits of
water pollution control, and summarizes several important water quality issues facing Kansas.
Part C discusses the various water quality monitoring programs administered by KDHE, the
diagnostic criteria and statistical methods employed in the 303(d) and 305(b) analyses, and the
major findings stemming from these analyses. Part D summarizes the current status of
groundwater quality monitoring efforts in Kansas. Finally, Part E describes the measures taken
by KDHE to comply with the public participation provisions of the CWA, as related to the
development of the 303(d) list. Technical appendices to this report provide additional
information on KDHE’s water quality monitoring programs and the results of the most recent
assessments. Specifically, Appendix A identifies the individual water chemistry and fish tissue
parameters considered in the 2018 305(b) assessment, and Appendix B presents the most
recently completed 303(d) list for Kansas.
10PART B. BACKGROUND
Total Waters
Table 1 shows a summary of the waters of the State of Kansas (KDHE 2013), along with other
geographic and demographic information. The waters on the Kansas Surface Water Register
have received Use Attainability Analyses (UAAs) according to standard procedures (KDHE
2012).
Table 1. Geographic information on the total waters of Kansas
Topic Value Data Source
State population 2,853,118 U. S. Census Bureau, 2010 Census
State surface area in square miles 81,758.72 U. S. Census Bureau, 2010 Census
Number of major river basins 12 Dec 12, 2013 KSWR +
Total classified stream miles++ 30,278 Dec 12, 2013 KSWR +
Total classified stream miles designated for 22,235 Dec 12, 2013 KSWR +
food procurement ++
Number of lakes, reservoirs, and ponds 322 Dec 12, 2013 KSWR +
(publicly owned or accessible)++
Acres of lakes, reservoirs, and ponds 190,445 Dec 12, 2013 KSWR +
(publicly owned or accessible)++
Acres of freshwater wetlands 55,969 Dec 12, 2013 KSWR +
(publicly owned or accessible)++
+ The functional stream geometry of the 2013 Kansas Surface Water Register (KSWR) is derived from
the 1:24,000 scale National Hydrography Dataset (NHD), projected in Lambert Conformal Conic North
America (Clarke 1866) and trimmed at state boundaries. Lake and wetland acreage estimates are based
on adjusted areas of NHD polygons.
++ This includes classified waterbodies as published in the 2013 KSWR.
Water Pollution Control Program
I. POINT SOURCE POLLUTION CONTROL
The Kansas point source program was initiated in 1907 (K.S.A. 65-161 et seq.) and continues to
be modified and expanded in response to ongoing amendments to the CWA. The federal
regulations implementing this law are found in Title 40 of the Code of Federal Regulations.
Federal water pollution control programs are designed to protect the navigable waters of the
United States, whereas the Kansas Water Pollution Control KWPC Program is designed to
protect all surface water and groundwater resources in the state by controlling discharges from
municipal, federal, commercial, and industrial wastewater treatment facilities (WWTFs),
permitted concentrated animal feeding operations (CAFOs), and urban and industrial
stormwaters.
KDHE is authorized to administer federal and state laws governing the treatment, re-use, and
discharge of wastewaters in Kansas. Specifically, the department is responsible for the
development, public notice, issuance, and periodic review of water pollution control permits; the
approval of engineering plans and specifications for WWTFs and sewage collection systems; the
development of stormwater best management practices (BMPs); the establishment of
11pretreatment requirements for facilities in non-pretreatment program cities (EPA Region 7
administers pretreatment program cities); and the performance of treatment plant compliance
reviews. The department also oversees the development and management of operator training
and certification programs in Kansas. Non-overflowing WWTFs are regulated through the
Kansas Water Pollution Control permitting system (K.S.A. 65-165). National Pollutant
Discharge Elimination System (NPDES) permits are required for all discharging WWTFs, large,
medium, and small Municipal Separate Stormwater Sewer Systems (MS4s), and large
agricultural facilities (Table 2). Agricultural facilities primarily include CAFOs but also include
other animal feeding operations as well as some livestock markets and livestock truck washes.
Wastewaters generated by these treatment facilities and operations are subject to technological
effluent limitations, effluent guideline limits, and the Kansas surface water quality standards.
Individual permits normally are issued for a period of five years, and all are reviewed by KDHE
prior to re-issuance. The state’s WWTF permit compliance record for calendar years 2016 and
2017 is summarized in Table 3.
In addition to regulating wastewaters generated by these entities, the Kansas and federal
programs have expanded into the area of stormwater pollution control. KDHE issues general
permits for controlling stormwater runoff from construction and industrial sites, larger cities, and
urbanized counties. Stormwater management plans have been implemented in 59 of the state’s
largest municipalities/counties/governmental entities and their surrounding areas to reduce the
effects of stormwater runoff on receiving streams. In addition, stormwater pollution prevention
plans are required for construction activities disturbing more than one acre of land and for certain
classes of industries that conduct activities in which materials are exposed to rainfall. Industrial
facilities with individual permits are also required to develop and implement stormwater
pollution control plans as part of their individual permit requirements. Stormwater NPDES
permits are normally issued for a period of five years (Table 2).
Table 2. Number of active KWPC and NPDES permits as of January 1, 2018
Municipal and Commercial Industrial and Federal + Agricultural ++ Stormwater
Municipal
Mechanical
Separate
Treatment Facilities 139 Industrial and Agricultural
Stormwater
(NPDES) +++ Federal Federal
373 420 Sewer 64
Discharging (NPDES)
Discharging Systems
(NPDES) +++
Lagoons (NPDES) 347 (MS4)
+++ (NPDES)
Agricultural Industrial
State Permits 1317 Stormwater 850
Municipal and Industrial and (KWPC) (NPDES)
Commercial Non- Federal Non-
412 65 Agricultural
discharging discharging Construction
(KWPC) (KWPC) State
1554 Stormwater 2860
Certificates
(NPDES)
(KWPC)
Totals 898 438 3291 3774
KWPC = Kansas Water Pollution Control / NPDES = National Pollutant Discharge Elimination System
+ Tally does not include 59 industrial pretreatment facilities that discharge to municipal systems.
++ All agricultural facilities are nondischarging, but large facilities have combined Federal/State permits.
+++ Subject to monitoring by Compliance Monitoring Program and represented in Table 3.
12Table 3. Permit compliance for discharging wastewater treatment facilities, 2016-2017
Municipal and Commercial Facilities Industrial and Federal Facilities
Total number of facilities 486 438
2015 absolute compliance+ 92.9% 95.7%
2016 absolute compliance+ 91.4% 96.1%
+ Absolute compliance means that a facility reported on all parameters specified in its NPDES permit and
met all permit limits for the monitoring period (based on records submitted by the facility).
Over the past 13 years, a significant effort has been made to decrease nutrient (nitrogen and
phosphorus) loadings to surface waters. In a document dated December 29, 2004, KDHE
proposed and has since initiated a program whereby new and significantly upgraded mechanical
wastewater treatment plants are required to construct and operate processes to reduce the amount
of nitrogen and phosphorus in effluent discharges. As of January 1, 2018, more than half of the
mechanical wastewater treatment plants that generate significant amounts of nitrogen and/or
phosphorus have implemented or are building such nutrient reduction processes (Rod Geisler,
Pers. Comm. 3/14/2018). The department uses several contractors to assist other large and major
facilities to implement operational changes, if possible, or to provide reduction by chemical
addition. Also, the department has several contracts to provide on-site training assistance to
existing mechanical treatment facilities to improve nutrient removal processes. Investments in
such training and technology have reduced nutrient loads.
II. NONPOINT SOURCE POLLUTION CONTROL
Nonpoint source pollution refers to the transport of natural and man-made pollutants by rainfall
or snowmelt moving over and through the land surface and entering lakes, rivers, streams,
wetlands, or groundwater. KDHE’s Watershed Management Section (WMS) is responsible for
developing the Kansas Nonpoint Source Management Plan, which provides a framework to
coordinate agencies and organizations involved in nonpoint source related management
activities. The WMS administers funding and coordinates programs designed to eliminate or
minimize NPS pollution. To accomplish this goal, the section develops and reviews strategies,
management plans, local environmental protection plans, and county environmental codes
intended to control NPS pollution. These efforts are coordinated but are managed under several
different programs.
The Watershed Restoration and Protection Strategy (WRAPS) program is one such effort
administered by the Section; it offers a framework to engage citizens and other stakeholders in a
teamwork environment aimed at protecting and restoring Kansas watersheds by developing and
implementing 9 element watershed plans. These projects are supported in part by the CWA 319
funds.
The Drinking Water Protection Program is another program coordinated by the Section. It is
designed to provide technical assistance to Public Water Supply Systems (PWSS) interested in
writing and implementing a drinking water protection plan. Many PWSS are incorporated into
Kansas WRAPS plans; however, those not covered by a WRAPS project are encouraged to
complete drinking water protection plans.
13The Local Environmental Protection Program (LEPP) provides technical assistance and support
to county sanitarians in the implementation of local sanitary codes. Guidance provided by this
program is largely related to private domestic onsite wastewater disposal systems, private
domestic drinking water wells, and sanitary services, such as domestic septic disposal and land
application. In conjunction with the work of county sanitarians throughout the state, LEPP
program services complement a variety of water quality and public health efforts implemented
by other local, state and federal agencies.
Finally, stormwater and NPS abatement projects have been supported through various funding
mechanisms since 2009. A partnership between KDHE Watershed Management Section and
KDHE Municipal Program used funds first from the American Recovery and Reinvestment Act
(ARRA) of 2009, and then in 2010-2012 used part of the Green Project Reserve from the Kansas
Water Pollution Control Revolving Fund. After 2012, Green Project Reserve funding was no
longer available to the Watershed Management Section for NPS pollution projects. Thus, from
2013 to 2015, members of the Watershed Management Section staff pursued development and
implementation of the Local Conservation Lending Program (LCLP). The LCLP makes funds
available to local banks through a linked-deposit system; the banks then use these funds to offer
low-interest loans to eligible borrowers for conservation projects aimed at protecting water
quality in Kansas. The pilot phase began in late 2015.
Watershed Restoration and Protection Strategy
The WRAPS program is a voluntary targeted watershed-based program for controlling NPS
pollution. This program is unique because the natural resource agencies of Kansas, with support
from USEPA, aggressively seek citizen and stakeholder input and participation on watershed
management and protection issues. This approach involves:
- Identifying watershed protection and restoration needs
- Establishing watershed protection and restoration goals
- Developing 9 element plans to achieve established goals
- Implementing fully developed plans
The 9 element watershed plans already implemented under WRAPS collectively serve and
protect 45% of the state’s total land surface (24,576,154 acres). This includes most watersheds
draining into large federal reservoirs (Figure 1). Annual investments in WRAPS projects total
approximately $2.5 million (M). Of this amount, about $0.6 M is derived from State Water Plan
funds and $1.9 M from CWA section 319 funds. Additional funds for Best Management
Practices (BMPs) come from programs administered by the Kansas Department of Agriculture’s
Division of Conservation as well as the Federal Farm Bill administered by the United States
Department of Agriculture.
A KDHE initiative begun in 2010, the Subwatersheds Monitoring Program, tracks water quality
changes over time in a selected set of HUC-12 subwatersheds as area stakeholders implement
BMPs. It is a partnership between the Watershed Management Section and the Watershed
Planning, Monitoring, and Assessment Section. Baseline data was obtained from the original
2011-2015 monitoring sites to ultimately be compared to future monitoring results after BMP
implementation. In 2016, a new set of HUC-12 watersheds were identified (Figure 1) in three
14active WRAPS project areas, and monitoring in those subwatersheds are scheduled for 2016-
2020.
Figure 1. Kansas WRAPS Projects as of December 2017
Drinking Water Protection Program
The Drinking Water Protection (DWP) Program is built on the principle that prevention often
costs less than treatment. The program identifies drinking water source restoration and protection
needs and provides technical assistance to Public Water Supply Systems (PWSS) to restore and
protect water quality to meet drinking water standards. KDHE encourages PWSSs and their
surrounding communities to complete voluntary DWP plans. Local stakeholders establish source
water goals, corresponding action steps are created in the DWP plan, and the plan is
implemented and monitored.
DWP plans are built on data from Source Water Assessments (SWA). These SWAs were
completed for all active PWSSs in 2004, as required by the 1996 amendments to the Safe
Drinking Water Act, and funded by USEPA. The assessments identified all potential sources of
contamination for each public water supply system and evaluated the susceptibility of the PWS
to contamination. The SWAs were the first step in a comprehensive plan for protecting the public
drinking water supply system. PWSSs and their surrounding communities use the SWA and the
accompanying Susceptibility Analysis Scores to determine the contaminants and activities that
pose the greatest threats to their water supply.
15The DWP plan evaluates past SWA reports and performs a drinking water source investigation
that uses various water monitoring, modeling, and evaluation techniques to update knowledge of
the potential for drinking water contamination. The plan describes current conditions of the
drinking water protection area, including age of the PWSS, environmental assessments and
investigation results, population, and land use. A completed plan describes action steps needed to
protect the drinking water source. Implementation of the action steps is clearly outlined and
scheduled along with a list of resources (funding, technical assistance, regulations, etc.) needed
to fulfil the DWP plan objectives and goals. Milestones and a monitoring schedule allow the
PWSS to track its efforts in implementation.
In addition to the DWP program, drinking water sources benefit from BMPs through WRAPS
program. There are 73 public water supply systems (serving approximately 1,277,288 Kansans)
relying on surface water sources from streams and/or reservoirs that directly benefit from
NPS/WRAPS watershed project implementation.
Local Environmental Protection Program
The LEPP is administered by KDHE and has had several funding sources. From SFY1990
through SFY2010, it was funded by the Kansas Water Office (KWO) under the auspices of the
State Water Plan. For SFY2011 and SFY2012, grant funds were allocated through the State
General Fund. The program provided financial assistance to local governmental units developing
and implementing environmental protection plans on behalf of their respective jurisdictions. All
such plans included a sanitary code for regulating private water wells and private onsite
wastewater treatment systems, and in addition addressed subdivision drinking water and
wastewater treatment, solid and hazardous waste disposal, public water supply protection, and
NPS pollution abatement. The program has provided no financial assistance to local
governments since SFY 2013, so local governments now provide funding for the program
through county general funds and user fees.
The role for KDHE has shifted from grant administration to providing technical assistance,
information, and education to support local officials in administration of their
Environmental/Sanitary Code. Currently 103 of the 105 Kansas counties participate in this
program. The LEPP program is in the implementation phase of a five year plan designed to
improve the efficiency in which local officials receive information, technical assistance, and
guidance. Elements of this five year plan include:
- Develop a Model Environmental Sanitary Code to assist counties with code updates
- Update the procedure for Environmental Sanitary Code adoption or revision
- Develop a web page for septic haulers and pumpers
- Conduct a nutrient loading study for onsite wastewater systems
- Update the Kansas Environmental Health Handbook
- Update the LEPP web page
- Develop an online training center for sanitarians
16Other Nonpoint Source Pollution Control Projects
Background and History
One of the Goals in the Kansas Nonpoint Source Management Plan is to institute a revolving
loan fund for NPS projects, and to that end KDHE Watershed Management Section and KDHE
Municipal Programs Section have formed a partnership.
This effort was begun in 2009, when approximately $5.7 million of the American Recovery &
Reinvestment Act (ARRA) funding was set aside to support NPS/green infrastructure projects
administered through the Watershed Management Section (WMS). Eleven projects were
awarded in the form of low-interest loans with principal forgiveness. Funded projects used
innovative technologies for sustainable stormwater management and NPS pollution abatement,
such as constructed wetlands, native grass plantings, pervious pavement, bioretention swales,
rain gardens, and stormwater reuse systems, as well as some streambank stabilization and
restoration work.
Green Project Reserve
In FFY 11 and 12 (October 2010-September 2012), the Kansas Water Pollution Control
Revolving Fund (KWPCRF), which has traditionally been used for treatment plant upgrades,
reserved $5.1 million of its funding over two years for Green Project loans. The fund issued a
Call for Proposals that outlined submission requirements, project eligibility, and applicant
qualifications for NPS projects funded through the KWPCRF. Selected projects were notified of
the funding award; pre-award meetings were held to outline the loan application process and
requirements; and efforts continued to complete loan applications and secure executed loan
agreements. A total of 11 projects have been funded since 2011. These projects included
streambank stabilization, restoration with riparian/vegetated buffers, pervious pavement with
underdrain systems for stormwater storage, and bioretention swales and rain gardens.
Local Conservation Lending Program
The Local Conservation Lending Program (LCLP) was officially created during the 2014-2015
legislative session through the passage of House Substitute for Senate Bill 36 (H Sub for SB 36).
The bill authorizes KDHE to implement the program throughout the state of Kansas. The
purpose of the program is to make funds available through a linked-deposit system to local
banks, in exchange for low-interest loans to eligible borrowers for water quality protection
projects. Eligible projects fall into four main categories: General Conservation Projects,
Livestock Projects, Stream Restoration Projects, and Onsite Wastewater Assistance.
Through the continued partnership between the KDHE WMS and KDHE Municipal Programs
Section, approximately $1 million annually in KWPCRF set-aside funds has been made available
for four years for the LCLP deposits/investments. The program can be combined with other cost-
share programs for qualifying projects, providing an additional means to leverage state resources
to implement high priority projects aimed NPS pollution abatement.
17Since the LCLP statutes were enacted July 1, 2015, the KDHE WMS developed an Appendix to
the Kansas Nonpoint Source Pollution Management Plan, to establish the criteria, requirements,
and procedures for implementation of the program as directed in K.S.A. 2015 Supp. 65-3330.
The Appendix includes eligibility criteria, practices eligible for funding through the program,
eligibility criteria for borrowers, eligibility criteria for costs, project completion and certification
requirements and process, and other program requirements.
KDHE completed a successful ‘pilot phase’ of the program, in which prospective lending
institutions (banks) and test projects were identified. The goal of this phase was to work through
several projects in close coordination with participating lenders and agency partners in order to
address any comments or concerns as well as refine the program process. The official statewide
program was rolled out in July 2016.
Cost/Benefit Assessment
The direct and indirect costs of water pollution control can be measured, or at least estimated,
with some degree of confidence. In contrast, environmental benefits stemming from pollution
control are less amenable to expression in monetary terms. Section 101(a) of the CWA
establishes national water quality objectives and interim goals reflecting the belief that the costs
of water pollution control are outweighed by the ecological and social benefits of clean water.
The following paragraph and accompanying tables address some of the major costs associated
with water pollution control efforts in Kansas.
Pollution control expenditures in the state are associated predominantly with administrative
expenses, capital investments, and operational costs for WWTFs. Although little information is
available regarding the control costs borne by industrial and agricultural facilities, capital
expenditures associated with the construction and upgrading of municipal WWTFs have been
documented by KDHE. For example, the department administers the Kansas Water Pollution
Control Revolving Fund (KWPCRF), which provides low interest loans to municipalities for
water pollution control projects. Available monies are maximized through the sale of “leveraged
revenue bonds.” During the past twenty-eight years, these bonds have provided 463 loans
totaling $1.22 billion for facility improvements. KDHE also coordinates with the Community
Development Block Grant (CDBG) program, which is administered by the Kansas Department
of Commerce. This program typically provides grant funding for about 50% of the costs of a
selected water pollution control project. During 2016 and 2017, KWPCRF, CDBG, and other
state and federal programs provided about $124.6 million in financial aid to communities (Table
4). NPS pollution abatement measures received much less funding, relying instead on
predominantly voluntary measures and cost-share programs previously discussed.
18Table 4. KDHE cooperative funding for construction and expansion of municipal wastewater
treatment facilities
Funding KWPCRF + CDBG + RD +
year Basic Program ++ Federal Match++ Federal TOTAL
2016 $ 41.48 M $ 3.122 M $0 $ 2.771 M $ 47.373 M
2017 $ 52.54 M $ 3.234 M $0 $ 21.468 M $ 77.242 M
Total $ 94.02 M $ 6.356 M $0 $24.234 M $ 124.615 M
Monetary values presented in millions of dollars.
+ KWPCRF = Kansas Water Pollution Control Revolving Fund / CDBG = Community Development Block
Grants / RD = Rural Development Grants and Loans
++ All match funding for CDBG projects was provided by KWPCRF or RD
Special Concerns and Recommendations
The current major environmental concerns for the surface waters of Kansas can be divided into
four categories: agricultural concerns, municipal/industrial concerns, nuisance aquatic species,
and variations in flow regimes.
I. AGRICULTURAL CONCERNS
Given the extent of agricultural land use in Kansas, it is unsurprising that agricultural practices
exert a profound influence on surface water quality conditions. Erosion of cropland soils
produces elevated concentrations of silt in many streams and lakes, often to the detriment of
native aquatic and semiaquatic life. The presence of nitrogen- and phosphorus-containing
fertilizers in field runoff promotes nuisance growths of algae and detracts from the recreational
and drinking water supply uses of surface water. Stormwater runoff from uncontrolled feedlots,
livestock wintering areas, and heavily grazed pastures introduces pathogens and oxygen
consuming organic wastes into nearby lakes and streams, sometimes compromising the sanitary
condition of these waters. Pesticide residues in streams and drinking water supply lakes can
affect aquatic biota and pose potential long-term risks to human health.
Nonpoint source pollution potential has also been increased through conversion of grassland and
good riparian areas to commodity crops, mainly corn. When commodity prices increased and
United States Department of Agriculture (USDA) started subsidizing crop insurance, thousands
of acres of Conservation Reserve Program (CRP) land and non-CRP grass and riparian areas
were converted to corn. Even though some areas were put into no-till, the removal of deep rooted
native species and a developed soil microbe community reduced infiltration, increased the
likelihood of erosion and sediment deposition from ephemeral gullying, and increased the need
for fertilizers and pesticides. Cropping activity next to streams was also potentially destabilized.
Another trend is that with larger equipment and no-till practices, grassed waterways are deemed
as loss of valuable cropland and a deterrent to time-efficient farming. This has led to an increase
in the use of underground outlets in association with terraces equipped with risers. These
drainage systems often deliver agricultural runoff directly to a water body without any type of
natural degradation (sunlight-air) or vegetation treatment. These practices can create a conduit
for dissolved and particulate pollutants being discharged near or directly into a stream if there is
not adequate containment or filter.
19Some financial aid restrictions have already been implemented by KDHE and other state
agencies. Additionally, the KDHE Watershed Management Section (WMS) is taking steps to
reduce this practice by removing it from the list of practices eligible for the US Army Corps of
Engineers (USACE) Section 404 of the Clean Water Act General Permit Ag 40 for practices
designed by NRCS in its 5 year reissuance process. In April 2018, when new GP 40 Section 404
Permits are reauthorized, these underground outlets will not be included in blanket approval.
Instead, the applicant will need an individual Section 401 WQC, which will enable KDHE to
provide more technical assistance to protect and restore water quality conditions in potentially
affected water bodies.
The KDHE WMS also strives to realize the water quality benefits of improving soil health
through implementation of no-till, cover crops, crop rotation, livestock management systems (i.e.
percent of organic matter increase, increased bio-microbial activity, water holding capacity,
increase availability of nutrients) through infiltration and reduced runoff. Additionally, reduction
of soluble phosphorus runoff from surface application may be reduced by better infiltration and
better crop utilization through increased microbial activity. Depending on the rotation and type
of cover crop, quick and thick growth can help reduce weed pressure by shading them to allow
more sunlight to get to the cash crop so it can out compete the weed for sunlight. There may also
be some weed control through allelopathic characters of certain species of cover crops and some
cover crops readily attract beneficial insects for pest control.
Improved soil health can also reduce flood frequency and magnitude. Optimum infiltration into
healthy soil reduces peak runoff discharge. This in turn results in more metered flow into the
adjacent water body. This can help re-establish base flow in streams cut off from the natural
hydrological cycle as well as reduce the impact of runoff events. The ability for this to occur
could also provide “cleaner water” to assimilate nutrients in runoff. Subsurface flow is more
metered and less forceful, which can mitigate “hungry water” conditions that threaten stream
bank and bed stability. The KDHE has been working with WRAPS groups to identify farmers
who have started to implement soil health practices. The WMS is also working with the Kansas
Department of Agriculture Flood Plain Mapping Program to identify areas where better
infiltration could yield significant benefits.
The FFY 16/SFY17 reductions in nitrogen, phosphorus and sediment were accomplished through
partnerships between Kansas Department of Agriculture’s Division of Conservation, Natural
Resources Conservation Service, EPA (Section 319 Program), Kansas Water Office, and KDHE.
Partnership activities included financial and technical assistance at the WRAPS level. Practices
included both management and structural practices resulting in: 310,196 and 158,779 lbs/yr of
nitrogen and phosphorus respectively and 110,347 tons/yr of sediment. However, WMS and
EPA are encouraging less structural and more management based (soil health improvement
practices); these are envisioned to be more cost efficient with multiple benefits as described
above.
Efforts to alleviate the impacts of agriculture on the aquatic environment have focused primarily
on the abatement of soil erosion and proper management of chemical fertilizers, biocides, and
livestock wastes. Although the wider adoption of agricultural BMPs is underway and should lead
20to measurable reductions in stream contaminant levels, runoff water quality is not the only
agricultural factor limiting the use attainment of surface waters. Throughout much of western
Kansas, decades of irrigated crop production have exacted a heavy toll on stream life by
lowering groundwater tables, reducing base streamflows, and transforming formerly perennial
waterbodies into intermittent or ephemeral systems. In some areas of northeastern Kansas,
stream channelization has radically simplified the original aquatic habitats and decimated a
formerly diverse fish and shellfish fauna. Impoundments (large and small) throughout the state
have encouraged the establishment of predominantly nonnative fish assemblages, fragmented the
remaining stream habitats, and diminished the seasonal peak flows required by certain native
fishes for spawning and egg development.
The complete restoration of degraded aquatic ecosystems would require large-scale habitat
rehabilitation efforts and fundamental changes in the laws, policies, and practices currently
dictating the use and allocation of water in Kansas. Some more readily implemented options for
partially offsetting the historical effects of agriculture include: enhancing minimum streamflows
through the State-mediated purchase and retirement of senior water rights, expanding hatchery
restocking programs for native fish and shellfish; selectively removing lowhead dams and other
barriers to fish migration; installing fish ladders and elevators on larger dams, and other related
management initiatives – all in addition to concurrent improvements in agricultural practices.
Most of these concepts are not new; for example, the importance of maintaining migrational
corridors for fish was emphasized repeatedly by Kansas officials during the late nineteenth
century but never seriously considered in the course of water resource development (Angelo,
Cringan and Haslouer 2003).
Even so, there is improvement, as our scientific understanding, agency collaboration, and shared
policies improve. Many efforts are being coordinated more broadly across various state and
federal agencies. A Nutrient Reduction Plan was created by KDHE in 2004. In 2010 it was
expanded and formalized as the Kansas Nutrient Reduction Strategy, which includes
collaboration with the Kansas Water Office, Kansas Department of Agriculture, and Kansas
Department of Wildlife, Parks, and Tourism. In 2013, Governor Sam Brownback asked state
agencies to work together with his administration on a fifty-year water vision. As a result, the
Kansas Water Vision task force and planning documents (State of Kansas January 2015) have
created an even more permanent infrastructure for interagency collaboration on issues
surrounding statewide water supply and, to some degree, water quality.
The coalition of agencies work with state mechanisms as well as helping to coordinate and
leverage federal programs such as USDA Farm Service Agency’s Conservation Reserve
Enhancement Program (CREP), which provides incentives to remove environmentally sensitive
land from production and implement conservation practices.
II. MUNICIPAL AND INDUSTRIAL CONCERNS
Discharging wastewater treatment facilities (WWTFs) and other point sources influence surface
water quality throughout much of Kansas. Inorganic nitrogen and phosphorus released from
some facilities promote blooms of filamentous or scum-forming algae in downstream waters and
detract from their capacity to support primary and secondary contact recreation. Bypasses of raw
21or partially treated sewage occur each year, owing to treatment plant capacity limitations,
malfunctions, operator error, and natural catastrophes. Such bypasses can result in fishkills and
other serious water quality problems.
Stormwater runoff from lawns, golf courses, roadways, parking lots, and construction zones
often contains a complex mixture of chemical pollutants (e.g., herbicides and pesticides,
fertilizers, oil, grease, antifreeze, de-icing salts, solvents, detergents, asbestos). These substances
can prevent the development and maintenance of representative aquatic communities in
receiving surface waters. Similarly, concentrations of mercury, polychlorinated biphenyls
(PCBs), and other bioaccumulative contaminants in fish taken from urban streams may pose
unacceptable risks to human consumers. In addition, data related to the accumulation, transport
and fate of microplastics, animal and human pharmaceuticals, hormones, personal care products,
and other ubiquitous chemicals such as perfluorinated compounds (PFCs) and polybrominated
diphenyl ether fire retardants (PBDEs) are needed in Kansas as well as the rest of the country.
Although the concentrations of such chemicals in the water column are most often minute, the
processes of bioaccumulation and subsequent biomagnification in the food chain may
concentrate these chemicals in fish tissue to levels that subject human and wildlife consumers to
a risk of deleterious effects. Consumers of fish exposed to these contaminants and/or their
degradation products may be exposed to concentrations in fish tissue many times greater than the
concentrations occurring in the ambient environment, and many are resistant to removal by
drinking water treatment plants (Glassmeyer 2017). Although the USEPA has long
acknowledged the importance of monitoring and determining safe levels of these contaminants
of emerging concern (CECs) in both water (Stephen, et al. 1985) and fish tissue (USEPA 2013),
analytical costs for many of these compounds remain high, and financial support for
implementation at the state level has not been forthcoming.
Unplanned and extensive urban growth can negatively influence the physical habitats supporting
aquatic life, in part because eliminating and altering permeable land surfaces, wetlands, and
riparian areas diminishes urban watersheds’ capacity to remove pollutants and mitigate the
effects of flooding. Stormwater runoff from impervious surfaces such as paved areas and
rooftops can lead to powerful flooding events, capable of scouring stream bottoms and
eliminating the habitat required by some native aquatic species. The channelization of urban
streams results in highly simplified aquatic habitats incapable of supporting the full range of fish,
amphibians, invertebrates, plants, and wildlife indigenous to this region. In many instances, the
negative effects of high density development on streams, lakes, and wetlands could be reduced
through urban planning, employing established BMPs, maintaining green corridors around water
bodies, and strategically designing the placement of development. The retention of natural
corridors or “greenways” along rivers and creeks, and observance of the intent of the
antidegradation provisions of the surface water quality standards (KDHE 2015), would do much
to preserve the natural physical and chemical attributes of the state’s urban streams. Local, state,
and federal authorities also could support more litter cleanup initiatives. Improving the visual
and aesthetic character of urban waters would increase their perceived value and encourage
protection and sustainable use.
Some streams also suffer from illegal dumping of trash and other unwanted materials. The
practice of discarding grass clippings, brush, and animal carcasses into streams (and the
22subsequent decay of these materials) reduces dissolved oxygen levels, jeopardizes populations of
fish and other aquatic life, and may introduce pathogens. Discarded appliances and electronics,
paint cans, pesticide containers, and batteries may leach toxic materials, thereby posing a threat
to resident aquatic biota.
On a positive note, the deliberate and systematic renovation of many wastewater treatment
facilities has noticeably improved surface water quality over the past few decades, and this
progress continues. As point sources contributing to water quality impairments decline, attention
will shift increasingly to nonpoint sources. Watershed pollution control efforts, predicated
largely on the development and implementation of TMDLs, through WRAPS, will play an
increasingly important role in abatement of nonpoint source pollution.
III. NUISANCE AQUATIC SPECIES
Several exotic plant and animal species have established populations within the state, and some
pose a serious risk to native aquatic life and the beneficial uses of surface waters. For example,
Asian clams (Corbicula fluminea) have established large populations in streams and lakes
throughout the state, and the zebra mussel (Dreissena polymorpha) has gained a foothold in
recent years in several major river basins. Both of these exotic bivalves can compete with or
otherwise injure native shellfish species, and the zebra mussel in particular can impair designated
recreational and drinking water supply uses. At least three species of Asian carp have been
reported in Kansas (bighead carp, Hypophthalmichthys nobilis; silver carp, Hypophthalmichthys
molitrix, and grass carp, Ctenopharyngodon idella), as well as white perch (Morone americana)
and rudd (Scardinius erythrophthalmus); additional exotic fishes are expected to appear in
Kansas in the near future. These animals can compete with native fish and wildlife for food and
shelter, and some dramatically reduce water clarity by disturbing bottom sediments during
feeding. Zebra mussels and other invasive species also create significant costs to manage and
mitigate (Connelly, et al. 2007).
A number of introduced plant species also have proven problematic. Thickets of salt cedar
(Tamarix spp.) have become established along many streams in western and central Kansas,
crowding out the native riparian vegetation and removing (via evapotranspiration) vast amounts
of water from the adjoining streams and underlying alluvial aquifers. Purple loosestrife (Lythrum
salicaria) has become the dominant herbaceous species in many wetlands, overwhelming many
of the state’s native plants and jeopardizing the animals depending on these plants for food and
shelter. Eurasian watermilfoil (Myriophyllum spicatum), an exotic plant sold in the aquarium
trade, has been documented in several streams in western Kansas and in scattered lakes
throughout the state. This plant propagates via seeds and vegetative fragments and can spread
rapidly between waterbodies by attaching to boat propellers, boat trailers, and fishing gear.
Curly-leaf pondweed (Potamogeton crispus) has also been found in seven publicly accessible
lakes. Once introduced into a lake or stream, these plants can form dense mats of vegetation that
can interfere with recreational activities, crowd out native aquatic vegetation, disrupt the feeding
behavior of native fish, and choke water intakes used for municipal water supply, power
generation, and irrigation. An even more invasive and potentially damaging exotic aquatic plant.
Hydrilla (Hydrilla verticillata) has been discovered in two discrete locations in northeast Kansas
during the last few years (an urban park lake, and a restaurant’s outdoor water garden). The
23You can also read