Assessment of the potentials to increase emissions reduction targets by the major GHGs emitters taking into consideration technological and ...
←
→
Page content transcription
If your browser does not render page correctly, please read the page content below

Assessment of the potentials to increase
emissions reduction targets by the major GHGs
emitters taking into consideration technological
and political feasibility
Authors:
Fekete, Hanna; Kuramochi, Takeshi; Nascimento, Leonardo; Tewari, Ritika
(NewClimate Institute); Ancygier, Andrzej; Connors, Kate; Kästner, Antje; Parra,
Paola; Zamarioli, Luis (Climate Analytics); Denishchenkova, Alexandra;
Wachsmuth, Jakob (Fraunhofer ISI); Duwe, Matthias; Zelljadt, Elizabeth;
Freundt, Mona (Ecologic Institute)

                                                                     October 2019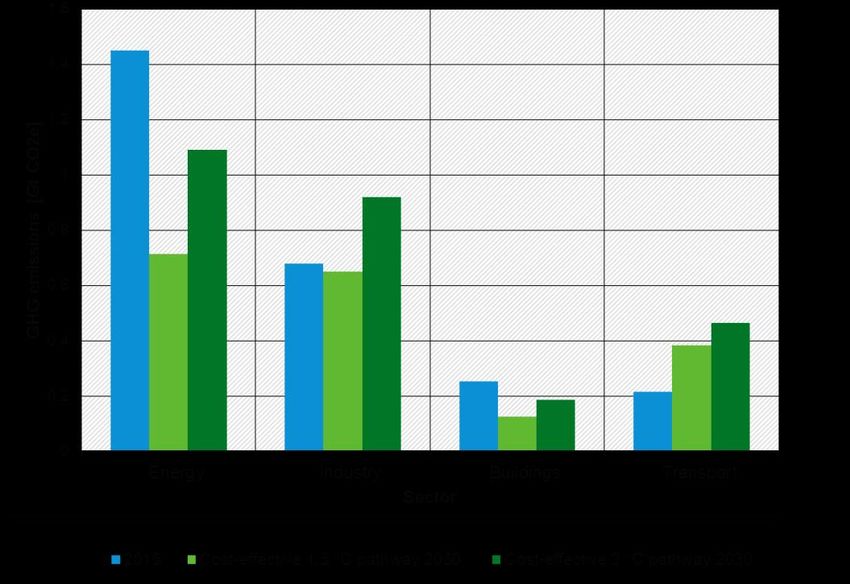
Assessment of the potentials to
increase emissions reduction
targets by the major GHGs emitters
taking into consideration
technological and political
feasibility
In the framework of the project: „Implikationen des Pariser
Klimaschutzabkommens auf nationale Klimaschutz-
anstrengungen“

Project number
317022

© NewClimate Institute 2019

Authors
Fekete, Hanna; Kuramochi, Takeshi; Nascimento, Leonardo; Tewari, Ritika (NewClimate Institute);
Ancygier, Andrzej; Connors, Kate; Kästner, Antje; Parra, Paola; Zamarioli, Luis (Climate Analytics);
Denishchenkova, Alexandra; Wachsmuth, Jakob (Fraunhofer ISI); Duwe, Matthias; Zelljadt, Elizabeth;
Freundt, Mona (Ecologic Institute)

Disclaimer
The contents of this report are based on research conducted in the framework of the project
“Implikationen des Pariser Klimaschutzabkommens auf nationale Klimaschutzanstrengungen",
conducted on behalf of the German Federal Environment Agency, FKZ 3717 41 102 0
The views expressed in this paper are strictly those of the authors and do not necessarily represent the
opinion of the German Federal Environment Agency, nor of the German Federal Ministry for the
Environment, Nature Conservation and Nuclear Safety.

     Download the report
     http://newclimate.org/publications/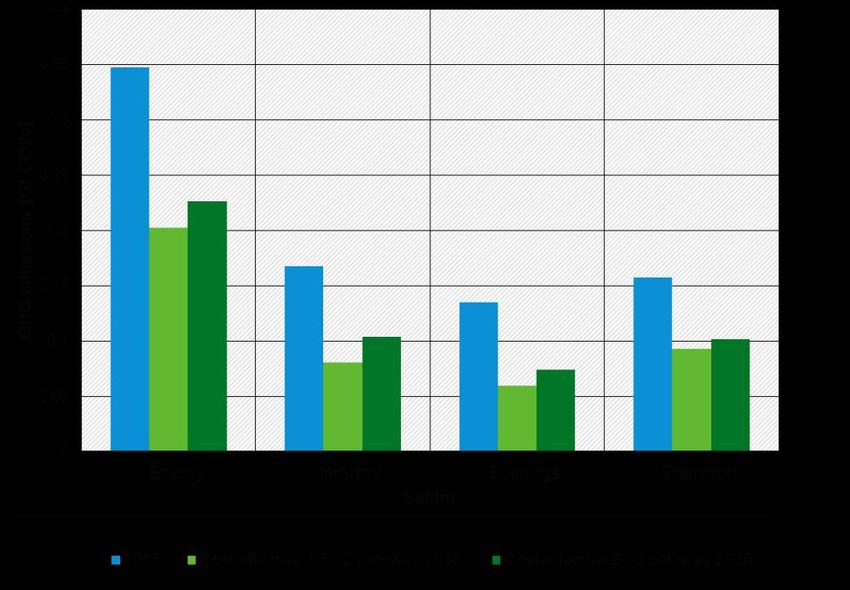
Assessment of the potentials to increase emissions reduction targets by the major GHGs

Table of Contents
Table of Contents ...................................................................................................................................... i
List of Figures ...........................................................................................................................................iii
List of Tables ........................................................................................................................................... iv
Abbreviations ............................................................................................................................................ v
Introduction ............................................................................................................................................... 1
1     Brazil .................................................................................................................................................. 3
      1.1        Introduction ............................................................................................................................. 3
      1.2        Socio-economic context for greenhouse gas emissions reductions ...................................... 4
      1.3        Greenhouse gas emissions profile ......................................................................................... 5
      1.4        Development of future greenhouse gas emissions ................................................................ 1
      1.5        Political context ...................................................................................................................... 3
2     Canada .............................................................................................................................................. 6
      2.1        Introduction ............................................................................................................................. 6
      2.2        Socio-economic context for greenhouse gas emissions reductions ...................................... 6
      2.3        Greenhouse gas emissions profile ......................................................................................... 8
      2.4        Development of future greenhouse gas emissions ................................................................ 8
      2.5        Political context .................................................................................................................... 11
3     China ............................................................................................................................................... 15
      3.1        Introduction ........................................................................................................................... 15
      3.2        Socio-economic context for greenhouse gas emissions reductions .................................... 16
      3.3        Greenhouse gas emissions profile ....................................................................................... 17
      3.4        Development of future greenhouse gas emissions .............................................................. 18
      3.5        Political context .................................................................................................................... 20
4     The European Union ....................................................................................................................... 23
      4.1        Introduction ........................................................................................................................... 23
      4.2        Socio-economic context for greenhouse gas emissions reductions .................................... 24
      4.3        Greenhouse gas emissions profile ....................................................................................... 25
      4.4        Development of future greenhouse gas emissions .............................................................. 26
      4.5        Political context .................................................................................................................... 28
5     Germany .......................................................................................................................................... 36
      5.1        Introduction ........................................................................................................................... 36
      5.2        Socio-economic context for greenhouse gas emissions reductions .................................... 37
      5.3        Greenhouse gas emissions profile ....................................................................................... 38
      5.4        Development of future greenhouse gas emissions .............................................................. 39
      5.5        Political context .................................................................................................................... 41
6     India ................................................................................................................................................. 44
      6.1        Introduction ........................................................................................................................... 44
      6.2        Socio-economic context for greenhouse gas emissions reductions .................................... 44
      6.3        Greenhouse gas emissions profile ....................................................................................... 46
      6.4        Development of future greenhouse gas emissions .............................................................. 47
      6.5        Political context .................................................................................................................... 49
7     Japan ............................................................................................................................................... 52
      7.1        Introduction ........................................................................................................................... 52
      7.2        Socio-economic context for greenhouse gas emissions reductions .................................... 52
      7.3        Greenhouse gas emissions profile ....................................................................................... 54

    NewClimate Institute | October 2019                                                                                                                        i
Assessment of the potentials to increase emissions reduction targets by the major GHGs

      7.4       Development of future greenhouse gas emissions .............................................................. 55
      7.5       Political context .................................................................................................................... 57
8     United States ................................................................................................................................... 60
      8.1       Introduction ........................................................................................................................... 60
      8.2       Greenhouse gas emissions profile ....................................................................................... 62
      8.3       Development of future greenhouse gas emissions .............................................................. 62
      8.4       Political context .................................................................................................................... 65
References ............................................................................................................................................. 69

    NewClimate Institute | October 2019                                                                                                                 ii
Assessment of the potentials to increase emissions reduction targets by the major GHGs

List of Figures
Figure 1: Brazil – Relative change in GHG emissions excl. LULUCF compared to base year for equity
and cost-based approaches ..................................................................................................................... 3
Figure 2: Brazil - Primary energy supply by energy carrier between 1990 and 2016.............................. 5
Figure 3: Brazil – Sectoral GHG emissions between 1990 and 2016 ..................................................... 6
Figure 4: Brazil – Historical and projected emissions under current policies and target pathways......... 1
Figure 5:Brazil – Sectoral GHG reduction potentials until 2030 compared to 2015 ................................ 2
Figure 6: Canada – Relative change in GHG emissions excl. LULUCF compared to base year for equity
and cost-based approaches ..................................................................................................................... 6
Figure 7: Canada – Primary energy supply by energy carrier between 1990 and 2017 ......................... 7
Figure 8: Canada – Sectoral GHG emissions between 1990 and 2016 .................................................. 8
Figure 9: Canada – Historical and projected emissions under current policies and target pathways ..... 9
Figure 10: Canada – Sectoral GHG reduction pathways until 2030 compared to 2015 ....................... 10
Figure 11: China – Relative change in GHG emissions excl. LULUCF compared to base year for equity
and cost-based approaches ................................................................................................................... 15
Figure 12: China – Primary energy supply by energy carrier between 1990 and 2016 ........................ 17
Figure 13: China – Sectoral GHG emissions between 1990 and 2016 ................................................. 17
Figure 14: China – Historical and projected emissions under current policies and target pathways .... 18
Figure 15: China – Sectoral GHG reduction potentials until 2030 compared to 2015 .......................... 19
Figure 16: The EU - Relative change in GHG emissions (without LULUCF) to base year for equity and
cost-based approaches in 2030 (left) and 2050 (right). ......................................................................... 23
Figure 17: The EU - Primary energy supply by energy carrier between 1990 and 2017 ...................... 25
Figure 18: The EU - GHG emissions by sector between 1990 and 2017 ............................................. 25
Figure 19: The EU - Historical and projected emissions under current policies and target pathways .. 27
Figure 20: Sectoral GHG reduction pathways in the EU until 2030 compared to 2015 ........................ 28
Figure 21: Germany – Relative change in GHG emissions excl. LULUCF compared to base year for
equity and cost-based approaches ........................................................................................................ 36
Figure 22: Germany – Primary energy supply by energy carrier between 1990 and 2017 ................... 38
Figure 23: Germany – Sectoral GHG emissions between 1990 and 2017 ........................................... 38
Figure 24: Germany – Historical and projected emissions under current policies and target pathways
................................................................................................................................................................ 39
Figure 25: Germany – Sectoral GHG reduction potentials until 2030 compared to 2015 ..................... 40
Figure 26: India – Relative change in GHG emissions excl. LULUCF to base year for equity and cost-
based approaches .................................................................................................................................. 44
Figure 27: India – Primary energy supply by energy carrier between 1990 and 2016 .......................... 46
Figure 28: India – Sectoral GHG emissions between 1990 and 2016................................................... 46
Figure 29: India – Historical and projected emissions under current policies and target pathways ...... 47
Figure 30: India – Sectoral GHG reduction potentials until 2030 compared to 2015 ............................ 48
Figure 31: Japan – Relative change in GHG emissions excl. LULUCF compared to base year for equity
and cost-based approaches ................................................................................................................... 52
Figure 32: Japan – Primary energy supply by energy carrier between 1990 and 2017 ........................ 54
Figure 33: Japan – Sectoral GHG emissions between 1990 and 2016................................................. 54
Figure 34: Japan – Historical and projected emissions under current policies and target pathways .... 55
Figure 35: Japan – Sectoral GHG reduction pathways until 2030 compared to 2015 .......................... 56
Figure 36: USA – Relative change in GHG emissions excl. LULUCF compared to base year for equity
and cost-based approaches ................................................................................................................... 60
Figure 37: USA – Primary energy supply by energy carrier between 1990 and 2017 .......................... 61
Figure 38: USA – Sectoral GHG emissions between 1990 and 2016 ................................................... 62
Figure 39: USA – Historical and projected emissions under current policies and target pathways ...... 63
Figure 40: USA – Sectoral GHG reduction pathways until 2030 compared to 2015 ............................. 64

     NewClimate Institute | October 2019                                                                                                                       iii
Assessment of the potentials to increase emissions reduction targets by the major GHGs

List of Tables
Table 1: Brazil – Key socioeconomic figures ........................................................................................... 4
Table 2: Brazil – Key GHG emissions data .............................................................................................. 6
Table 3: Canada – Key socioeconomic figures........................................................................................ 7
Table 4: Canada – Key GHG emissions data .......................................................................................... 8
Table 5: China – Key socioeconomic data ............................................................................................. 16
Table 6: China – Key GHG emissions data ........................................................................................... 18
Table 7: The EU - Key socio-economic figures...................................................................................... 24
Table 8: The EU – Key GHG emissions data ........................................................................................ 26
Table 9: Germany – Key socioeconomic figures ................................................................................... 37
Table 10: Germany – Key GHG emissions data .................................................................................... 39
Table 11: India – Key socioeconomic figures ........................................................................................ 45
Table 12: India – Key GHG emissions data ........................................................................................... 47
Table 13: Japan – Key socioeconomic figures ...................................................................................... 53
Table 14: Japan – Key GHG emissions data ......................................................................................... 55
Table 15: USA – Key socioeconomic figures ......................................................................................... 61
Table 16: USA – Key GHG emissions data ........................................................................................... 62

    NewClimate Institute | October 2019                                                                                               iv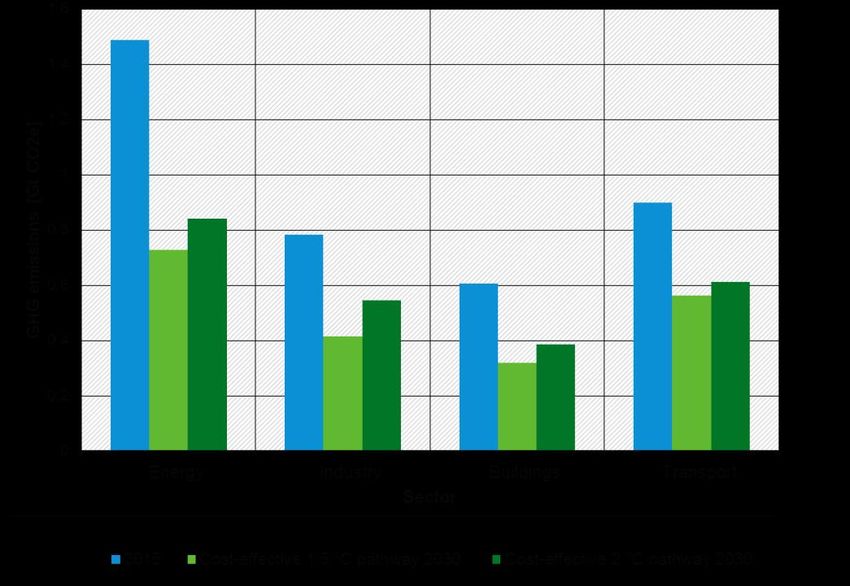
Assessment of the potentials to increase emissions reduction targets by the major GHGs

Abbreviations
AIIB      Asian Infrastructure Investment Bank
API       American Petroleum Institute
BAU       Business as Usual
CAPP      Canadian Association of Petroleum Producers
DPJ       Democratic Party of Japan
EITE      Energy Intensive Trade Exposed
EPA       Environmental Protection Agency
EPR       Energy- and process-related emissions
ETS       Emissions Trading Scheme
EU        European Union
FYP       Five Year Plan
GDP       Gross Domestic Product
GHG       Greenhouse Gas
HDI       Human Development Index
HFC       Hydrofluorocarbon
IEA       International Energy Agency
IETA      International Emissions Trading Association
IMF       International Monetary Fund
IPCC      Intergovernmental Panel on Climate Change
ISEP      Institute for Sustainable Energy Policies
LPD       Liberal Democratic Party
LULUCF    Land use, land-use change and forestry
MACC      Marginal Abatement Cost Curves
MBD       Million Barrels per Day
MEE       Ministry of Ecological Environment
MEP       Ministry of Environmental Protection
METI      Ministry of Economy, Trade, and Industry
MNRE      Ministry of New and Renewable Energy
MOE       Ministry of the Environment
MOFA      Ministry of Foreign Affairs
NCSC      National Centre for Climate Change Strategy and International Cooperation
NDC       Nationally Determined Contribution
NGO       Non-Government Organisation
NPD       New Democratic Party
NRDC      National Development and Reform Commission
UN SG     United Nations Secretary General
UNFCCC    United Nations Framework Convention on Climate Change
WCI       Western Climate Initiative

 NewClimate Institute | October 2019                                                                   v
Assessment of the potentials to increase emissions reduction targets by the major GHGs

Introduction
Keeping global warming well below 2°C and pursuing efforts to limit it to 1.5°C above preindustrial levels,
as stipulated in the Paris Agreement, requires accelerated efforts to reduce greenhouse gas (GHG)
emissions in all countries. Current mitigation targets for 2020 and 2030, as well as long-term targets,
are inconsistent with these temperature limits (UNEP, 2018; Climate Action Tracker, 2019d). Parties to
the United Nations Framework Convention on Climate Change (UNFCCC) are expected to update their
Nationally Determined Contributions (NDCs) by 2020. Key political moments to do so include the United
Nations Secretary General (UN SG) Climate Change Summit in September 2019 and the 25 th
Conference of Parties (COP) in December 2019.

This report shows the potential distribution of the emissions reduction efforts between different Parties
and presents an in-depth assessment of the circumstances influencing the (over-) achievement of the
currently suggested emissions reduction goals. The analysis focuses on the following countries: Brazil,
Canada, China, Germany, India, Japan and the United States.

For each country, the report draws conclusions to what extent mitigation targets could be strengthened,
based on the following elements:

   •   The socioeconomic context: The socioeconomic data, including up-to-date population levels,
       urbanisation and electrification percentages, rates of economic growth and the propensity for
       corruption, provide context for mitigation actions and their political feasibility. This section
       summarises data from international data sources, such as the World Bank, Transparency
       International and different UN organisations.
   •   Greenhouse gas emissions and energy profiles: GHG and energy profiles show which areas
       are most critical to consider for mitigation efforts. This section illustrates historical emissions data
       based on PRIMAP data (Gütschow et al., 2018b) and energy consumption based on the IEA
       (IEA, 2018c).
   •   Emissions projections in comparison to mitigation targets: Some countries are set to
       (over-) achieve their mitigation targets, while others lag behind in implementation. This section
       illustrates the mitigation targets of the countries and projected emissions under implemented
       policies, based on the Climate Action Tracker.
   •   Emissions pathways resulting from global least-cost pathways: There are models that
       distribute global emission pathways in line with the temperature limits to countries, assuming a
       most cost-efficient distribution of efforts. This means that the cheapest mitigation options are
       used first, regardless of which country implements them. The cost-effective reduction shares in
       this report are based on recent marginal abatement cost curves (MACC) from the POLES
       database (ENERDATA, 2018), which were used to derive globally cost-effective national
       pathways. The model covers all energy- and process-related GHG emissions. MACCs are
       provided for 50 countries (including all countries assessed in this report) and 20 regions. Data is
       provided up to a maximum shadow carbon price of 1.200 EUR/t. The MACCs are based on the
       data from the EnerBlue scenario and describe mitigation potentials additional to the EnerBlue
       scenario. The EnerBlue scenario assumes the continuation of current policies in a way that the
       2030 targets defined as part of the COP21 NDCs are successfully achieved.
   •   Emissions pathways assuming an equitable distribution of mitigation efforts: There are
       many studies that calculate the required contribution of countries to global mitigation efforts,
       based on different equity principles, such as historical responsibility or equality. This approach
       summarises data from the literature on what each country’s “fair share” of global mitigation effort
       is for 2030 and 2050. All data for this approach are drawn from Climate Action Tracker (CAT)
       (Climate Action Tracker, 2017). Given the large variability of equity proposals, criteria and
       metrics, each country has a wide equity range covering a large number of results from the

   NewClimate Institute | October 2019                                                                       1
Assessment of the potentials to increase emissions reduction targets by the major GHGs

      literature. CAT further divides the equity range to determine the levels, where, if all countries
      adopted a similar ambition level, global temperature increase would be at 2°C and at 1.5°C.
   • Insights regarding the political context of mitigation ambition: The technologies leading to
      emission reductions are already available and are in many cases competitive with the costs of
      high-emitting options, even if the external costs of the latter are excluded. Their deployment is
      still strongly dependent on the political landscape. The political feasibility of, for example, the
      phasing out of counterproductive measures such as fossil fuel subsidies, and increasing
      mitigation ambition overall is investigated in the last section of each country profile.
The results on global least-cost pathways and the equitable distribution of mitigation efforts originate
from Wachsmuth et al. (2019).

   NewClimate Institute | October 2019                                                                     2
Assessment of the potentials to increase emissions reduction targets by the major GHGs
1 Brazil
1.1 Introduction
Due to its heavy reliance on renewable energy sources (mostly hydro) for electricity production, Brazil
has one of the least carbon intensive energy sectors in the world. This reliance on renewables was
driven mainly by the desire to increase the country’s energy security during the 1970’s oil crisis as well
as abundant national resources for hydro energy. While climate policy started to play a role in Brazil’s
policy-making process during the presidencies of Lula da Silva (2002-2010) and Dilma Rousseff (2010-
2016), this has changed with the victory of Jair Bolsonaro who took over as the country’s president on
1st January 2019. Bolsonaro’s government has represented regression on climate action in Brazil, with
important legislative changes including the weakening of the institutional and legal framework that helps
fight deforestation and other environmental offenses, as well as reforms that substantially weaken the
participation of civil society, including pro-environment groups, in policymaking and in oversight of policy
implementation (Climate Action Tracker, 2019a). While it is hard to predict the effect these regulatory
changes will have on emissions, most of them have the potential to drive up illegal deforestation and
other environmental offenses which would result in a significant increase in the emissions from the land
use, land-use change, and forestry (LULUCF) sector, as already evidenced in the unprecedented fires
observed in the Amazon rainforest in 2019, directly related to deforestation activities.
Our results show that Brazil’s 2030 NDC excl. LULUCF is in line with least-cost scenarios and the less
ambitious end of equity-based approaches, at around the level of 2005 emissions. The equity-based
approaches in this range rely on other countries to do more, to limit global temperature increase to
1.5°C. To move to a Paris compatible range, Brazil would need to reduce emissions by at least 50%
below 2005, according to equity-based approaches.
2030 2050
50% 50%
Relative change compared to 2005 [%]
Relative change compared to 2005 [%]
0% 0%
-50% -50%
-100% -100%
-150% -150%
-200% -200%
Current NDC Equity Least-cost Current Long-term Equity Least-cost
policy based range range policy target based range range
projections projections
Figure 1: Brazil – Relative change in GHG emissions excl. LULUCF compared to base year for equity
and cost-based approaches
Notes: Current policy projections, NDC and equity-based emissions reduction ranges from Climate Action
Tracker—equity range from 2018 (December update), other data from (2019 April update). Legend: For equity-
based range: orange (upper range) is >2°C consistent, yellow (middle range) is 2°C consistent, green (low range)
is 1.5°C consistent. For least-cost range: lower limit for 1.5°C, upper limit for 2°C.
NewClimate Institute | October 2019 3Assessment of the potentials to increase emissions reduction targets by the major GHGs
1.2 Socio-economic context for greenhouse gas emissions
reductions
Brazil is the largest economy in Latin America and is the eighth largest in the world in terms of nominal
GDP. Economic output is dominated by services and industry but agriculture, with the share of 6.6% in
the GDP, playing an important role (CIA, 2019). Brazil has undergone major economic and political
upheavals in the last years. In 2016, the ruling president Dilma Rousseff was impeached on grounds of
alleged massive corruption. This political crisis was accompanied by the economic crises of 2015 and
2016, in which GDP fell by over 3% in both years (Macrotrends, 2019). After a sluggish growth in 2017
and 2018, Brazilian economy shrank again in early 2019 (Trading Economics, 2019).
In the last decades Brazil’s economic growth has stimulated the growth of a middle class and improved
the state of development, as seen by its high scores in the human development index (increase from
0.68 in 2000 to 0.76 in 2017), 100% electrification (increase from 94% in 2000), and high urbanisation
rates. However, as indicated by the high value of the GINI Index, Brazil has the highest level of inequality
among the countries analysed in this report.
Furthermore, Brazil faces the challenge of safeguarding its natural capital, especially the Amazonian
forests. The pace of deforestation in the Amazon has been linked to cycles of economic highs and lows
with the levels of deforestation increasing during times of economic crisis (Fearnside, 2017). Brazil’s
growing exports from agribusiness, involving agricultural and animal products, influences the rate of
deforestation (MIT, 2018). In May 2019 the rate of deforestation increased significantly and by July has
almost doubled in comparison to the preceding year (INPE, 2019), with an unprecedented forest fire
season observed in August 2019, which has resulted in the Federal State of Amazonas to declare a
state of emergency (Euronews, 2019).
Brazil is also a key exporter of crude oil. Significant reserves, which are regularly auctioned, were
discovered in the pre-salt layers in 2007. In an auction on March 2018, 22 new blocks were acquired
(ANP, 2018). This and future auctions can, according to some estimates, increase Brazil’s oil extraction
from 3.1 million barrels of oil per day (mbd) currently to 7.5 mbd in 2030 (Brazil Energy Insight, 2019).
1.2.1 Economic and development-related data
Table 1: Brazil – Key socioeconomic figures
Indicator Value World Year Source
Population [million] 209.5 7 594 2018 The World Bank
GDP [bn USD at 1 869 2018 The World Bank
85 791
current prices]
GDP/cap [USD/cap] 8 921 11 297 2018 The World Bank
HDI [0 – 1] 0.76 Rank 79 2018 UNDP
GINI index [0 – 100] 53.3 n.a. 2017 The World Bank
Electrification rate 100% 2017 The World Bank
88.9%
[%]
Corruption index Score: 35/100 Transparency
Rank: 105/180 2018
International
Urbanization [% of United Nations
86.8% 55.7% 2019
total] Population Division
Data sources: (Transparency International, 2018; United Nations Department of Economic and Social Affairs:
Population Division, 2018; United Nations Development Programme (UNDP), 2018; Statista, 2019; The World
Bank, 2019b, 2019a, 2019c).
NewClimate Institute | October 2019 4Assessment of the potentials to increase emissions reduction targets by the major GHGs
1.2.2 Energy production and consumption
Due to the strong policy impetus on bioenergy and hydro in the past, Brazil is known to have one of the
cleanest energy mixes in the world. Brazil’s primary energy mix has had nearly equal shares of
renewables and fossil fuels. Oil was the largest energy carrier in 2016 with a 39% share in total supply,
followed by biomass and waste (30%), gas (11%), hydro (11%), and coal (6%).
However, Brazil’s rapid economic growth until the financial crisis in 2008/2009 has also led to an in-
crease in energy consumption, especially from fossil-fuels. Between 1990 and 2015 Brazil’s total primary
energy demand has more than doubled. While the absolute consumption of oil and traditional biomass
and waste has increased steadily, their shares in the primary energy mix have declined moderately. The
major upward trend has been in the rising share of natural gas, which has increased sharply from 2% in
1990 to 11% in 2016. The growth in demand can be particularly attributed to the rise in consumption of
power and transportation fuels. Electricity is primarily produced from hydropower, with smaller shares
from natural gas and coal. However, Brazilian hydropower has been vulnerable to draughts, which has
led the government to invest in procuring power from other sources, including fossil fuels (Climate Action
Tracker, 2019a).
Primary energy by energy carrier
350,000
Total primary energy supply (ktoe/a)
300,000
250,000
200,000
150,000
100,000
50,000
0
1990 1995 2000 2005 2010 2015
Biomass and Waste Solar, wind and other RE Geothermal Hydro Nuclear Gas Oil Coal
Figure 2: Brazil - Primary energy supply by energy carrier between 1990 and 2016
Data source: (IEA, 2018a)
1.3 Greenhouse gas emissions profile
Brazil emits 5.5% of global GHGs emissions, including emissions from LULUCF. Excluding the LULUCF
sector Brazil’s share of global emissions amounted to 2.3% (PRIMAP, 2019). Owing to a relatively clean
energy profile, the energy intensity of GDP is lower than the world average. Historically, emissions from
deforestation have dominated Brazil’s emissions profile. While the share of deforestation emissions
steadily decreased for several years, this remarkable progress in mitigating forestry emissions seems
to have come to a halt in 2016. In comparison with 2015 levels, deforestation in 2016 increased by
almost 30% with more than 50% of the deforestation occurring in the Amazon rainforest region, adding
around 130 MtCO 2 to total net emissions in 2016 (Climate Action Tracker, 2018b). In 2018, Brazil
recorded the world’s highest loss of tropical primary rainforest of any country, reaching 1.3 million
hectares, largely due to deforestation in the Amazon rainforest. National estimates show total
deforestation reaching 7900 km 2 in 2018, which is an increase of 13.7% from 2017 levels and of 72%
from the historic low reached in 2012 (Climate Action Tracker, 2019).
NewClimate Institute | October 2019 5Assessment of the potentials to increase emissions reduction targets by the major GHGs
National data shows a continuation in the increasing deforestation in 2019, with deforestation rates
almost doubling from 2018 rates. Despite the low energy intensity of GDP, emissions from the energy
sector have been on a steady rise. The sub-sectors of transport and industrial energy use are major
emitters in the energy sector (Ministry of Science and Technology of Brazil, 2016). Agriculture
emissions, which account for around 40% of total emissions, are mostly from enteric fermentation from
Historical
cattle emissions by sector
ranching.
1,200
Greenhouse gas emissions (MtCO 2 e/a)
1,000
800
600
400
200
0
1990 1995 2000 2005 2010 2015
Total Energy Industry Solvents
Agriculture Waste Other
Figure 3: Brazil
UNFCCC – Sectoral
Total excl. GHG emissions UNFCCC
LULUCF between 1990
Total incl.and 2016
LULUCF
Data source: (Gütschow et al., 2018a)
Table 2: Brazil – Key GHG emissions data
Indicator Brazil World Year
GHG/cap [tCO2e/cap] 4.76 6.15 2016
GHG/GDP [tCO2e/mln USD] 551 603 2016
Energy/GDP [ktoe/mln USD] 0.14 0.18 2016
Global share of emissions [%] 5.54% 100% 2012
Data sources: (JRC and PBL, 2014; Gütschow et al., 2018a; IEA, 2018b; The World Bank, 2018a). GHG
indicators were calculated using PRIMAP data and exclude contributions from the LULUCF sector.
NewClimate Institute | October 2019 6Assessment of the potentials to increase emissions reduction targets by the major GHGs 1.4 Development of future greenhouse gas emissions 1.4.1 Emission reduction targets and current policy projections Brazil’s NDC aims at reducing emissions to 1.3 GtCO2eq by 2025 and to 1.2 GtCO2eq by 2030. It also communicated a “subsequent indicative contribution” for 2030 of emissions reduction by 43% below 2005, including LULUCF (Federative Republic of Brazil, 2015). The Climate Action Tracker (CAT) calculates a relative change excluding LULUCF of 15% above 2005 for 2025 and 3% above 2005 for 2030. Brazil has a 2020 pledge of reducing emissions from 36.1 to 38.9% below BAU (incl. LULUCF). With implemented policies, Brazil will overachieve its 2020 target but miss its NDC targets (see Figure 39), both excluding LULUCF. Note that the Climate Action Tracker excludes emissions from LULUCF in its outputs. To split up the Brazilian NDC into emissions excl. LULUCF and incl. LULUCF, it uses projections for emissions from LULUCF from the official national sources underlying the NDC document (Ministério da Ciência Tecnologia Inovações e Comunicações Brasil, 2017), however alternative national sources project much higher LULUCF emissions by 2030 (Rochedo et al., 2018), which would require much lower emission in other sectors for the achievement of the NDC targets. Figure 4: Brazil – Historical and projected emissions under current policies and target pathways Data source: Climate Action Tracker 2018 1.4.2 Sectoral mitigation pathways until 2030 The highest share of energy- and process-related GHG emissions in 2015 in Brazil is allocated to the energy sector, amounting to 0.34 GtCO2eq. The energy supply sector is comprised of electricity generation as well as transformation (refineries, centralized heat, etc.). Substantial contributions also come from the transport sector, which is the source of one third of the total emissions in 2015. Emissions in the transport sector are mainly determined by road transport. About 0.17 GtCO2eq come from the industry sector, an amount that represents a share of 25% of Brazil’s total emissions. A comparison between global 1.5°C-consistent and 2 °C-consistent pathways based on recent marginal abatement cost curves (MACCs) for 2030 leads to the conclusion that the potential to reduce energy- and process-related emissions based on the MACC has to be exploited to a much larger extent to achieve 1.5 °C consistency. For Brazil, this would amount to a reduction of energy- and process-related emissions in 2030 by -30% compared to 2015 (-1% if compared to Brazil’s NDC base year 2005), with the highest reduction in the energy supply sector (-50%). For the year 2030, industry, and building NewClimate Institute | October 2019 1
Assessment of the potentials to increase emissions reduction targets by the major GHGs

sectors would have an economic potential to mitigate GHG emissions ranging from 38% to 39%. Activity
of the transport sector could continue to grow, with emissions’ increase of 7% compared to 2015.

The cost-effective pathway compatible with 2°C by 2030 shows reductions in the energy supply sector
of 49%. Emission reductions in the buildings and industry sectors are on the same level of about 20%.
Transport emissions could even increase by +15%. Total emissions reductions achieved would be 19%
compared to 2015 (+14% if compared to the NDC base year 2005).

For an NDC-consistent reference pathway for Brazil, the emissions reductions in the energy supply
sector in 2030 amount to 29% compared to 2015 emission levels. There is no reduction of emissions
achieved in the industry, building, and transport sector. On the contrary, emissions in the transport sector
may increase by 23%.

The sectoral emissions reductions for the different pathways are summarized in Figure 7.

Figure 5:Brazil – Sectoral GHG reduction potentials until 2030 compared to 2015
Source: own calculation based on data from the POLES-Enerdata model

1.4.3 Emissions reduction targets suggested by equity considerations
According to different equity approaches, Brazil’s emissions (excluding LULUCF) in 2030 should be at
least 62% below 2015 levels (52% below 2005 levels) in order to stay within the 1.5°C temperature limit
compatibility ranges of the Paris Agreement. Compatibility with the former 2°C goal would re-quire
emission reductions by 34% below 2015 levels (17% below 2005 levels). These reduction ranges stand
in stark contrast with the NDC reduction target excluding LULUCF (as estimated by the Climate Action
Tracker) of 15% above 2005 for 2025 and 3% above 2005 for 2030.

When compared to cost-effective reduction ranges in 2030 (19-30% below 2015 levels), equity-based
emissions allowances show more stringent reductions. They indicate that beyond achieving the maxi-
mum potential emissions reductions domestically, to contribute its fair share to global mitigation efforts
Brazil should engage actively in international cooperation for emissions mitigation. Given Brazil’s huge
role in the international agriculture and biofuel market, these sectors offer a large amount of potential
for Brazil to get involved in international cooperation. In addition, given its remarkable progress in
combating deforestation emissions between 2005 and 2015, the LULUCF sector is another area where

   NewClimate Institute | October 2019                                                                     2
Assessment of the potentials to increase emissions reduction targets by the major GHGs

Brazil could engage actively in international cooperation through south-south cooperation initiatives and
market activities.

In 2050, emissions allowances under equity considerations show reductions of 98% and 62% in
comparison to 2015, respectively for each of the temperature targets (98% and 52% in comparison with
2005 levels). A more detailed look into Brazil’s equity range shows that the categories of approaches
that are focusing on responsibility as well as on a mix of responsibility, capability, and need define the
lower ends of the equity ranges, for both 2030 and 2050. However, for 2030, these categories represent
a broad range of emissions reductions covering – especially for 1.5°C limit – almost the whole range
described above. This is explained mainly by the big differences behind the various considered studies
in the share of Brazil’s historical responsibility and capability to mitigate depending on the underlying
metrics, starting points, and weights given to each factor.

Staged approaches, as well as approaches focusing on equal cumulative emissions per capita, lead to
less stringent emission reductions and define the upper end of the full equity range for Brazil, both in
2030 and 2050. These approaches, in particular the equal cumulative emissions per capita, have a
much narrower range due to convergence of the main underlying assumptions behind the studies
considered (population projections in this case).

1.5 Political context

1.5.1 General disposition of the country towards climate policy
In the past years, political and economic crises have polarized climate discourses in Brazilian politics,
moving the country closer to a type of all or nothing binarism. Advancements of climate policy under the
Labour Party were labelled as ideologically leftist, to be fought back by the market-aligned right. The
national narrative was further fuelled and legitimised by international factors, such as policies put forward
by Donald Trump in the United States, in particular his announcement to withdraw from the Paris
Agreement. The most recent presidential elections in 2018 won by Jair Bolsonaro have moved Brazil
farther away from raising its climate ambition and from fulfilling its commitments under the Paris
Agreement. Victory of his allied or aligned parties in 15 out 27 states in Brazil, including São Paulo,
Minas Gerais, Rio de Janeiro, and Amazonas, also point to a general disengagement from climate
ambition at the subnational level (Vilela, 2018).

The agricultural lobby has funded parliamentarians and re-forged a consensus on the inherently “leftist”
character of environmental preservation. This has forced even more centrist parties to minimise or drop
altogether mentions of the fight against deforestation, which plays a pivotal role in the country’s
emissions and in the decarbonisation, plans laid out in the Brazilian NDC. The agricultural caucus has
been a strong supporter of president Bolsonaro, who signalled alignment with the lobby’s anti-climate
agendas throughout his campaign. Brazilian NGOs, Observatório do Clima, identifies the “Bolsonaro
effect” as one of the causes for the 36% increase in deforestation rates during the presidential election
campaign, between June and September 2018, owing to the legitimation Bolsonaro provided to loggers
when he was the candidate ahead of the polls (Observatório do Clima, 2018).

The central role of agriculture in the Brazilian economy has granted the “agriculture caucus” the ability
to form the second largest coordinated legislative group in National Congress, with wide representation
in the national and state legislatives (Kadanus, 2018). The group responds to demands by the
agricultural lobby, which generally opposes preservation efforts brought forth by environmentalists and
indigenists. International pressure, national public opinion, and fear of commercial reprisals to Brazilian
exports, including agricultural commodities, led the then candidate Bolsonaro to shift his core narrative.
Ahead of elections, he announced he would no longer defend the Brazilian withdrawal from the Paris
Agreement (Deutsche Welle, 2018). These three forces together, particularly the international threat to
the rural lobby’s interests, should remain decisive for curtailing blatantly anti-climate policies of

   NewClimate Institute | October 2019                                                                      3
Assessment of the potentials to increase emissions reduction targets by the major GHGs

Bolsonaro’s administration. An example of the international pressure in the making was clearly visible
in French president’s Macron opposition to the trade deal between the EU and Mercosur in reaction to
the massive forest fires in August 2019 (Politico, 2019). Soon after, Bolsonaro announced sending
military to tackle Amazon fires (DW, 2019a).

Nonetheless, while the levels of deforestation have been decreasing since 2016, since May 2019 this
increase accelerated significantly with 2,072 km2 of the Amazon forest cut down only in June 2019
(INPE, 2019b). This is more than a quarter of the total deforestation that took place in 2018 – already a
year with the highest levels of deforestation since 2012 (PRODES, 2019).

Extraction of oil and gas in Brazil is heavily subsidized. Direct subsidies to extraction of fossil fuels
amounted to USD 4.9 billion in 2015, through tax exemptions and direct spending by public bodies (ODI,
2015). In December 2017, the government approved a new tax waiver to oil and gas production up to
2040. That could sum up to BRL 40 billion per year (approximately USD 11 billion) if only the recently
discovered pre-salt reserves are considered (Lima, 2017).

Renewables have a privileged role in Brazilian climate politics, with all of the candidates of the most
recent presidential election vowing to promote renewable sources of energy if elected. Economics
explain a big part of this consensus. Even though coal generation was controversially allowed to
participate in the energy auction (A6) in August 2018, due to the national coal lobby, not a single coal
unit was contracted. In fact, out of the 2.1 GW contracted, 1.25 GW or 60% of the total went to wind
energy installations, with the average price of BRL 90,45 ($24,27) per MWh (Costa, 2018). A fifth of the
remaining capacity went to hydroelectric power plants and 1.36% to biomass. The only contracted
energy from fossil fuel came from a single gas power plant which represented 17.3% of the total at a
price of BRL 179.98 ($48,29) per MWh.

1.5.2 Relevant political processes in the foreseeable future
After the general elections in 2018, the next presidential, gubernatorial and congressional elections are
scheduled to take place on the first Sunday in October 2022. Should none of the presidential candidates
reach 50% majority, the second round of elections will be held on the last Sunday of that month. The
congressional elections will lead to electing one third of the 81 Senators and all members of the Chamber
of Deputies. In the meantime, one could expect comparatively stable government accompanied with
protests against the Bolsonaro’s radical policies.

1.5.3 Prospects for a review and increase of the national climate ambition
The prospects for increasing the level of national ambition is rather bleak. Bolsonaro’s response to the
international critique of a significant increase in deforestation was either indifference (in reaction to
German threat to cut funding for forest and biodiversity projects in Brazil) or counteraccusations (towards
Norway accusing it for “sponsoring the killing of whales” with misleading pictures) (DW, 2019b;
France24, 2019a). The fact that – as described earlier - Bolsonaro decided to take action against the
forest fires following the threat of President Macron’s opposition to the free trade agreement between
Mercosur and the EU, shows that international pressure seemingly can only work if there is a potential
for a negative impact on Brazil’s agricultural sector that could benefit significantly from exports to the
EU (France24, 2019b). But, while reducing the damage, it can hardly be expected that international
pressure will lead the Brazilian government to increase the level of ambition in the area of climate action.

Brazil’s emissions will rather be shaped by such factors as the increasing demand for soybeans by
China resulting from US-China trade war, the price of oil, which determines the rationale for the
extraction of new oil and gas fields, and the solution of the dispute between Petrobras and the Brazilian
government over contract that specified the details of extracting a big part of the resources (Bloomberg,
2019b, 2019a). The continuous fall in the costs of renewables may, on the other hand, further decrease
the chances of fossil fuels in the energy auctions.

   NewClimate Institute | October 2019                                                                     4
Assessment of the potentials to increase emissions reduction targets by the major GHGs

1.5.4 Civil society
Climate awareness is generally high in Brazil, but it is not followed directly by higher levels of
engagement. According to the Pew Research Center’s survey from early 2019, 72% of Brazilians
perceived climate change as a major threat to their country – the highest share, ahead even of the
condition of global economy (Poushter and Huang, 2019). Inversely, a survey on the implementation of
the sustainable development goals in 2017 showed that only 3% of Brazilians felt eager to contribute to
fighting climate change (United Nations Brazil, 2018).

The 2018 elections showed that although they were aware of the problems, climate and environmental
concerns were not sufficient to influence the votes of the majority of Brazilians. During campaigns,
president elect Jair Bolsonaro signalized opposition to the Paris Agreement, to the reduction of
greenhouse gas emissions, to the maintenance of protected areas, to the protection of indigenous
communities and traditional black communities, to ensuring environmental licensing, and to cutting fossil
fuel subsidies (Vialli, 2018). An August 2019 survey reported that 53.7% of Brazilians presently criticised
Bolsonaro’s presidential performance, and 93.5% feel that preserving the environment is very important
to them (CNT&MDA, 2019).The conflict resulting from this opposition has made the country a place
where many environmentalists are killed every year, with 57 deaths in 2017 or roughly 28% of the total
in the world (Global Witness, 2018). Unlike agriculture, forestry, and land use, the energy sector in Brazil
tends to be less polarized, for good and for bad. The fact that over 61% of all cargo in the country was
transported by road in August 2018, against less than 21% by railroad and 14% by water (CNT, 2018),
means that fuel prices have a big impact on the price of basic products such as food, influencing inflation
and poor households. Measures to reduce the government’s artificial control over fuel prices, and
instead leave it to fluctuate according to international markets, led to a mass 10-day strike by truck
drivers, paralysing roads and creating food shortages all over the country in May 2018 (Phillips and
Cowie, 2018).

One of the major climate-focused NGOs in Brazil is Observatório do Clima. Comprised of many civil
organizations, Observatório do Clima is committed to promoting transparent, inclusive public
engagement within climate change dialogues in Brazil. Founded in 2002, the group's primary objectives
concerns protecting Brazil's existing forest assets from deforestation, creating a forum focused on public
climate interest, and promoting an environment-centred cultural shift. In its long participation in the fight
against climate change, it has conducted research, monitored and publicized federal climate action, and
maintained its core mission of supporting an increase in climate action (Observatório do Clima, 2019).

An important role in voicing concern about the impact of climate change on the Amazon rainforest is
played by organizations representing indigenous groups. Since 1989 the action of Indigenous
organizations has been coordinated by the Coordination of the Indigenous Organizations of the Brazilian
Amazon (COIAB), representing 75 organizations and 160 indigenous communities populated by
430.000 people. It has repeatedly criticized government’s actions towards some of these communities
as “arrogant and disrespectful”. COIAB has also blamed the forest fires in August 2019 on the “anti-
indigenous and anti-environmental discourse” spread by the Bolsonaro’s administration (COIAB, 2019a,
2019b). Indigenous communities were also organizing protests calling Bolsonaro’s environmental
policies “genocidal” (The Globe Post, 2019).

1.5.5 Potential NDC review process and historical precedent
While Bolsonaro backed down on his initial plans to leave the Paris Agreement, one cannot expect a
significant increase in the level of ambition of Brazil’s NDC. Such expectations are further weakened by
the increasing discrepancy between the existing NDC and the emissions trends, resulting especially
from the accelerating deforestation.

Should such an increase in the level of ambition nonetheless take place, it may take the form of a
conditional pledge, made dependent on substantial external funding.

   NewClimate Institute | October 2019                                                                      5
Assessment of the potentials to increase emissions reduction targets by the major GHGs

2 Canada

2.1 Introduction
Implementing the policies necessary to meet Canada’s current NDC goals appears politically infeasible
at present, making a political commitment to even more challenging goals seem improbable. However,
Canada’s history highlights a separation between the political feasibility of setting ambitious goals and
enacting the policies that achieve them—securing a higher target may be a possibility, but it would be
under a high risk of not being met, save for a change in politics.

Both equity and least-cost based approaches indicate that a stronger target is necessary for a globally
cost-efficient and fair distribution of efforts to limit temperature increase to 1.5°C. Both approaches
foresee significant emission reductions for 2030. In 2050, least-cost approaches suggest emissions
decreasing by almost 100%, while equity-based approaches indicate the need for negative emissions
allowances (negative physical emissions or support of other countries’ mitigation efforts).

                                                                     2030                                                                                 2050
                                        50%                                                                                              50%
Relative change compared to 2005 [%]

                                                                                                 Relative change compared to 2005 [%]

                                         0%                                                                                               0%

                                        -50%                                                                                             -50%

                                       -100%                                                                                            -100%

                                       -150%                                                                                            -150%

                                       -200%                                                                                            -200%
                                                 Current     NDC      Equity  Least-cost                                                          Current Long-term   Equity  Least-cost
                                                  policy           based range range                                                               policy   target based range range
                                               projections                                                                                      projections

Figure 6: Canada – Relative change in GHG emissions excl. LULUCF compared to base year for
equity and cost-based approaches
Notes: Current policy projections, NDC and equity-based emissions reduction ranges from Climate Action
Tracker—equity range from 2018 (December update), other data from (2019 April update). Legend: For equity-
based range: orange (upper range) is >2°C consistent, yellow (middle range) is 2°C consistent, green (low range)
is 1.5°C consistent. For least-cost range: lower limit for 1.5°C, upper limit for 2°C.

2.2 Socio-economic                                                       context           for                                          greenhouse               gas     emissions
    reductions
Canada is the second largest country in the world in terms of land area. It is sparsely populated for its
size with 37 million residents, a fifth of which are immigrants. The Canadian populace enjoys a fairly
high standard of living. Canadian GDP stands at 1.7 trillion USD and represents an export-oriented
economy. Canada is rich in valuable natural resources, including natural gas and petroleum, which form
a significant part of the Canadian economy and exports. The United States is Canada’s largest trade
partner and importer of Canadian oil. The Canadian economy has grown moderately in the last years.
The IMF foresees a slight slowdown in GDP growth in 2019 to 1.5 per cent due to slowing global growth
and low export rate (IMF, 2019a).

                                       NewClimate Institute | October 2019                                                                                                                 6
You can also read