Greenness of Stimulus Index - July 2021 An assessment of COVID-19 stimulus by G20 countries and other major economies in relation to climate ...

 
CONTINUE READING
Greenness of Stimulus Index - July 2021 An assessment of COVID-19 stimulus by G20 countries and other major economies in relation to climate ...
July 2021

Greenness
of Stimulus
Index
An assessment of COVID-19 stimulus
by G20 countries and other major economies
in relation to climate action and biodiversity goals
Greenness of Stimulus Index - July 2021 An assessment of COVID-19 stimulus by G20 countries and other major economies in relation to climate ...
Greenness
of Stimulus
Index
The Greenness of Stimulus Index (GSI) assesses the
effectiveness of the COVID-19 stimulus efforts by
G20 countries and ten other nations in ensuring an
economic recovery that takes advantage of
sustainable growth opportunities, and builds
resilience through the protection of the climate
and biodiversity.

It provides a method to gauge the current impact of
the COVID-19 responses, to track countries’ progress
over time, and to identify and recommend measures
for improving the effectiveness of those responses.

This assessment represents the final GSI update in
its current form. The policies in this release are
current as of 30 June 2021. The previous release
was published in February 2021.

As the exceptional social support and stimulus
spending from COVID-19 winds down and increas-
ingly merges with regular government budgeting,
this note concludes the GSI series that has appraised
the economic stimulus responses to the pandemic.
Moving forward, we will be expanding our focus of
work to more broadly bring transparency to public
finance and support governments to make public
spending nature-positive and climate-positive.

If you have any questions or comments, please
contact us at stimulus@vivideconomics.com
Greenness of Stimulus Index - July 2021 An assessment of COVID-19 stimulus by G20 countries and other major economies in relation to climate ...
New to
this release
This update of the index incorporates significant         Concluding observations regarding
new information that has become available since           all stimulus released to date include:
the previous release in February 2021, including the
latest announcements on stimulus flows, deregula-         • Many countries made efforts to steer at least
tion and environmental policies. It also contains a       some of their stimulus spending toward green
special feature that examines the EU’s National           ends despite a very heavy focus on short-term
Resilience and Recovery Plans (NRRPs), which are          ‘emergency’ spending. In absolute terms, over
the centrepiece of the bloc’s integrated COVID-19         US$1.8 trillion went to green stimulus, as compared
recovery spending.                                        to roughly US$650 billion (inflation-adjusted)
                                                          in response to the 2008 financial crisis.
Highlights in this edition include:
                                                          • Only Canada and parts of Europe oriented
• An increase in the total quantity of measured           their stimulus in a way that significantly shifted
stimulus to US$17.2 trillion from US$14.9 trillion        their trajectory, thanks to a concerted effort
in February. This increase is driven by the United        from early on in the crisis.
States’ US$1.9 trillion American Rescue Plan Act.
There were also increases in stimulus packages in         • Other large economies like the US, China and
the United Kingdom (US$89 billion), Italy (US$87          India have not to date managed to fundamentally
billion), Germany (US$71 billion), Indonesia              reorient their trajectory, despite channelling some
(US$48 billion), and Japan (US$45 billion).               stimulus toward a longer-term green
                                                          and resilient transition.
• Improvements to 17 countries’ index scores and
decreases in ten countries’ scores. Norway has            • In many other emerging markets – such as Indo-
dramatically improved, while Colombia, South              nesia, Mexico, the Philippines and Russia – stimulus
Africa and the United States also leveraged greener       has not taken on a significant green orientation,
policies resulting in a net increase in their scores.     and in many cases has only further reinforced
Denmark’s score fell the furthest, but it still remains   high-carbon and low resilience economic activities.
the overall leader by a significant margin.
                                                          • Across the board, nature and biodiversity were
• Major new analysis that disaggregates ‘greenness’       almost entirely ignored. Even in Europe’s NRRPs,
into impacts upon climate and impacts upon nature.        it appears that a greater proportion of spending
Assessment of the €500 billion of National Resil-         damages nature than enhances it. The situation
ience and Recovery Plan (NRRP) stimulus across            is even bleaker in the other countries examined.
ten European countries illustrates the importance
of distinguishing between climate and nature,
and uncovers a major missed opportunity to invest
in a nature-positive recovery. A greater proportion
of spending damages nature than enhances it, and
the NRRPs largely fail to capitalise on the outsized
jobs, economic and emissions benefits that
nature-based solutions deliver.
Greenness of Stimulus Index - July 2021 An assessment of COVID-19 stimulus by G20 countries and other major economies in relation to climate ...
The United States’ $1.9 trillion American Rescue
                                                         Plan does not specifically target climate change
                                                         and biodiversity issues, but contains several
                                                         measures that result in an increase in the United
                                                         States’ index score, including $30 billion invest-
                                                         ment in public transport, upgrades to water and
                                                         sewer systems, and projects to improve energy
                                                         efficiency. The United States’ score remains
                                                         negative, however, which shows that further,
                                                         greener legislation and ambitious regulatory
                                                         action needs to be coupled with an ever bigger
                                                         low carbon investment package to move to
                                                         a positive score.

Executive
                                                         Emerging economies most dependent on environ-
                                                         mentally intensive sectors and without strong
                                                         regulatory oversight had the biggest task to turn

summary
                                                         their stimulus green, and have so far failed to do so.
                                                         The worst-performing countries – Russia, Turkey,
                                                         Saudi Arabia, Indonesia, Mexico, the Philippines
                                                         and Argentina – have made little attempt to divert
                                                         stimulus towards green initiatives. Their stimulus
                                                         packages have exacerbated the poor underlying
Announced stimulus to date will have a net               environmental performance of their economies,
negative environmental impact in 15 of the G20           pushing environmentally damaging outcomes, by
countries and economies, and in five of the ten          supporting high-carbon industry and energy, and
other analysed countries. To date, the economic          unsustainable agriculture that destroys biodiverse
response to the COVID-19 crisis will reinforce           habitats. A scattering of new climate policies,
negative environmental trends overall. Despite           investments in sustainable cities, and support for
many positive examples of green stimulus, most           electric vehicles had marginal positive impacts,
governments have not used the COVID-19 stimulus          but other action (like cuts in tax on petrol vehi-
to transform their economic trajectory in a way          cles and reduced regulation) pushed in the
that enhances nature or responds to climate              opposite direction. Brazil, Colombia and South
change at the scale required. There is, however,         Africa made somewhat greater efforts at green
an opportunity to learn from what countries have         stimulus, but like China and India, fell short of
done to date, and to move subsequent public              significantly turning their around their previous
finance decisions toward preventing continued            trajectory. To manage the COVID-19 crisis while
damage to nature and to lower dramatically               protecting and rebuilding nature at the same time,
the cost of protecting the planet.                       these countries would need to better hardwire
                                                         environmental actions into their public spending
The world’s three most populous countries –              and regulatory measures.
China, India and US – improved their GSI scores
over time, but still remain in the negative overall.     Overall, only Canada and parts of Europe oriented
China’s improvements were driven by the launch           their stimulus in a way that significantly shifted
of the world’s largest carbon market, 2025 and           their trajectory, thanks to a concerted effort from
2030 emission reduction targets, and the phase           early on in the crisis. Denmark and Canada made
out of fossil fuel-only vehicles by 2035. India’s        the largest overall efforts to reorient their economies
score is bolstered by clean energy investments           through the stimulus spending, with the European
though ongoing support for coal continues to             Commission’s spending, and national-level stimulus
hamper its score. Nevertheless, these positive           packages in the UK, France, Germany, Finland, Spain
trends were outweighed by larger volumes of              and Sweden achieving strongly positive outcomes.
stimulus that reinforced existing dirtier trajectories   Other more advanced economies – such as Japan,
– neither country managed to find definitive             South Korea, Italy and Australia – made some efforts
stimulus measures that supported the transforma-         but did not manage to achieve a transformational
tion of their environmentally intensive sectors.         shift through their stimulus.

                                                                                          Greenness
                                                                                         of Stimulus               4
                                                                                               Index
Greenness of Stimulus Index - July 2021 An assessment of COVID-19 stimulus by G20 countries and other major economies in relation to climate ...
Even among leading countries, nature and                                     New appraisal methodologies and governance
biodiversity have been particularly neglected.                               processes are needed to ensure that public
Where large green stimulus measures have been                                spending is nature-positive. Policy practitioners
introduced, these have largely focused on reduc-                             have a lot of experience assessing the impact of
ing carbon emissions, with only occasional atten-                            policies on greenhouse gas emissions, but the
tion to preserving and enhancing nature and                                  capability to appraise impacts upon nature are
natural capital. The outcome of more nature-nega-                            significantly less developed. There is a need and
tive than nature-positive spending was even found                            an opportunity to develop a nature-focused
in the EU National Resilience ad Recovery Plans                              budgeting approach that directly links public
(NRRPs). Given the risks associated with degraded                            finance to nature impacts. The approach must
natural capital – including the virus spillover risk                         enable government decision-makers to connect
driving the current pandemic – it is hard to justify                         policy levers with nature impacts, and make
the scant attention paid to nature protection.                               transparent the effects upon nature of finance
Fewer than ten of the economies analysed have                                decisions. Climate resilience and nature resilience
invested in so-called nature-based solutions                                 go hand-in-hand, and the NRRPs’ strong focus on
(NBS), such as tree planting, forest protection                              climate change shows that without the right tools
and regenerative agriculture.                                                to measure the nature impacts of spending even
                                                                             so-called ‘green’ public finance risks missing
A special feature on the EU National Resilience                              the bigger, holistic environmental picture.
and Recovery Plans (NRRPs) illustrates the
importance of assessing the impact of spending                               Across announcements to date, a clear set
upon climate and nature separately. While 37%                                of tools has emerged to boost the economy in
of the €672.5 billion Recovery and Resilience                                the short- and long-term, while also accelerating
Facility was required to be invested in green                                the transition to a more sustainable future.
initiatives, our analysis1 of ten country plans                              These tools are familiar: attaching green condi-
representing €500 billion showed that the plans                              tions to bailouts, investing in nature-based
did more harm than good for nature, as outlined in                           solutions, providing loans and grants for green
this edition’s special feature. We extended the GSI                          investments, providing tax breaks or subsidies for
methodology to distinguish between climate and                               green products and R&D, removing subsidies for
nature impacts, and found that 98% of climate-rel-                           polluters, reinforcing environmental regulation,
evant spending would reduce emissions, but more                              avoiding deregulation, and creating an enabling
than half of nature-relevant spending was harmful                            environment and fiscal framework that redirects
to nature. Moreover, a major imbalance between                               investment away from environmentally damaging
the size of spending affecting nature and climate                            activities and towards those that support a
significantly disadvantaged nature, and failed to                            sustainable transition. To enable a more sustaina-
holistically address the environmental ambitions                             ble long-run economic transition, greater action
of the recovery package set out by the European                              is needed now on these priorities, with global
Commission. Those countries assessed invested                                alignment to ensure both rich and poor countries
only 1% in nature-based solutions, and in so doing                           can pursue climate-compatible and nature-
missed a triple-win opportunity to deliver outsized                          -positive developments.
benefits for jobs and the economy, emission
reductions, and enhanced nature and biodiversity.                            The Greenness of Stimulus Index (GSI) has
                                                                             assessed the environmental impact of US$17.2
                                                                             trillion of economic stimulus from 30 countries
                                                                             since the start of COVID-19. Understanding the
                                                                             environmental impact of public spending is critical
                                                                             to help governments connect spending decisions
                                                                             to climate and nature outcomes. The GSI has
                                                                             informed the global conversation on COVID-19
                                                                             stimulus spending to date. Long-run impact
                                                                             requires a similar approach to help governments
                                                                             assess and improve public finance on an ongoing
                                                                             basis in relation to both climate and nature.

1
    Vivid Economics. (2021). Fund Nature, Fund the Future. https://www.vivideconomics.com/wp-content/uploads/2021/06/Fund-Nature-Fund-the-Future.pdf

                                                                                                                       Greenness
                                                                                                                      of Stimulus                      5
                                                                                                                            Index
Greenness of Stimulus Index - July 2021 An assessment of COVID-19 stimulus by G20 countries and other major economies in relation to climate ...
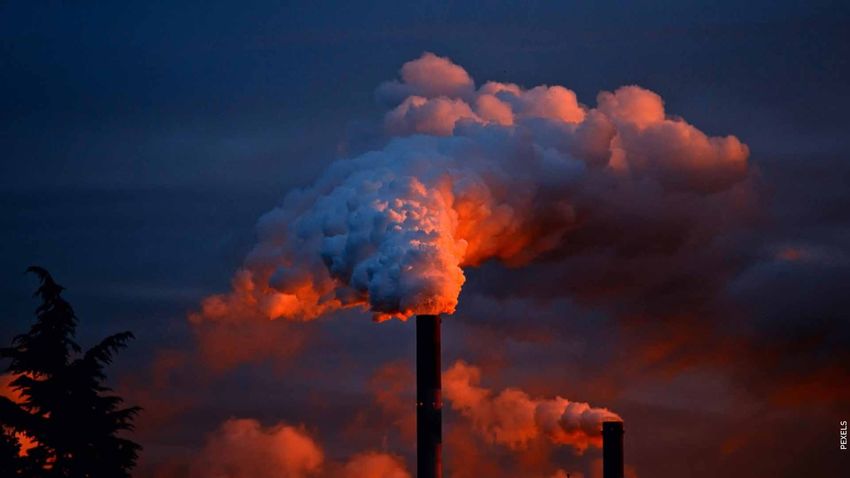
Figure 1                                               Greenness of Stimulus Index
100

 80

 60

 40

 20

  0

                                                                                                                                                                                                          Switzerland

                                                                                                                                                                                                                                  Germany

                                                                                                                                                                                                                                                             France

                                                                                                                                                                                                                                                                      UK

                                                                                                                                                                                                                                                                                                 Denmark
                                                                                                                                                                                                                                                                                    Commission
                                                                                                                                                                                                                                                     Spain
                                                                                                                                                                                                                                            Sweden

                                                                                                                                                                                                                                                                                     European
-20

                                                                                                                                                                                                  Italy
                                                                                                                                                                        Japan

                                                                                                                                                                                                                        Finland
-40

                                                                                                                                                                                      Australia
                                                                                                                                    Brazil

                                                                                                                                                                South
                                                                                                                                                                Korea
                                                                                                                                             Colombia
-60
                                                                                                                           Africa
                                                                                                                           South

                                                                                                                                                                                                                                                                           Canada
                                                                                                                                                                                USA
                                                                                                                Iceland
                                                                          Mexico

                                                                                   Argentina
                                                              Indonesia

-80
                                       Arabia

                                                                                                       Norway
                                       Saudi
                          Singapore

                                                Philippines

                                                                                               China
                 Turkey

                                                                                                                                                        India

-100
        Russia

                                      Positive Contribution                                                               Negative Contribution                                 Index

       Source: Vivid Economics using a variety of sources, consult Annex II for the entire list of sources
       Note: Updated on 30 June 2021

                                                                                                                                                                                                                                                                                           Greenness
                                                                                                                                                                                                                                                                                          of Stimulus      6
                                                                                                                                                                                                                                                                                                Index
Greenness of Stimulus Index - July 2021 An assessment of COVID-19 stimulus by G20 countries and other major economies in relation to climate ...
Announced
                                               Stimulus Packages
                                               The world has witnessed unprecedented government financial interventions in response to COVID-19.
                                               Stimulus packages announced to date include a range of fiscal mechanisms such as bailouts and loans.
                                               For the countries that we have analysed, current stimulus packages vary from US$2 billion (Iceland) to
                                               US$5.8 trillion (the United States).

                                               Figure 2                           Announced COVID-19 response
                                                                                  fiscal stimulus package
                                       6.000
Total Fiscal Stimulus (US$ Billions)

                                       5.000

                                       4.000

                                       3.000

                                       2.000

                                       1.000

                                          -

                                                                                                                                                                                                           a
                                                SA

                                                          n

                                                                 y

                                                                         on

                                                                              K

                                                                                      na

                                                                                            ly

                                                                                                   ce

                                                                                                             a

                                                                                                                  n

                                                                                                                            a

                                                                                                                                      a

                                                                                                                                                    l

                                                                                                                                                  ia

                                                                                                                                                            a

                                                                                                                                                                  a

                                                                                                                                                                          y

                                                                                                                                                                                    e

                                                                                                                                                                                                       nd

                                                                                                                                                                                                        en

                                                                                                                                                                                                           k

                                                                                                                                                                                                           a

                                                                                                                                                                                                           a

                                                                                                                                                                                                          d

                                                                                                                                                                                                        co

                                                                                                                                                                                                          a

                                                                                                                                                                                                          y

                                                                                                                                                                                                         es

                                                                                                                                                                                                          d
                                                                                                                                                 zi

                                                                                                                                                                                                      bi
                                                                                                                                                                        ke

                                                                                                                                                                                  or

                                                                                                                                                                                                      ar

                                                                                                                                                                                                        a
                                                               an

                                                                                                            ad

                                                                                                                        di

                                                                                                                                   re

                                                                                                                                                          si

                                                                                                                                                                  si

                                                                                                                                                                                                         c

                                                                                                                                                                                                      bi

                                                                                                                                                                                                     tin
                                                      pa

                                                                                                                  ai

                                                                                                                                                                                                     an

                                                                                                                                                                                                     an
                                                                              U

                                                                                                                                               al
                                                                                           Ita

                                                                                                                                              ra

                                                                                                                                                                                                     in
                                                                                                                                                                                                     w
                                                                                                   an

                                                                                                                                                                                                       i
                                                                                  hi

                                                                                                                                                                                                      i
                                                                                                                                                                                                   ed
                                                                         ni

                                                                                                                                                                                                    la
                                                                                                                                                        us

                                                                                                                                                                 ne

                                                                                                                                                                                                    fr
                                               U

                                                                                                                                                                                                 om
                                                                                                                 Sp

                                                                                                                                                                                                  ex
                                                                                                                       In

                                                                                                                                                                                                   ra
                                                                                                                                Ko

                                                                                                                                                                                                   m
                                                                                                                                                                              ap
                                                                                                                                             tr

                                                                                                                                                                         r
                                                              m

                                                                                                        an
                                                     Ja

                                                                                                                                                                                                  nl

                                                                                                                                                                                                  el
                                                                                                                                                                                                 en

                                                                                                                                                                                                 pp
                                                                                                                                                                                                 or
                                                                                                                                            B
                                                                                  C

                                                                                                                                                                      Tu

                                                                                                                                                                                      er
                                                                     U

                                                                                                                                                                                                  A
                                                                                                 Fr

                                                                                                                                                                                              Sw
                                                                                                                                                        R
                                                                                                                                           us

                                                                                                                                                                                              iA
                                                                                                                                                                                              en
                                                                                                                                                             do

                                                                                                                                                                                               M

                                                                                                                                                                                               Ic
                                                           er

                                                                                                                                                                                               Fi
                                                                                                                                                                             ng
                                                                                                        C

                                                                                                                                                                                              N

                                                                                                                                                                                              ol
                                                                                                                                                                                             rg
                                                                                                                                                                                   itz
                                                                                                                             h
                                                                     n

                                                                                                                                                                                              h

                                                                                                                                                                                             ili
                                                                                                                                          A

                                                                                                                                                                                            D
                                                          G

                                                                                                                            ut
                                                                  ea

                                                                                                                                                                                           ud
                                                                                                                                                            In

                                                                                                                                                                                           ut

                                                                                                                                                                                            C
                                                                                                                                                                                          Ph
                                                                                                                                                                                           A
                                                                                                                                                                         Si

                                                                                                                                                                                  Sw
                                                                                                                       So

                                                                                                                                                                                        So
                                                                 p

                                                                                                                                                                                        Sa
                                                              ro
                                                           Eu

                                               Source: Vivid Economics using IMF COVID-19 response tracker and other sources.
                                               Note: Light green represents G20 countries and dark green represents countries outside of the G20. Updated on 30 June 2021.

                                               Governments have rightly put people first in                                                                     Meanwhile, green infrastructure projects such as
                                               the immediate aftermath of the crisis – putting                                                                  tree planting are shovel-ready, easily scaled, and
                                               money directly into people’s pockets, and                                                                        provide overwhelmingly local, socially distanced
                                               helping those on the frontline. Specifically, they                                                               jobs at various skill levels.
                                               have sought to secure employment; provide
                                               cash benefits to workers, households and the                                                                     Some US$4.8 trillion of the announced stimulus
                                               unemployed; and supply liquidity to businesses                                                                   to date, or 28% of the total, will flow into envi-
                                               across economies.                                                                                                ronmentally intensive sectors that impact climate
                                                                                                                                                                change, biodiversity or local air quality.2
                                               At the same time, governments have the oppor-                                                                    This massive funding can both address the COV-
                                               tunity to use this massive stimulus to shift course                                                              ID-19 crisis, by improving public health, job securi-
                                               towards a cleaner, greener, safer and fairer                                                                     ty and fiscal stability, and boost environmental
                                               economy, to create jobs and start to reverse                                                                     sustainability. Transport and industry are two
                                               climate change and restore nature. For example,                                                                  sectors that have been hit hard by the crisis, are
                                               investment in clean energy and transport is                                                                      receiving substantial government support, and
                                               preferable to supporting fossil fuel assets that are                                                             also have a large environmental impact, where
                                               likely to be stranded in the near term as a result                                                               economic stimulus can be directed towards
                                               of climate action including rising carbon prices.                                                                clean energy and low carbon development.

                                                2
                                                 In defining the amount of stimulus flowing through to sectors with a high environmental impact,                                                 Greenness
                                                                                                                                                                                                of Stimulus
                                                the index has removed any measures which are purely devised to provide income support to workers
                                                (e.g. furlough or paycheck protection programmes). In some cases, insufficient information was available.                                                               7
                                                                                                                                                                                                      Index
Greenness of Stimulus Index - July 2021 An assessment of COVID-19 stimulus by G20 countries and other major economies in relation to climate ...
Figure 3            Sum of global fiscal stimulus policies
                    of countries considered in our analysis

                                        $4.8
                                        trillion                                 Environmentally
                                                                                 relevant stimulus

         $12.4                                                                   Non-environmentally
         trillion                                                                relevant stimulus

                                     Agriculture, industry, waste,
                                     energy and transport are the
                                     sectors considered to have
                                     most environmental relevance.
                                     This categorisation is based
                                     on environmental outcomes
                                     including carbon emissions.

Source: Vivid Economics using a variety of sources
Note: Agriculture includes forestry and fisheries. Industry includes manufacturing. Updated on 30 June 2021.

                                                                                              Greenness
                                                                                             of Stimulus       8
                                                                                                   Index
Greenness of Stimulus Index - July 2021 An assessment of COVID-19 stimulus by G20 countries and other major economies in relation to climate ...
The sectoral breakdown of environmentally relevant stimulus shows that industry gets the most
support from governments, among these five sectors, followed by transport and energy.
This breakdown has remained relatively constant over time, and reflects the relative sizes of the sectors
and the COVID-19 crisis impact.

                    Breakdown of environmentally relevant stimulus
Figure 4            of the 30 countries tracked (EU not included)

Source: Vivid Economics
Note: For developing countries, support for energy and waste is included within industry. The European Union
is excluded from this chart. Singapore and the Philippines are omitted due to sizing constraints. Updated 30 June 2021.

                                                                                              Greenness
                                                                                             of Stimulus                  9
                                                                                                   Index
Greenness of Stimulus Index - July 2021 An assessment of COVID-19 stimulus by G20 countries and other major economies in relation to climate ...
Green Stimulus Toolkit:
Archetypal Green Measures
Hundreds of policies have been announced worldwide, but only some deliver both environmental
and economic benefits. Below is a toolkit of measures that governments can use to shape the future
environmental impact of their economic stimulus for the better, based on analysis of actual measures
announced to date (more details are provided in Annex I).

• Corporate bailouts with green strings attached:      the cost of adoption upfront by expanding
Some governments view bailouts as public invest-       cash-for-clunker programmes, and ratcheting
ments that deliver public benefits. While these        up or extending the period of funds available for
bailouts must clearly deliver immediate benefits in    rebates on EVs. Other transport sector subsidies
terms of stability of public services, employment      could cover electric bicycles, regular bicycles and
and supply chains, they can also secure a transition   public mass transit passes. In the energy sector,
to sustainable and resilient growth. Bailouts can      rebates or subsidies can be made available to
achieve this by making public support contingent       households that install solar panels or choose
upon implementing specific environmental improve-      to purchase electricity from a renewable energy
ments to operations and procurement, such as           provider, including tariff adjustments, coverage
reducing their carbon and biodiversity footprint,      of capital cost, or income-qualifying eligibility for
or by committing to high-integrity environmental       residential solar. In the industry sector, products
offsets, enhanced nature-related financial disclo-     which meet voluntary performance standards
sures, and increased supply chain transparency.        could be made eligible for tax rebates, including
The agreements with Austrian Airlines and Air          home appliances and lighting.
France demonstrate how governments and corpo-          • Green R&D subsidies: Government green
rations can meet on common ground.                     R&D subsidies are most prevalent in the transport
• Investment in nature-based solutions and             and energy sectors, to boost innovation in electric
sustainable agriculture: Land use investments –        vehicle development and deployment, electric
such as afforestation of degraded land, sustaina-      batteries, hydrogen vehicles, and low-carbon
ble agricultural practices, wildfire prevention        fuel alternatives. Government grants to research
infrastructure, urban greening infrastructure like     institutions or private R&D firms in the energy
parks, and efficient water irrigation systems – are    sector include investments in solar, wind, battery
ideally suited to tackle the ongoing crisis because    storage, and hydrogen technologies. R&D subsi-
they can be shovel-ready, are transitional, provide    dies to industry and agriculture include grant
stimulus to particularly vulnerable and local          funding for the development of low-water use
populations, and are resilient to future lockdowns,    and drought resistance crops, as well as carbon
i.e. can be socially distanced.                        capture and storage (CCS) and energy efficiency
• Loans and grants for green investments:              technologies in chemicals, cement, and steel.
Direct investment, in the form of loans or grants,     • Reinforcing environmental regulation and
can be made to improve sustainable agriculture;        avoiding deregulation: Although not a traditional
build low-carbon energy including solar, wind,         stimulus measure, regulation and deregulation
biofuels and hydrogen; in energy efficient retrofits   have been a focus area for the COVID-19 response.
in the construction sector; and in active transport    Environmental deregulation has been used as a
infrastructure or electric vehicle infrastructure      stimulus measure in some countries, on the basis
in the transport sector.                               that this relieves regulatory burdens for business-
• Subsidies or tax reductions for green products:      es. However, others have reinforced environmental
Tax reductions or rebates are available most           regulation, for example introducing wildlife trading
broadly across countries in the transport sector,      bans, and proposing to expand the coverage
for example to boost electric vehicle (EV) adop-       of the EU Emissions Trading Scheme (EU ETS)
tion by offering consumer refunds, or subsidising      to other sectors.

The country notes in Annex II include a tracker of the positive and negative archetype policies that
each country has implemented so far. These both highlight the key drivers of a country’s index score,
and identify gaps in current measures that can be used to pave the way for future stimulus measures.

                                                                                       Greenness
                                                                                      of Stimulus              10
                                                                                            Index
The Greenness
of Stimulus
Index
The Greenness of Stimulus Index examines 30 economies to assess the environmental orientation of
their stimulus funding based on:

   the total stimulus            the existing green orienta-           the green
   funds flowing into            tion of those sectors, such           orientation of
   environmentally               as the share of renewables            new stimulus
   intensive sectors;            in the energy sector; and             measures.

To date, much of this stimulus funding is set to       Where targeted efforts have attempted to steer
flow into existing sectors with little attempt to      funding, these have more often tilted towards
look forward and support their medium- and             environmentally damaging outcomes, although
long-term sustainability and resilience. There is      a few have added green incentives. The most
therefore significant scope for governments to         notable examples of COVID-19 response measures
pivot towards a green recovery.                        that target environmentally intensive sectors
                                                       include significant deregulation, subsidies or tax
In countries with inadequate existing climate and      cuts to activities likely to worsen environmental
biodiversity policies, stimulus flows are likely to    outcomes, including large bailouts for the aviation
reinforce unsustainable trajectories of high           sector. Fewer efforts have been made to improve
emissions and loss of nature. All countries have       environmental sustainability, particularly in the
entered this crisis with large sectors of their        initial COVID-19 rescue response. Where govern-
economies still producing significant greenhouse       ments have looked to support green initiatives,
gas emissions, air and water pollution, and causing    they have tended to do so through infrastructure
loss of biodiversity. Many countries also lack         investments, particularly in the energy and
concrete policies to facilitate a green transition     transport sectors. We find that three of the G20
in those sectors. As a result, current stimulus into   economies have no green aspect to their stimulus
those sectors risks reinforcing a status quo that is   at all, namely Saudi Arabia, Russia and South Africa.
significantly tilted toward negative environmental
outcomes, amplifying risks to people and planet        Overall, we note that the greenness of stimulus
in the near- and long-term.                            is improving slightly over time, especially in
                                                       developed countries. The United States, Canada,
                                                       China, Norway and India achieved substantial
                                                       improvements in their index scores since the index
                                                       began, with the United Kingdom, Australia, Brazil,
                                                       Italy and Japan achieving modest improvements
                                                       (see Figure 9). While most countries are yet to
                                                       take the opportunity to use their stimulus packag-
                                                       es to kick-start green recoveries, some countries
                                                       made significant green announcements since the
                                                       last GSI edition, resulting in substantial changes
                                                       in index scores.

                                                                                         Greenness
                                                                                        of Stimulus            11
                                                                                              Index
Greenness of Stimulus Index:
       Figure 5                                             G20 economies plus the Nordic countries,
                                                            Colombia, Switzerland, Spain, Singapore and the Philippines

100

 80

 60

 40

 20

  0

                                                                                                                                                                                                        Switzerland

                                                                                                                                                                                                                                Germany

                                                                                                                                                                                                                                                            France

                                                                                                                                                                                                                                                                     UK

                                                                                                                                                                                                                                                                                                  Denmark
                                                                                                                                                                                                                                                                                    Commission
                                                                                                                                                                                                                                                    Spain
                                                                                                                                                                                                                                           Sweden

                                                                                                                                                                                                                                                                                     European
-20

                                                                                                                                                                                                Italy
                                                                                                                                                                      Japan

                                                                                                                                                                                                                      Finland
-40

                                                                                                                                                                                    Australia
                                                                                                                                 Brazil

                                                                                                                                                             South
                                                                                                                                                             Korea
                                                                                                                                          Colombia

-60
                                                                                                                        Africa
                                                                                                                        South

                                                                                                                                                                                                                                                                           Canada
                                                                                                                                                                              USA
                                                                                                              Iceland
                                                                        Mexico

                                                                                 Argentina
                                                            Indonesia

-80
                                     Arabia

                                                                                                     Norway
                                     Saudi
                         Singapore

                                              Philippines

                                                                                             China
                Turkey

                                                                                                                                                     India

-100
       Russia

                                                                                 Positive Contribution                                                               Negative Contribution                                                Index

                         CHN          IDN     USA           RUS         IND      MEX         ZAF     BRA      AUS       CAN      ITA      JAP        SPA      KOR     GER     GBR   FRA          EU     SGP           PHL       ARG        CHE      COL      FIN     NOR   DEN          ISL       SWE

   Agriculture

   Energy

   Industry

   Transport

   Waste

   Agriculture

   Energy

   Industry

   Transport

   Waste

       Source: Vivid Economics using a variety of sources. Consult Annex II for the entire list of sources.
       Note: Updated on 30 June 2021.

       Drilling down into individual countries, while the United States’ score significantly improved following
       the US$900 billion December 2020 stimulus package, Biden’s Executive Order and the US$1.9 trillion
       March 2021 American Rescue Plan, its score remains negative, meaning that its stimulus continues to do
       more harm than good. December’s green stimulus measures included US$14 billion for public transit, over
       US$10 billion in nuclear power, US$7 billion in clean energy and solar solutions, US$6.7 billion in carbon
       capture technologies and US$1.7 billion in building efficiency improvements. But US$17 billion in uncondi-
       tional support for airlines and airports, plus environmental deregulation and unconditional support
       payments to the private sector interacted with the country’s negative baseline and weakened the bill’s
       impact. While the American Rescue Plan flows largely to non-environmentally relevant sectors, it does
       provide significant funds for public transportation but also sets aside US$11 billion for airports and
       aviation manufacturers, which mitigates its positive impact.

                                                                                                                                                                                                                                           Greenness
                                                                                                                                                                                                                                          of Stimulus                                            12
                                                                                                                                                                                                                                                Index
China’s score improved due to the launch of their                         measures, including substantial support for electric
                              carbon market for the power sector and ambi-                              vehicles and EV infrastructure, a decision to ban
                              tious 2030 and 2025 climate targets, but its                              trading of specific wildlife species, and support for
                              overall negative score means that its stimulus                            China’s Green Development Fund. China has also
                              does more harm than good, and sends negative                              supported building renovation, and announced
                              signals across developing countries in Asia and                           substantial support for railway infrastructure
                              further afield, not least through its ‘Belt and                           investment. Most recently, the country has set more
                              Road Initiative’. China has a relatively poor                             precise targets and commitments for 2025 and
                              environmental performance baseline, which means                           2030 to achieve net zero by 2060. In January 2021,
                              its stimulus efforts will largely reinforce a negative                    China launched the world’s largest carbon market
                              trajectory unless concerted effort is made to avoid                       for the power sector. While these investments and
                              this. In response to COVID-19, the government                             policies are a promising attempt by the Chinese
                              relaxed environmental reporting in key sectors                            government to divert stimulus towards green
                              such as transport and industry, streamlined                               investments and stimulate a green transition, much
                              permits for coal mining, and extended subsidies                           further action is required to overcome the negative
                              for fossil fuel vehicles. The government has,                             impact of unconditional stimulus support to China’s
                              however, introduced a number of positive                                  existing, environmentally intensive industries.

                                                           GSI score and total size of fiscal stimulus:
                              Figure 8                     G20 economies plus Spain, Philippines and Singapore
                              100

                              80

                                         Denmark
                              60
Greenness of Stimulus Index

                                                         Canada                              European Comission
                              40                                  France

                                        Sweden                               UK
                                                         Spain
                              20
                                        Finland                                               Germany
                                         Switerland
                              0
                                        Australia
                                                          500        Italy     1000        1500             2000           2500          3000             6000
                                                      South Korea                                                                         Japan
                                                                                                                                                    USA
                              -20      Colombia
                                                     India
                                       South    Brazil
                                       Africa
                                        Norway
                              -40    Iceland
                                     Argentina
                                                                       China
                                     Indonesia
                              -60          Mexico
                                     Philippines
                                         Singapore
                              -80        Turkey
                                     Saudi Arabia

                                          Russia
                              -100
                                                                                  Quantity of Stimulus (US$ Billions)

                              Source: Vivid Economics using IMF Policy Tracker and other sources
                              Note: Updated on 30 June 2021.

                              India’s overall stimulus has supported a lot of both positive and negative measures, highlighting the
                              need to find measures that support the transformation of existing polluting industries rather than their
                              business-as-usual trajectory. India announced roughly US$1.3 billion to support a hydropower project,
                              as well as parking space reservation standards for EV charging points. Other announcements included
                              support for battery development and solar energy, rail initiatives as well as some funding for afforestation.
                              But India continues to be hostage to fossil fuels, with fresh investment for coal mining and oil refineries
                              projects and a large proportion of total stimulus directed at environmentally intensive industries.
                              A reduction in the stringency of environmental monitoring and the approval of environmentally
                              harmful projects further undermines a green recovery.

                                                                                                                                                                 13
Indonesia and Brazil are major agricultural commodity               to steer new funding towards ‘green’ initiatives, preferring
producers with a track record of lax environmental policies         more polluting energy companies, and failing to apply
causing significant forest degradation, and negative                environmental conditions to such support. For example,
biodiversity and ecosystem impacts. Their agriculture               since the last update, Turkey extended lease contracts
sectors remain on a trajectory of high emissions intensity,         and cancellation of lease payments for airport facilities.
and significant habitat and biodiversity destruction. Since         Saudi Arabia sees a small increase in score in this edition,
the last update, Brazil held a large electricity auction with       however, by supporting a net-zero Red Sea tourism
11 lots offered. Since renewables make up the majority of           project, which exemplifies green growth opportunities.
the electricity supply in Brazil, this policy contributed to a
improvement in Brazil’s score in this edition, strengthened         Italy, Australia, and Japan have slightly negative GSI
by the country’s announcement of US$80 million in loan for          scores, although recent activities have improved the
the construction of new wind farms. But the score remains           scores of all three countries. Australia announced a broad
negative, in part because Brazil has historically struggled         suite of relatively small policies around electric vehicles,
to enforce forest and land use policies, a situation worsened       renewable energy, energy efficiency and hydrogen produc-
under its COVID-19 response as a result of a Presidential           tion. Most recently, however, the country provided US$200
decree relaxing land use permits and enforcement. Indonesia         million in support to major airlines. The country still sees an
too initially loosened its permitting restrictions for timber       increase in score in this edition thanks to a large energy
producers, but has since reversed this measure. Most recently,      deal for the development of hydrogen and carbon capture
Indonesia has earmarked US$200 million to cut car sales             and storage (CCS). Italy is supporting public transit and
tax in 2021. Given the predominance of internal combustion          subsidies for efficient vehicles. Japan’s package in Decem-
engine (ICE) vehicles on the Indonesian market, this                ber 2020 funded clean tech innovation, solar PV deploy-
decreased Indonesia’s score. Other measures include the             ment, digitalisation and zero-emissions vehicle subsidies,
passing of an omnibus bill that critics warn caters to industrial   though directed significant funding to the business-as-usu-
and resource development at the expense of the environ-             al economy. These three countries benefit from a better
ment, including recentralising permitting, limiting public          historical (pre-COVID-19) environmental performance than
participation in environmental assessments, and scrapping           some G20 economies, but are still channelling funds into
some environmental permitting altogether. This adds to other        polluting activities. They are yet to take robust measures to
laws deregulating the mining industry, and subsidising              ensure that their stimulus will boost the long-term sustain-
state-owned oil and gas and electricity companies and               ability and resilience of their economies. More specifically,
airlines. While Indonesia’s 2021 infrastructure budget says         the recent stimulus packages passed by both Italy (US$87
it will support sustainable, labour-intensive infrastructure        billion) and Japan (US$45 billion) provide general relief to
developments, the overall impact on the environment is unclear.     businesses and individuals without mainstreaming green
                                                                    growth throughout the measures.
Russia, Mexico and South Africa are major fossil fuel
energy producers, and their response to COVID-19 has                Canada, the United Kingdom and France have consist-
reinforced their historical negative environmental                  ently introduced green packages and attached ‘green’
performance. Russia relies heavily on its oil and gas               conditions to bailouts of environmentally intensive
sector for exports and overall economic output, and its             industries, steadily raising their scores and landing them
response to COVID-19 has supported the sector further.              in third, fourth and fifth position respectively . Canada’s
Removing tax relief on fossil fuel extraction and refining          score improved dramatically in the previous update,
pushed its score up slightly, though this measure is                second only to the United States. Canada announced a
intended to raise revenues rather than reduce emissions.            wide-ranging Healthy Environment and Healthy Economy
Russia continues to subsidise energy and industry without           Plan that covered energy efficiency, low- and zero-emis-
green conditions or targeted low carbon investments,                sion transport, clean energy transition, low carbon agricul-
resulting in a very low GSI ranking. The recent approval            ture and nature initiatives. Together with the Fall Economic
of a carbon neutrality roadmap for Sakhalin, however,               Statement, Canada has gone from a negative GSI score in
contributes towards a small increase in score in this               October 2020 to third place, ranking just behind the
edition. Mexico has previously announced energy sector              European Union. This demonstrates that strong environ-
funding with unconditional support for the refining                 mental stimulus measures can overcome even poor
industry and various polluting energy and transport                 underlying baseline performance. Since the last update,
infrastructure projects. South Africa deferred carbon tax           Canada further pledged more than US$12 billion over five
payments and relaxed environmental regulations in earlier           years for public transport. However, it also provided
measures, but has also made pledges to develop renewa-              significant funding for airport and airline support, which
ble energy, a strategic move in a country that has faced            contributed to a slight decrease in score in this edition.
frequent energy shortages. Most recently, the country               Similarly, the United Kingdom also recently passed a mix
unveiled some liquified natural gas (LNG) emergency                 of transport policies including investment in rail and public
projects but also launched a new bid window for the                 transport but also froze fuel duty. Combined with invest-
procurement of new wind and solar infrastructure.                   ment to boost energy efficiency, the balance of policies,
                                                                    contrary to Canada, resulted in small increase in the United
Similarly, Argentina, Saudi Arabia and Turkey are direct-           Kingdom’s score in this edition. France announced it will
ing a significant proportion of their stimulus packages             progressively exclude guarantees to projects involving
towards polluting industries. All three have a poor baseline        dirty forms of oil and gas in the years 2021 to 2035,
environmental performance, and have made little attempt             contributing to a very small increase in score in this edition.
Figure 9                                      Current and first release (24th April 2020) GSI scores

                              100

                               80

                               60
Greenness of Stimulus Index

                               40

                               20

                                                                                                                                  KOR

                                                                                                                                               USA

                                                                                                                                                     AUS
                                                                                                                                         JAP

                                                                                                                                                                                         SPA
                                                                                                                            IND

                                                                                                                                                           ITA

                                                                                                                                                                                                                EU
                                0

                                                                                                                                                                                   SWE
                                                                                             NOR

                                                                                                                                                                                                                     DEN
                                                                                                                                                                                                          CAN
                                                                                                                      COL
                                                                                                   ICE
                                     RUS

                                           TUR

                                                   SGP

                                                         SAU

                                                               PHL

                                                                     IDN

                                                                           MEX

                                                                                 ARG

                                                                                       CHN

                                                                                                         ZAF

                                                                                                               BRA

                                                                                                                                                                             GER

                                                                                                                                                                                               FRA
                                                                                                                                                                 SWI

                                                                                                                                                                                                     UK
                                                                                                                                                                       FIN
                              -20

                              -40

                              -60

                              -80
                                                                                                                     Current GSI score         First GSI score

                              -100

      Source: Vivid Economics
      Note: Since the GSI’s first release in April 2020, the methodology for calculating a country’s underlying environmental impact
      has been refined. This chart applies this updated methodology to calculate the current and initial GSI scores. 30 June 2021.
                                                                                                                                                                                                           Greenness
                                                                                                                                                                                                          of Stimulus      15
                                                                                                                                                                                                                Index
Germany, South Korea and Spain have also                                               programmes which support, for example, energy
implemented specific green projects, but have                                          efficiency in agricultural holdings and energy
not moved much recently. Germany’s score                                               diversification for businesses. In May 2021, the
marginally increases in this edition, as the country                                   Spanish Parliament also approved legislation on
signed a declaration of intent to cooperate on                                         climate change and energy transition, which will
green hydrogen with Saudi Arabia. It had previ-                                        give a legal basis to the country’s climate and
ously announced a tax on fuels for heating and                                         energy transition commitments, contributing
gas, which built on its earlier stimulus package                                       positively to Spain’s index score in this update.
worth around US$45 billion for a variety of
measures to support the green transition, particu-                                     The European Union’s stimulus package
larly in the energy and transport sectors. South                                       moved forward with the submission of all
Korea’s score is stable following the announce-                                        National Resilience and Recovery Plans, which
ment of the ‘New Deal’ in the summer of 2020,                                          Vivid Economics studied in depth and describe
which included substantial funding for electric and                                    in the special feature below. Since the NRRPs
hydrogen vehicles, renewable energy and energy                                         have yet not been approved by the European
efficiency over the next five years. The US$63                                         Commission, their impact is not included in the
billion in green funding was equivalent to 19% of                                      GSI scores shown in this edition. The spending is
the country’s total stimulus. Spain, however, sees                                     assessed only in the special feature below and is
a slightly more noticeable change in score in this                                     disaggregated into climate and nature impacts.
edition. The country announced a variety of

                       Can’t see the wood nor the trees: Nature is largely ignored
Box 1
                       in the EU National Resilience and Recovery Plans
The EU National Resilience and Recovery Plans                                         Vivid Economics assessed ten NRRPs using the
(NRRPs) are the centrepiece of the bloc’s                                             GSI approach and extended the methodology
integrated stimulus response and are meant to                                         to capture differential impacts upon both
help the EU build back better. The NRRPs aim to                                       nature and climate. The GSI model normally
mitigate the economic and social impact of the                                        considers the aggregate environmental impact
COVID-19 pandemic. They outline how the €672.5                                        of each stimulus measure, meaning that spend-
billion3 Resilience and Recovery Facility (RRF) will                                  ing is classified as environmentally helpful or
be invested to build a more sustainable, cohesive                                     harmful, despite potentially disparate impacts
and competitive Europe-wide economy. They                                             between nature and climate. When analysing
require Member States to dedicate specific                                            the NRRPs, however, another layer of granularity
proportions of the NRRP’s value to advance                                            was added to differentiate between spending
different EU priorities, including spending at                                        that impacts upon nature, spending that impacts
least 37% on climate and environment and 20%                                          upon climate, or spending that affects both
on digital transformation.                                                            nature and climate.

3
    €672.5 billion in 2018 prices. This breaks down into €312.5 billion in grants and €360 billion in loans.

                                                                                                                      Greenness
                                                                                                                     of Stimulus           16
                                                                                                                           Index
We found that climate-positive investments              • Some measures are good for both,
outweigh nature-positive investments by a               like reforestation, which sequesters
factor of 6, while nature-negative investments          carbon and generates habitats.
outweigh climate-negative investments by a              • Some measures are bad for both, like road
factor of 9. Figure 10 shows the proportion of          building, which increases transport emissions
positive and negative spending that affects only        and divides habitats.
climate (e.g. electric vehicles or home insulation)     • Some measures have a mixed impact, like hydroe-
and only nature (e.g. wastewater treatment or           lectric dams and biofuels, which reduce emissions
wildlife protection). It also shows spending            but harm ecosystems. Most measures with a mixed
affecting both climate and nature:                      impact were climate-positive and nature-negative.

From the investments across ten NRRPs affecting the energy, transport, industry, waste and
agriculture sectors, 98% of climate-relevant spending (€240 billion) will reduce emissions, while
only 46% of nature-relevant spending (€40 billion) will strengthen nature. This means that the majority
of nature-relevant spending – €47 billion – is likely to damage nature and biodiversity, showing
a disproportionate neglect of nature.

            Breakdown of NRRPs by investment into measures
Figure 10
            positively and negatively affecting climate, nature or both

             Nature                              Climate                            Both

                                    Positive          Negative      Mixed

These investments translate into strong GSI scores for climate but poor GSI scores for nature,
which illustrates the importance of distinguishing between the two. The average climate score of
75 is significantly stronger than typical stimulus tracked through the GSI. The nature score, however,
averages just 5. This means that, despite hundreds of billions of euros being invested through the NRRPs,
nature will see only marginal benefits, and in four of the 10 countries studied, it will be damaged.
The green dots in the figure below show the mixed index score, which averages a healthy 54, but
fails to capture the particular neglect of nature nor lopsided spending between climate- and
nature-relevant investments.

                                                                                     Greenness
                                                                                    of Stimulus             17
                                                                                          Index
Accounting for unbalanced spending between climate- and nature-relevant investments reduces the
average allocation-adjusted GSI score to -7 and shows a lack of holistic coherence in the NRRPs. Invest-
ments that benefit nature and climate are both crucial since they are mutually reinforcing. Healthy
ecosystems mitigate emissions, and a stable climate supports biodiversity, whereas negative impacts
upon either one harms the other. We therefore considered the balance of spending between investments
that impact upon climate and those that impact upon nature using a 50:50 split as the optimal allocation.
Adjusting the GSI scores to account for balance saw the final allocation-adjusted GSI score fall to -7, with
all NRRPs heavily disfavouring nature-relevant spending.

Figure 11                     Positive and negative contributions and index scores

    120

    100

    80

    60

    40

    20

     0

    -20

    -40

    -60
           Climate

                                        Climate

                                                                   Climate

                                                                                              Climate

                                                                                                                         Climate

                                                                                                                                                    Climate

                                                                                                                                                                                Climate

                                                                                                                                                                                                           Climate

                                                                                                                                                                                                                                      Climate

                                                                                                                                                                                                                                                                 Climate
                     Nature
                               Mixed

                                                  Nature
                                                           Mixed

                                                                             Nature
                                                                                      Mixed

                                                                                                        Nature
                                                                                                                 Mixed

                                                                                                                                   Nature
                                                                                                                                            Mixed

                                                                                                                                                               Nature
                                                                                                                                                                        Mixed

                                                                                                                                                                                          Nature
                                                                                                                                                                                                   Mixed

                                                                                                                                                                                                                     Nature
                                                                                                                                                                                                                              Mixed

                                                                                                                                                                                                                                                Nature
                                                                                                                                                                                                                                                         Mixed

                                                                                                                                                                                                                                                                           Nature
                                                                                                                                                                                                                                                                                    Mixed
             Bulgaria                    Germany Slovenia                                        Greece                   Portugal                            Italy              Slovakia                      Poland                     France                       Spain

                                       Positive Contribution                                            Negative Contribution                                              Index                           Allocation-adjusted

We also assessed the impact of investment in nature-based solutions (NBS) and found that they
delivered outsized returns in terms of jobs, economic activity and emission reductions, yet comprised
only 1% of total spending. NBS are particularly effective stimulus measures by delivering impact early,
when battered economies are most in need of a boost. In the first year of implementation, NBS deliver
an average of 60% of both their lifetime jobs and economic impact (gross value-added, or GVA), com-
pared to less than 40% of lifetime jobs and GVA in the first year of a set of typical NRRP investments.4
They also deliver more economic activity over their lifetime on average and competitive returns for jobs.
Regarding climate benefits, NBS are the only interventions that reduce emissions in absolute terms,
by removing carbon dioxide from the atmosphere, storing and sequestering it.

4
  The reference set of investments was modelled as a proxy for other measures in the NRRPs and includes housing, green roofing retrofits, green window retrofits, rooftop solar,
electric cars, electric buses, electric vehicle infrastructure, mining, roads, and rail.

                                                                                                                                                                                                                                       Greenness
                                                                                                                                                                                                                                      of Stimulus                                           18
                                                                                                                                                                                                                                            Index
Breakdown of NRRPs by investment into measures
Figure 12
                positively and negatively affecting climate, nature or both

         Reforestation                                                                Rail
                                                                                   Roads
Residential Rooftop...                                        Residential Rooftops Solar
                                                                                  Mining
                Roads                                                      Reforestation
                                                                   Wetland Restoration
                                                                             Eletric Cars
              Housing
                                                                                Housing
                                                                     Parks and Gardens
         Agroforestry
                                                                    Green Retrofitting...
                                                                           Eletric Buses
 Green Retrofitting...                                              Green Retrofitting...
                                                                       EV Infrastructure
    EV Infrastructure                                                       Agroforestry

                         0       20            40           60                               0           1             2               3
                               Jobs per million EUR                                                GVA per Euro Investment

 Years    0-1    1-2     2-3   3-5    5 - 10   10 - 15    15 - 20   Years    0-1    1-2      2-3   3-5       5 - 10   10 - 15      15 - 20

    Average Jobs                 Year 1             Total               Average GVA                    Year 1               Total
    NBS Basket                       22              36                 NBS Basket                       1.02                   1.76
    Alternative Basket               16              41                 Alternative Basket               0.62                   1.65

As the world transitions from COVID-19 stimulus efforts towards regular budgeting, this analysis demon-
strates the need for a rigorous appraisal of the impact of public finance upon both nature and climate.
The NRRPs are governed by the Do No Significant Harm principal, which calls for spending to have no
negative environmental impact. Our analysis shows that the NRRPs are largely successful in avoiding
negative impacts upon the climate but leave much to be desired when it comes to nature. Practitioners
have decades of experience assessing the single metric of carbon emissions, whereas the multifarious
amalgam that represents nature is harder to measure. New methods that define, assess and make
transparent both the nature and climate impacts of public spending are needed.

Source: Vivid Economics. (2021). Fund Nature, Fund the Future.
https://www.vivideconomics.com/wp-content/uploads/2021/06/Fund-Nature-Fund-the-Future.pdf

 While the COVID-19 pandemic is not over, the stimulus response appears to be tapering, and the
 lessons learned about the environmental impact of public finance must be applied to future spending.
 As the GSI series concludes, we acknowledge that the index has provided governments and institutions
 with a means to measure the impact of spending choices upon the environment, and with information
 about how they might achieve a climate and nature positive recovery. Such approaches are critical to
 ensuring that public finance not only protects but also enhances nature, biodiversity and the climate
 on an ongoing basis. We will continue working with governments, institutions and civil society to
 analyse spending and link it to effects on climate and nature, improving the impact of public finance
 and in doing so, actively building the long-term health, sustainability, and resilience of society.

                                                                                                      Greenness
                                                                                                     of Stimulus                           19
                                                                                                           Index
Annex I
Methodology
The index is constructed by combining the flow                                   Two components of the stimulus were analysed:
of stimulus into five key sectors with an indicator                              the size of the fiscal flow (F value) to each
of each sector’s environmental impact, the latter                                environmentally intensive sector, and the overall
accounting for both historical trends and specific                               impact of that stimulus on climate and environ-
measures taken under the country’s stimulus.                                     ment (B value).
The impact indicator assigns a greenness value
(positive or negative) to each sector for every                                  • B is a scaled indicator from -1 to 1 which rates
country based on the methodology discussed                                       sectors by level of overall greenness from most
below. The overall GSI is an indicator of the total                              pro-environmental at 1 to least environmental at
fiscal spending in response to COVID-19 catego-                                  -1. The B value differentiates between underly-
rised as either a positive or negative impact on                                 ing sector context (b1) and specific environmen-
the environment. The final index for each country                                tal measures (b2). b1 refers to our baseline
is an average of sectoral impact, normalised to a                                evaluation of each country using ‘off the shelf’
scale of -1 to 1. The five sectors are chosen for their                          environmental indicators.6 This captures the
historical impact on climate and environment:                                    country’s underlying environmental performance.
agriculture, energy, industry, waste and transport.                              This includes an evaluation of its rating on
                                                                                 multiple environmental performance indicators,
An estimated 30% of overall total G20 stimulus                                   and the overall country’s climate target progres-
funding will flow through these sectors.5 Despite                                sion. b2 is a consideration of any COVID-19
some targeted stimulus measures to support                                       response-specific data we have found that either
environmental improvements, overall flows into                                   supports or undermines the baseline value.
these sectors of interest remain harmful because                                 It takes a negative value if stimulus support
of their historical performance. To date, a relatively                           boosts harmful activities without regard to
small magnitude of stimulus measures contain                                     environmental targets or deregulates to roll back
clear pro-environmental conditions. A majority                                   environmental conditions. It takes a positive value
of fiscal stimulus measures currently passed and                                 if stimulus support advances pro-environmental
likely to flow to environmentally intensive sectors                              programmes or includes conditions on environ-
do not have an explicit focus on climate change                                  mental performance (for more information on
and environmental goals.                                                         composition of b2, see further on in this Annex).
                                                                                 Both quantified stimulus measures (e.g. an
                                                                                 amount of funding designated for a certain
                                                                                 project) and unquantified stimulus measures
                                                                                 (e.g. rollbacks of environmental regulations that
                                                                                 would theoretically reduce compliance costs for
                                                                                 firms) can contribute to b2 values (see specific
                                                                                 b2 section below for more detail).

                                                                                 • Each environment-specific stimulus measure
                                                                                 is categorised against positive and negative
                                                                                 archetype interventions. Table 1 and Table 2
                                                                                 describe these policy archetypes respectively.

 5
   This figure comes from totalling all fiscal spending by countries in our analysis and categorising the flows by sector. This value is the percentage of
 estimated and actual flows going into the above environmentally-relevant sectors across all countries in our analysis. Our estimate is above recently
 published work, including Hepburn et. al’s estimate of 8% of total funding having either a positive or negative environmental impact. [Hepburn, C.
 O’Callaghan, B., Stern, N., Stiglitz, J., Zenghelis, D. (2020). Will COVID-19 fiscal recovery packages accelerate or retard progress on climate change?
 Oxford Smith School of Enterprise and the Environment, Working Paper No. 20-02 ISSN 2732-4214]. We believe our figure is larger given our analysis
 is only of recovery stimulus and not long-term fiscal measures that may be introduced in the medium- and long-term.
 6
   Key indicators used for the construction of baseline performance are the Climate Action Tracker (https://climateactiontracker.org/countries/),
 Environmental Performance Index (https://epi.yale.edu/), and Germanwatch Climate Change Performance Index (https://germanwatch.org/en/CCPI).

                                                                                                                                Greenness
                                                                                                                               of Stimulus                   20
                                                                                                                                     Index
Table 1       Summary of positive policy archetypes

Sector           Archetype                      Description

                  Bailouts with green strings   Requiring limits to emissions or waste in return for
                  attached                      direct funding.

                  Nature-based solutions        Afforestation and reforestation programmes, restora-
Agriculture                                     tion of wetlands, or forest management investments.

                  Loan and grants for green     Direct loans or tax rebates and subsidies, e.g. for
                  investments                   high-efficiency water irrigation systems.

                  Conservation and wildlife     Making the sale of endangered animals illegal.
                  protection programmes

                  Bailouts with green strings   Direct loans and guarantees for oil, gas and coal with
                  attached                      commitments for improvement on emissions or
                                                energy efficiency.

                  Loan and grants for green     Direct investment in the form of loans or grants
Energy                                          towards renewable energy including solar, wind,
                  investments
                                                biofuels and hydrogen.

                  Green R&D subsidies           Grants for research institutes, academic institutes,
                                                and private firms to develop new renewable energy
                                                technologies and systems.

                  Subsidies or tax reductions   Extending tax rebates to households for rooftop solar,
                  for green products            or making green energy products including utility tariffs
                                                with renewable targets available at a subsidised cost.

                  Bailouts with green strings   Conditions on firms relating to emissions, pollution,
                  attached                      supply chain requirements, or compliance with
                                                voluntary agreements or reporting standards.

                  Loan and grants for green     Low carbon or low emissions public infrastructure
                  investments                   including CCS projects for industry, energy efficiency
                                                programmes for existing buildings, investment in the
                                                hydrogen economy and electrification of industry.

Industry          Green R&D subsidies           Direct grants or loans available to research institu-
                                                tions, academic institutions, and private firms to
                                                develop low-carbon industrial technologies such as
                                                CCS, hydrogen, and electrification.

                  Subsidies or tax reductions   Taxes for the use of primary materials in supply
                  for green products            chain, subsidies offered to firms that ensure compli-
                                                ance in their supply chains.

                                                                                 Greenness
                                                                                of Stimulus             21
                                                                                      Index
Table 1          Summary of positive policy archetypes (cont.)

Sector                   Archetype                           Description

                         Bailouts with green strings          Conditional bailouts to air carriers, car manufactur-
                         attached                             ers, or shipping for emissions reduction pledges or
                                                              commitment to use biofuel or renewable fuel stand-
                                                              ards in exchange for loans.

                         Loan and grants for green            Building public infrastructure projects including
                         investments                          cycleways, low-carbon rail or other mass transit,
                                                              public walkways, and railroads with consideration
Transport                                                     towards climate mitigation and adaptation.

                         Green R&D subsidies                  Loans or research grants available to academic
                                                              institutions, research centres, think tanks and private
                                                              firms to develop electric vehicles, hydrogen vehicles,
                                                              and low-carbon fuel alternatives for shipping,
                                                              aviation and vehicle transport.

                         Subsidies or tax reductions          Tax rebates available to consumers for EVs, subsidies
                         for green products                   for low carbon transportation including light rail,
                                                              developing HOV lanes or low-emission zones fees.

                         Bailouts with green strings          Tying bailouts to commitments to shift from waste
                         attached                             incineration to more sustainable waste management
                                                              strategies.

                         Loan and grants for green            Direct investment in recycling, Municipal Solid Waste,
                         investments                          waste-to-energy, or methane recapture on existing
                                                              facilities or new waste management facilities.

                         Green R&D subsidies                  Loans or grants for academic institutions, research
                                                              centres, think tanks, or private firms for the develop-
Waste                                                         ment of advanced waste management include
                                                              waste-to-energy and methane recapture technologies.

                         Subsidies or tax reductions          Tax reductions or rebates for recycling, composting
                         for green products                   including buy-back programmes or subsidisation of
                                                              environmental producer responsibility (EPR)
                                                              programmes.

Source: Vivid Economics
Note: Definition includes examples but may include additional and alternative programmes.

                                                                                              Greenness
                                                                                             of Stimulus              22
                                                                                                   Index
You can also read