Mitigation Pathways Compatible with 1.5 C in the Context of Sustainable Development - IPCC
←
→
Page content transcription
If your browser does not render page correctly, please read the page content below

Mitigation Pathways
    Compatible with 1.5°C
    in the Context
2   of Sustainable Development
    Coordinating Lead Authors:
    Joeri Rogelj (Belgium/Austria), Drew Shindell (USA), Kejun Jiang (China)

    Lead Authors:
    Solomone Fifita (Fiji), Piers Forster (UK), Veronika Ginzburg (Russia), Collins Handa (Kenya), Haroon
    Kheshgi (USA), Shigeki Kobayashi (Japan), Elmar Kriegler (Germany), Luis Mundaca (Sweden/Chile),
    Roland Séférian (France), Maria Virginia Vilariño (Argentina)

    Contributing Authors:
    Katherine Calvin (USA), Joana Correia de Oliveira de Portugal Pereira (UK/Portugal), Oreane
    Edelenbosch (Netherlands/Italy), Johannes Emmerling (Italy/Germany), Sabine Fuss (Germany), Thomas
    Gasser (Austria/France), Nathan Gillett (Canada), Chenmin He (China), Edgar Hertwich (USA/Austria),
    Lena Höglund-Isaksson (Austria/Sweden), Daniel Huppmann (Austria), Gunnar Luderer (Germany), Anil
    Markandya (Spain/UK), David L. McCollum (USA/Austria), Malte Meinshausen (Australia/Germany),
    Richard Millar (UK), Alexander Popp (Germany), Pallav Purohit (Austria/India), Keywan Riahi (Austria),
    Aurélien Ribes (France), Harry Saunders (Canada/USA), Christina Schädel (USA/Switzerland), Chris
    Smith (UK), Pete Smith (UK), Evelina Trutnevyte (Switzerland/Lithuania), Yang Xiu (China), Wenji Zhou
    (Austria/China), Kirsten Zickfeld (Canada/Germany)

    Chapter Scientist:
    Daniel Huppmann (Austria), Chris Smith (UK)

    Review Editors:
    Greg Flato (Canada), Jan Fuglestvedt (Norway), Rachid Mrabet (Morocco), Roberto Schaeffer (Brazil)

    This chapter should be cited as:
    Rogelj, J., D. Shindell, K. Jiang, S. Fifita, P. Forster, V. Ginzburg, C. Handa, H. Kheshgi, S. Kobayashi, E. Kriegler, L. Mundaca,
    R. Séférian, and M.V. Vilariño, 2018: Mitigation Pathways Compatible with 1.5°C in the Context of Sustainable
    Development. In: Global Warming of 1.5°C. An IPCC Special Report on the impacts of global warming of 1.5°C above
    pre-industrial levels and related global greenhouse gas emission pathways, in the context of strengthening the global
    response to the threat of climate change, sustainable development, and efforts to eradicate poverty [Masson-Delmotte,
    V., P. Zhai, H.-O. Pörtner, D. Roberts, J. Skea, P.R. Shukla, A. Pirani, W. Moufouma-Okia, C. Péan, R. Pidcock, S. Connors,
    J.B.R. Matthews, Y. Chen, X. Zhou, M.I. Gomis, E. Lonnoy, T. Maycock, M. Tignor, and T. Waterfield (eds.)]. In Press.

                                                                                                                                   93
Chapter 2                                                          Mitigation Pathways Compatible with 1.5°C in the Context of Sustainable Development

    Table of Contents
    Executive Summary......................................................................95         2.6        Knowledge Gaps............................................................157
                                                                                                          2.6.1          Geophysical Understanding........................................157
    2.1       Introduction to Mitigation Pathways and
    		        the Sustainable Development Context.....................98                                  2.6.2          Integrated Assessment Approaches.............................158

         2.1.1       Mitigation Pathways Consistent with 1.5°C..................98                        2.6.3          Carbon Dioxide Removal (CDR)...................................158

         2.1.2        The Use of Scenarios....................................................98
         2.1.3       New Scenario Information since AR5............................99
     2.1.4           Utility of Integrated Assessment Models (IAMs)                                   Frequently Asked Questions
    			              in the Context of this Report.......................................100              FAQ 2.1: What Kind of Pathways Limit Warming
                                                                                                          to 1.5°C and are we on Track?............................................159
2   2.2       Geophysical Relationships and Constraints..........101                                      FAQ 2.2: What do Energy Supply and Demand
         2.2.1       Geophysical Characteristics of Mitigation Pathways...101                             have to do with Limiting Warming to 1.5°C?......................161

         2.2.2       The Remaining 1.5°C Carbon Budget..........................104

    2.3       Overview of 1.5°C Mitigation Pathways................108                                References ....................................................................................163

         2.3.1       Range of Assumptions Underlying 1.5°C Pathways.....109
         2.3.2       Key Characteristics of 1.5°C Pathways........................112
         2.3.3       Emissions Evolution in 1.5°C Pathways.......................115
         2.3.4       CDR in 1.5°C Pathways...............................................118
         Box 2.1: Bioenergy and BECCS Deployment
         in Integrated Assessment Modelling.....................................124
         2.3.5       Implications of Near-Term Action in 1.5°C Pathways...126

    2.4 Disentangling the Whole-System
    		 Transformation...............................................................129
         2.4.1       Energy System Transformation....................................129
         2.4.2       Energy Supply..............................................................130
         2.4.3       Energy End-Use Sectors...............................................136
     2.4.4           Land-Use Transitions and Changes in
    			              the Agricultural Sector.................................................144

    2.5       Challenges, Opportunities and Co-Impacts
    		        of Transformative Mitigation Pathways.................148
         2.5.1       Policy Frameworks and Enabling Conditions...............148
         Cross-Chapter Box 5 | Economics of 1.5°C Pathways
         and the Social Cost of Carbon................................................150
     2.5.2 Economic and Investment Implications of 1.5°C
    			 Pathways.....................................................................152
     2.5.3           Sustainable Development Features
    			              of 1.5°C Pathways.......................................................156

    94
Mitigation Pathways Compatible with 1.5°C in the Context of Sustainable Development                                                              Chapter 2

Executive Summary                                                                  Limiting warming to 1.5°C depends on greenhouse gas (GHG)
                                                                                   emissions over the next decades, where lower GHG emissions in
                                                                                   2030 lead to a higher chance of keeping peak warming to 1.5°C
This chapter assesses mitigation pathways consistent with limiting                 (high confidence). Available pathways that aim for no or limited (less
warming to 1.5°C above pre-industrial levels. In doing so, it explores             than 0.1°C) overshoot of 1.5°C keep GHG emissions in 2030 to 25–30
the following key questions: What role do CO2 and non-CO2 emissions                GtCO2e yr−1 in 2030 (interquartile range). This contrasts with median
play? {2.2, 2.3, 2.4, 2.6} To what extent do 1.5°C pathways involve                estimates for current unconditional NDCs of 52–58 GtCO2e yr−1 in
overshooting and returning below 1.5°C during the 21st century? {2.2,              2030. Pathways that aim for limiting warming to 1.5°C by 2100 after
2.3} What are the implications for transitions in energy, land use and             a temporary temperature overshoot rely on large-scale deployment
sustainable development? {2.3, 2.4, 2.5} How do policy frameworks                  of carbon dioxide removal (CDR) measures, which are uncertain and
affect the ability to limit warming to 1.5°C? {2.3, 2.5} What are the              entail clear risks. In model pathways with no or limited overshoot of
associated knowledge gaps? {2.6}                                                   1.5°C, global net anthropogenic CO2 emissions decline by about 45%
                                                                                   from 2010 levels by 2030 (40–60% interquartile range), reaching net
The assessed pathways describe integrated, quantitative                            zero around 2050 (2045–2055 interquartile range). For limiting global
evolutions of all emissions over the 21st century associated                       warming to below 2°C with at least 66% probability CO2 emissions
                                                                                                                                                                2
with global energy and land use and the world economy. The                         are projected to decline by about 25% by 2030 in most pathways (10–
assessment is contingent upon available integrated assessment                      30% interquartile range) and reach net zero around 2070 (2065–2080
literature and model assumptions, and is complemented by other                     interquartile range).1 {2.2, 2.3.3, 2.3.5, 2.5.3, Cross-Chapter Boxes 6 in
studies with different scope, for example, those focusing on individual            Chapter 3 and 9 in Chapter 4, 4.3.7}
sectors. In recent years, integrated mitigation studies have improved
the characterizations of mitigation pathways. However, limitations                 Limiting warming to 1.5°C implies reaching net zero CO2
remain, as climate damages, avoided impacts, or societal co-benefits               emissions globally around 2050 and concurrent deep reductions
of the modelled transformations remain largely unaccounted for, while              in emissions of non-CO2 forcers, particularly methane (high
concurrent rapid technological changes, behavioural aspects, and                   confidence). Such mitigation pathways are characterized by energy-
uncertainties about input data present continuous challenges. (high                demand reductions, decarbonization of electricity and other fuels,
confidence) {2.1.3, 2.3, 2.5.1, 2.6, Technical Annex 2}                            electrification of energy end use, deep reductions in agricultural
                                                                                   emissions, and some form of CDR with carbon storage on land or
The Chances of Limiting Warming to 1.5°C                                           sequestration in geological reservoirs. Low energy demand and low
and the Requirements for Urgent Action                                             demand for land- and GHG-intensive consumption goods facilitate
                                                                                   limiting warming to as close as possible to 1.5°C. {2.2.2, 2.3.1, 2.3.5,
Pathways consistent with 1.5°C of warming above pre-industrial                     2.5.1, Cross-Chapter Box 9 in Chapter 4}.
levels can be identified under a range of assumptions about
economic growth, technology developments and lifestyles.                           In comparison to a 2°C limit, the transformations required to limit
However, lack of global cooperation, lack of governance of the required            warming to 1.5°C are qualitatively similar but more pronounced
energy and land transformation, and increases in resource-intensive                and rapid over the next decades (high confidence). 1.5°C implies
consumption are key impediments to achieving 1.5°C pathways.                       very ambitious, internationally cooperative policy environments that
Governance challenges have been related to scenarios with high                     transform both supply and demand (high confidence). {2.3, 2.4, 2.5}
inequality and high population growth in the 1.5°C pathway literature.
{2.3.1, 2.3.2, 2.5}                                                                Policies reflecting a high price on emissions are necessary
                                                                                   in models to achieve cost-effective 1.5°C pathways (high
Under emissions in line with current pledges under the Paris                       confidence). Other things being equal, modelling studies suggest
Agreement (known as Nationally Determined Contributions,                           the global average discounted marginal abatement costs for limiting
or NDCs), global warming is expected to surpass 1.5°C above                        warming to 1.5°C being about 3–4 times higher compared to 2°C
pre-industrial levels, even if these pledges are supplemented                      over the 21st century, with large variations across models and socio-
with very challenging increases in the scale and ambition of                       economic and policy assumptions. Carbon pricing can be imposed
mitigation after 2030 (high confidence). This increased action                     directly or implicitly by regulatory policies. Policy instruments, like
would need to achieve net zero CO2 emissions in less than 15 years.                technology policies or performance standards, can complement explicit
Even if this is achieved, temperatures would only be expected to remain            carbon pricing in specific areas. {2.5.1, 2.5.2, 4.4.5}
below the 1.5°C threshold if the actual geophysical response ends up
being towards the low end of the currently estimated uncertainty range.            Limiting warming to 1.5°C requires a marked shift in investment
Transition challenges as well as identified trade-offs can be reduced if           patterns (medium confidence). Additional annual average energy-
global emissions peak before 2030 and marked emissions reductions                  related investments for the period 2016 to 2050 in pathways limiting
compared to today are already achieved by 2030. {2.2, 2.3.5, Cross-                warming to 1.5°C compared to pathways without new climate policies
Chapter Box 11 in Chapter 4}                                                       beyond those in place today (i.e., baseline) are estimated to be around

1
    Kyoto-GHG emissions in this statement are aggregated with GWP-100 values of the IPCC Second Assessment Report.

                                                                                                                                                          95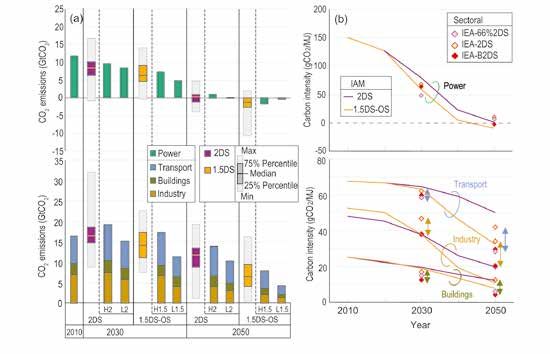
Chapter 2                                          Mitigation Pathways Compatible with 1.5°C in the Context of Sustainable Development

    830 billion USD2010 (range of 150 billion to 1700 billion USD2010            aerosol) affects carbon budgets and the certainty of pathway
    across six models). Total energy-related investments increase by about       categorizations. Some non-CO2 forcers are emitted alongside CO2,
    12% (range of 3% to 24%) in 1.5°C pathways relative to 2°C pathways.         particularly in the energy and transport sectors, and can be largely
    Average annual investment in low-carbon energy technologies and              addressed through CO2 mitigation. Others require specific measures,
    energy efficiency are upscaled by roughly a factor of six (range of factor   for example, to target agricultural nitrous oxide (N2O) and methane
    of 4 to 10) by 2050 compared to 2015, overtaking fossil investments          (CH4), some sources of black carbon, or hydrofluorocarbons (high
    globally by around 2025 (medium confidence). Uncertainties and               confidence). In many cases, non-CO2 emissions reductions are similar
    strategic mitigation portfolio choices affect the magnitude and focus        in 2°C pathways, indicating reductions near their assumed maximum
    of required investments. {2.5.2}                                             potential by integrated assessment models. Emissions of N2O and
                                                                                 NH3 increase in some pathways with strongly increased bioenergy
    Future Emissions in 1.5°C Pathways                                           demand. {2.2.2, 2.3.1, 2.4.2, 2.5.3}

    Mitigation requirements can be quantified using carbon budget                The Role of Carbon Dioxide Removal (CDR)
    approaches that relate cumulative CO2 emissions to global mean
    temperature increase. Robust physical understanding underpins                All analysed pathways limiting warming to 1.5°C with no
2
    this relationship, but uncertainties become increasingly relevant as a       or limited overshoot use CDR to some extent to neutralize
    specific temperature limit is approached. These uncertainties relate to      emissions from sources for which no mitigation measures
    the transient climate response to cumulative carbon emissions (TCRE),        have been identified and, in most cases, also to achieve
    non-CO2 emissions, radiative forcing and response, potential additional      net negative emissions to return global warming to 1.5°C
    Earth system feedbacks (such as permafrost thawing), and historical          following a peak (high confidence). The longer the delay in
    emissions and temperature. {2.2.2, 2.6.1}                                    reducing CO2 emissions towards zero, the larger the likelihood
                                                                                 of exceeding 1.5°C, and the heavier the implied reliance on
    Cumulative CO2 emissions are kept within a budget by reducing                net negative emissions after mid-century to return warming to
    global annual CO2 emissions to net zero. This assessment                     1.5°C (high confidence). The faster reduction of net CO2 emissions
    suggests a remaining budget of about 420 GtCO2 for a two-                    in 1.5°C compared to 2°C pathways is predominantly achieved by
    thirds chance of limiting warming to 1.5°C, and of about 580                 measures that result in less CO2 being produced and emitted, and
    GtCO2 for an even chance (medium confidence). The remaining                  only to a smaller degree through additional CDR. Limitations on
    carbon budget is defined here as cumulative CO2 emissions from the           the speed, scale and societal acceptability of CDR deployment also
    start of 2018 until the time of net zero global emissions for global         limit the conceivable extent of temperature overshoot. Limits to our
    warming defined as a change in global near-surface air temperatures.         understanding of how the carbon cycle responds to net negative
    Remaining budgets applicable to 2100 would be approximately                  emissions increase the uncertainty about the effectiveness of CDR to
    100 GtCO2 lower than this to account for permafrost thawing and              decline temperatures after a peak. {2.2, 2.3, 2.6, 4.3.7}
    potential methane release from wetlands in the future, and more
    thereafter. These estimates come with an additional geophysical              CDR deployed at scale is unproven, and reliance on such
    uncertainty of at least ±400 GtCO2, related to non-CO2 response              technology is a major risk in the ability to limit warming to
    and TCRE distribution. Uncertainties in the level of historic warming        1.5°C. CDR is needed less in pathways with particularly strong
    contribute ±250 GtCO2. In addition, these estimates can vary by              emphasis on energy efficiency and low demand. The scale and
    ±250 GtCO2 depending on non-CO2 mitigation strategies as found in            type of CDR deployment varies widely across 1.5°C pathways,
    available pathways. {2.2.2, 2.6.1}                                           with different consequences for achieving sustainable
                                                                                 development objectives (high confidence). Some pathways rely
    Staying within a remaining carbon budget of 580 GtCO2 implies                more on bioenergy with carbon capture and storage (BECCS), while
    that CO2 emissions reach carbon neutrality in about 30 years,                others rely more on afforestation, which are the two CDR methods
    reduced to 20 years for a 420 GtCO2 remaining carbon budget                  most often included in integrated pathways. Trade-offs with other
    (high confidence). The ±400 GtCO2 geophysical uncertainty range              sustainability objectives occur predominantly through increased land,
    surrounding a carbon budget translates into a variation of this timing       energy, water and investment demand. Bioenergy use is substantial
    of carbon neutrality of roughly ±15–20 years. If emissions do not start      in 1.5°C pathways with or without BECCS due to its multiple roles in
    declining in the next decade, the point of carbon neutrality would need      decarbonizing energy use. {2.3.1, 2.5.3, 2.6.3, 4.3.7}
    to be reached at least two decades earlier to remain within the same
    carbon budget. {2.2.2, 2.3.5}                                                Properties of Energy and Land Transitions in 1.5°C Pathways

    Non-CO2 emissions contribute to peak warming and thus                        The share of primary energy from renewables increases while
    affect the remaining carbon budget. The evolution of                         coal usage decreases across pathways limiting warming to
    methane and sulphur dioxide emissions strongly influences                    1.5°C with no or limited overshoot (high confidence). By 2050,
    the chances of limiting warming to 1.5°C. In the near-term, a                renewables (including bioenergy, hydro, wind, and solar, with direct-
    weakening of aerosol cooling would add to future warming,                    equivalence method) supply a share of 52–67% (interquartile range)
    but can be tempered by reductions in methane emissions (high                 of primary energy in 1.5°C pathways with no or limited overshoot;
    confidence). Uncertainty in radiative forcing estimates (particularly        while the share from coal decreases to 1–7% (interquartile range),

    96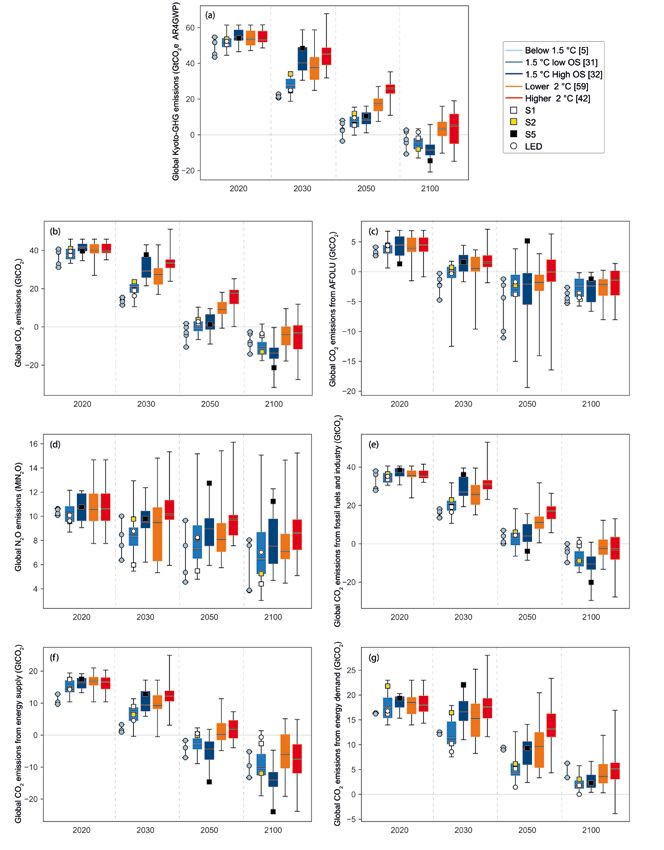
Mitigation Pathways Compatible with 1.5°C in the Context of Sustainable Development                                                 Chapter 2

with a large fraction of this coal use combined with carbon capture       Links between 1.5°C Pathways and Sustainable Development
and storage (CCS). From 2020 to 2050 the primary energy supplied
by oil declines in most pathways (−39 to −77% interquartile range).       Choices about mitigation portfolios for limiting warming to
Natural gas changes by −13% to −62% (interquartile range), but            1.5°C can positively or negatively impact the achievement of
some pathways show a marked increase albeit with widespread               other societal objectives, such as sustainable development
deployment of CCS. The overall deployment of CCS varies widely            (high confidence). In particular, demand-side and efficiency
across 1.5°C pathways with no or limited overshoot, with cumulative       measures, and lifestyle choices that limit energy, resource, and
CO2 stored through 2050 ranging from zero up to 300 GtCO2                 GHG-intensive food demand support sustainable development
(minimum–maximum range), of which zero up to 140 GtCO2 is stored          (medium confidence). Limiting warming to 1.5°C can be achieved
from biomass. Primary energy supplied by bioenergy ranges from            synergistically with poverty alleviation and improved energy security
40–310 EJ yr−1 in 2050 (minimum-maximum range), and nuclear from          and can provide large public health benefits through improved air
3–66 EJ yr−1 (minimum–maximum range). These ranges reflect both           quality, preventing millions of premature deaths. However, specific
uncertainties in technological development and strategic mitigation       mitigation measures, such as bioenergy, may result in trade-offs that
portfolio choices. {2.4.2}                                                require consideration. {2.5.1, 2.5.2, 2.5.3}
                                                                                                                                                  2
1.5°C pathways with no or limited overshoot include a rapid
decline in the carbon intensity of electricity and an increase
in electrification of energy end use (high confidence). By 2050,
the carbon intensity of electricity decreases to −92 to +11 gCO2 MJ−1
(minimum–maximum range) from about 140 gCO2 MJ−1 in 2020,
and electricity covers 34–71% (minimum–maximum range) of final
energy across 1.5°C pathways with no or limited overshoot from
about 20% in 2020. By 2050, the share of electricity supplied by
renewables increases to 59–97% (minimum-maximum range) across
1.5°C pathways with no or limited overshoot. Pathways with higher
chances of holding warming to below 1.5°C generally show a faster
decline in the carbon intensity of electricity by 2030 than pathways
that temporarily overshoot 1.5°C. {2.4.1, 2.4.2, 2.4.3}

Transitions in global and regional land use are found in all
pathways limiting global warming to 1.5°C with no or limited
overshoot, but their scale depends on the pursued mitigation
portfolio (high confidence). Pathways that limit global warming to
1.5°C with no or limited overshoot project a 4 million km2 reduction
to a 2.5 million km2 increase of non-pasture agricultural land for food
and feed crops and a 0.5–11 million km2 reduction of pasture land,
to be converted into 0-6 million km2 of agricultural land for energy
crops and a 2 million km2 reduction to 9.5 million km2 increase in
forests by 2050 relative to 2010 (medium confidence). Land-use
transitions of similar magnitude can be observed in modelled 2°C
pathways (medium confidence). Such large transitions pose profound
challenges for sustainable management of the various demands on
land for human settlements, food, livestock feed, fibre, bioenergy,
carbon storage, biodiversity and other ecosystem services (high
confidence). {2.3.4, 2.4.4}

Demand-Side Mitigation and Behavioural Changes

Demand-side measures are key elements of 1.5°C pathways.
Lifestyle choices lowering energy demand and the land- and
GHG-intensity of food consumption can further support
achievement of 1.5°C pathways (high confidence). By 2030 and
2050, all end-use sectors (including building, transport, and industry)
show marked energy demand reductions in modelled 1.5°C pathways,
comparable and beyond those projected in 2°C pathways. Sectoral
models support the scale of these reductions. {2.3.4, 2.4.3, 2.5.1}

                                                                                                                                            97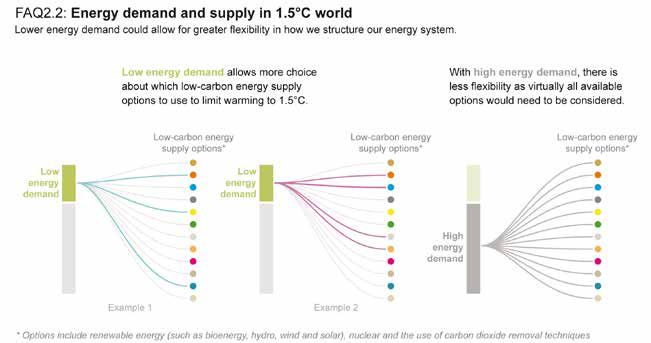
Chapter 2                                                   Mitigation Pathways Compatible with 1.5°C in the Context of Sustainable Development

    2.1          Introduction to Mitigation Pathways and                                     scenarios (Section 2.3.1). These societal choices must then be linked
                 the Sustainable Development Context                                         to the drivers of climate change, including emissions of well-mixed
                                                                                             greenhouse gases and aerosol and ozone precursors as well as land-
                                                                                             use and land-cover changes. Deliberate solar radiation modification is
    This chapter assesses the literature on mitigation pathways to limit or                  not included in these scenarios (see Cross-Chapter Box 10 in Chapter 4).
    return global mean warming to 1.5°C (relative to the pre-industrial
    base period 1850–1900). Key questions addressed are: What types of                       Plausible developments need to be anticipated in many facets of the
    mitigation pathways have been developed that could be consistent                         key sectors of energy and land use. Within energy, these scenarios
    with 1.5°C? What changes in emissions, energy and land use do they                       consider energy resources like biofuels, energy supply and conversion
    entail? What do they imply for climate policy and implementation, and                    technologies, energy consumption, and supply and end-use efficiency.
    what impacts do they have on sustainable development? In terms of                        Within land use, agricultural productivity, food demand, terrestrial
    feasibility (see Cross-Chapter Box 3 in Chapter 1), this chapter focuses                 carbon management, and biofuel production are all considered.
    on geophysical dimensions and technological and economic enabling                        Climate policies are also considered, including carbon pricing and
    factors. Social and institutional dimensions as well as additional                       technology policies such as research and development funding and
    aspects of technical feasibility are covered in Chapter 4.                               subsidies. The scenarios incorporate regional differentiation in sectoral
2
                                                                                             and policy development. The climate changes resulting from such
    Mitigation pathways are typically designed to reach a predefined                         scenarios are derived using models that typically incorporate physical
    climate target alone. Minimization of mitigation expenditures, but                       understanding of the carbon cycle and climate response derived from
    not climate-related damages or sustainable development impacts,                          complex geophysical models evaluated against observations (Sections
    is often the basis for these pathways to the desired climate target                      2.2 and 2.6).
    (see Cross-Chapter Box 5 in this chapter for additional discussion).
    However, there are interactions between mitigation and multiple other                    The temperature response to a given emission pathway (see glossary) is
    sustainable development goals (see Sections 1.1 and 5.4) that provide                    uncertain and therefore quantified in terms of a probabilistic outcome.
    both challenges and opportunities for climate action. Hence there are                    Chapter 1 assesses the climate objectives of the Paris Agreement in
    substantial efforts to evaluate the effects of the various mitigation                    terms of human-induced warming, thus excluding potential impacts
    pathways on sustainable development, focusing in particular on                           of natural forcing such as volcanic eruptions or solar output changes
    aspects for which integrated assessment models (IAMs) provide                            or unforced internal variability. Temperature responses in this chapter
    relevant information (e.g., land-use changes and biodiversity, food                      are assessed using simple geophysically based models that evaluate
    security, and air quality). More broadly, there are efforts to incorporate               the anthropogenic component of future temperature change and do
    climate change mitigation as one of multiple objectives that, in general,                not incorporate internal natural variations and are thus fit for purpose
    reflect societal concerns more completely and could potentially provide                  in the context of this assessment (Section 2.2.1). Hence a scenario
    benefits at lower costs than simultaneous single-objective policies                      that is consistent with 1.5°C may in fact lead to either a higher or
    (e.g., Clarke et al., 2014). For example, with carefully selected policies,              lower temperature change, but within quantified and generally well-
    universal energy access can be achieved while simultaneously reducing                    understood bounds (see also Chapter 1, Section 1.2.3). Consistency
    air pollution and mitigating climate change (McCollum et al., 2011;                      with avoiding a human-induced temperature change limit must
    Riahi et al., 2012; IEA, 2017d). This chapter thus presents both the                     therefore also be defined probabilistically, with likelihood values
    pathways and an initial discussion of their context within sustainable                   selected based on risk-avoidance preferences. Responses beyond
    development objectives (Section 2.5), with the latter, along with equity                 global mean temperature are not typically evaluated in such models
    and ethical issues, discussed in more detail in Chapter 5.                               and are assessed in Chapter 3.

    As described in Cross-Chapter Box 1 in Chapter 1, scenarios are                          2.1.2        The Use of Scenarios
    comprehensive, plausible, integrated descriptions of possible futures
    based on specified, internally consistent underlying assumptions,                        Variations in scenario assumptions and design define to a large
    with pathways often used to describe the clear temporal evolution of                     degree which questions can be addressed with a specific scenario
    specific scenario aspects or goal-oriented scenarios. We include both                    set, for example, the exploration of implications of delayed climate
    these usages of ‘pathways’ here.                                                         mitigation action. In this assessment, the following classes of 1.5°C-
                                                                                             and 2°C-consistent scenarios are of particular interest to the topics
    2.1.1        Mitigation Pathways Consistent with 1.5°C                                   addressed in this chapter: (i) scenarios with the same climate target
                                                                                             over the 21st century but varying socio-economic assumptions
    Emissions scenarios need to cover all sectors and regions over the                       (Sections 2.3 and 2.4), (ii) pairs of scenarios with similar socio-
    21st century to be associated with a climate change projection out to                    economic assumptions but with forcing targets aimed at 1.5°C and 2°C
    2100. Assumptions regarding future trends in population, consumption                     (Section 2.3), and (iii) scenarios that follow the Nationally Determined
    of goods and services (including food), economic growth, behaviour,                      Contributions or NDCs2 until 2030 with much more stringent mitigation
    technology, policies and institutions are all required to generate                       action thereafter (Section 2.3.5).

    2
         Current pledges include those from the United States although they have stated their intention to withdraw in the future.

    98
Mitigation Pathways Compatible with 1.5°C in the Context of Sustainable Development                                                             Chapter 2

Characteristics of these pathways, such as emissions reduction rates,          (see Supplementary Material 2.SM.1.3), examining sensitivity to
time of peaking, and low-carbon energy deployment rates, can be                assumptions regarding:
assessed as being consistent with 1.5°C. However, they cannot be               • socio-economic drivers and developments including energy and
assessed as ‘requirements’ for 1.5°C, unless a targeted analysis                   food demand as, for example, characterized by the Shared Socio-
is available that specifically asked whether there could be other                  Economic Pathways (SSPs; Cross-Chapter Box 1 in Chapter 1)
1.5°C-consistent pathways without the characteristics in question. AR5         • near-term climate policies describing different levels of strengthening
already assessed such targeted analyses, for example, asking which                 the NDCs
technologies are important in order to keep open the possibility of            • the use of bioenergy and the availability and desirability of carbon
limiting warming to 2°C (Clarke et al., 2014). By now, several such                dioxide removal (CDR) technologies
targeted analyses are also available for questions related to 1.5°C
(Luderer et al., 2013; Rogelj et al., 2013b; Bauer et al., 2018; Strefler      A large number of these scenarios were collected in a scenario database
et al., 2018b; van Vuuren et al., 2018). This assessment distinguishes         established for the assessment of this Special Report (Supplementary
between ‘consistent’ and the much stronger concept of required                 Material 2.SM.1.3). Mitigation pathways were classified by four
characteristics of 1.5°C pathways wherever possible.                           factors: consistency with a temperature increase limit (as defined by
                                                                               Chapter 1), whether they temporarily overshoot that limit, the extent
                                                                                                                                                               2
Ultimately, society will adjust the choices it makes as new information        of this potential overshoot, and the likelihood of falling within these
becomes available and technical learning progresses, and these                 bounds.
adjustments can be in either direction. Earlier scenario studies have
shown, however, that deeper emissions reductions in the near term              Specifically, they were put into classes that either kept surface
hedge against the uncertainty of both climate response and future              temperature increases below a given threshold throughout the 21st
technology availability (Luderer et al., 2013; Rogelj et al., 2013b; Clarke    century or returned to a value below 1.5°C above pre-industrial levels
et al., 2014). Not knowing what adaptations might be put in place in           at some point before 2100 after temporarily exceeding that level earlier
the future, and due to limited studies, this chapter examines prospective      – referred to as an overshoot (OS). Both groups were further separated
rather than iteratively adaptive mitigation pathways (Cross-Chapter            based on the probability of being below the threshold and the degree
Box 1 in Chapter 1). Societal choices illustrated by scenarios may also        of overshoot, respectively (Table 2.1). Pathways are uniquely classified,
influence what futures are envisioned as possible or desirable and             with 1.5°C-related classes given higher priority than 2°C classes in
hence whether those come into being (Beck and Mahony, 2017).                   cases where a pathway would be applicable to either class.

2.1.3      New Scenario Information since AR5                                  The probability assessment used in the scenario classification is based
                                                                               on simulations using two reduced-complexity carbon cycle, atmospheric
In this chapter, we extend the AR5 mitigation pathway assessment               composition, and climate models: the ‘Model for the Assessment of
based on new scenario literature. Updates in understanding of                  Greenhouse Gas-Induced Climate Change’ (MAGICC) (Meinshausen
climate sensitivity, transient climate response, radiative forcing, and        et al., 2011a), and the ‘Finite Amplitude Impulse Response’ (FAIRv1.3)
the cumulative carbon budget consistent with 1.5°C are discussed in            model (Smith et al., 2018). For the purpose of this report, and to facilitate
Sections 2.2.                                                                  comparison with AR5, the range of the key carbon cycle and climate
                                                                               parameters for MAGICC and its setup are identical to those used in
Mitigation pathways developed with detailed process-based                      AR5 WGIII (Clarke et al., 2014). For each mitigation pathway, MAGICC
integrated assessment models (IAMs) covering all sectors and regions           and FAIR simulations provide probabilistic estimates of atmospheric
over the 21st century describe an internally consistent and calibrated         concentrations, radiative forcing and global temperature outcomes until
(to historical trends) way to get from current developments to                 2100. However, the classification uses MAGICC probabilities directly for
meeting long-term climate targets like 1.5°C (Clarke et al., 2014). The        traceability with AR5 and because this model is more established in the
overwhelming majority of available 1.5°C pathways were generated               literature. Nevertheless, the overall uncertainty assessment is based on
by such IAMs, and these pathways can be directly linked to climate             results from both models, which are considered in the context of the
outcomes and their consistency with the 1.5°C goal evaluated. The              latest radiative forcing estimates and observed temperatures (Etminan
AR5 similarly relied upon such studies, which were mainly discussed in         et al., 2016; Smith et al., 2018) (Section 2.2 and Supplementary Material
Chapter 6 of Working Group III (WGIII) (Clarke et al., 2014).                  2.SM.1.1). The comparison of these lines of evidence shows high
                                                                               agreement in the relative temperature response of pathways, with
Since the AR5, several new, integrated multimodel studies have                 medium agreement on the precise absolute magnitude of warming,
appeared in the literature that explore specific characteristics of            introducing a level of imprecision in these attributes. Consideration of
scenarios more stringent than the lowest scenario category assessed            the combined evidence here leads to medium confidence in the overall
in AR5 than was assessed to limit warming below 2°C with greater               geophysical characteristics of the pathways reported here.
that 66% likelihood (Rogelj et al., 2015b, 2018; Akimoto et al., 2017;
Marcucci et al., 2017; Su et al., 2017; Bauer et al., 2018; Bertram et         In addition to the characteristics of the above-mentioned classes,
al., 2018; Grubler et al., 2018; Holz et al., 2018b; Kriegler et al., 2018a;   four illustrative pathway archetypes have been selected and are used
Liu et al., 2018; Luderer et al., 2018; Strefler et al., 2018a; van Vuuren     throughout this chapter to highlight specific features of and variations
et al., 2018; Vrontisi et al., 2018; Zhang et al., 2018). Those scenarios      across 1.5°C pathways. These are chosen in particular to illustrate the
explore 1.5°C-consistent pathways from multiple perspectives                   spectrum of CO2 emissions reduction patterns consistent with 1.5°C,

                                                                                                                                                         99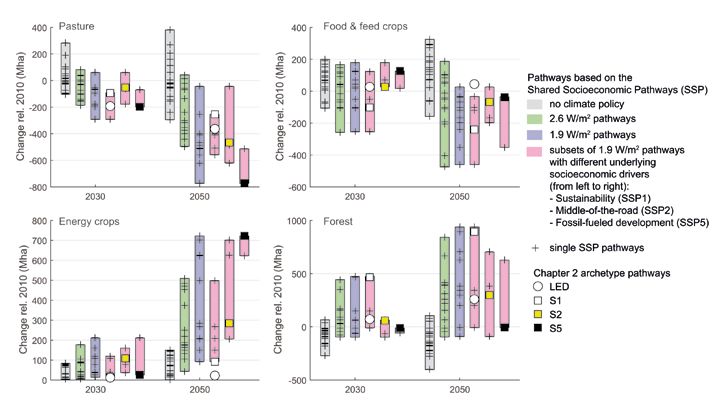
Chapter 2                                                       Mitigation Pathways Compatible with 1.5°C in the Context of Sustainable Development

    Table 2.1 | Classification of pathways that this chapter draws upon, along with the number of available pathways in each class. The definition of each class
                is based on probabilities derived from the MAGICC model in a setup identical to AR5 WGIII (Clarke et al., 2014), as detailed in Supplementary Material 2.SM.1.4.

      Pathway group           Pathway Class                       Pathway Selection Criteria and Description                                   Number of                   Number of
                                                                                                                                               Scenarios                   Scenarios
                                                   Pathways limiting peak warming to below 1.5°C during the entire 21st century
                                 Below-1.5°C                                                                                                         9
                                                   with 50–66% likelihood*
                                                   Pathways limiting median warming to below 1.5°C in 2100 and with a
           1.5°C or             1.5°C-low-OS       50–67% probability of temporarily overshooting that level earlier, generally                     44
                                                                                                                                                                                 90
      1.5°C-consistent**                           implying less than 0.1°C higher peak warming than Below-1.5°C pathways
                                                   Pathways limiting median warming to below 1.5°C in 2100 and with a greater
                                1.5°C-high-OS      than 67% probability of temporarily overshooting that level earlier, generally                   37
                                                   implying 0.1–0.4°C higher peak warming than Below-1.5°C pathways
                                                   Pathways limiting peak warming to below 2°C during the entire 21st century
                                  Lower-2°C                                                                                                         74
            2°C or                                 with greater than 66% likelihood
                                                                                                                                                                                132
        2°C-consistent                             Pathways assessed to keep peak warming to below 2°C during the entire
2                                 Higher-2°C
                                                   21st century with 50–66% likelihood
                                                                                                                                                    58

     * No pathways were available that achieve a greater than 66% probability of limiting warming below 1.5°C during the entire 21st century based on the MAGICC model projections.
    ** This chapter uses the term 1.5°C-consistent pathways to refer to pathways with no overshoot, with limited (low) overshoot, and with high overshoot. However, the Summary for Policymakers
    		 focusses on pathways with no or limited (low) overshoot.

    ranging from very rapid and deep near-term decreases, facilitated                               a specific country or region (Giannakidis et al., 2018). Sector-specific
    by efficiency and demand-side measures that lead to limited CDR                                 pathways are assessed in relation to integrated pathways because they
    requirements, to relatively slower but still rapid emissions reductions                         cannot be directly linked to 1.5°C by themselves if they do not extend
    that lead to a temperature overshoot and necessitate large CDR                                  to 2100 or do not include all GHGs or aerosols from all sectors.
    deployment later in the century (Section 2.3).
                                                                                                    AR5 found sectoral 2°C decarbonization strategies from IAMs to be
    2.1.4        Utility of Integrated Assessment Models                                            consistent with sector-specific studies (Clarke et al., 2014). A growing
                 (IAMs) in the Context of this Report                                               body of literature on 100%-renewable energy scenarios has emerged
                                                                                                    (e.g., see Creutzig et al., 2017; Jacobson et al., 2017), which goes
    IAMs lie at the basis of the assessment of mitigation pathways in this                          beyond the wide range of IAM projections of renewable energy shares
    chapter, as much of the quantitative global scenario literature is derived                      in 1.5°C and 2°C pathways. While the representation of renewable
    with such models. IAMs combine insights from various disciplines in a                           energy resource potentials, technology costs and system integration in
    single framework, resulting in a dynamic description of the coupled                             IAMs has been updated since AR5, leading to higher renewable energy
    energy–economy–land-climate system that cover the largest sources                               deployments in many cases (Luderer et al., 2017; Pietzcker et al., 2017),
    of anthropogenic greenhouse gas (GHG) emissions from different                                  none of the IAM projections identify 100% renewable energy solutions
    sectors. Many of the IAMs that contributed mitigation scenarios to this                         for the global energy system as part of cost-effective mitigation
    assessment include a process-based description of the land system in                            pathways (Section 2.4.2). Bottom-up studies find higher mitigation
    addition to the energy system (e.g., Popp et al., 2017), and several have                       potentials in the industry, buildings, and transport sectors in 2030 than
    been extended to cover air pollutants (Rao et al., 2017) and water use                          realized in selected 2°C pathways from IAMs (UNEP 2017), indicating
    (Hejazi et al., 2014; Fricko et al., 2016; Mouratiadou et al., 2016). Such                      the possibility to strengthen sectoral decarbonization strategies until
    integrated pathways hence allow the exploration of the whole-system                             2030 beyond the integrated 1.5°C pathways assessed in this chapter
    transformation, as well as the interactions, synergies, and trade-                              (Luderer et al., 2018).
    offs between sectors, and, increasingly, questions beyond climate
    mitigation (von Stechow et al., 2015). The models do not, however, fully                        Detailed, process-based IAMs are a diverse set of models ranging
    account for all constraints that could affect realization of pathways                           from partial equilibrium energy–land models to computable general
    (see Chapter 4).                                                                                equilibrium models of the global economy, from myopic to perfect
                                                                                                    foresight models, and from models with to models without endogenous
    Section 2.3 assesses the overall characteristics of 1.5°C pathways                              technological change (Supplementary Material 2.SM.1.2). The IAMs
    based on fully integrated pathways, while Sections 2.4 and 2.5 describe                         used in this chapter have limited to no coverage of climate impacts.
    underlying sectoral transformations, including insights from sector-                            They typically use GHG pricing mechanisms to induce emissions
    specific assessment models and pathways that are not derived from                               reductions and associated changes in energy and land uses consistent
    IAMs. Such models provide detail in their domain of application and                             with the imposed climate goal. The scenarios generated by these
    make exogenous assumptions about cross-sectoral or global factors.                              models are defined by the choice of climate goals and assumptions
    They often focus on a specific sector, such as the energy (Bruckner et                          about near-term climate policy developments. They are also shaped
    al., 2014; IEA, 2017a; Jacobson, 2017; OECD/IEA and IRENA, 2017),                               by assumptions about mitigation potentials and technologies as well
    buildings (Lucon et al., 2014) or transport (Sims et al., 2014) sector, or                      as baseline developments such as, for example, those represented by

    100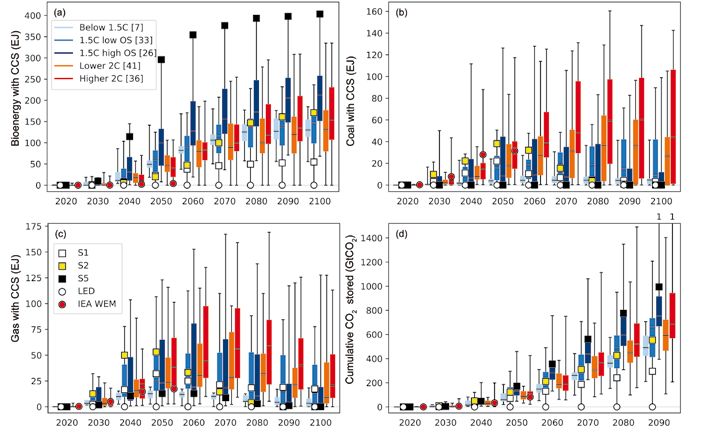
Mitigation Pathways Compatible with 1.5°C in the Context of Sustainable Development                                                           Chapter 2

different Shared Socio-Economic Pathways (SSPs), especially those                1.5°C-consistent pathways available in the database overshoot 1.5°C
pertaining to energy and food demand (Riahi et al., 2017). See Section           around mid-century before peaking and then reducing temperatures
2.3.1 for discussion of these assumptions. Since the AR5, the scenario           so as to return below that level in 2100. However, because of
literature has greatly expanded the exploration of these dimensions.             numerous geophysical uncertainties and model dependencies (Section
This includes low-demand scenarios (Grubler et al., 2018; van Vuuren             2.2.1.1, Supplementary Material 2.SM.1.1), absolute temperature
et al., 2018), scenarios taking into account a larger set of sustainable         characteristics of the various pathway categories are more difficult to
development goals (Bertram et al., 2018), scenarios with restricted              distinguish than relative features (Figure 2.1, Supplementary Material
availability of CDR technologies (Bauer et al., 2018; Grubler et al., 2018;      2.SM.1.1), and actual probabilities of overshoot are imprecise. However,
Holz et al., 2018b; Kriegler et al., 2018a; Strefler et al., 2018b; van Vuuren   all lines of evidence available for temperature projections indicate a
et al., 2018), scenarios with near-term action dominated by regulatory           probability greater than 50% of overshooting 1.5°C by mid-century in
policies (Kriegler et al., 2018a) and scenario variations across the             all but the most stringent pathways currently available (Supplementary
SSPs (Riahi et al., 2017; Rogelj et al., 2018). IAM results depend upon          Material 2.SM.1.1, 2.SM.1.4).
multiple underlying assumptions, for example, the extent to which
global markets and economies are assumed to operate frictionless                 Most 1.5°C-consistent pathways exhibit a peak in temperature by mid-
and policies are cost-optimized, assumptions about technological                 century whereas 2°C-consistent pathways generally peak after 2050
                                                                                                                                                             2
progress and availability and costs of mitigation and CDR measures,              (Supplementary Material 2.SM.1.4). The peak in median temperature
assumptions about underlying socio-economic developments and                     in the various pathway categories occurs about ten years before
future energy, food and materials demand, and assumptions about                  reaching net zero CO2 emissions due to strongly reduced annual
the geographic and temporal pattern of future regulatory and carbon              CO2 emissions and deep reductions in CH4 emissions (Section 2.3.3).
pricing policies (see Supplementary Material 2.SM.1.2 for additional             The two reduced-complexity climate models used in this assessment
discussion on IAMs and their limitations).                                       suggest that virtually all available 1.5°C-consistent pathways peak
                                                                                 and then decline global mean temperature, but with varying rates
                                                                                 of temperature decline after the peak (Figure 2.1). The estimated
                                                                                 decadal rates of temperature change by the end of the century are
2.2        Geophysical Relationships and Constraints                             smaller than the amplitude of the climate variability as assessed in AR5
                                                                                 (1 standard deviation of about ±0.1°C), which hence complicates the
Emissions pathways can be characterized by various geophysical                   detection of a global peak and decline of warming in observations on
characteristics, such as radiative forcing (Masui et al., 2011; Riahi et         time scales of one to two decades (Bindoff et al., 2013). In comparison,
al., 2011; Thomson et al., 2011; van Vuuren et al., 2011b), atmospheric          many pathways limiting warming to 2°C or higher by 2100 still have
concentrations (van Vuuren et al., 2007, 2011a; Clarke et al., 2014) or          noticeable increasing trends at the end of the century, and thus imply
associated temperature outcomes (Meinshausen et al., 2009; Rogelj                continued warming.
et al., 2011; Luderer et al., 2013). These attributes can be used to
derive geophysical relationships for specific pathway classes, such as           By 2100, the difference between 1.5°C- and 2°C-consistent pathways
cumulative CO2 emissions compatible with a specific level of warming,            becomes clearer compared to mid-century, not only for the temperature
also known as ‘carbon budgets’ (Meinshausen et al., 2009; Rogelj et al.,         response (Figure 2.1) but also for atmospheric CO2 concentrations. In
2011; Stocker et al., 2013; Friedlingstein et al., 2014a), the consistent        2100, the median CO2 concentration in 1.5°C-consistent pathways is
contributions of non-CO2 GHGs and aerosols to the remaining carbon               below 2016 levels (Le Quéré et al., 2018), whereas it remains higher
budget (Bowerman et al., 2011; Rogelj et al., 2015a, 2016b), or to               by about 5–10% compared to 2016 in the 2°C-consistent pathways.
temperature outcomes (Lamarque et al., 2011; Bowerman et al., 2013;
Rogelj et al., 2014b). This section assesses geophysical relationships for       2.2.1.1 Geophysical uncertainties: non-CO2 forcing agents
both CO2 and non-CO2 emissions (see glossary).
                                                                                 Impacts of non-CO2 climate forcers on temperature outcomes are
2.2.1      Geophysical Characteristics of Mitigation Pathways                    particularly important when evaluating stringent mitigation pathways
                                                                                 (Weyant et al., 2006; Shindell et al., 2012; Rogelj et al., 2014b, 2015a;
This section employs the pathway classification introduced in Section            Samset et al., 2018). However, many uncertainties affect the role of
2.1, with geophysical characteristics derived from simulations with              non-CO2 climate forcers in stringent mitigation pathways.
the MAGICC reduced-complexity carbon cycle and climate model and
supported by simulations with the FAIR reduced-complexity model                  A first uncertainty arises from the magnitude of the radiative forcing
(Section 2.1). Within a specific category and between models, there              attributed to non-CO2 climate forcers. Figure 2.2 illustrates how, for
remains a large degree of variance. Most pathways exhibit a temperature          one representative 1.5°C-consistent pathway (SSP2-1.9) (Fricko et al.,
overshoot which has been highlighted in several studies focusing on              2017; Rogelj et al., 2018), the effective radiative forcings as estimated
stringent mitigation pathways (Huntingford and Lowe, 2007; Wigley                by MAGICC and FAIR can differ (see Supplementary Material 2.SM1.1
et al., 2007; Nohara et al., 2015; Rogelj et al., 2015d; Zickfeld and            for further details). This large spread in non-CO2 effective radiative
Herrington, 2015; Schleussner et al., 2016; Xu and Ramanathan,                   forcings leads to considerable uncertainty in the predicted temperature
2017). Only very few of the scenarios collected in the database for              response. This uncertainty ultimately affects the assessed temperature
this report hold the average future warming projected by MAGICC                  outcomes for pathway classes used in this chapter (Section 2.1) and
below 1.5°C during the entire 21st century (Table 2.1, Figure 2.1). Most         also affects the carbon budget (Section 2.2.2). Figure 2.2 highlights

                                                                                                                                                     101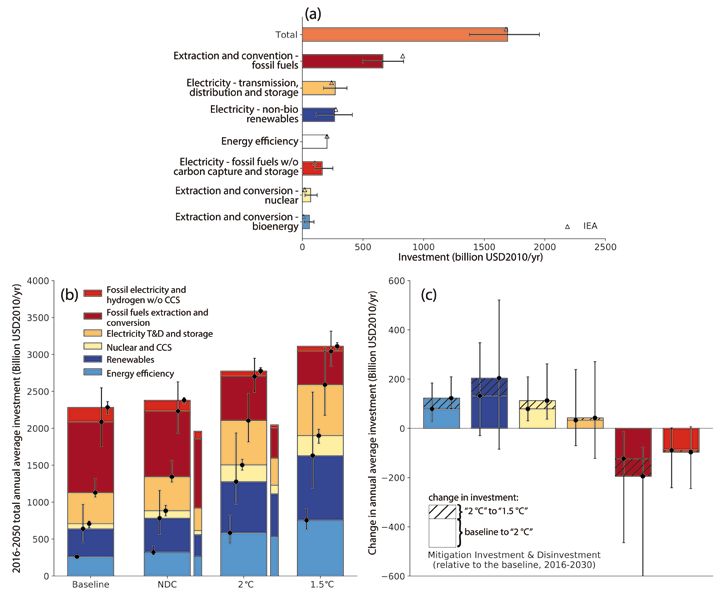
Chapter 2                                                 Mitigation Pathways Compatible with 1.5°C in the Context of Sustainable Development

2

    Figure 2.1 | Pathways classification overview. (a) Average global mean temperature increase relative to 2010 as projected by FAIR and MAGICC in 2030, 2050 and
    2100; (b) response of peak warming to cumulative CO2 emissions until net zero by MAGICC (red) and FAIR (blue); (c) decadal rate of average global mean temperature change
    from 2081 to 2100 as a function of the annual CO2 emissions averaged over the same period as given by FAIR (transparent squares) and MAGICC (filled circles). In panel (a),
    horizontal lines at 0.63°C and 1.13°C are indicative of the 1.5°C and 2°C warming thresholds with the respect to 1850–1900, taking into account the assessed historical
    warming of 0.87°C ±0.12°C between the 1850–1900 and 2006–2015 periods (Chapter 1, Section 1.2.1). In panel (a), vertical lines illustrate both the physical and the scenario
    uncertainty as captured by MAGICC and FAIR and show the minimal warming of the 5th percentile of projected warming and the maximal warming of the 95th percentile of
    projected warming per scenario class. Boxes show the interquartile range of mean warming across scenarios, and thus represent scenario uncertainty only.

    the important role of methane emissions reduction in this scenario, in                  interactions, leading to warming (Myhre et al., 2013; Samset et al.,
    agreement with the recent literature focussing on stringent mitigation                  2018). A multimodel analysis (Myhre et al., 2017) and a study based
    pathways (Shindell et al., 2012; Rogelj et al., 2014b, 2015a; Stohl et al.,             on observational constraints (Malavelle et al., 2017) largely support
    2015; Collins et al., 2018).                                                            the AR5 best estimate and uncertainty range of aerosol forcing.
                                                                                            The partitioning of total aerosol radiative forcing between aerosol
    For mitigation pathways that aim at halting and reversing radiative                     precursor emissions is important (Ghan et al., 2013; Jones et al.,
    forcing increase during this century, the aerosol radiative forcing is a                2018; Smith et al., 2018) as this affects the estimate of the mitigation
    considerable source of uncertainty (Figure 2.2) (Samset et al., 2018;                   potential from different sectors that have aerosol precursor emission
    Smith et al., 2018). Indeed, reductions in SO2 (and NOx) emissions                      sources. The total aerosol effective radiative forcing change in stringent
    largely associated with fossil-fuel burning are expected to reduce the                  mitigation pathways is expected to be dominated by the effects from
    cooling effects of both aerosol radiative interactions and aerosol cloud                the phase-out of SO2, although the magnitude of this aerosol-warming

    102
Mitigation Pathways Compatible with 1.5°C in the Context of Sustainable Development Chapter 2
effect depends on how much of the present-day aerosol cooling is
attributable to SO2, particularly the cooling associated with aerosol–
cloud interaction (Figure 2.2). Regional differences in the linearity of
aerosol–cloud interactions (Carslaw et al., 2013; Kretzschmar et al.,
2017) make it difficult to separate the role of individual precursors.
Precursors that are not fully mitigated will continue to affect the
Earth system. If, for example, the role of nitrate aerosol cooling is at
the strongest end of the assessed IPCC AR5 uncertainty range, future
temperature increases may be more modest if ammonia emissions
continue to rise (Hauglustaine et al., 2014).
Figure 2.2 shows that there are substantial differences in the evolution
of estimated effective radiative forcing of non-CO2 forcers between
MAGICC and FAIR. These forcing differences result in MAGICC
simulating a larger warming trend in the near term compared to both
2
the FAIR model and the recent observed trends of 0.2°C per decade
reported in Chapter 1 (Figure 2.1, Supplementary Material 2.SM.1.1,
Chapter 1, Section 1.2.1.3). The aerosol effective forcing is stronger in
MAGICC compared to either FAIR or the AR5 best estimate, though it
is still well within the AR5 uncertainty range (Supplementary Material
2.SM.1.1.1). A recent revision (Etminan et al., 2016) increases the Figure 2.2 | Changes and uncertainties in effective radiative forcings (ERF)
methane forcing by 25%. This revision is used in the FAIR but not in the for one 1.5°C-consistent pathway (SSP2-19) as estimated by MAGICC
AR5 setup of MAGICC that is applied here. Other structural differences and FAIR. The lines are indicative of the total effective radiative forcing from all
exist in how the two models relate emissions to concentrations that anthropogenic sources (solid lines) and for non-CO2 agents only (dashed lines), as
represented by MAGICC (red) and FAIR (blue) relative to 2010, respectively. Vertical
contribute to differences in forcing (see Supplementary Material
bars show the mean radiative forcing as predicted by MAGICC and FAIR of relevant
2.SM.1.1.1). non-CO2 agents for year 2030, 2050 and 2100. The vertical lines give the uncertainty
(1 standard deviation) of the ERFs for the represented species.
Non-CO2 climate forcers exhibit a greater geographical variation in
radiative forcings than CO2, which leads to important uncertainties in the
temperature response (Myhre et al., 2013). This uncertainty increases
the relative uncertainty of the temperature pathways associated with et al., 2017) suggest that the lower bound of ECS could be revised
low emission scenarios compared to high emission scenarios (Clarke upwards, which would decrease the chances of limiting warming
et al., 2014). It is also important to note that geographical patterns below 1.5°C in assessed pathways. However, such a reassessment has
of temperature change and other climate responses, especially those been challenged (Lewis and Curry, 2018), albeit from a single line of
related to precipitation, depend significantly on the forcing mechanism evidence. Nevertheless, it is premature to make a major revision to the
(Myhre et al., 2013; Shindell et al., 2015; Marvel et al., 2016; Samset et lower bound. The evidence for a possible revision of the upper bound
al., 2016) (see also Chapter 3, Section 3.6.2.2). on ECS is less clear, with cases argued from different lines of evidence
for both decreasing (Lewis and Curry, 2015, 2018; Cox et al., 2018)
2.2.1.2 Geophysical uncertainties: climate and Earth system and increasing (Brown and Caldeira, 2017) the bound presented in the
feedbacks literature. The tools used in this chapter employ ECS ranges consistent
with the AR5 assessment. The MAGICC ECS distribution has not been
Climate sensitivity uncertainty impacts future projections as well as selected to explicitly reflect this but is nevertheless consistent (Rogelj
carbon-budget estimates (Schneider et al., 2017). AR5 assessed the et al., 2014a). The FAIR model used here to estimate carbon budgets
equilibrium climate sensitivity (ECS) to be likely in the 1.5°–4.5°C explicitly constructs log-normal distributions of ECS and transient
range, extremely unlikely less than 1°C and very unlikely greater climate response based on a multi-parameter fit to the AR5 assessed
than 6°C. The lower bound of this estimate is lower than the range ranges of climate sensitivity and individual historic effective radiative
of CMIP5 models (Collins et al., 2013). The evidence for the 1.5°C forcings (Smith et al., 2018) (Supplementary Material 2.SM.1.1.1).
lower bound on ECS in AR5 was based on analysis of energy-budget
changes over the historical period. Work since AR5 has suggested Several feedbacks of the Earth system, involving the carbon cycle, non-
that the climate sensitivity inferred from such changes has been CO2 GHGs and/or aerosols, may also impact the future dynamics of the
lower than the 2 × CO2 climate sensitivity for known reasons (Forster, coupled carbon–climate system’s response to anthropogenic emissions.
2016; Gregory and Andrews, 2016; Rugenstein et al., 2016; Armour, These feedbacks are caused by the effects of nutrient limitation (Duce et
2017; Ceppi and Gregory, 2017; Knutti et al., 2017; Proistosescu and al., 2008; Mahowald et al., 2017), ozone exposure (de Vries et al., 2017),
Huybers, 2017). Both a revised interpretation of historical estimates fire emissions (Narayan et al., 2007) and changes associated with
and other lines of evidence based on analysis of climate models with natural aerosols (Cadule et al., 2009; Scott et al., 2018). Among these
the best representation of today’s climate (Sherwood et al., 2014; Earth system feedbacks, the importance of the permafrost feedback’s
Zhai et al., 2015; Tan et al., 2016; Brown and Caldeira, 2017; Knutti influence has been highlighted in recent studies. Combined evidence
103You can also read