Department of Homeland Security, Science and Technology Directorate, Borders and Maritime Security Division: Renewable Energy Research Roadmap
←
→
Page content transcription
If your browser does not render page correctly, please read the page content below
Department of Homeland
                                                  Security, Science and
                                                  Technology Directorate, Borders
                                                  and Maritime Security Division:
                                                  Renewable Energy Research
                                                  Roadmap

                                                       Produced under direction of the U.S. Department of Homeland Security,
                                                       Science and Technology Directorate, Borders and Maritime Security
                                                       Division by the National Renewable Energy Laboratory (NREL) under
                                                       Interagency Agreement IAG-09-1727 and Task No. WFB9.2000

                                              NREL is a national laboratory of the U.S. Department of Energy, Office of Energy Efficiency & Renewable
                                              Energy, operated by the Alliance for Sustainable Energy, LLC. Contract No. DE-AC36-08GO28308

National Renewable Energy Laboratory
1617 Cole Boulevard, Golden, Colorado 80401   Technical Report
303-275-3000 • www.nrel.gov                   NREL/TP-7A40-51491
                                              July 2011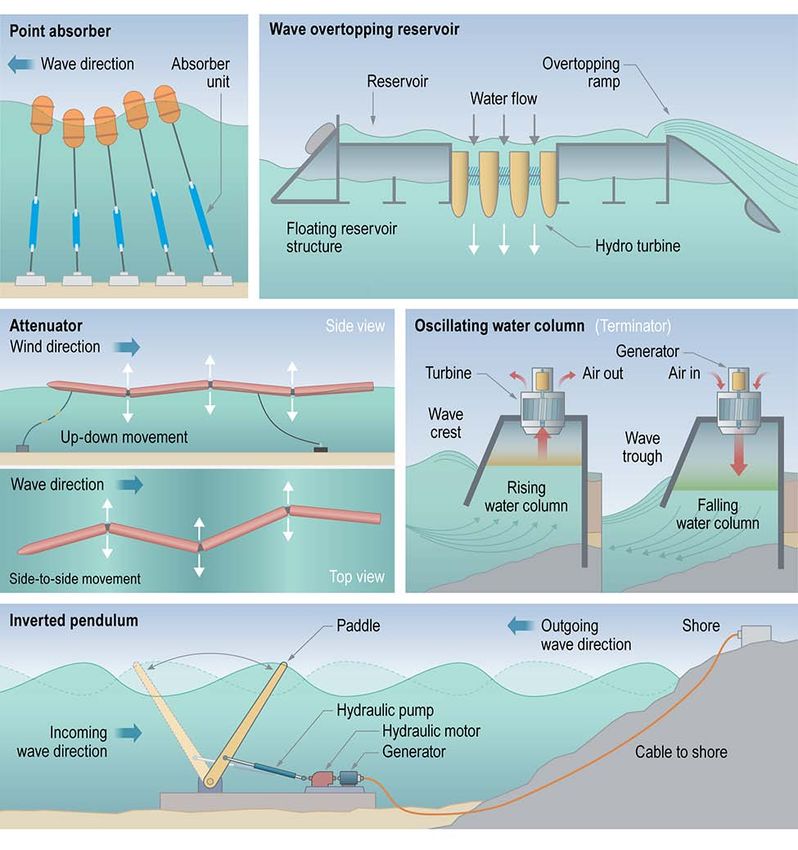
Department of Homeland
                                                 Security, Science and
                                                 Technology Directorate,
                                                 Borders and Maritime Security
                                                 Division: Renewable Energy
                                                 Research Roadmap
                                                 Alicen Kandt and Scott Huffman
                                                 Disclaimer: This manuscript has been authored by employees of the Alliance
                                                 for Sustainable Energy, LLC (“Alliance”) under Contract No. DE-AC36-
                                                 08GO28308 with the U.S. Department of Energy (“DOE”). The tables and
                                                 figures in this report are limited to use in this report only and are not to be
                                                 further disseminated or used without the permission of the sources cited.

                                                 Neither Alliance, DOE, the United States government nor any agency thereof,
                                                 nor any of their employees, makes any warranty, express or implied, or
                                                 assumes any legal liability or responsibility for the accuracy, completeness, or
                                                 usefulness of any information, apparatus, product, or process disclosed in this
                                                 manuscript, or represents that its use would not infringe privately owned rights.
                                                 Reference herein to any specific commercial product, process, or service by
                                                 trade name, trademark, manufacturer, or otherwise does not necessarily
                                                 constitute or imply its endorsement, recommendation, or favoring by Alliance,
                                                 DOE or the United States Government or any agency thereof. The views and
                                                 opinions of authors expressed herein do not necessarily state or reflect those
                                                 of Alliance, DOE or the United States government or any agency thereof.

                                                 Cover photo by Steve Wilcox, NREL PIX/15551

                                              NREL is a national laboratory of the U.S. Department of Energy, Office of Energy Efficiency & Renewable
                                              Energy, operated by the Alliance for Sustainable Energy, LLC. Contract No. DE-AC36-08GO28308

National Renewable Energy Laboratory          Technical Report
1617 Cole Boulevard, Golden, Colorado 80401   NREL/TP-7A40-51491
303-275-3000 • www.nrel.gov
                                              July 2011
Contacts
National Renewable Energy Laboratory         Department of Homeland Security

Alicen Kandt                                 Jeanne Lin
Senior Engineer                              Deputy Director, HSARPA/Borders and
1617 Cole Boulevard                          Maritime Security Division, Science and
Golden, CO 80401                             Technology Directorate,
Phone: 303-384-7518                          Department of Homeland Security
E-mail: alicen.kandt@nrel.gov                Washington, DC 20528
                                             Phone: 202-254-5737
Scott Huffman                                E-mail: jeanne.lin@dhs.gov
Senior Engineer
1617 Cole Boulevard
Golden, CO 80401
Phone: 303-275-4384
E-mail: scott.huffman@nrel.gov

                                       iii
Acknowledgements
The National Renewable Energy Laboratory (NREL) staff gratefully acknowledges the
numerous NREL researchers who contributed to this report, including: Robert Thresher (marine
hydrokinetic); Robi Robichaud (wind); Lin Simpson (batteries); Melanie Caton, Michael Penev,
Huyen Dinh, Keith Wipke, John Lewis, and Chris Ainscough (fuel cells and hydrogen); Philip
Pienkos and Jianping Yu (algae biomass); and Phillip Parilla (energy transfer). Andrea Watson
and Heidi Blakley also contributed to the report review and compilation process.

The NREL staff wishes to acknowledge U.S. Department of Homeland Security (DHS) staff for
support in coordinating site visits and data gathering, especially John Contreras (U.S. Customs
and Border Protection [CBP] El Paso Sector), Sudie Hargis (U.S. Coast Guard [USCG] Alaska),
and Merv Leavitt (CBP headquarters).

                                               iv
List of Acronyms and Abbreviations
A                  amp
AC                 alternating current
AMFC               alkaline membrane fuel cell
ARPA-E             Advanced Research Projects Agency-Energy
BAU                business as usual
BES                Basic Energy Science
BMD                Borders and Maritime Security Division
CBP                U.S. Customs and Border Protection
CERDEC             Communications-Electronics Research, Development and
                   Engineering Center
CHP                combined heat and power
CIGS               copper, indium, gallium, selenide
DARPA              Defense Advanced Research Project Agency
DC                 direct current
DMFC               direct methanol fuel cells
DOE                U.S. Department of Energy
DOD                U.S. Department of Defense
DHS                U.S. Department of Homeland Security
EE                 Energy Efficiency
EERE               DOE Office of Energy Efficiency and Renewable Energy
EM                 electromagnetic
FAD                fish aggregating device
FOB                forward operating base
g/mol              grams per mole
GHG                greenhouse gas
GW                 gigawatt
HAWT               horizontal axis wind turbine
ICE                U.S. Immigration and Customs Enforcement
IEA-OES            International Energy Agency’s Ocean Energy Systems
                   Implementing Agreement
IEC                International Electrochemical Commission
kW                 kilowatt
kWh                kilowatt-hour
kW/m2              kilowatts per square meter
LCC                life cycle cost
LED                light-emitting diode
Li                 lithium
Li-air             lithium-air
LiFePO4            lithium iron phosphate
Li-ion             lithium-ion
LiPON              lithium phosphorous oxynitride
Li-S               lithium-sulfur
MHK                marine hydrokinetic
MSS                mobile surveillance system

                                   v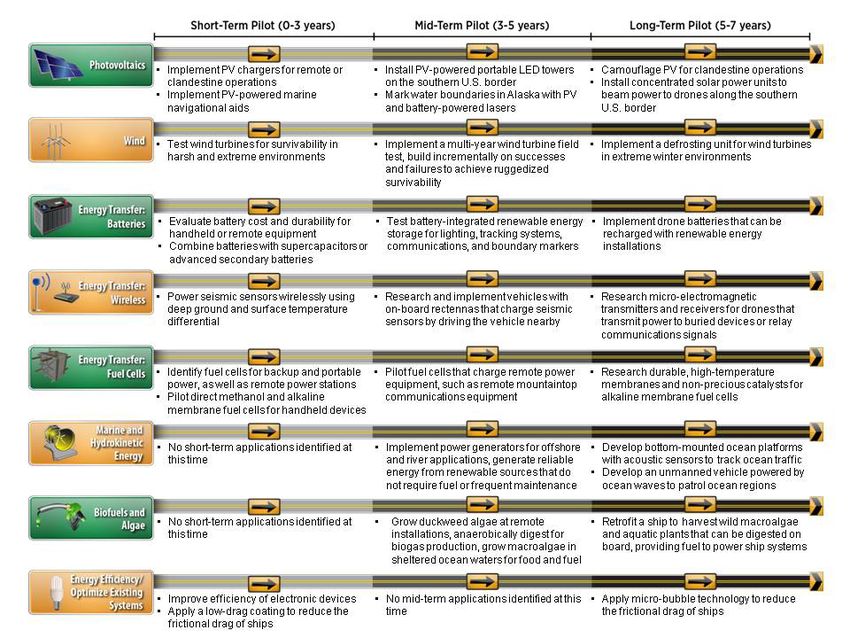
MW       megawatt
NASA     National Aeronautics and Space Administration
NOx      nitrogen oxide
NREL     National Renewable Energy Laboratory
O&M      Operations & Maintenance
ORPC     Ocean Renewable Power Company
OTEC     thermal energy gradient
PEMFC    proton-exchange membrane fuel cells
POC      point of contact
PV       photovoltaic
R&D      research and development
R-21     Rescue-21
RE       Renewable Energy
RFID     radio frequency identification
RFP      request for proposal
rpm      rotations per minute
RVSS     remote video surveillance system
S&T      Science and Technology Directorate
SBI      Secure Border Initiative
SOFC     solid oxide fuel cell
TAG      triacylglyceride
TI       turbulence intensity
TSA      Transportation Security Administration
TSR      tip speed ratio
TWh/yr   terawatt-hours per year
USABC    U.S. Advanced Battery Consortium
USCG     U.S. Coast Guard
USCIS    U.S. Citizenship and Immigration Services
V        volt
VAWT     vertical axis wind turbine
W        watt
Wh/kg    watt-hour per kilogram
Wh/L     watt-hour per liter

                         vi
Executive Summary
Within the U.S. Department of Homeland Security (DHS) Science and Technology (S&T)
Directorate, the Borders and Maritime Security Division (BMD) develops and transitions
technologies that help enhance the security of our nation’s borders and waterways without
impeding the flow of commerce and travelers. BMD is identifying next-generation renewable-
energy solutions for inclusion in its research portfolio. Recognizing the potential of renewable
energy to contribute to border security, BMD partnered with the U.S. Department of Energy
(DOE) National Renewable Energy Laboratory (NREL) to examine border-security energy
demands and to ensure that advances in renewable energy and energy storage lead to increased
security in these areas. This research effort is funded by BMD and is a product of a 2-year
interagency agreement between DHS S&T and DOE. NREL is a national laboratory of the DOE
Office of Energy Efficiency & Renewable Energy (EERE), operated by the Alliance for
Sustainable Energy, LLC.
NREL has examined the energy needs along U.S. borders—especially in remote areas—to
identify opportunities to apply renewable energy solutions today and to define the near- and
long-term research agendas that will position border components and activities to take advantage
of renewable energy technologies in the future. This report is a result of those efforts.
This report provides a summary of the work that BMD and NREL have performed to date. It
provides an overview of renewable energy technologies that have applicability to DHS security
operations, and highlights opportunities for future technology pilot projects or research initiatives
that can supplement current technologies by developing solutions for DHS borders and maritime
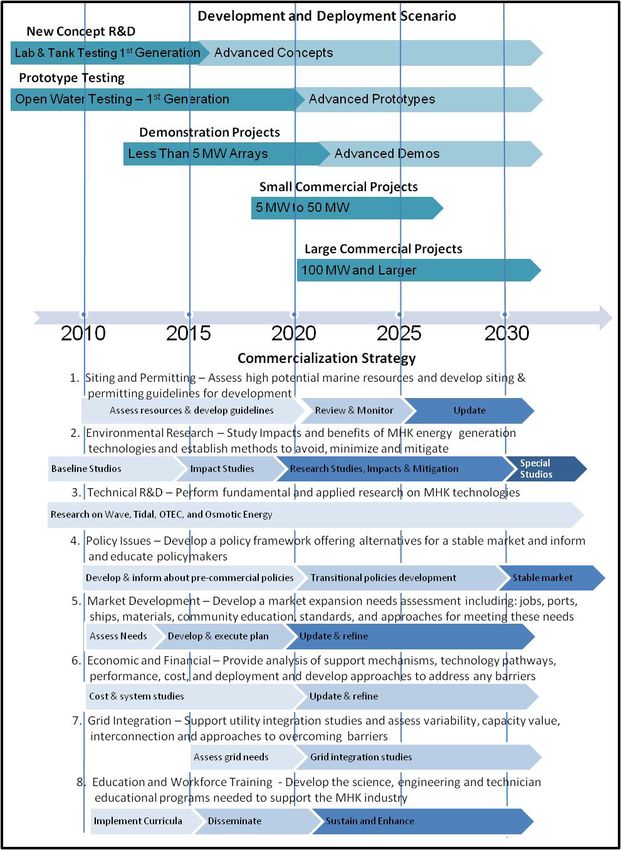
security operational needs. The research roadmap shown in Figure 1 illustrates these renewable
energy pilot projects on a short-, mid-, and long-term timeline.
vii
Figure 1. DHS renewable energy roadmap outlining potential research opportunities. Illustration by Joshua Bauer, NREL
                                                        viii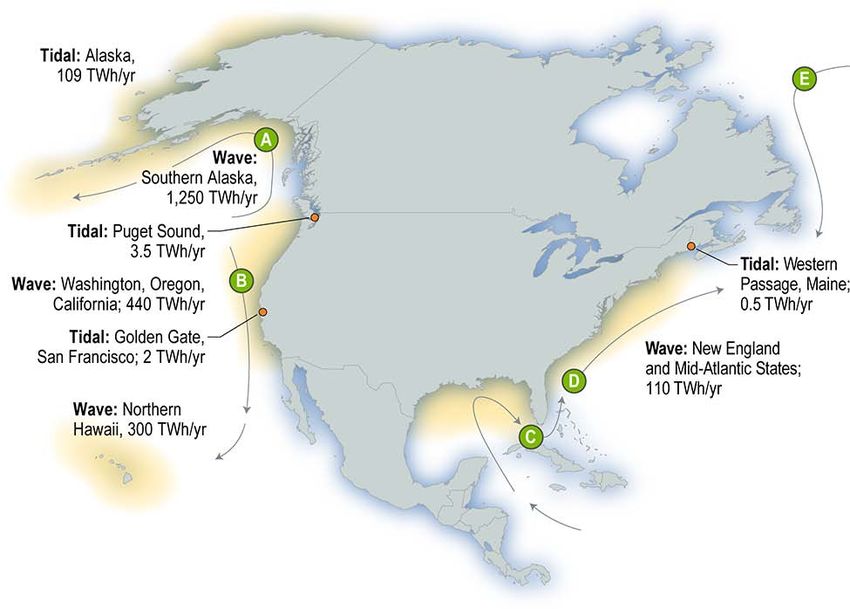
Table of Contents
1 Introduction ............................................................................................................................................. 1
  1.1 Overview: Department of Homeland Security Science and Technology Directorate,
       Borders and Maritime Security Division ...................................................................................... 1
  1.2 Renewable Energy Research Roadmap: Project Overview ....................................................... 1
     Workshops............................................................................................................................................ 2
        Site Visits .............................................................................................................................................. 5
2 Renewable Energy Research and Technology Opportunities ........................................................... 6
  2.1 Solar Technology Overview .......................................................................................................... 6
     Commercially Available Technologies.................................................................................................. 6
        Emerging Photovoltaic Technologies ................................................................................................... 7
        Department of Homeland Security Relevance: Photovoltaic Applications ........................................... 7
    2.2 Wind................................................................................................................................................. 9
       Technology Overview ........................................................................................................................... 9
        Commercially Available Technologies—Current/Future Research Trends........................................ 10
        Wind Characteristics .......................................................................................................................... 11
        Department of Homeland Security Relevance: Options for Powering Remote
        Communication Stations .................................................................................................................... 16
    2.3 Energy Transfer Overview .......................................................................................................... 20
       2.3.1 Batteries ................................................................................................................................ 21
        Department of Homeland Security Relevance: Battery Development ............................................... 23
        2.3.2       Wireless Energy Transfer ...................................................................................................... 28
        Rectenna Energy Transfer—Technology Overview ........................................................................... 28
        Department of Homeland Security Relevance: Wireless Energy Transfer ........................................ 29
        Inductive Coupling Energy Transfer—Technology Overview ............................................................ 30
        Department of Homeland Security Relevance: Inductive Coupling Energy Transfer ........................ 30
        Laser Energy Transfer—Technology Overview ................................................................................. 30
        Department of Homeland Security Relevance: Laser Energy Transfer ............................................. 30
        Thermoelectric Technologies—Technology Overview ....................................................................... 30
        Department of Homeland Security Relevance: Thermoelectric Technologies .................................. 31
        2.3.3       Fuel Cells............................................................................................................................... 32
        Technology Overview ......................................................................................................................... 32
        Department of Homeland Security Relevance: Fuel Cell Applications .............................................. 36
    2.4 Marine and Hydrokinetic Energy Technologies ........................................................................ 39
       Marine Hydrokinetic Energy Technologies Overview......................................................................... 39
        Marine Hydrokinetic Energy Resource Availability............................................................................. 43
        Marine Hydrokinetic Energy Technologies Global Deployment ......................................................... 45
        Roadmap to Address Commercial Pathway and Challenges for Marine
        Hydrokinetic Technologies ................................................................................................................. 46
        Department of Homeland Security Relevance: Marine Hydrokinetic Energy..................................... 56
    2.5 Biofuels and Algae ....................................................................................................................... 57
       Technology Overview—Biodiesel Production .................................................................................... 58

                                                                                ix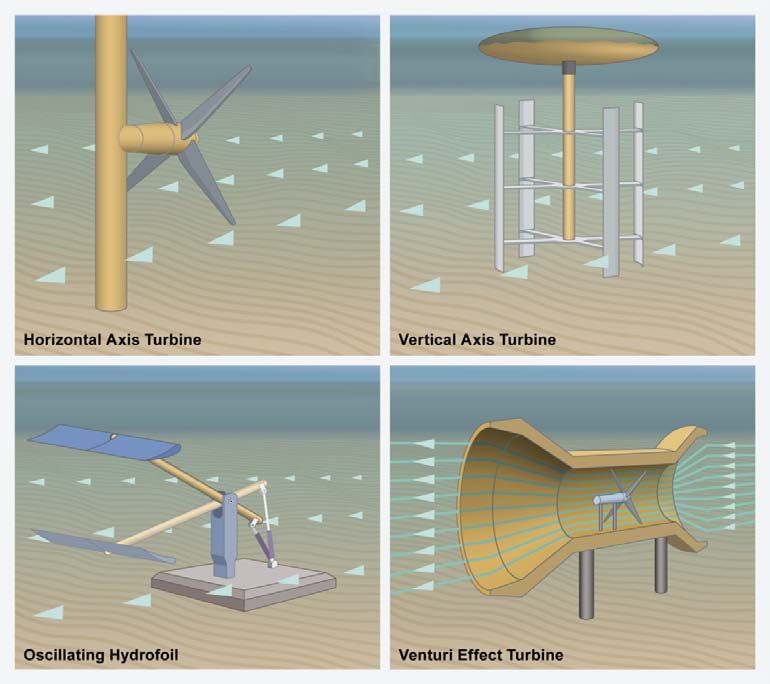
Department of Homeland Security Relevance: Biofuel and Algae Applications ................................ 61
    2.6   Energy Efficiency—Opportunities for Systemic Optimization of Existing and
          Future Systems ............................................................................................................................ 64
        Department of Homeland Security Relevance: Optimize Existing Systems ...................................... 64
3 Conclusions .......................................................................................................................................... 67
4 References............................................................................................................................................. 68

Appendix A. Department of Homeland Security Workshops and Site Visits ..................................... 71
  March 19, 2010 (Washington, DC): Introductory Workshop............................................................. 71
    Attendees ........................................................................................................................................... 71
    June 21, 2010 (Washington, DC): Data Gathering and Application Prioritization Workshop
        (CBP/NREL) .................................................................................................................................. 71
      Agenda: Monday, June 21, 2010 ....................................................................................................... 71
        Attendees ........................................................................................................................................... 72
    June 21, 2010 (Washington, DC): Data Gathering and Application Prioritization Workshop
         (CBP/NREL) .................................................................................................................................. 72
    July 22–23, 2010 (Bellingham, WA): Northwest Border Low-Flier Workshop ................................ 73
      Agenda ............................................................................................................................................... 73
        Attendees ........................................................................................................................................... 74
    October 26–29, 2010 (El Paso, TX): El Paso Sector .......................................................................... 74
      Agenda ............................................................................................................................................... 74
        Attendees ........................................................................................................................................... 76
    April 5–9, 2011 (Juneau, AK): AK USCG Operations ........................................................................ 76
      Agenda ............................................................................................................................................... 76
Appendix B. Wind ..................................................................................................................................... 77
  Windside ................................................................................................................................................ 77
Appendix C. Fuel Cells ............................................................................................................................. 78

                                                                              x
List of Figures
Figure 1. DHS renewable energy roadmap outlining potential research opportunities. Illustration
by Joshua Bauer, NREL .......................................................................................................... viii
Figure 2. Various types of horizontal and vertical access wind turbines. Illustration by Al Hicks,
NREL .......................................................................................................................................... 13
Figure 3. Comparison of aerodynamic efficiencies of common types of wind turbines (based on
Hau 2000). Illustration by NREL .............................................................................................. 15
Figure 4. Proven 11 downwind turbine with spring-loaded blade furling design. Photo from
Proven Energy........................................................................................................................... 19
Figure 5. Fuel cell types, fuels, and applications. Illustration from DOE ............................................ 32
Figure 6. Fuel cell basics. Illustration from DOE ................................................................................... 33
Figure 7. Marine hydrokinetic technologies in development worldwide (Khan and Bhuyan 2009) . 40
Figure 8. Five typical wave-energy conversion devices (adapted from Bedard 2006). Illustration by
NREL .......................................................................................................................................... 42
Figure 9. Four typical kinetic-energy conversion devices for tidal, ocean, and river currents
(adapted from Bedard 2006). Illustration by NREL................................................................ 43
Figure 10. Total natural tidal-current energy and wave energy resources in United States; A:
Alaska current, B: California current, C: Florida current, D: Gulf Stream, E: Labrador
current (adapted from Bedard 2008). Illustration by NREL .................................................. 44
Figure 11. Global installed capacity of ocean energy technologies (IEA-OES 2010) ........................ 46
Figure 12. Development and deployment harmonized with the commercial strategy (Thresher
2010) ........................................................................................................................................... 48
Figure 13. Marine hydrokinetic development and deployment scenario and the overall R&D
technical strategy (Thresher 2010) ......................................................................................... 50
Figure 14. Ocean Power Technologies PowerBuoy wave generation system uses a "smart", ocean-
going buoy to capture and convert wave energy into low-cost clean electricity. Photo
from Ocean Power Technologies, NREL/PIX 17114 .............................................................. 55
Figure 15. ORPC's Beta Turbine Generator Unit generates clean, renewable electricity by
harnessing the energy of the world's rivers and oceans. Photo from Ocean Renewable
Power Company, NREL/PIX 17210 .......................................................................................... 55
Figure 16. OpenHydro's Open-Center Turbine is designed to be deployed directly on the seabed.
The first 6-m test unit produces enough energy to supply 150 average European homes
and save the emission of over 450 tons of CO2 greenhouse gas per year. Photo from
OpenHydro, NREL/PIX 17243................................................................................................... 56
Figure 17. Biopower production using algal biomass. Illustration by NREL...................................... 59
Figure 18. Biochemical strategies for converting algal feedstock into biofuels. Illustration from
Sustainable Algal Biofuels Consortium ................................................................................. 60
List of Tables
Table 1. Comparison of Typical Energy-Storage and Delivery Systems ............................................ 22
Table 2. Comparison of Fuel Cell Technologies (DOE 2011)................................................................ 34
Table 3. Summary of Currently Available Estimates for Wave and Current Energy Resources ...... 45
Table 4. Estimated Capital Costs for Marine Hydrokinetic Wave and Tidal Technologies in 2006 .. 52
Table 5. Power Output at Various Wind Speeds for Windside Turbine Models ................................. 77
Table 6. Power Curves for Proven 11 Wind Turbine ............................................................................. 77
xi1 Introduction
1.1 Overview: Department of Homeland Security Science and Technology
Directorate, Borders and Maritime Security Division
Within the U.S. Department of Homeland Security’s (DHS) Science and Technology (S&T)
Directorate, the Borders and Maritime Security Division (BMD) develops and transitions
technologies that help enhance the security of our nation’s borders and waterways without
impeding the flow of commerce and travelers. This mission is carried out by technical
professionals responsible for funding, managing, developing, prototyping, testing, and evaluating
technical solutions for air, land, and maritime borders along with cargo security. BMD’s primary
end users are operating components within DHS, such as Customs and Border Protection (CBP),
Immigration and Customs Enforcement (ICE), U.S. Citizenship and Immigration Services
(USCIS), U.S. Coast Guard (USCG), and Transportation Security Administration (TSA)
(Jennings et al 2010).
The S&T Directorate works to cooperate and collaborate amongst the divisions within the
Directorate, including BMD. To ensure that efforts undertaken by BMD are aligned with the
overarching mission of DHS S&T, BMD is developing a division-level strategic plan (Jennings
et al 2010). As a part of this plan, BMD is in the process of identifying next-generation
renewable energy solutions that meet its mission and can be included in its research portfolio.
Recognizing the potential of renewable energy to contribute to border security, BMD partnered
with the U.S. Department of Energy (DOE) National Renewable Energy Laboratory (NREL) to
examine border security energy demands, and to ensure that advances in renewable energy and
energy storage lead to increased security in these areas. This research effort is funded by BMD,
and this report is a product of a 2-year interagency agreement between DHS S&T and DOE.
NREL is a national laboratory of the DOE Office of Energy Efficiency and Renewable Energy
(EERE), operated by the Alliance for Sustainable Energy, LLC.
1.2 Renewable Energy Research Roadmap: Project Overview
Renewable energy technologies include solar photovoltaics (PV), wind energy, geothermal,
hydrokinetic energy, and biomass. Fuel cells—another important technology—use hydrogen to
create energy. Renewable energy technologies have many characteristics that make them
particularly useful for increased border security, including the following.
• Continuity of Operations. In the event of grid failure, on-site renewable energy installations
can continue to operate, maintaining critical loads until grid service can be restored. The
greater the utilization of renewable energy technologies, the longer operations can run
without grid power.
• Remote Operation. A renewable energy technology combined with energy storage can
operate independent of the electricity grid in remote locations, often requiring very little
maintenance to provide service. This can enable new capabilities in remote border-security
operations.
• Covert Operation. Some renewable energy technologies (such as PV) operate silently and
require little maintenance. These characteristics make them very useful in locations where
inconspicuous operations are needed.
1• Reduced Reliance on Infrastructure. In the United States, the aging energy infrastructure
poses a threat to national security. Electricity that is generated near the load reduces the
reliance on the electricity infrastructure, thereby reducing risk.
• Diversification. Employing renewable energy reduces dependence on foreign oil, both
nationally and locally, at the operational level. This helps hedge against increased oil prices
and supply interruptions that could negatively affect performance at the local level. Taking
advantage of renewable energy also reduces dependence on fuels supplied from regions of
conflict.
• Reduced Greenhouse Gas (GHG) Emissions and Sustainable Sources. By definition
renewable energy technologies are clean and sustainable. Unlike the fossil fuels that the
United States relies on for most of its energy—such as coal, natural gas, and oil—renewable
energy technologies are constantly replenished. Furthermore, many of these technologies are
emission-free.
Considering the compelling arguments for integrating renewable energy into border security,
BMD initiated efforts with NREL to examine the energy needs along U.S. borders, especially in
remote areas; to identify opportunities to apply renewable energy solutions today; and to define
the near- and long-term research agendas that will position border components and activities to
take advantage of renewable energy technologies in the future. This report is a result of these
efforts.
Workshops
The NREL staff hosted workshops for DHS BMD component staff. The purpose of these
workshops was to introduce component staff to NREL and to renewable energy technologies,
and to provide an overview of the BMD-NREL project. The workshops also allowed component
staff to brief NREL staff on the mission and operations of the component as well as existing and
future energy needs.
March 19, 2010 (Washington, DC): Introductory Workshop
This workshop was the initial meeting to convene stakeholders and outline the project and
general project strategy. As a result of this workshop, CBP staff members were informed about
this work effort, next steps were defined, and project points of contact (POC) were identified.
June 21, 2010 (Washington, DC): Data Gathering and Application Prioritization
Workshop (CBP/NREL)
At this workshop NREL and CBP personnel presented an overview of each organization’s
mission and organizational structure. CBP personnel next presented an overview of the types of
equipment typically used to accomplish their mission and the types of conditions under which
the equipment typically is used.
There were approximately 25 pieces of equipment identified by generic name or purpose and
manufacturer. Some of these pieces of equipment were grouped based on how they typically
could be connected together to accomplish a specific mission. Workshop attendees then
categorized the equipment into several subcategories that helped define possible power solutions
for each piece of equipment. These categories were based on the following.
• Power consumption range
2• Stealth conditions under which they operate
• Length of time between refueling
• Mobility requirements
A number of considerations were made within each of these categories. One of the assumptions
was that an infinite number of custom power supply sizes probably would be unrealistic as well
as logistically undesirable for CBP. Workshop attendees decided to limit the number of power
supply sizes to five: 1 watt (W), 100 W, 1,000 W, 7,000 W, and 10 kilowatt (kW). These sizes
could accommodate the wattage of the current equipment being operated on the power supplies,
and could be a contingency for the potential addition of equipment in the future.
Units also were initially categorized by their mobility. After the first workshop, attendees
decided that mobility is not the characteristic that most strongly determines a potential solution.
Visibility and the ability to refuel a unit became the more dominant characteristics in the
consideration of a potential solution. Stationary units, which are not mobile, were defined by
how easily they are hidden. Due to its dimensions, a large stationary communications tower
would be difficult to hide visually, and therefore would not require a quiet or hidden power
supply. A small communications device that could be hidden from visibility, however, could
benefit from a stealthy and quiet power supply.
Because it often is difficult to find an off-the-shelf solution that has all the desired features in one
unit, workshop attendees determined that the features desired in each unit should be prioritized in
order of importance. CBP prioritized the following solution characteristics by desirability.
• Stealth (sound, site, dimensional limitations, refueling)
• Type of communications network utilized
• Costs (first cost, operations and maintenance [O&M] costs, carbon costs,
disposal/recycling costs)
• Reliability/robustness of the unit
• Refueling logistics (transportation of the fuel and the type of fuel)
• Time between refueling
• Replacement parts availability
• Preferred procurement methodology (three-bid or sole-source)
Additionally, to formulate an optimum solution, the following information related to the existing
equipment also was requested from CBP.
• Are there alternate manufacturers of these units and is it a custom design?
• What is the range of micro-climates, vegetation conditions, and water availability under
which these units will operate?
• What is the operational energy-consumption profile of these units in terms of peak power
consumption, and what is the duration of this consumption (volts (V), amps (A), watts (W),
phase, alternating current/direct current [AC/DC])?
• Do these units need to operate off-grid?
• Do these units require emergency backup power? If so, at what level of redundancy?
• Is energy, power, or fuel storage needed? If so, why and for how long?
3• What is the length of time between refueling?
• How often does the equipment need to communicate its data back to headquarters?
• What method of communication is preferred?
Another factor that impacts the ability to bring change is the number of devices deployed for
each purpose. The greater the number of devices the more incentive there is to invest in re-
engineering an efficient renewable energy solution.
During the workshop CBP staff listed the following tasks or issues as priorities for their
organization.
• Implementing a mobile surveillance system (MSS) to replace diesel genset
• Reducing the weight and size of packable power supplies to support 5-day missions
• Reducing sound at stealth sites
• Reducing the risk of spills at all sites
• Minimizing the need to resupply at stationary/permanent sites
• Supporting recon 3, implement long-range, hand-held thermal imaging for single-person use
• Developing power solutions for tactical checkpoints and forward operating bases (FOB)
• Powering sensor packages for “low-flyer” threats
o Low-power sensor packages, reduced-power satellite communications link
o 20 W to 50 W
NREL addressed the first seven priorities during a site visit to the southern border stations. The
last item was covered during the Seattle meeting.
July 22–23, 2010 (Bellingham, WA): Northwest Border Low-Flier Workshop
During the June 21 workshop in Washington, DC, CBP requested that NREL personnel attend a
meeting in Bellingham, Washington, that focused on the “low-flying” drug smugglers coming in
through the northern border near Seattle, WA. The NREL staff members also were asked to
present a range of possible power solutions for technologies that could detect low-flying vehicles
in remote sites.
The focus of the workshop was two pronged. The first objective was to decide the technology on
which to spend currently available funding so that a technology solution could be put into place
immediately. The second objective was to strategize a solution for the future and develop
language that could be placed in a request for proposal (RFP) to solicit sensing-technology
solutions from industry professionals. There was some difficulty in developing language that was
sufficiently broad enough to allow the industry maximum leeway to develop creative solutions,
but at the same time to constrain solutions to functional requirements.
There was general agreement by CBP workshop participants that the short-term solution was to
purchase two mobile radar units for immediate deployment. The consensus was that, although
these units likely would be detected and seen by the “low-fliers,” the units also would enable the
channeling of the low-fliers into specific flight paths so CBP could more easily target them.
4Several months later, the scope of the RFP language was approved by the group and turned over
to CBP procurement personnel.
Site Visits
October 26–29, 2010 (El Paso, TX): El Paso Sector
In October 2010, NREL staff visited the El Paso sector. The objective of this site visit was to
gain an understanding of CBP operations along the southern border, and specifically in the El
Paso sector. The visit began with an in-brief to CBP staff. The NREL staff provided an overview
of NREL, renewable energy technologies, and the present project.
The NREL staff outlined site-visit expectations, which primarily encompassed gathering
firsthand knowledge from users of power-consuming systems. The equipment identified as
priorities in the June 21 workshop included:
• MSS
• Powering sensor packages for low-flying threats
• Reducing weight/size of packable power supplies
• Reducing sound, risk of spill, and/or resupply at stationary/permanent sites
• Recon 3
• Tactical checkpoints and FOBs.
During this site visit NREL staff worked to understand everyday operations, applications, and
constraints of these technologies by speaking with operators in the field. The characteristics
associated with energy-using and energy-producing equipment was collected. The staff members
also worked with CBP staff to identify problems, issues, and constraints to future operations. The
site visit included assessments at sector facilities, border patrol stations, border patrol permanent
checkpoints, remote video surveillance system (RVSS) sites, Bridge of the Americas port of
entry, border patrol special operations division, border patrol emergency planning office, border
patrol tactical checkpoint, border patrol FOB, and SBInet (Secure Border Initiative) towers.
April 5–9, 2011 (Juneau, Alaska): Alaska U.S. Coast Guard Operations
In April 2011, NREL staff visited the USCG operations in Juneau, Alaska. The objective of this
site visit was to gain an understanding of USCG operations in Alaska, specifically in the Juneau
area. The visit began with an in-brief to USCG staff. The NREL staff members provided an
overview of NREL, renewable energy technologies, and this project. They next outlined
expectations for the site visit, which primarily encompassed gathering firsthand knowledge from
users of power-consuming systems.
During the site visit NREL staff heard presentations from Rescue-21 (R-21) staff members and
gathered extensive data regarding R-21 power needs. NREL wind turbine researchers
participated remotely (via phone) and learned of the challenges of installing wind turbines on
mountaintops in Alaska, and discussed potential next steps for identifying or creating a
mountaintop-viable wind turbine. The NREL staff members also participated in a meeting with
Alaska Marine Exchange System staff.
52 Renewable Energy Research and Technology Opportunities
Renewable energy technologies can provide sustainable, reliable power for a variety of
applications. Off-the-shelf technologies can be used in the near term to increase border security.
Mid- and long-term research opportunities exist to develop additional technologies that better
improve the operations of DHS components in supporting border security. An overview of a
variety of renewable energy technologies is presented below, along with near-, mid-, and long-
term research opportunities relevant to DHS security operations.
2.1 Solar Technology Overview
PV technologies convert sunlight directly into electricity. There are many different types and
classes of PVs. Commercialized PVs are generally broken down into two categories: thin film
and wafer technologies.
Commercially Available Technologies
Thin-Film Photovoltaics
Thin-film PV technologies generally are deposited on a rigid or flexible substrate. They can be
manufactured in continuous processes, resulting in a lower cost per unit of power produced.
Because they can be deposited on flexible substrates, they also can be rolled up for easy
transport. A number of different types of thin-film technologies exist, including:
• Amorphous silicon, which offers 7% efficiency in available commercial products
• Cadmium telluride, which offers 11% efficiency in available commercial products and is the
current market leader
• CIGS (copper, indium, gallium, selenide), which offers 11% efficiency in available
commercial products.
Wafer Photovoltaics
Wafer PV technologies generally are made of solid silicon wafers, either mono- or poly-
crystalline. Silicon is cast as a single ingot and then sliced into very thin wafers; this wastes
much of the material. Wafer PVs as a rule have greater efficiencies than those of thin-film
technologies. Commercial products with efficiency in the range of 14% to 20% are available.
Multi-Junction Photovoltaics
Other variations of wafer and thin-films include multi-junction PV technologies. These cells
layer different types of PV to capture different spectrums of light, thus increasing the overall
efficiency of the composite PV system. In the past, these have been used in applications
requiring the greatest efficiency for a given area or weight, such as in aerospace applications.
Increasingly, these high-efficiency multi-junction devices (30% efficiency in production) are
being used in systems that concentrate sunlight by up to 500 times using either reflectors or
lenses. Essentially, this allows a very small area of a more expensive and more efficient PV cell
to be used with a larger area of less-expensive reflectors or lens, resulting in a system with a
lesser overall cost per peak watt of power.
6Reported Efficiencies of Photovoltaics
All PV technologies can achieve higher efficiencies when produced in perfect in laboratory
settings, but when these products are produced in factories these lab-based efficiencies drop.
Some of this effect is due to the variability of conditions in the factory setting versus near-perfect
laboratory conditions. Some is also due to manufacturers making cost-benefit decisions as to
how high an efficiency to implement based on how much incremental manufacturing costs will
rise to accomplish that increase in cell efficiency. This manufacturing price (in dollars per peak
watt of electricity produced by the final cell) is generally what manufacturers will use to
determine how high an efficiency to implement in manufacturing. Cells will compete in the
marketplace on price based on the particular features and needs required by different
applications. Where area and weight are important, then customers will generally be willing to
pay higher prices per peak watt for higher efficiencies which will lower the area and weight.
All PV efficiencies quoted in this report are for factory-produced products.
Emerging Photovoltaic Technologies
Emerging PV technologies include dye-sensitized cells (11% efficiency), organic cells (8%
efficiency), and quantum-dot cells, none of which are currently produced commercially. The
main difference of these products is that they can be produced without using silicon; therefore, in
the future, they could be produced at lower costs.
Additionally, in the future quantum-dot technology
could enable PV to be produced at higher efficiencies by Potential Pilot Project
targeting specific wavelengths of light. The areas around the Port of Valdez in Alaska
are off limits to private boaters due to the
A fourth category of emerging PV technology is based possibility of interference with oil tankers
on nano-antenna (a technology-relative of the rectenna) leaving the port. Twenty percent of all U.S. oil
currently is shipped out of this location, making
and would consist of arrays of nano-sized antenna it vital to national security. At present, the only
designed to pick up the radio frequency of the sun’s way to mark these areas is with buoys, which
rays. Only very preliminary steps have been taken to attract seals, which in turn attract pleasure
boaters even more.
determine the feasibility of this concept.
A pilot project utilizing a PV/battery system to
Department of Homeland Security Relevance: provide power for a laser marking tool could be
used to mark the boundary on the water
Photovoltaic Applications surface, replacing the buoys. It also might be
PV panels do not have moving parts, and when possible to power specialized “voice-throwing”
combined with batteries they are very reliable— technology speakers mounted on buoys that
could notify boaters that they are in a restricted
assuming there is sufficient solar resource in the area in area.
which they are being used. Additionally, they operate
silently which affords them a measure of stealth.
Following this line of thought, more efficient cells result in reduced exposed area; therefore the
likelihood that they would be seen is minimized.
Batteries currently comprise approximately 80% of the gear weight that military personnel
typically carry. During site visits to the U.S. southern border, discussions with CBP field
personnel revealed that batteries also comprised a significant load for these CBP covert-
operations field personnel, although this can vary by mission. Border Patrol personnel who are
on remote or clandestine missions could use PV chargers to provide power and thus reduce
battery weight.
7Because DHS operates along the southern border, which experiences some of the country’s best
solar resources; this could potentially reduce the area of PV required to power and recharge the
batteries used by personnel out in the field as well as for covert monitoring and sensing devices.
However PV units used in Alaska would likely require some sort of additional backup power
source besides PV recharged batteries during the winter months when the hours of sunlight are
drastically reduced.
Today’s Opportunities—Off-the-Shelf Applications
Foldable and flexible PV battery chargers can be used to recharge batteries in the field, lessening
the need to carry weighty replacement batteries. Navigational buoys can use PV to charge
batteries during the daytime to power lights, audible signals, or communications signals
operating at night.
Tomorrow’s Potential
NREL currently is working on a pilot project to integrate PV with a portable light-emitting diode
(LED) light tower for use along the southern border of the United States that could dramatically
reduce the need for U.S. Border Patrol personnel to refill the fuel tank on the backup diesel
generator.
NREL also proposed a pilot project utilizing a PV–battery system to provide power for a laser
marking tool used to show the boundary on the water surface around the Port of Valdez in
Alaska. These areas are off-limits to private boaters due to the possibility of interference with
tankers leaving the port. Currently, the only way to mark these areas is with buoys. Buoys attract
seals which, in turn, attract pleasure boaters all the more. Because 20% of all U.S. oil currently is
shipped from this location, the area is vital to national security. It also might be possible to
integrate off-the shelf “voice-throwing” speakers with PV mounted on buoys that could notify
boaters that they are in a restricted area. Both of these applications would save USCG personnel
time and resources by allowing them to easily determine which boats present real threats versus
those which are simply pleasure boats.
It could be possible to utilize high-efficiency, triple-junction PV along with specialized
application-specific batteries to power small distributed-sensor units used to detect low-flying
aircraft transporting drugs over the northern border. Staff members from NREL attended a
workshop in the summer of 2010 aimed at planning future response to this problem. It was
proposed that future units might communicate via satellite. There also are opportunities to utilize
PV to power water-based sensor systems (current—possibly unknown—units, or future units
used to detect vessels). It might be possible to use PV to charge micro-drones used for
surveillance of fishing-vessel intruders. These hovering micro-drones could land in the water and
float until they recharge. Soaring drones might stay aloft indefinitely, riding thermal currents and
charging batteries during the day which then would power motors and keep them aloft at night.
Currently, CBP on the southern borders is experiencing repeated failures of standard PV panels
installed at mountaintop communications sites, due to structural failure caused by high winds.
NREL currently is part of the international committee to establish standards for PV based on
climate-specific regions around the world. Although heat-related failures have not been reported
by CBP personnel, the extreme temperatures in the southwest United States doubtlessly will
require specialized PV technologies to withstand the heat exposure over time. Until an
8international standard has been established, NREL can assist DHS by writing a specification for
purchasing climate-specific PV panels.
Long-Term Applications and Research
It might be possible to create camouflaged solar panels by perfecting a new class of solar panels
based on nano-antenna-based solar-electric devices. This concept is in its infancy and would
require additional research into nano-materials science as well as manufacturing techniques. Due
to the high quantity of direct beam sunlight occurring in the areas along the southern U.S.
borders, DHS may consider establishing concentrating PV arrays at sites along the border to
provide power to border patrol stations, or possibly to power drones that are recharged wirelessly
while hovering near the units.
2.2 Wind
Wind is air that has high kinetic energy, and can be transformed into useful energy via wind-
turbine blades and generators. Uneven heating of the earth’s surface creates wind energy.
Warmed surfaces warm the air. The warm air rises and cooler air rushes in to take its place; the
result is wind. The earth’s rotation—which causes day and night—is responsible for one aspect
of the heating and cooling cycle. Other factors, such as orientation or slope of a surface, or
surfaces that have different rates of reflectivity, absorptivity, and transmissivity also contribute to
uneven heating. Wind also can be affected (accelerated, decelerated, increased turbulence) by
other factors, such as terrain, proximity of bodies of water, buildings, and vegetative cover.
Overall, wind is a diffuse resource that can generate electricity cost effectively and competitively
in many regions.
The economic viability of a wind project is dependent upon the interplay between the wind
resource and the competing cost of electricity. A strong wind resource (Class 5 and Class 6) can
compete against electricity in most areas of the continental United States. A modest wind
resource (Class 2 and Class 3) can compete against high-priced electricity (i.e., New England,
Alaska, Hawaii). Strong wind and the high cost of electricity make wind a compelling option
with a short payback. Low wind and low cost of electricity might not be economically viable for
wind energy.
Technology Overview
During the past decade, wind energy has been the fastest-growing energy technology in the
world, with an annual growth rate in installed capacity of more than 30%. The U.S. wind
industry broke all previous records by installing nearly 10,000 megawatts (MW) of new
generating capacity in 2009. In the first quarter of 2011, the United States had 1,100 MW of new
wind capacity installed, down substantially from the pace of 2007–2009 as the effects of the
recession, reduced access to capital, reduced demand for electricity, and other factors impacted
wind development activities. Current U.S. wind capacity is more than 40,100 MW (AWEA
2011). In the “small wind” market—those less than 100 kW in size—the market grew by 15% in
2009, resulting in 20.3 MW of new installed capacity bringing the total installed capacity to 100
MW (AWEA 2009).
9The wind industry has several distinct sectors, each with its own technology characteristics and
development/deployment strategies that apply.
• Commercial or Utility-Scale Wind: 1-MW to 3-MW wind turbines installed in groups of
30 to 600 at sites with a very good wind resource, to form wind farms that inject clean green
energy onto the utility grid via transmission lines. Much of the wind industry growth is due
to this sector.
• Community-Scale Wind: 20-kW to 1,500-kW wind turbines installed in groups of one to
three on the customer side of the utility meter to reduce the amount of electricity the entity
(community/school/company/etc.) purchases from the utility.
• Residential-Scale Wind: 0.1 kW to 20 kW wind turbines installed at a home or small
business on the customer side of the utility meter to reduce the amount of electricity the
customer purchases from the utility.
Each of these sectors of the wind industry essentially includes different technologies (they all
could be called “wind turbines,” but there are profound fundamental differences), assessment
methods, economics, environmental considerations, and factors that serve as the drivers for those
sectors.
There is a wide range of commercially available wind turbines with very different intended
applications, sizes, orientations, efficiencies, and cost structures. There is no one design or size
that is “the best in all applications”; rather, there are applications that favor certain sizes and
designs, as they provide the better relative economics and performance within the application-
driven constraints.
Installed cost ranges similarly are quite broad, as both the turbines and the construction factors
can vary widely. Over the past 3 to 4 years, the typical installed costs of utility-scale turbines
range from approximately $1,500/kW to $2,500/kW. The cost of electricity generated has been
in the $0.04/kWh to $0.08/kWh range over this period (Wiser and Bolinger 2009). Well-sited
small wind turbines can cost in the $3,000/kW to $6,000/kW range installed, with variations due
to installation and construction cost variations, availability and quality of state or utility
incentives, and wind resource. The resultant cost of electricity produced could be in the
$0.15/kWh to 0.20/kWh range (Windustry 2011). Poorly sited small turbines can produce
electricity in the $0.20/kWh to 0.50/kWh range.
For the USCG, the need to supply reliable, less-costly power for the communications systems on
remote mountaintops makes residential-scale wind turbines most applicable, although the wind
turbines to consider typically would not be considered to be within the residential market. The
turbines recommended for these remote locations are the most stalwart models produced by
companies that specialize in robust wind turbines.
Commercially Available Technologies—Current/Future Research Trends
The primary thrust of current research efforts is toward utility-scale wind turbines focused on the
following.
• Reducing installed costs of large land-based wind turbines
• Increasing turbine efficiency in wind energy conversion and electricity production
10• Reducing the cost of electricity produced by large offshore wind turbines
• Addressing renewable systems integration rules, impacts, operating strategies, and system
planning to promote wind competing without disadvantage against other energy-generation
technologies
• Expanding and promoting deployment of distributed wind turbines across the United States
to achieve fivefold increase in unit deployment from 2007 through 2015
• Facilitating technology acceptance of utility-scale wind such that at least 30 states achieve
100 MW of installed wind capacity with at least 15 states achieving at least 1,000 MW
In the smaller turbine market, the market drivers are:
• Improving efficiencies in blades, alternators, and inverters
• Reducing number of components and overall amount of materials to reduce installed costs
• Establishing certification facilities and protocols for small wind turbine certification;
• Improving reliability and decreasing O&M costs
• Enabling cost-effective wind resource assessment for small turbines and projects.
Wind Characteristics
Wind resources are very site specific. Different sites in close proximity to each other, but with
varying topographical features (e.g., ridges versus valleys, canyons versus mountains),
vegetation (i.e., tall trees versus grassland or cropland), and surface roughness (i.e., city
skyscrapers versus flat or rolling farmland), can have entirely different wind regimes. One could
prove to be economic and another might not.
Wind Power
Multi-Agency Collaboration
The amount of wind varies with the season, time of
day, and weather events. The wind speed at any given DOE created the Federal Wind Siting Information
time determines the amount of power available in the Center to provide wind developers and wind
wind and subsequently the power that can be captured project managers with current information
regarding wind turbine impacts on airport and
using a wind turbine generator. The power available in military radar systems, NEXRAD (weather) radar
the wind is given by the following equation. systems, and military operations.
This multi-agency collaborative effort provides
P = A ρV3/2 valuable initial siting information and feedback
for all levels of wind development from
Where community wind through large scale wind farms.
(www.eere.energy.gov/windandhydro/federalwin
dsiting/radar.html)
P = power of the wind (watts)
A = windswept area of the rotor (blades) = π
D2/4 = π r2 [m2] (π r2 [10.76 ft2])
ρ = density of the air [kg/m3] (2.2 lb/3.28 ft3) (at sea level at 15°C)
V = velocity of the wind [m/s] (3.28 ft/sec)
11Wind power (P) is proportional to velocity cubed (V3). Therefore, if wind velocity is doubled
then wind power increases by a factor of eight (23 = 8). Consequently, small differences (e.g.,
increases) in average speed cause significant differences (e.g., increases) in energy production.
To understand the wind resource at a particular site, a wind assessment typically is undertaken
using a tall met tower equipped with anemometers to measure wind speed at multiple heights,
wind vanes to measure wind direction, and temperature and atmospheric pressure sensors. These
sensors and the data collected help to inform a number of important turbine and siting
parameters. One factor of great interest to turbine manufacturers is turbulence.
Turbulence
The turbulence intensity (TI) is defined as the standard deviation of the wind speed within a time
step divided by the mean wind speed over that time step; TI is a measure of wind gustiness. High
turbulence can lead to increased turbine wear and potentially increased O&M costs. At reduced
wind speeds, the calculated turbulence intensity often is high but the impact of the turbulence is
of little consequence to the wind turbine itself due to the low wind speeds. Turbulence at greater
winds speeds is of more interest and concern to wind turbine manufacturers, as it increases wear
and tear on many turbine components and can lead to premature failure.
Wind Turbine Technologies
There are a variety of commercially available wind turbine technologies for using wind energy to
make electricity. Wind turbines should be designed to be robust yet efficient, and lightweight but
sturdy. Turbines have rotors—also known as airfoils—that capture the kinetic energy of the wind
and translate it into a rotational force that turns the rotor mechanically. The rotor is attached to a
drive shaft that typically is attached to a gearbox or other electricity conversion mechanism. The
design of the airfoil determines whether the rotor (and turbine) is classified as a “lift” or a “drag”
wind turbine.
Air flowing over a stationary airfoil produces two forces—lift and drag. A lift force is
perpendicular to the air flow and drag force is in the same direction of the air flow. A primary
difference between the two as it relates to electricity production and efficiency is that the rotor of
a drag wind turbine can spin no faster than the wind acting on the blade. However, a lift turbine,
due to the pressure differential as the flowing air moves to an area of low pressure to get around
the airfoil, can produce rotational speeds at the tip of the rotor that are much greater than the
speed of the wind. The term "tip speed ratio" is defined by the angular velocity of the rotor tip
compared to the velocity of the wind.
Wind turbines are designed to be well-balanced, symmetrical machines that minimize friction to
maximize the mechanical energy transformed into electrical energy. Turbulent winds can cause
imbalanced thrust loads into the rotor, leading to increased wear and tear on shafts, gear boxes,
and bearings and resulting in premature failure. Ice loading on rotors, as expected to be experi-
enced on mountaintop locations in Alaska, can rapidly create extreme imbalance conditions that
can lead to catastrophic premature failure. Routine O&M is a necessary aspect of the long-term
viability of any turbine. Occasionally, repair and replacement of worn parts (e.g., gears, blades,
shafts) are needed for a turbine to achieve its normal operating parameters.
12You can also read