Chapter IV - Department of Energy
←
→
Page content transcription
If your browser does not render page correctly, please read the page content below
Chapter IV

         ENSURING ELECTRICITY
         SYSTEM RELIABILITY,
         SECURITY, AND RESILIENCE

         This chapter addresses a range of possible risks to the electricity system and
         the broader economy, and it suggests options to mitigate and prepare for
         these risks. The first section explores the changing nature of reliability—the
         ability of the system to withstand sudden disturbances such as electric short
         circuits or unanticipated loss of system components—in the future electricity
         system. The next section examines existing and growing vulnerabilities for
         the electricity system and opportunities to address these vulnerabilities,
         including cybersecurity risks, interdependency of electricity with other critical
         infrastructures, and increased risk due to worsening global climate change.
         The final section focuses on enhancing the resilience of the system to minimize
         disruptions of service and return rapidly to normal operations following adverse
         events.

                             Transforming the Nation’s Electricity System: The Second Installment of the QER | January 2017   4-1
Chapter IV: Ensuring Electricity System Reliability, Security, and Resilience

          FINDINGS IN BRIEF:
          Ensuring Electricity System Reliability, Security, and Resilience

          •      The reliability of the electric system underpins virtually every sector of the modern U.S. economy. Reliability of the grid is a
                 growing and essential component of national security. Standard definitions of reliability have focused on the frequency, duration,
                 and extent of power outages. With the advent of more two-way flows of information and electricity—communication across the
                 entire system from generation to end use, controllable loads, more variable generation, and new technologies such as storage
                 and advanced meters—reliability needs are changing, and reliability definitions and metrics must evolve accordingly.
          •      The time scales of power balancing have shifted from daily to hourly, minute, second-to-second, or millisecond-to-millisecond
                 at the distribution end of the supply chain, with the potential to impact system frequency and inertia and/or transmission
                 congestion. The demands of the modern electricity system have required, and will increasingly require, innovation in technologies
                 (e.g., inverters), markets (e.g., capacity markets), and system operations (e.g., balancing authorities).
          •      Electricity outages disproportionately stem from disruptions on the distribution system (over 90 percent of electric power
                 interruptions), both in terms of the duration and frequency of outages, which are largely due to weather-related events. Damage
                 to the transmission system, while infrequent, can result in more widespread major power outages that affect large numbers of
                 customers with significant economic consequences.
          •      As transmission and distribution system design and operations become more data intensive, complex, and interconnected, the
                 demand for visibility across the continuum of electricity delivery has expanded across temporal variations, price signals, new
                 technology costs and performance characteristics, social-economic impacts, and others. However, deployment and dissemination
                 of innovative visibility technologies face multiple barriers that can differ by the technology and the role each plays in the
                 electricity delivery system.
          •      Data analysis is an important aspect of today’s grid management, but the granularity, speed, and sophistication of operator
                 analytics will need to increase, and distribution- and transmission-level planning will need to be integrated.
          •      The leading cause of power outages in the United States is extreme weather, including heat waves, blizzards, thunderstorms, and
                 hurricanes. Events with severe consequences are becoming more frequent and intense due to climate change, and these events
                 have been the principal contributors to an observed increase in the frequency and duration of power outages in the United
                 States.
          •      Grid owners and operators are required to manage risks from a broad and growing range of threats. These threats can impact
                 almost any part of the grid (e.g., physical attacks), but some vary by geographic location and time of year. Near-term and
                 long-term risk management is increasingly critical to the ongoing reliability of the electricity system.
          •      The current cybersecurity landscape is characterized by rapidly evolving threats and vulnerabilities, juxtaposed against the
                 slower-moving deployment of defense measures. Mitigation and response to cyber threats are hampered by inadequate
                 information-sharing processes between government and industry, the lack of security-specific technological and workforce
                 resources, and challenges associated with multi-jurisdictional threats and consequences. System planning must evolve to meet
                 the need for rapid response to system disturbances.
          •      Other risk factors stem from the increasing interdependency of electric and natural gas systems, as natural gas–fired generation
                 provides an increasing share of electricity. However, coordinated long-term planning across natural gas and electricity can be
                 challenging because the two industries are organized and regulated differently.
          •      As distributed energy resources become more prevalent and sophisticated—from rooftop solar installations, to applications
                 for managing building electricity usage—planners, system operators, and regulators must adapt to the need for an order of
                 magnitude increase in the quantity and frequency of data to ensure the continuous balance of generation and load.

4-2      Transforming the Nation’s Electricity System: The Second Installment of the QER | January 2017
FINDINGS IN BRIEF:
   Ensuring Electricity System Reliability, Security, and Resilience (continued)

   •   Demand response and flexibility technologies—such as hydropower and storage—offer particularly flexible grid resources that
       can improve system reliability, reduce the need for capital investments to meet peak demand, reduce electricity market prices,
       and improve the integration of variable renewable energy resources. These resources can be used for load reduction, load
       shaping, and consumption management to help grid operators mitigate the impact of variable and distributed generation on the
       transmission and distribution systems.
   •   Information and communications technologies are increasingly utilized throughout the electric system and behind the meter.
       These technologies offer advantages in terms of efficient and resilient grid operations, as well as opportunities for consumers to
       interact with the electricity system in new ways. They also expand the grid’s vulnerability to cyber attacks by offering new vectors
       for intrusions and attacks—making cybersecurity a system-wide concern.
   •   There are no commonly used metrics for measuring grid resilience. Several resilience metrics and measures have been proposed;
       however, there has been no coordinated industry or government initiative to develop a consensus on or implement standardized
       resilience metrics.
   •   Low-income and minority communities are disproportionately impacted by disaster-related damage to critical infrastructure.
       These communities with fewer resources may not have the means to mitigate or adapt to natural disasters, and they
       disproportionately rely on public services, including community shelters, during disasters.
   •   This chapter was developed in conjunction with the closely related and recently published “Joint United States-Canada Electric
       Grid Security and Resilience Strategy.”

Reliability, Resilience, and Security: Grid Management and
Transformation
Traditional electricity system operations are evolving in ways that could enable a more dynamic and integrated
grid. The growing interconnectedness of the grid’s energy, communications, and data flow creates enormous
opportunities; at the same time, it creates the potential for a new set of risks and vulnerabilities. Also, the
emerging threat environment—particularly with respect to cybersecurity and increases in the severity of
extreme weather events—poses challenges for the reliability, security, and resilience of the electricity sector, as
well as to its traditional governance and regulatory regimes.

The concepts of reliability, security, and resilience are interrelated and considered from different perspectives.
Meeting consumer expectations of reliability is a fundamental delivery requirement for electric utilities, where
reliability is formally defined through metrics describing power availability or outage duration, frequency, and
extent. The utility industry typically manages system reliability through redundancy and risk-management
strategies to prevent disruptions from reasonably expected hazards.

                                                        Transforming the Nation’s Electricity System: The Second Installment of the QER | January 2017   4-3
Chapter IV: Ensuring Electricity System Reliability, Security, and Resilience

          Grid Reliability, Security, and Resilience

          •      For purposes of this discussion, reliability is the ability of the system or its components to withstand instability, uncontrolled
                 events, cascading failures, or unanticipated loss of system components. Resilience is the ability of a system or its components to
                 adapt to changing conditions and withstand and rapidly recover from disruptions. Security refers specifically to the ability of a
                 system or its components to withstand attacks (including physical and cyber incidents) on its integrity and operations.

      Delivery of electricity service has been consistently and highly reliable for most of the century-long
      development, expansion, and continuous operation of grids across all regions of the Nation. The traditional
      definition of reliability—based on the frequency, duration, and extent of power outages—may be insufficient
      to ensure system integrity and available electric power in the face of climate change, natural hazards, physical
      attacks, cyber threats, and other intentional or accidental damage; the security of the system, particularly
      cybersecurity, is a growing concern.

      Resilience is the ability to prepare for and adapt to changing conditions, as well as the ability to withstand and
      recover rapidly from disruptions, whether deliberate, accidental, or naturally occurring.1 While resilience is
      related to aspects of both reliability and security, it incorporates a dynamic response capability to reduce the
      magnitude and duration of energy service disruptions under stressful conditions.2 Infrastructure planning
      and investment strategies that account for resilience typically broaden the range of risk-reduction options
      and improve national flexibility through activities both pre- and post-disruption, while also focusing on the
      electricity-delivery outcomes for the consumer.

      U.S. policies, markets, and institutional arrangements must evolve to reflect new electricity system realities
      and trends—continuing to enable and enhance the reliability, security, and resilience of the electric grid. The
      Department of Energy (DOE), the Federal Energy Regulatory Commission (FERC), the North American
      Electric Reliability Corporation (NERC), regional planning authorities, utilities, power system operators,
      states, and other organizations work together to ensure the reliability of the U.S. power system through the
      implementation of reliability standards, timely planning and investment, and effective system operations and
      coordination.

      The Changing Nature of Reliability
      Electricity customers have high expectations of electricity reliability from their utility providers. Virtually
      every sector of the modern U.S. economy depends on electricity—from food production, to banking, to health
      care. Critical infrastructures like oil, gas, transportation, and water all depend on electricity, and the electric
      system depends on them. This places a high premium on reliability.

      Standard Measures of Reliability
      A brief review of how reliability is measured today will help define the playing field and the associated value at
      stake. From the utility industry perspective, reliability is formally defined through metrics describing power
      availability or outage duration, frequency, and extent. Reliability within the utility industry is managed to
      ensure the system operates within limits and avoids instabilities or the growth of disturbances. These practices
      are not static, and utilities continue to improve their reliability practices and implementation methods to
      reflect increased consumer expectations. Typical approaches to reliability include hardening, investment, and
      redundancy to prevent disruptions from reasonably expected hazards.

4-4      Transforming the Nation’s Electricity System: The Second Installment of the QER | January 2017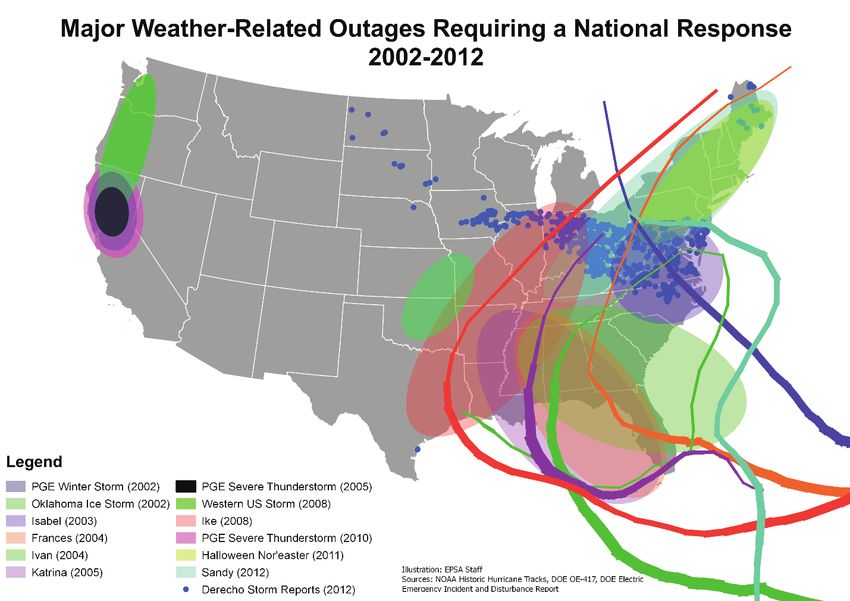
Figure 4‑1. System Average Interruption Duration Index by State, 20153

                                                                                                                                               Washington
                                                                                                                                               D.C.

                                                                                                 SAIDI in 2015 with Major Events (Minutes)
                                                                                                     36–126                    401–597
                                                                                                     127–243                   598–829
                                                                                                     244–400

States experienced varying levels of reliability in 2015. A reliable bulk power system does not necessarily mean reliable end-user electricity service
because outages often originate on local distribution systems, as reflected in the SAIDI measurements in the above map.

Most state and Federal regulators have significant experience addressing system reliability and currently
consider the issues of resilience and security through the lens of existing reliability tools, approaches, and
metrics. One metric applied with the goal of improving system performance with respect to reliability
indicators is the System Average Interruption Duration Index (SAIDI). SAIDI measures the total duration of
an interruption for the average customer given a defined time period. Typically, it is calculated on a monthly or
yearly basis. Another metric, the Customer Average Interruption Duration Index (CAIDI), measures how long
it takes to restore the system once an outage occurs. And, the System Average Interruption Frequency Index
(SAIFI) measures the average number of times that a customer experiences an outage during the year. SAIFI is
calculated by dividing SAIDI by CAIDI. As most outages occur on the distribution system rather than the bulk
power system, these reliability indices are commonly used to measure distribution level reliability. NERC uses
a number of bulk power system reliability indices.4

Based on these reliability measures, the average customer experiences 198 minutes of electric power
unavailability per year,a, 5 although there is significant variability among states and utility providers. The best-

a
    Analysis is based on 2016 Energy Information Administration (EIA) data. Information reported to EIA is estimated to cover
    approximately 90 percent of electricity customers.

                                                             Transforming the Nation’s Electricity System: The Second Installment of the QER | January 2017   4-5
Chapter IV: Ensuring Electricity System Reliability, Security, and Resilience
performing state had a SAIDI level of 85 minutes a year. In contrast, as shown in Figure 4-1, one state had a
SAIDI statistic in 2015 of nearly 14 hours of outage for the year, with an availability level of 99.84 percent. Even
this state level of aggregation masks some outliers in the data. There were several utilities with a SAIDI index
below 1 minute of outage for the year.
There are, however, caveats to these findings. First, the variability of reliability performance is a function of a
myriad of factors, including regional differences, varying regulatory standards, costs, system configuration,
customer density, hazard exposure, and other. Also, utilities have historically reported SAIDI, SAIFI, and
CAIDI statistics in inconsistent ways; for example, some utilities include data associated with “major events”
in their public reporting to public utilities commissions, while others do not.6 Utilities also take inconsistent
approaches to defining “major events.”7 The lack of uniform national data inhibits more sophisticated analysis
of macro trends in distribution reliability—something that is important to remedy in an electricity sector that
is increasingly data intensive.
Also, although the predecessor to today’s NERC was first formed in 1968 to address system reliability, the
Institute of Electrical and Electronics Engineers (IEEE) Standard 1366 only formally defined industry
reliability metrics in 1998.8 The Energy Information Administration (EIA) began collecting distribution-level
reliability data, including SAIDI and SAIFI information, in 2013—marking increased attention and effort on
the reliability front. Yet, even today, only 33 percent of utilities report these statistics, covering 91 percent of the
electricity sales in the Nation, which indicates that there is room for improving reliability reporting practices.9
There are other reliability measures and associated government reporting requirements as well. NERC, for
example, collects the additional data it needs to promulgate reliability and security standards, but it does not
make all of these data available to government agencies. Beyond reliability, a number of resilience metrics and
measures have been proposed; however, there has not been a coordinated industry or government initiative to
develop consensus or implement standardized resilience metrics, though the Grid Modernization Laboratory
Consortium is launching the Foundational Metrics Analysis project to develop some resilience metrics.10
Time Scales and Grid Reliability
Throughout the 20th century, the design of power systems and early metrics (such as the loss of load
expectation) focused on periods of maximum consumer electricity use. With more controllable loads, more
variable generation, new technologies (such as storage), and the increasing importance of power system
reliability, reliability is becoming a more complex concept, and reliability metrics and criteria must evolve
accordingly.
Adequacy of generation resources is measured by a utility’s reserve margin and has traditionally meant
the extent to which utilities have adequate infrastructure to generate electricity to meet customers’ needs.
Generation reliability criteria is focused on installed generation to meet customer demand; the role of the
customer as a system resource was not a consideration.
For vertically integrated systems, grid operators manage the entire electricity supply chain from end
(generation) to end (delivery service). When new market structures were created across many U.S. regions in
the form of independent system operators (ISOs) or regional transmission organizations (RTOs), end-to-end
management was replaced with competing power generators. In these markets, variable generation may be the
lowest cost generation; and, generation from certain power stations may not be accepted to run because they
are not cost competitive for a specific day’s operations. However, if a generator is deemed critical to system
integrity, power stations can get “reliability must run” payments. These out-of-market payments, in turn, lower
power market prices, which has been especially problematic for certain types of generation such as nuclear,
which already faces challenges from low power prices due to the relatively low capital, operations, and fuel
costs of natural gas–fired generators.
4-6 Transforming the Nation’s Electricity System: The Second Installment of the QER | January 2017Figure 4‑2. System Reliability Depends on Managing Multiple Event Speeds11
Frequency
One AC Service Restoration
Regulation
Cycle (from Outages)
Variable Energy
Non-Market Protective Relay Resource Hour-Ahead Day-Ahead Capacity Planning for
Operations Inertial Deviations Dispatch Scheduling Markets Carbon Goals
Market
Response Demand T&D
Hybrid Response Planning
10-6 10-3 100 103 106 109 seconds
millisecond second minute hour day year decade
Markets are used for traditional grid operations, including hour-ahead, day-ahead, and capacity markets. Long-term planning reaches beyond typical
market and financial signals. Acronyms: transmission and distribution (T&D), alternating current (AC).
Supply variabilityb is an important part of system operations, where ISOs/RTOs must ensure that risks of
unexpected loss or variability of supplies are hedged by having some power plants immediately available
(spinning reserves) and other plants able to supply power with short-term notifications of need (non-spinning
reserves).
These adjustments to power flow management occur within the general framework of grid operations. This
framework has historically been well understood by grid operators because the time dimensions of operations
have not changed significantly, even when ISOs/RTOs were given responsibility for transmission system
management. These dimensions, which operators have historically understood well, are seen in Figure 4-2 on
the right side of the continuum, where the time scales of capacity markets, day-ahead, and hour-ahead products
are depicted. For out-years beyond capacity contracts, traditional transmission and distribution system planning
methods work to map and price investment requirements to ensure long-term grid reliability. Planning for
decarbonization and climate resilience reaches beyond typical planning horizons for grid operators.
Changing Time Dimensions, Grid Topology, and Emerging Grid Management Challenges
Variable energy resources (VER) provide a range of benefits to utilities and their customers, including avoided
fuel costs, greenhouse gas emissions, and costs associated with environmental compliance.12, 13 In some cases,
distributed VER are also credited with providing electric reliability and resilience benefits, particularly in the
context of microgrids.14
However, the widespread integration of VER at both utility scale and distributed across all consumer
segments significantly expands the time dimensions in which grid operators must function, and it complicates
operations. It underscores the need “to coordinate time and space within the electric grid at greater resolution
or with a higher degree of refinement than in the past.”15 A recent White House report noted, “The distinctive
characteristics of [VER] will likely require a reimagining of electricity grid management.”16
Impacts on transmission and distribution systems and integration options vary by scale. For instance,
utility-scale solar power flowing onto high-voltage transmission lines can be smoothed and firmed up at
the point of production by using smart inverters and storage. When onshore wind plants are integrated at a
b
As used here, variability refers to the difference between the expected and actual load or generation.
Transforming the Nation’s Electricity System: The Second Installment of the QER | January 2017 4-7Chapter IV: Ensuring Electricity System Reliability, Security, and Resilience
large geographic scale, lower correlation factors can smooth out variability. Assuming these aggregations are
visible to grid operators to adequately assess both their costs and benefits, many aggregated distributed solar
installations can smooth out the random variations from individual installations.
The time dimensions in which grid operators must function to accommodate the unique characteristics
of VER and distributed energy resources (DER) are identified in the hourly, to minute, to second intervals
(Figure 4-3). While grid operations are successfully managed today in some markets with relatively high
levels of VER penetration,17 this can complicate grid management. Consider a generic example of utility-scale
generation portfolio management in a high VER supply system. Power supplied from solar stations has two
types of variability to manage: minute-to-minute fluctuations and the dramatic drop in power supplied from
solar as the sun goes down. This drop can be precipitous and occur within an hour or less.
Figure 4‑3. System Reliability Depends on Managing Multiple Event Speeds18
Markets are used for grid operations in the order of seconds to minutes, such as frequency regulation and demand response (DR). Some essential
Frequency
One AC Service Restoration
Regulation
Cycle (from Outages)
Variable Energy
Non-Market Protective Relay Resource Hour-Ahead Day-Ahead Capacity Planning for
Operations Inertial Deviations Dispatch Scheduling Markets Carbon Goals
Market
Response Demand T&D
Hybrid Response Planning
10-6 10-3 100 103 106 109 seconds
millisecond second minute hour day year decade
reliability capabilities, such as inertial response, occur faster than typical market signals. Acronyms: transmission and distribution (T&D), alternating
current (AC).
Grid dispatch (actions that operators take to engage power suppliers to provide power to the grid) occurs
around load changes, traditionally referred to as load-following activities. In grids with ISO/RTO wholesale
markets, economic dispatch occurs based on which generators win daily auctions and produce power for
the grid. ISOs/RTOs also load follow for grid management, and in regions with high VER production, load
following and load shaping may provide linked challenges.
By calling or not calling on generators to produce electricity, grid dispatch determines the value that power
producers obtain from their assets. Grid dispatch ensures system reliability through management of operating
generators, as well as those waiting to be called if needed. In a world of subsecond decision making, dispatch
effectiveness will require the integration of automated grid management, with continuing human oversight.
The pace of change may dictate faster adaptation times for grid operators, but grid reliability may dictate a
more methodical consideration of operating protocol changes, which are driven by changes in the types, scale,
scope, and location of power supplies. Continuous engagement of grid dispatchers in planning for the 21st-
century grid is essential.
VER fluctuations on the bulk power side of the equation can be mitigated by regulating power flows onto the
grid—both up and down and from minute to minute. Mitigating power flows can occur with resources and
4-8 Transforming the Nation’s Electricity System: The Second Installment of the QER | January 2017services such as regulation that respond in one to several seconds; through process-flow techniques involving
ramping up and throttling down generation plants; via transmission system blending with flexible resources
such as hydro; and through demand response (DR) (including advanced water infrastructure),19 which can be
used to align demand with supply variations for grid services, including frequency regulation.
Variability is managed through geographic diversity and aggregation. FERC (through NERC) requires
balancing authorities to constantly match supply and demand within their respective balancing areas.c, 20 Larger
balancing areas could help manage variability by sharing generation resources to smooth out supply. A recent
National Renewable Energy Laboratory analysis concluded that, “consolidated operations of two or more
balancing authorities fully captures the benefits of geographic diversity and provides more accurate response.”21
For example, the integration of PacifiCorp into the California ISO Energy Imbalance Market reduced the
amount of required flexibility reserves by about 280 megawatts (MW), or 36 percent.22
While there is ramping associated with all generation technologies, because of their variability, baseload
generators must ramp more frequently to accommodate VER. Ramping to match supply and demand can reduce
the efficiency of baseload generators, possibly decrease their ability to recover capital costs, and increase fossil
unit emission rates. Innovation to improve baseload generators’ ramping capability is an important need that
will become more important at high levels of VER. Recent analysis suggests that “…High renewable energy
penetrations could significantly change dispatch requirements and use of conventional generators.”23 Also, price
suppression is occurring in RTO/ISO wholesale markets, with noticeable amounts of wind and solar generation
(and low-cost gas generation). While passing on savings to consumers is desirable, in some regions, these low
prices have put pressure on baseload units, particularly zero-carbon emissions nuclear generation.
Better forecasting has also reduced VER integration costs. Most North American power markets dispatch
wind plants along with conventional power plants based on current grid conditions and economics.24 Setting
wind generator schedules as close as possible to the dispatch time minimizes forecast errors, and using wind
forecasting can greatly facilitate wind integration and reduce costs from carrying reserve capacity.25
Another complication, as noted earlier, is that system operators dispatch the least-cost mix of generation
needed to meet load; these least-cost sources are often VER sources, which are fueled by the sun or the wind
and therefore have low or zero marginal cost of production. In New England, as additional variable resources
have come online, there has been “more frequent localized [transmission] congestion.”26 In the past, congestion
was reduced by the system operator “through manual curtailment instructions that [were] not reflected in
Real-Time Prices,” causing a “mismatch” of signals, when generators who would normally respond to high
prices by increasing output were instead told to decrease output in order to maintain reliability.27 The system
operator has undertaken several steps to address these challenges, and in April 2016, wind and hydro resources
were designated as automated dispatch.28 Going forward, the system operator will require a series of actions to
further integrate VER sources.29 Specifically, on October 12, 2016, ISO New England filed proposed revisions
to its Transmission, Markets, and Services Tariff with FERC, which in part were made to “more directly
incorporate non-dispatchable, intermittent power resources into [market pricing]”, and on December 12, 2016,
FERC issued an order accepting the proposal.30, 31
Another example of the changes to grid management made in response to increasing penetrations of VER is
seen in the California market. Under existing operations, the California ISO found that “the fleet of resources
committed…to provide energy often does not provide sufficient flexible ramping capability…to meet the
c
A balancing authority “integrates resource plans ahead of time, maintains demand and resource balance within a Balancing Authority
Area, and supports interconnection frequency in real time.” The Balancing Authority Area (shortened here to Balancing Area) is the
“collection of generation, transmission, and loads within the metered boundaries of the Balancing Authority.” From North American
Electric Reliability Corporation (NERC), “Glossary of Terms Used in NERC Reliability Standards,” NERC, last modified November
28, 2016, http://www.nerc.com/files/glossary_of_terms.pdf.
Transforming the Nation’s Electricity System: The Second Installment of the QER | January 2017 4-9Chapter IV: Ensuring Electricity System Reliability, Security, and Resilience
actual changes in net load.”32 As a result, the operator must “dispatch units out of economic sequence, or
dispatch units that are not in the market,” imposing “additional costs on the system” and creating “prices
[that] do not reflect such marginal costs.”33 In California, the ISO addressed this issue by amending its tariff to
“enhance the CAISO [California ISO] ability to manage the ramping capacity necessary to meet changes in net
load—both forecasted and unexpected.”34
Real-time wind penetration in the Southwest Power Pool (SPP) has, at times, approached 40 percent of
generation.35 Between March 2016 and May 2016, wind accounted for 21.5 percent of all energy generated in
SPP.36 In examining scenarios with significantly more VER, SPP found that new procedures “would enable the
SPP transmission system to reliably handle up to…60% wind penetration”37 while lowering overall costs and
reducing price volatility.38 These new procedures include increasing the dispatchability of renewable resources,
adding additional transmission capacity, enhancing ancillary services, and adding new tools to manage inter-
hour ramps.39
In the Pacific Northwest, an increase in wind generation has meant that the operator must “dispatch units out
of economic sequence, or dispatch units that are not in the market,” imposing “additional costs on the system”
and creating “prices [that] do not reflect such marginal costs.”40 Additionally, an increase in wind generation
has meant that “utilities must hold more resources in reserve to help balance demand minute-to-minute,”
increasing “the need for system flexibility.”41 The Northwest Power and Conservation Council anticipates,
however, “that the region will have sufficient generation and demand side capability on its existing system to
meet balancing and flexibility reserve requirements over the next six years if [the region’s] energy efficiency
and demand response development goals are achieved.”42
Hydropower provides a variety of essential reliability services that are beneficial to the electricity system. One
example is regulation and frequency response (including inertia), in which hydropower generators can quickly
respond to sudden changes in system frequency, making hydro a very suitable complement to wind generation.
Other essential reliability services include spinning and supplemental reserves enabled by high ramping
capability, reactive power and voltage support, and black start capability.
Despite hydropower’s technical ability to provide essential reliability services, these services are not always
explicitly compensated by existing market structures. For example, hydropower is one of the main providers
of inertia and primary frequency response in the Western Electricity Coordinating Council, but it is not
explicitly compensated for either service.43 Some recent market advances have been made that allow greater
ancillary service participation. For example, FERC now requires ISOs to better compensate generators for
frequency regulation services based on their response speed and flexibility to respond to a range of situations.44
In addition, in June 2016, FERC issued Order No. 825, requiring all RTOs and ISOs to implement subhourly
settlements, allowing more accurate alignment of the services provided with the prices paid for them. Market
rules governing participation of flexible resources, such as hydropower and pumped storage, could be reviewed
to determine if additional changes could allow these resources to participate more effectively and ensure just
and reasonable compensation.
Part of the challenge facing hydropower lies in the difficulty of optimizing the limited generating ability of
hydro resources due to non-market environmental and competing use constraints. Determining the best use of
hydro resources through manual dispatch or market-based bidding process can be difficult because the value
of essential reliability services can change quickly due to a number of factors, including location, day, time,
regulatory constraints, and interaction with other generators. Moreover, in the long term, the best use of hydro
resources may evolve as the generation mix changes.45 Essential reliability services are, however, undervalued
in some existing market structures.
4-10 Transforming the Nation’s Electricity System: The Second Installment of the QER | January 2017On the consumer side of the utility meter, consistent growth in DER (of which distributed VER are a subset)
has also changed how grid operators sustain high system reliability at both the distribution and transmission
levels of electricity delivery. DER represent a broad range of technologies that can significantly impact how
much, and when, electricity is demanded from the grid, and they include distributed generation (DG) and
storage technologies, as well as DR.46 Consumers with rooftop solar may influence their demand frequently
and in diverse ways. This can impact total load (tending to reduce it) but may not be directly controlled by grid
operators. Other DER, such as truly dispatchable DR, can be directly managed and called by grid operators
when needed.
Deployment of distributed VER places additional design and operational requirements on distribution grid
operators. Currently, distribution systems are predominantly radial networks (feeders) delivering grid-supplied
power to customer premises. With significant penetration of distributed generation, some distribution utilities
are facing new demands to interconnect multiple feeders together to accept customer-generated power and
to be able to balance generation and demand. The new structure and roles of distribution systems will require
development of advanced distribution circuits and substations to enable significant two-way power flows, new
protection schemes,d and new control paradigms.
d
Protection schemes identify coordinated corrective actions to detect and address abnormal system conditions (e.g., faults).
Grid Frequency Support from Distributed Inverter-Based Resources in Hawaii
Hawaii leads the United States in the portion of its electricity that is produced from variable renewable sources, and as an island state,
it cannot rely on neighbors to help balance generation and load. Hence, the Hawaiian Electric Companies are currently experiencing
the bulk system frequency stability impacts that mainland U.S. power systems will experience in the coming years and decades.e The
Grid Modernization Laboratory Consortium will develop, simulate, validate, and deploy practical solutions that enable distributed
energy resources (DER) to help mitigate bulk system frequency contingency events on the fastest time scale (milliseconds to seconds).f
The project will examine the ability to leverage the fast response capability of power electronics to enable photovoltaic inverters
and storage inverters to support grid frequency starting a few fractions of a second after the appearance of a frequency event. The
capabilities of currently available products to provide rapid frequency response will be characterized, and new capabilities will be
developed with a goal of maximizing DER’s ability to support grid frequency stability.
e
William Parks, Kevin Lynn, Carl Imhoff, Bryan Hannegan, Charles Goldman, Jeffery Dagle, John Grosh, et al., Grid Modernization Multi-
Year Program Plan (Washington, DC: Department of Energy, November 2015), 2, https://energy.gov/sites/prod/files/2016/01/f28/Grid%20
Modernization%20Multi-Year%20Program%20Plan.pdf.
f
“Pioneer Regional Partnerships,” Grid Modernization Laboratory Consortium, https://gridmod.labworks.org/pioneer-regional-partnerships.
California’s recent experience with its requirements for 20,000 MW of small renewable generation (under 20
MW) by 2020 is instructive for both valuation and grid management. To make these volumes both visible to
the ISO and valuable to consumers, aggregators, and grid operators, market designers at the California ISO
allowed bids of at least 0.5 MW into day-ahead, energy, and ancillary markets. Similar efforts are underway in
Texas and New York.47
The electricity system is also experiencing an increasing array of “subsecond” events that require response
times that are far too short for humans to react. One of the driving forces making smart grids necessary is the
proliferation of smart devices; each one is capable of microscopic frequency disruptions, which cumulatively
d Protection schemes identify coordinated corrective actions to detect and address abnormal system conditions (e.g., faults).
Transforming the Nation’s Electricity System: The Second Installment of the QER | January 2017 4-11Chapter IV: Ensuring Electricity System Reliability, Security, and Resilience
present an unprecedented new challenge for system operators. Many consumer electronic devices (such
as mobile phones, Wi-Fi-based home automation solutions, and smart entertainment devices) represent
“endpoints” that can impact system operations. In addition, Internet of things (IoT) devices function at
microsecond “clock speeds.” In the aggregate, these devices represent a new source of variability at speeds far
faster than what grids have traditionally managed. The solution must take the form of protective relays and
synchrophasors operating more-or-less autonomously in real time. The upside implications going forward
include the need for integrating machine learning into grid operations (i.e., as positive solutions for mitigating
unprecedented grid disruptive forces); on the downside, digitizing grid operations deep into subsecond
operations raises new cyber vulnerabilities.
The kinds of anomalies affecting wholesale markets and grid operators noted above suggest the need for
frequent adjustments to market designs to accommodate new technologies, changing consumer preferences,
and security needs. The Nation’s ISOs/RTOs, FERC, and NERC are continuously engaged in analysis,
evaluation, and design modification processes—working to ensure that the present scoping and pace of
regulatory change is aligned with the scale and speed of change occurring as a result of continued VER
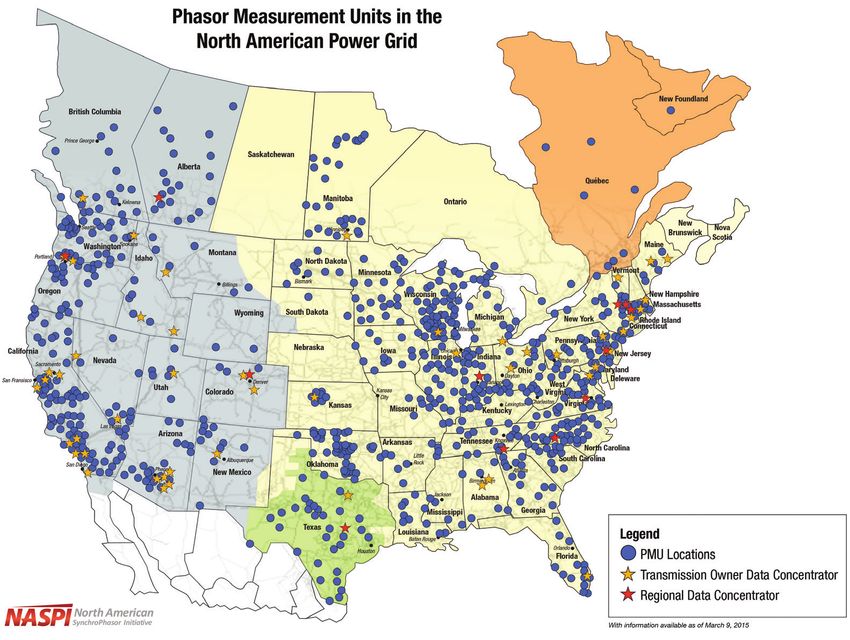
deployment. In September 2016, FERC approved new requirements for the quality of real-time monitoring
and analysis capabilities for system operators,48 and NERC has made a number of improvements that have
significantly reduced the time it takes to develop a standard. This is an ongoing process; both state and Federal
regulators face complicated and evolving challenges that grid operators must address in a timely fashion while
simultaneously operating under existing performance standards and system requirements.
Grid Operation Impacts of the Internet of Things
Grid control systems now handle, sense, and control endpoints numbered in the thousands. Widespread DER/
DR penetration implies that future grid control systems may have to coordinate millions of endpoint control
devices to support grid functions. These devices vary in type, from digital sensors and smart boards built into
transformers, to mobile devices used by field operators and grid control managers.
Current grid control systems are not structured for large-scale optimization of millions of devices, and they
are not equipped to handle increasingly large volumes and types of data. End-users (consumers, as well as
aggregators controlling multiple demand profiles) may wish to perform optimal local controls to meet their
desired requirements that may be in conflict with optimal system-wide control.
Grid control systems must evolve from being centralized to a hybrid of central and distributed control
platforms. The need for flexible grid operations is challenging basic assumptions about grid control, which will
require changes in standards and operating protocols. Bulk power systems operations are the purview of both
FERC and NERC, but grid security and reliability assurance concerns mean that Federal authorities must be
included in designing 21st-century grid control systems.
4-12 Transforming the Nation’s Electricity System: The Second Installment of the QER | January 2017Overview of Department of Homeland Security Strategic Principles for Security of
the Internet of Things (IoT)
The Department of Homeland Security developed strategic principles, published on November 15, 2016,g to mitigate vulnerabilities
introduced by the IoT through recognized security best practices. These principles are intended to offer guidance to stakeholders as
they seek to manage IoT security challenges.
Strategic Principles for Securing the IoT:
1. Incorporate security at the design phase—building in security at the design phase reduces potential disruptions and avoids
the much more difficult and expensive endeavor of attempting to add security to products after they have been developed and
deployed.
2. Advance security updates and vulnerability management—vulnerabilities may be discovered in products after they have been
deployed. These flaws can be mitigated through patching, security updates, and vulnerability management strategies.
3. Build on proven security practices—many tested practices used in traditional information technology and network security can
be applied to the IoT, helping to identify vulnerabilities, detect irregularities, respond to potential incidents, and recover from
damage or disruption to IoT devices.
4. Prioritize security measures according to potential impact—risk models differ substantially across the IoT ecosystem, and the
consequences of a security failure across different customers will also vary significantly. Focusing on the potential consequences
of disruption, breach, or malicious activity across the consumer spectrum is therefore critical in determining where particular
security efforts should be directed and who is best able to mitigate significant consequences.
5. Promote transparency across the IoT—increased awareness could help manufacturers and industrial consumers identify where
and how to apply security measures, build in redundancies, and be better equipped to appropriately mitigate threats and
vulnerabilities as expeditiously as possible.
6. Connect carefully and deliberately—IoT consumers can also help contain the potential threats posed by network connectivity,
connecting carefully and deliberately, and by weighing the risks of a potential breach or failure of an IoT device against the costs
of limiting connectivity to the Internet.
g
Department of Homeland Security (DHS), Strategic Principles for Securing the Internet of Things (IoT) Version 1.0 (Washington, DC: DHS,
November 15, 2016), https://www.dhs.gov/sites/default/files/publications/Strategic_Principles_for_Securing_the_Internet_of_Things-
2016-1115-FINAL....pdf.
Utility-Scale and Distributed Storage
Electricity remains unique among commodities in its limited capability available for storage. There are few
viable ways to store electrical energy (e.g., batteries, or pumped storage solutions), and there are other more
exotic possibilities like superconducting magnet rings. Inventory options tend to narrow the amount and
duration of ready access electricity. The graphic depiction in Figure 4-4 summarizes the power and duration
capabilities of various storage technologies.
Transforming the Nation’s Electricity System: The Second Installment of the QER | January 2017 4-13Chapter IV: Ensuring Electricity System Reliability, Security, and Resilience
Figure 4‑4. The Storage Technology Development Map49
Days
Better for energy management
High Energy
Pumped
Capacitors Compressed Storage
Long Air Hydro
Duration
Flywheels Batteries
Discharge Time
High Power
Flywheels
High
Power
Capacitors Superconducting
Seconds
Better for power Magnetic Storage
quality management
10kW 1GW
Capacity
Most electricity storage is water that fuels turbines that produce electricity. Currently, the largest storage
capacity is pumped hydro. Electrochemical batteries have been the fastest growing new storage technology.
Batteries in the form of fuel cells can be used for continuous power production and the scaling capabilities of
fuel cells make them attractive for fitting load shapes to specifically sized power supplies. Other technologies
for energy storage include compressed air, flywheels, and capacitors.
Utility-scale battery storage and distributed battery storage vary by scale and duration, but perform
consistently at any scale from a grid management perspective. When distributed storage is aggregated, it can
offer local grid operators greater flexibility for managing system reliability and power quality than utility-scale
resources. Aggregation can be scaled to fit specific local needs in distribution systems.
An example of grid reliability applications of energy storage is seen in California, where the building of about
60 MW in new battery storage capacity is underway.h, 50, 51, 52 These installations are being built to resolve
reliability issues caused by the Aliso Canyon leak53 (for more information on Aliso Canyon, see “Underground
Storage Leak in California Driving Natural Gas Storage Safety and Reliability Improvements” text box on
page 4-33) and the San Onofre Nuclear Generating Station outage,54 and they will help level out electricity
supply in California by moving energy from the afternoon production of solar to the evening peak.55 While
region-specific critical reliability requirements can drive storage deployment, additional incentives can help
accelerate these benefits ahead of a major disruption.
h
Upon commissioning, the 20-MW/80-megawatt-hour (MWh) SCE Mira Loma project will be the largest battery in operation. The
37.5-MW/120-MWh San Diego Gas & Electric Escondido project will then overtake Mira Loma as the largest battery when it is
commissioned. In addition to their titles as largest yet in operation, both projects were built quickly—about six months from contract
award to commissioning. These projects show how new technologies, many of which benefitted from early publicly supported
demonstrations, can provide rapid solutions for reliability, resilience, and security.
4-14 Transforming the Nation’s Electricity System: The Second Installment of the QER | January 2017Public investment and policy have been key to electricity storage technology development; the American
Recovery and Reinvestment Act of 2009 (ARRA) is the most commonly identified funding source for storage
projects.56 By 2015, through a combination of regulatory reforms, innovation, and cost reductions, lithium-ion
batteries emerged as a dominant battery design for frequency regulation and renewables integration; lithium-
ion batteries made up 95 percent of deployed capacity in 2015, with 80 percent of this capacity located in the
PJM Interconnection territory, attracted by its pay-for-performance frequency regulation market.
The evolution of storage technology is likely to take the electricity sector into new realms. “Hybridizing”
storage solutions with solar and wind power sources may redefine what is meant by “power plant,” and alter
how the grid is understood and used. If hybrids can “self-power” even a portion of a significant load, then
tomorrow’s future electricity sector will be able to achieve national objectives for clean, secure, and affordable
electricity supplies in a system that is imminently flexible and considerably resilient.
Demand Response Can Aid Grid Management
DR empowers consumers to change their normal electricity consumption patterns; it is a particularly flexible
grid resource, capable of improving system reliability, reducing the need for capital investments to meet peak
demand, as well as electricity market prices. DR can also be used for load reduction and load shaping, as well
as to help grids mitigate generation variability, including from VER. A variety of DR programs exist, some
of which are offered directly by utilities, while other programs are offered by the grid system operators, retail
competitors, and aggregators. DR challenges the view that a utility’s generation adequacy, measured by its
reserve margin, is “steel in the ground.” DR can offset “installed capacity” and currently provides nearly 30
gigawatts (GW) of peak reduction capability nationwide;57 this accounted for 3.9 percent of U.S. peak demand
in 201658 and exceeded 10 percent in some regions.i, 59, 60 Future DR growth—FERC scenarios show 82 GW to
188 GW in possible DR capacity by 201961—along with other DER could significantly shift customer demand
from peak to off-peak periods.
A key driver of today’s DR programs has been the growth of advanced metering infrastructure (AMI), now
deployed for nearly 65 million customers in the United States (Figure 4-5).62 AMI typically includes two-
way communications networks that utilities can leverage to improve electric system operations, enable new
technological platforms and devices, and facilitate consumer engagement. More than half of deployed AMI are
in five states, with California, Florida, and Texas accounting for over 40 percent of the total.63 AMI investments
have been largely driven by state legislative and regulatory requirements, as well as ARRA funding.64
i
For example, in PJM Interconnection, demand resources account for over 10 GW out of the 167 GW from all capacity resources in
the 2019/2020 delivery year. See references for more information.
Transforming the Nation’s Electricity System: The Second Installment of the QER | January 2017 4-15Chapter IV: Ensuring Electricity System Reliability, Security, and Resilience
Figure 4‑5. Advanced Metering Infrastructure Growth Has Contributed to Expanded Role of DR Programs65
U.S. Demand Response (MW) Deployed AMI (millions)
35,000 70
30,000 60
25,000 50
20,000 40
15,000 30
10,000 20
11,833 12,682 13,036
5,000 10
0 0
2013 2014 2015
Actual Potential AMI
A key driver of today’s DR programs has been the growth of advanced metering infrastructure (in orange). In 2015, approximately 65 million
customers in the United States had advanced metering infrastructure installations.
State Regulatory Actions That Have Impacted Demand Responsej
• The California Public Utilities Commission will require default time-of-use (TOU) rates for residential customers in 2019, and it
is working with California Independent System Operator and the California Energy Commission to create a market for demand
response (DR) and energy efficiency resources.k
• In 2014, Massachusetts ordered its electricity distribution companies to file TOU rates with critical peak pricing as the default
rate design for residential customers once utility grid modernization investments are in place.l
• In 2015, the Michigan Public Service Commission directed DTE Electric to make TOU and dynamic peak pricing available on an
opt-in basis to all customers with advanced metering infrastructure by January 1, 2016. Similarly, Consumers Energy must make
TOU available on an opt-in basis by January 1, 2017.
j
Federal Energy Regulatory Commission (FERC), Assessment of Demand Response & Advanced Metering, Staff Report (FERC, December
2015), https://www.ferc.gov/legal/staff-reports/2015/demand-response.pdf.
k
California Public Service Commission (CPUC), California’s Distributed Energy Resources Action Plan: Aligning Vision and Action, Discussion
Draft: September 29, 2016 (CPUC, 2016), http://www.cpuc.ca.gov/uploadedFiles/CPUC_Public_Website/Content/About_Us/Organization/
Commissioners/Michael_J._Picker/2016-09-26%20DER%20Action%20Plan%20FINAL3.pdf, accessed December 13, 2016.
l
L. Evers, “Massachusetts DPU Says Time of Use Pricing Will Be the Default for All Customers,” Smart Grid Legal News, June 26, 2014,
http://www.smartgridlegalnews.com/regulatory-concerns-1/massachusetts-dpu-says-time-of-use-pricing-will-be-the-default-for-all-
customers/.
4-16 Transforming the Nation’s Electricity System: The Second Installment of the QER | January 2017State Regulatory Actions That Have Impacted Demand Response (continued)
• Also in 2015, the New York Public Service Commission released a regulatory framework and implementation plan (“Reforming
the Energy Vision”) to align electric utility practices and the state’s regulatory framework with technologies in information
management, power generation, and distribution. A related measure in 2014 approved a $200 million Brooklyn-Queens
demand management program, which includes 41 megawatts (MW) of customer-side measures, including DR, distributed
generation, distributed energy storage, and energy efficiency, to cost effectively defer approximately $1 billion in transmission
and distribution investment.
• In June 2015, the Pennsylvania Public Utility Commission set a total peak demand reduction of 425 MW for electric distribution
companies by 2021, against a 2010 baseline.
• In Rhode Island, DR is continuing to be tested in pilot programs by National Grid and will be incorporated in analysis for “non-
wires alternatives” to traditional utility infrastructure planning.m
m
“System Reliability Program,” State of Rhode Island, Office of Energy Resources, accessed December 13, 2016, http://www.energy.ri.gov/
reliability/.
The legal and regulatory environment for DR is highly dynamic and evolving at both the national and state
levels. On January 25, 2016, the U.S. Supreme Court upheld FERC’s authority to regulate DR programs in
wholesale electricity markets (FERC Order No. 745).66 While this decision provides final policy clarity, it was
made almost 2 years after the Appeals Court issued the opposite decision; in the intervening time, the markets
were operating under the lower court’s interpretation that FERC’s DR order was encroaching on each state’s
exclusive right to regulate its utility markets. As affirmed by the Supreme Court, the FERC order ensures that
DR providers are compensated at the same rates as generation owners. This ruling is also expected to provide
a more favorable environment for DR market growth by facilitating the participation of third parties in the
aggregation of DR resources.
Total DR capacity varies widely by region, reflecting the diversity in utility, state, and regional policies
toward DR and other forms of demand-side management. Regions where DR is installed directly in multiple
electricity markets (e.g., capacity and essential reliability services) generally have greater total DR capacities
and can reduce a larger proportion of their peak demand by using DR.67
It is important to note that the potential peak reduction in Table 4-1 may not all be reduction in “real capacity.”
There are significant challenges to making DR resources reliable, predictable, and sustainable so that they may
function as “proxy generators.” Also, the terms related to non-delivery or partial delivery of DR that is called
into service by grid operators tend to have highly variable penalty clauses from region to region, and from
utility to utility, grid operators generally favor more reliable and predictable resources over DR. Until there
are consistent standards across regions that ensure data accuracy and validity, data on DR capacity will tend
to be discounted by grid operators—an estimated 100-MW DR resource that can be called does not mean that
100 MW will show up when called. Real-time visibility of these resources is important to grid operators and
essential for maximizing the value of DR.68
Transforming the Nation’s Electricity System: The Second Installment of the QER | January 2017 4-17You can also read