Achieving food security in the face of climate change
←
→
Page content transcription
If your browser does not render page correctly, please read the page content below
March 2012

Achieving food security in the
       face of climate change
          Final report from the Commission on
   Sustainable Agriculture and Climate Change

                                                          Commissioners
                   Professor Sir John Beddington, Chair, United Kingdom
                              Dr Mohammed Asaduzzaman, Bangladesh
                                                Dr Megan Clark, Australia
                                             Dr Adrian Fernández, Mexico
                                                Dr Marion Guillou, France
                                      Professor Molly Jahn, United States
                                                 Professor Lin Erda, China
                                       Professor Tekalign Mamo, Ethiopia
                                              Dr Nguyen Van Bo, Vietnam
                                                 Dr Carlos A Nobre, Brazil
                                   Professor Robert Scholes, South Africa
                                                    Dr Rita Sharma, India
                                         Professor Judi Wakhungu, Kenya
FINAL REPORT: Achieving food security in the face of climate change

Commissioners                                                                                 ■■   Ms Isabelle Coche, Farming First
                                                                                              ■■   Ms Béatrice Darcy-Vrillon, INRA
                                                                                              ■■   Dr Peter Dewees, World Bank
■■   Professor Sir John Beddington, Commission Chair, United Kingdom                          ■■   Ms Anette Engelund Friis, Danish Agriculture and Food Council
■■   Dr Mohammed Asaduzzaman, Bangladesh Institute of Development                             ■■   Professor Alex Evans, New York University
     Studies, Bangladesh                                                                      ■■   Ms Rebecca Fisher-Lamb, United Kingdom Government Office for
■■   Dr Megan Clark, Commonwealth Scientific and Industrial Research                               Science
     Organisation (CSIRO), Australia                                                          ■■   Professor Charles Godfray, Oxford University
■■   Dr Adrian Fernández, Metropolitan University, Mexico                                     ■■   Mr Elwyn Grainger-Jones, International Fund for Agricultural
■■   Dr Marion Guillou, French National Institute for Agricultural Research                        Development (IFAD)
     (INRA), France                                                                           ■■   Dr Herve Guyomard, INRA
■■   Professor Molly Jahn, University of Madison-Wisconsin, United States                     ■■   Dr Stefan Hajkowicz, CSIRO
■■   Professor Lin Erda, Chinese Academy of Agricultural Sciences, China                      ■■   Ms Tanja Havemann, Beyond Carbon GmbH
■■   Professor Tekalign Mamo, Ministry of Agriculture, Ethiopia                               ■■   Dr Mario Herrero, International Livestock Research Institute (ILRI)
■■   Dr Nguyen Van Bo, Viet Nam Academy of Agricultural Science, Viet Nam                     ■■   Dr Ulrich Hoffmann, United Nations Conference on Trade and
■■   Dr Carlos A Nobre, Ministry of Science, Technology and Innovation,                            Development (UNCTAD)
     Brazil                                                                                   ■■   Mr David Howlett, UK Department for International Development (DfID)
■■   Professor Robert Scholes, Council for Scientific and Industrial                          ■■   Dr Andy Jarvis, International Center for Tropical Agriculture (CIAT)
     Research (CSIR), South Africa                                                            ■■   Dr Brian Keating, CSIRO
■■   Dr Rita Sharma, National Advisory Council, India                                         ■■   Dr David LeZaks, University of Wisconsin
■■   Professor Judi Wakhungu, African Center for Technology Studies                           ■■   Dr Leslie Lipper, UN Food and Agriculture Organization (FAO)
     (ACTS), Kenya                                                                            ■■   Mr Danny Martinez, CIAT
                                                                                              ■■   Mr Hayden Montgomery, Global Research Alliance on Agricultural
Commission Secretariat                                                                             Greenhouse Gases (GRA)
                                                                                              ■■   Dr Lou Munden, Lou Munden Associates
■■   Commission Coordinator: Dr Christine Negra                                               ■■   Mr Musa Muwanga, National Organic Agricultural Movement
■■   Communications Manager: Ms Vanessa Meadu                                                      of Uganda (NOGAMU)
■■   Events Coordinator: Ms Ratih Septivita                                                   ■■   Dr Gerald Nelson, International Food Policy Research Institute (IFPRI)
■■   Research Assistants: Ms Cecilia Schubert, Ms Helena Wright                               ■■   Dr Henry Neufeldt, World Agroforestry Centre (World Agroforestry Centre)
                                                                                              ■■   Mr Randall Purcell, WFP
                                                                                              ■■   Rockefeller Foundation’s Bellagio Center
Acknowledgements                                                                              ■■   Mr Scott Ronchini, WFP
                                                                                              ■■   Professor Cynthia Rosenzweig, Columbia University
■■   Mr Odd Arneson, Norwegian Agency for Development Cooperation                             ■■   Dr Marie Russel, INRA
     (Norad)                                                                                  ■■   Dr Sara Scherr, EcoAgriculture Partners
■■   Dr Andrew Ash, CSIRO                                                                     ■■   Professor Tim Searchinger, German Marshall Fund/Princeton University
■■   Dr Marie-Caroline Badjeck, WorldFish Center                                              ■■   Ms Emmy Simmons, Meridian Institute AGree initiative
■■   Mr Paul Barnett, CSIRO                                                                   ■■   University of Minnesota’s Institute on the Environment
■■   Mr Mario Boccucci, United Nations Environment Programme (UNEP)                           ■■   Dr Egizio Valceschini, INRA
■■   Dr Ademola Braimoh, World Bank                                                           ■■   Dr Sonja Vermeulen, CCAFS
■■   Dr Bruce Campbell, CGIAR Research Program on Climate Change,                             ■■   Dr Elizabeth Warham, United Kingdom Government Office for Science
     Agriculture and Food Security (CCAFS)                                                    ■■   Dr Paul West, University of Minnesota
■■   Mr Volli Carucci, World Food Programme (WFP)                                             ■■   Dr Lini Wollenberg, CCAFS

Disclaimer                                                                                    Creative Commons licence
This report contains the findings of the Commission on Sustainable Agriculture and
Climate Change. The findings represent the independent views of the authors and should
not be interpreted as the views of their institutions or their funders, nor of the CGIAR or
the Global Donor Platform for Rural Development.
                                                                                              This publication is licensed under a Creative Commons Attribution: NonCommercial–
Financial support
                                                                                              NoDerivs 3.0 Unported License.
CGIAR Research Program on Climate Change, Agriculture and Food Security (CCAFS)
                                                                                              This publication may be freely quoted and reproduced provided the source is
Global Donor Platform for Rural Development (GDPRD)
                                                                                              acknowledged. No use of this publication may be made for resale or other commercial
                                                                                              purposes.
Published by
The CGIAR Research Program on Climate Change, Agriculture and Food Security (CCAFS)           © 2012 CGIAR Research Program on Climate Change, Agriculture and Food Security
                                                                                              (CCAFS)
Contact information
CCAFS Coordinating Unit, Department of Agriculture and Ecology, Faculty of Life               Front cover photo
Sciences, University of Copenhagen, Rolighedsvej 21, DK-1958 Frederiksberg C, Denmark         N. Palmer (CIAT)
Tel: +45 35331046
                                                                                              Design Concept
Email: ccafs@cgiar.org                                                                        Scriptoria Communications

Online: www.ccafs.cgiar.org/commission                                                        Editorial and Layout
                                                                                              Stairway Communications
Correct citation
Beddington J, Asaduzzaman M, Clark M, Fernández A, Guillou M, Jahn M, Erda L, Mamo T,
Van Bo N, Nobre CA, Scholes R, Sharma R, Wakhungu J. 2012. Achieving food security in
the face of climate change: Final report from the Commission on Sustainable Agriculture
                                                                                              A Summary for Policy Makers and more information is available at
and Climate Change. CGIAR Research Program on Climate Change, Agriculture and Food
                                                                                              www.ccafs.cgiar.org/commission
Security (CCAFS). Copenhagen, Denmark. Available online at:
www.ccafs.cgiar.org/commission.
Commission on Sustainable Agriculture and Climate Change

Contents

Foreword                                                                                                                  1

Chapter I: Introduction                                                                                                   3

Chapter II: Understanding the current food system in the context of climate change — major components and drivers         8
      II-A. Demography, development and diets                                                                             8
      II-B. Climate change impacts on agriculture                                                                        11
      II-C. Food production, supply chains and the environment                                                           12
      II-D. Investment, trade and food price volatility                                                                  15

Chapter III: Investing in an alternative future food system                                                              17

Chapter IV: Essential actions for food security and climate stabilisation                                                20
      Recommendation 1. Integrate food security and sustainable agriculture into global and national policies            21
      Recommendation 2. Significantly raise the level of global investment in sustainable agriculture and food systems
      in the next decade                                                                                                 25
      Recommendation 3. Sustainably intensify agricultural production while reducing GHG emissions and other negative
      environmental impacts of agriculture                                                                               29
      Recommendation 4. Develop specific programmes and policies to assist populations and sectors that are most
      vulnerable to climate changes and food insecurity                                                                  33
      Recommendation 5. Reshape food access and consumption patterns to ensure basic nutritional needs are
      met and to foster healthy and sustainable eating patterns worldwide                                                38
      Recommendation 6. Reduce loss and waste in food systems, targeting infrastructure, farming practices,
      processing, distribution and household habits                                                                      42
      Recommendation 7. Create comprehensive, shared, integrated information systems that encompass
      human and ecological dimensions                                                                                    46

Chapter V: Conclusion                                                                                                    49

References                                                                                                               52

Annex I: Sources of climate and agriculture finance                                                                      57

Acronyms and abbreviations                                                                                               59
FINAL REPORT: Achieving food security in the face of climate change

Tables, figures and boxes

Tables

Table 1. Status of selected global parameters                                                                                11

Figures

Figure 1. Development process for the Commission’s recommendations                                                            4
Figure 2. Regional examples of threats from climate change, population growth and unsustainable resource use                  5
Figure 3. A synthesis of several key trends in food and climate systems                                                       7
Figure 4. Structure of the world diet, 2005–2007                                                                              9
Figure 5. Relationship of human diet to income                                                                               10
Figure 6. Projected changes in agricultural production in 2080 due to climate change                                         12
Figure 7. Closing yield gaps for major crops                                                                                 13
Figure 8. Food loss and waste within the food system                                                                         14
Figure 9. ‘Safe operating space’ for interconnected food and climate systems                                                 18
Figure 10. Balancing food supply and demand                                                                                  19

Boxes

Commission on Sustainable Agriculture and Climate Change                                                                      4
Sustainable agriculture                                                                                                       6
Climate change adaptation and mitigation                                                                                      6
Going beyond the major cereal crops                                                                                          14
Global food prices have risen dramatically in the last few years and are forecast to rise further and become more volatile   16
Case study 1: Brazil’s integrated approach to land use policy                                                                24
Case study 2: China’s research, policies and pilot programmes promote agricultural adaptation and mitigation                 26
Case study 3: Bangladesh is investing in smallholders and food security                                                      28
Case study 4: Upscaling techniques to deliver higher yields and climate benefits in Vietnam                                  30
Case study 5: Land tenure reform in southern Africa empowers women farmers                                                   31
Case study 6: Index-based insurance in Mexico spurs investment in sustainable agriculture                                    34
World Trade Organization (WTO)                                                                                               35
Case study 7: National guaranteed employment in India bestows multiple benefits                                              36
Case study 8: Complementary, predictable long-term response to food insecurity in Ethiopia                                   37
Case study 9: Public health messages promote healthy eating habits in France                                                 40
Case study 10: Standard certification informs consumer choices in the United States                                          41
Case study 11: Kenyan smallholders have improved market access and production efficiency                                     43
Case study 12: The United Kingdom is reducing emissions and waste in food chains                                             45
Case study 13: Australian initiatives and information services support adaptive agriculture                                  48
Commission on Sustainable Agriculture and Climate Change

Foreword

Humanity faces difficult tradeoffs in producing sufficient food to feed our growing population and stabilizing our climate system.
Globally our food system is not sustainable, does not provide adequate nutrition to everyone on the planet and, at the same
time, changes to our climate threaten the future of farming as we know it. Agriculture is both part of the problem and part of the
solution to climate change. We must seize every opportunity to shift away from inefficient farm practices, supply chains and diet
choices towards long-term sustainability, profitability and health.

To bring our interconnected food and climate systems within a ‘safe operating space’ for people and the planet, the Commission
on Sustainable Agriculture and Climate Change has outlined seven major areas for policy action. Over the past year, I have
worked with my colleagues on the Commission to harvest the practical solutions detailed in the many recent authoritative
reports on food security and climate change. By combining this thorough review of the substantive evidence base with the
diverse perspectives and disciplinary expertise of the 13 Commissioners, we have crafted a succinct roadmap for policy makers.
We offer no ‘one-size-fits-all’ solutions, but rather point the way forward to foster national, regional and sectoral innovation that
can aggregate up to meaningful global change.

Responsibility for action lies with us all. We offer our recommendations to the global community of policy makers who,
collectively, can create an enabling environment for a sustainable global food system. There is much that can be done to advance
these recommendations by policy makers working under the mandates of the United Nations Framework Convention on Climate
Change, the Rio+20 Earth Summit and the Group of 20 nations. We also look to initiatives such as the United Nations High-Level
Taskforce on the Global Food Security Crisis and the Global Agriculture and Food Security Program.

It is my sincere hope that this report will accelerate our shared global commitment to the fundamental well-being of current and
future generations through decisive policy action.

Professor Sir John Beddington

Chair, Commission on Sustainable Agriculture
and Climate Change

                                                                                                                                        1
Commission on Sustainable Agriculture and Climate Change

                                                                                                                                                      Photo: N. Palmer (CIAT)

Chapter I: Introduction

Widespread uptake of sustainable practices in agriculture and                     system.5 A range of solutions has been proposed to meet the
food supply chains is essential to meet current and future                        challenges of providing food security while adapting to
threats to food security and environmental resilience. The                        climate change and reducing the environmental footprint of
global food system does not yet provide adequate calories or                      agriculture. It is important that global bodies such as the
nutrition to everyone on the planet, yet it enables some                          United Nations Framework Convention on Climate Change
populations to overconsume. In the coming decades, global                         (UNFCCC), the Group of 20 nations (G20) and the United
agriculture must produce more food to feed a growing                              Nations Convention on Sustainable Development (the
population while adapting to climate change, an increasing                        organizing body of the Rio+20 Earth Summit to be held in June
threat to agricultural yields.1                                                   2012) adopt appropriate policy and financial actions to
                                                                                  support implementation of these solutions on a global level.
Extreme weather events such as droughts and floods are
predicted to become more frequent, adding to the global                           The Commission on Sustainable Agriculture and Climate
burden of hunger caused by poverty, weak governance,                              Change was convened in February 2011 to identify practical,
conflict and poor market access.2 In agricultural production,                     evidence-based policy actions to achieve food security in the
greenhouse gases (GHGs) contributing to climate change                            context of climate change. The Commission has reviewed the
originate from fertilizers, ruminant digestion (cattle, sheep                     scientific evidence to identify a set of clear decisions and
and goats), rice cultivation and fuel use. Land clearing for                      actions to be undertaken by key stakeholders and institutions
agriculture, particularly deforestation, can also contribute                      (see Figure 1). The recommendations presented in this report
significantly to GHG impacts.3 But this is not inevitable.                        encourage transformational investments that will increase
Alternative agricultural practices, suitable in different regions,                human capacity to navigate current and emerging trade-offs
can reduce net GHG emissions while maintaining or improving                       and to capitalize on synergies between food security and
yields and adapting to more extreme weather.4                                     adaptation and mitigation of climate change.

A host of recent assessment reports make compelling                               While critically important actions will be taken at national
arguments for urgent action to transform the global food                          and sub-national levels, the Commission has focused on the
                                                                                  leadership needed within international institutions and policy
                                                                                  processes.

                                                                                  5
                                                                                      The findings and recommendations presented here rely heavily on a comprehensive
1
    Foresight 2011; INRA/CIRAD 2011; IAASTD 2009; Lobell et al. 2011; The Hague       survey of 16 recent major assessment reports including: Foresight 2011; The Hague
    Conference 2010.                                                                  Conference 2010; IAASTD 2009; IFAD 2011; INRA/CIRAD 2011; Lipper et al. 2010;
2
    Beddington et al. 2012; IPCC 2007.                                                MEA 2005; NAS 2010; Nelson et al. 2011; Parry et al. 2009; Royal Society 2009;
3
    Smith et al. 2007.                                                                Vermeulen et al. 2012; World Bank 2010a; World Bank 2010b; World Bank 2008;
4
    Pretty et al. 2011.                                                               Worldwatch 2011.

                                                                                                                                                                           3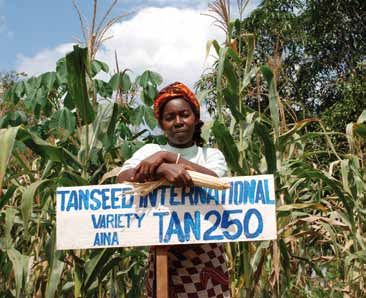
FINAL REPORT: Achieving food security in the face of climate change

    Commission on Sustainable Agriculture and Climate Change

    What: The Commission on Sustainable Agriculture and Climate Change was established by the CGIAR Research Program on
    Climate Change, Agriculture and Food Security (CCAFS) with support from the Global Donor Platform for Rural Development
    (GDPRD) to identify the policy changes and actions that are needed now to help the world achieve food security in the
    context of climate change.

    Who: The Commission brings together senior natural and social scientists working in agriculture, climate, food and nutrition,
    economics and natural resources in governmental, academic and civil society institutions in Australia, Brazil, Bangladesh,
    China, Ethiopia, France, Kenya, India, Mexico, South Africa, the United Kingdom, the United States and Vietnam.

    How: To provide a clear and authoritative set of policy findings based on science, the Commission has undertaken a
    synthesis of major assessment reports to clearly articulate scientific findings on the potential impact of climate change on
    agriculture and food security globally and regionally. These recommendations highlight the actions and pathways that
    policy makers across the globe should be addressing in order to support sustainable agriculture and food systems that
    contribute to food security in the context of climate change.

This report seeks to elevate discussion of the interconnected               agreeing and delivering essential investments in sustainable
dimensions of sustainable agriculture, food security and                    agriculture and food systems; an architecture that
climate change, and to communicate the importance of                        incorporates lessons learned about the importance of
investments in self-sustaining rural development, as well as in             ‘bottom-up’ approaches with strong connections to global
new tools and information systems to support governance of                  policy development. This means striving to move beyond
sustainable agriculture and the food system. In addition, it                ‘silos’ and building linkages among policy processes.
emphasizes the need for a revitalized global architecture for

                                                                                 Commission recommendations
             Rio +20 process                                                                        External reviews Oct 2011
                                                Briefings,                             Second order draft
             UNFCCC process                     presentations,
                                                                                                    Commission meeting, Paris Sept 2011
                                                media products
             G20 process                                                                 First order draft
                                                                                                    Technical team, Bellagio Sept 2011
             Other relevant forums
                                                                                         Zero order draft
                                                                                                    Secretariat August 2011

                                                                                                                      Commission
                                                                                                                        studies
                Foresight             INRA/CIRAD             Nelson et al            World Bank
                  2011                   2011                    2011             Dev and Agric 2008
                                                                                                                     Eating choices
               Hague 2010             Lipper et al            Parry et al            World Bank                            INRA
             Chair’s Summary             2010                    2009            Dev and Climate 2010

                 IAASTD                  MEA                Royal Society            World Bank                      Price volatility
                  2009                   2005                    2009            Country examples 2010                    CSIRO

                                                                                                                     Commissioner
                  IFAD                   NAS               Vermeulen et al           Worldwatch
                  2011                   2010                    2012             State of World 2011                   inputs

                                                                                                                   Interviews March 2011
                                        Recently published assessments                                               Select advisors

    Figure 1. Development process for the Commission’s recommendations. This report represents the expert opinion of thirteen
    Commissioners, drawn from all parts of the world and several disciplines. Their evaluation is based on their experience, informed by
    synthesized findings of sixteen recent, authoritative assessments of climate change and food security (which draw, in turn, on thousands
    of peer-reviewed scientific studies), and by selected advisors. Targeted studies on food price volatility and on eating patterns were
    produced to further inform the Commission. The report was developed over a period of 12 months, with iterative review by
    Commissioners and final external review. It is intended to inform global policy processes.

4
Commission on Sustainable Agriculture and Climate Change
18% of total UK greenhouse gas
emissions are linked to food supply With a population over
150 million and 70% With 6% average
chains8. Approximately 22% of annual agricultural
household food and drink is wasted9. of land area 5 meters
or less above sea GDP growth,
level11, each year, chemical fertilizer
In France, 70% of food is environmental use in China13
purchased in supermarkets hazards temporarily (383.6 kilograms
Government subsidies of
and more than 40% of send half a million per hectare14) is
nearly USD 20 billion went
calories in the average diet Bangladeshis to urban contributing to
to US corn and soybean
come from lipids. 4 out of 10 areas and displace non-point source
producers in 2003-20056.
adults are overweight or 64,000 people12. pollution and
Climate change is
obese10. greenhouse gas
predicted to substantially
emissions15.
reduce corn exports in
coming decades7.
A major rice-
exporting country,
Vietnam’s average
wet season rice
Forest area in Ethiopia
production achieves
declines by 1% each year.
only 63% of
98,490,000 cubic meters
economic yield and
of woodfuel were
50% of climatic
consumed in 200822.
yield potential16.
Mexican agriculture Post-harvest losses
accounts for 77% of of annual fruit and
water use, but only vegetable production
4% of GDP and 13% in India are
of total land area. estimated at 20%
3.2% of Mexican due to inadequate
land is irrigated26. transit packaging17
and refrigeration18.
Largest economy in A changing climate
Africa with an 88% and water over-
literacy rate, but life One of the best- allocation threaten
expectancy of only 52 developed economies the Murray-Darling
Deforestation and land use years23. One-fifth of in eastern Africa, but Basin which supplies
changes associated with South Africans live on one-third of Kenyans water to over 3 million
agriculture account for over less than USD 1.2524. are undernourished20. people and to
70% of greenhouse gas 4 out of 5 Kenyans irrigated agriculture
emissions in Brazil, a major depend on agriculture worth USD5 billion
global food producer25. for their livelihoods21. annually19.
Figure 2. Regional examples of threats from climate change, population growth and unsustainable resource use.
6
National Academy of Sciences. 2010. 17
Choudhury. 2006.
7
Nelson et al. 2011. 18
Mittal. 2007.
8
Cabinet Office. 2008. 19
Prosser. 2011.
9
WRAP. 2008. 20
FAO. 2011a.
10
FAO Country Profiles: France; Etilé. 2010; Reardon et al. 2003. 21
World Bank. 2010a.
11
World Bank. 2010a. 22
FAO. 2011b.
12
Foresight. Migration and Global Environmental Change. 2011. 23
FAO Country Profiles: South Africa
13
Foley et al. 2011. 24
World Bank. 2010b.
14
FAO Country Profiles: China 25
World Bank. 2010a.
15
World Bank. 2010a. 26
FAOStat: Mexico.
16
Laborte et al. 2011.
5
FINAL REPORT: Achieving food security in the face of climate change

      Sustainable agriculture

      Agriculture is at the nexus of three of the greatest challenges of the 21st century – achieving food security, adapting to climate
      change, and mitigating climate change while critical resources such as water, energy and land become increasingly scarce.

      Sustainable agriculture27 simultaneously increases production and income, adapts to climate change and reduces GHG
      emissions, while balancing crop, livestock, fisheries and agroforestry systems, increasing resource use efficiency (including
      land and water), protecting the environment and maintaining ecosystem services. The goal for sustainable food production
      systems is to maximize productivity of both land and seascapes within humanity’s ‘safe operating space’ for the planet28
      – ‘safe’ from the perspective of achieving food security within the planet’s safe environmental boundaries. Contexts will
      vary in different geographic regions and locations. Improvements to agricultural production systems should allow more
      productive and resilient livelihoods and ecosystems, contributing to a more secure, sustainable and safe food system and
      providing access to adequate food and nutrition, and allowing poor rural people to escape from and remain out of poverty.
      Sustainable agriculture lies at the heart of delivering poverty reduction.

Food insecurity and climate change are already inhibiting                                        Difficult trade-offs will need to be considered when
human well-being and economic growth throughout the world                                        addressing current and future challenges for the global food
and these problems are poised to accelerate.29 Countries vary                                    system. Decisions taken today will have a profound effect not
in their vulnerability to climate change, the amount and type                                    only on agriculture and the global food system, but also on
of GHGs they emit and their opportunities to reduce GHG                                          our landscape and ecosystem services. The benefits of
emissions and improve agricultural productivity.30                                               strategic action taken now will be long-lasting, satisfying the
                                                                                                 needs of a growing world population while critical resources
Threats from climate change, population growth and                                               are efficiently managed. However, if there is a delay in serious
unsustainable resource use are affecting different regions of                                    commitment and action, hunger will continue to prevail and
the world (see Figure 2). Trends in population, diet, resource                                   probably intensify, and environmental damage could be
degradation and climate change impacts on productivity                                           irreparable, compromising the world’s capacity to produce
indicate that there is a real risk of global food shortfalls as the                              food in the future.
century progresses (see Figure 3).

      Climate change adaptation and mitigation

      The challenges of adaptation to climate change for agriculture in many parts of the world are enormous. The process of
      adaptation begins with an assessment of the different dimensions of vulnerability and of the appropriateness of a range of
      potential options for action, including their costs and benefits. In practice, adaptation is a collection of coping strategies,
      with each strategy focused on a particular threat. Some of these actions may be taken by individuals or communities
      reacting to climate change hazards as they occur; others may be more planned, depending for their initiation on
      government policies and institutions.

      Despite the many examples of successful attempts to reduce GHG emissions in agriculture within different environments,
      overall the potential for implementing large-scale mitigation measures has seen relatively little progress. Barriers include
      limited access to finance, technology and resources and lack of appropriate political, institutional and economic policies,
      as well as the possibility of short-term yield losses followed by long-term gains with some types of mitigation practices.
      A whole systems approach, incorporating both large-scale and locally specific economic, development and environmental
      conditions and their interactions with different mitigation measures, will be essential to minimizing the potential trade-offs.

27
     According to the National Academy of Sciences’ report, Toward Sustainable
     Agricultural Systems in the 21st Century, “Agricultural sustainability is defined by four
     generally agreed upon goals: Satisfy human food, feed, and fibre needs, and
     contribute to biofuel needs. Enhance environmental quality and the resource base.
     Sustain the economic viability of agriculture. Enhance the quality of life for farmers,
     farm workers, and society as a whole.”
28
     Rockstrom et al. 2009.
29
     Nelson et al. 2011.
30
     The Hague Conference 2010.

6
COMMISSION ON SUSTAINABLE AGRICULTURE AND CLIMATE CHANGE
(a) Global population (b) Global food production
8.0 120
7.0
Gross Production Index Number
100
6.0
(2004–2006 = 100)
Billions of people
80
5.0
4.0 60
3.0
40
2.0
20
1.0
0
0.0
1960 1970 1980 1990 2000 2010 1960 1970 1980 1990 2000 2010
(c) Global area cultivated land (d) Global area equipped for irrigation
6.0 0.4
5.0
0.3
4.0 Billion hectares
Billion hectares
3.0 0.2
2.0
0.1
1.0
0.0 0
1960 1970 1980 1990 2000 2010 1960 1970 1980 1990 2000 2010
(e) Global GHG emissions (land use change and forestry not included)
(f ) Global average temperature anomaly
35.0 0.6
Billions of tonnes (CO2 equivalent)
30.0
0.4
25.0
Degrees Celsius
20.0 0.2
15.0
0.0
10.0 1960 1970 1980 1990 2000 2010
5.0 -0.2
0.0
-0.4
1960 1970 1980 1990 2000 2010
Figure 3. A synthesis of several key trends in the food and climate systems.(a) Global population estimates based on medium-fertility
variant. Source: UN DESA’s World Population Prospects: The 2010 Revision. (b) Global food production estimated as annual volume of
agricultural production compared with the base period 2004–2006, FAO Gross Production Index Number. Source: FAO. (c) Global area of
cultivated land. Estimates from 1960 to 2007: Annual FAO land resource questionnaire for country land-use data supplemented with
information from official secondary data sources. Source: FAO’s ResourceSTAT-Land-use domain. (d) Total land area (global) equipped for
irrigation. FAOStat. http://faostat.fao.org. (e) GhG emissions. Total annual GhG emissions excluding land use change and forestry.
Estimates for 1960 to 2007: Cumulative Emissions indicator expresses a country’s total emissions across a specified range of years.
Source: CAIT (Climate Analysis Indicators Tool). (f ) Global average temperature anomalies. Estimates for 1960 to 2010: Anomalies from
1961 to 1990 for the combined global land and marine surface temperature record. Source: Climate Research Unit (CRU) and UK Met.
Office Hadley Centre.
7FINAL REPORT: Achieving food security in the face of climate change
Photo: C. Isenberg
Chapter II: Understanding the current food system
in the context of climate change — major
components and drivers
‘Business as usual’ in our globally interconnected food system increase by 70% by 2050, and will double in many low-income
will not bring us food security or environmental sustainability. countries.36
Several converging threats — from population growth, climate
change and the unsustainable use of resources — are steadily For low-income populations, food insecurity negatively affects
intensifying pressure on people and governments around the future livelihoods through the forced sale of assets that are
world to transform the way food is produced, distributed and difficult to rebuild, and through reduced expenditure on
consumed.31 education.37 In addition, a reduction in consumption can lead
to long-term health issues. In sub-Saharan Africa, poor health
reduces agricultural productivity, and some agricultural
II-A. Demography, development and diets practices contribute to health problems such as malaria,
pesticide poisoning and disease transmission from animals
On a planet with sufficient food for all, a billion people go to humans.38 The global population is increasingly urban; this
hungry.32 Another billion overconsume, increasing risks from has implications for land use, food production systems,
chronic diseases.33 The food system faces additional pressure access to food — and potentially civil unrest.39 In crowded
as the global population grows, to around 9 billion by 2050,34 cities, food security is weakened by the lack of suitable,
and as diets shift towards higher consumption of calories, fats nutrient-rich soil as well as growing space available for local
and animal products (see Figure 4). Food insecurity afflicts families.40
communities throughout the world wherever poverty prevents
assured access to food supplies. As well as causing widespread The proportion of people of working age in low-income
human suffering, food insecurity contributes to degradation country populations is increasing.41 Agriculture currently
and depletion of natural resources, migration to urban areas engages 2.6 billion people.42 Non-farm employment is limited
and across borders, and political and economic instability. in many low-income countries yet the viability of subsistence
agriculture is decreasing given small-scale land holdings, low
Most of this century’s growth in world population will occur in prices for agricultural products (exacerbated, in some cases,
low-income countries. For example, Africa’s population is by subsidised imports), high input costs and small surpluses.
projected to double from just over 1 billion in 2010 to about
2 billion by 2050.35 More people means more total food
demand. Projections suggest that demand for cereals will 36
FAO 2009a.
37
FAO 2010.
31
The Hague Conference 2010. 38
World Bank 2008.
32
FAO 2010. 39
Chen 2007; UN 2009.
33
Foresight 2007; World Health Organization 2011. 40
Worldwatch 2011.
34
United Nations Population Division 2010. 41
IFAD 2011.
35
UNDP 2006. 42
IAASTD 2009.
8Commission on Sustainable Agriculture and Climate Change
90%
80%
Carbohydrate
70%
60%
50%
40%
Fat
30%
20%
10%
Protein
0%
1500 1750 2000 2250 2500 2750 3000 3250 3500 3750
Energy: kcal/person/day
Figure 4. Structure of the world diet, 2005-2007. Diet composition for 178 countries is represented by three data points along a vertical
line corresponding to national dietary energy supply (blue = energy share from protein, red = energy share from fat, green = energy
share from carbohydrate). As economies develop, improvement in food access leads to increased caloric intake up to a plateau. From
there, diet structure changes are observed: consumption of cereals and vegetables decreases while that of sugar, fats and animal
products increases. Developed countries have undergone this second transition over a century. A similar but greatly accelerated pattern
can be seen in Asia, Central and Latin America, and to a lesser extent in Africa, where these diet transitions are occurring within 20 years
in emerging countries and within 40 years in developing countries. Source: Total energy supply and shares of protein, fat and
carbohydrate have been computed from the average values for the last three available years in the FAO database (2005, 2006 and 2007)
Update to Combris 2006, courtesy of the author.
Progress has been made towards the Millennium middle-income countries are facing a ‘double burden’ of
Development Goal of reducing the global poverty rate below malnutrition: a persistence of both macronutrient and
23%, yet there is great disparity in income growth both micronutrient undernutrition, notably among children, along
between and within countries.43 The majority of the world’s with a fast rise in the number of overweight and obese people,
poor and chronically undernourished live in rural settings and and consequent diet-related chronic diseases.50
are directly or indirectly dependent on agriculture for their
livelihoods.44 The likelihood of poverty is influenced by For households that are chronically undernourished or at risk
household-level conditions such as health, education, of food insecurity, food choices are extremely limited and are
harvests, assets and expenses as well as by regional-level largely driven by prices relative to incomes. As income
conditions such as infrastructure, markets, economic growth, increases, households’ eating preferences are driven more by
enabling institutions and conflict or disasters.45 Where capital the relative prices of different foods (for example, the prices of
investment in agriculture is low, value added per worker also fats versus carbohydrates) (see Figure 5). These households
tends to be low and rural poverty tends to be higher.46 have greater choice within a context largely determined by
retailers, as well as by culture and lifestyles.51 As freedom of
The number of people suffering from chronic hunger increased eating choice increases, caloric intake reaches a plateau while
from under 800 million in 1996 to over 1 billion in 2009.47 the relative consumption of fats continues to increase.52
In October 2010, 925 million people were estimated to be Highest-income, maximum-choice households achieve a
undernourished.48 In 2008, 1.5 billion adults were overweight, plateau in terms of both caloric intake and diet composition.
including over 200 million men and nearly 300 million women
who were obese.49 In addition, a growing number of low- and
43
United Nations 2011.
44
UNCTAD 2011.
45
IFAD 2011.
46
IAASTD 2009.
47
Vermeulen et al. 2012. 50
World Bank 2008; WHO 2011.
48
FAO 2010. 51
Guyomard et al. 2012.
49
WHO 2011. 52
Combris 2006; Popkin 2006.
9FINAL REPORT: Achieving food security in the face of climate change
MINIMUM SOME MUCH MAX
CHOICE CHOICE CHOICE CHOICE
Car
boh
Relative contribution to diet
ydr
ate
Fat
Protein
Income and access to food
Figure 5. Relationship of human diet to income. Despite great underlying differences in culture and environment, the pattern of average
diet change is remarkably similar around the world, as per capita income and access to food improve.53 This schematic illustrates that, as
food access increases, protein intake remains almost constant, but the dominant sources typically shift from vegetables to animal
products. (A high proportion of animal products in diets translates into larger land areas required for food production and greater
impacts on the climate.) Simultaneously, the predominant source of dietary energy shifts from complex starches to simple sugars and
fats (ie, fat intake increases while carbohydrate share declines: simple sugars and fats replace complexes starches). These patterns of
change have important consequences for the health of individuals (eg, obesity-related diseases result from excessive intake of energy
and diet dominated by sugars and fats). Source: figure derived from analyses first presented in Perisse et al 1969.
Total global food demand, GHG emissions and land
competition will increase as more of the world’s consumers
switch to diets that are richer in meat, dairy products and
processed foods.54 Dietary changes are highly significant for
the future food system because, per calorie, some food items
require considerably more resources (such as land, water and
energy) to produce than others. Methane, nitrous oxide and
carbon dioxide emitted by livestock activities (i.e. enteric
fermentation and manure management) and land use changes
make a substantial contribution to anthropogenic GHG
emissions.55 While patterns of dietary change are strongly
dependent on the interaction of economic drivers with
cultural, social and religious influences, studies predict
significant increases in per capita meat consumption56 from
its current level of 15% of the total global human diet.57
Tomato fruits damaged by insect pests. Climate change brings risk of increased crop
losses due to pest outbreaks
Photo: IITA
53
The interdependence of income, food access and diet composition have been
recognized for many years (Périssé et al 1969).
54
Parry et al. 2009.
55
Steinfeld 2006.
56
Bruinsma (2009) projects increases from 37 kg/person/year at present to
approximately 52 kg/person/year in 2050.
57
FAO 2006.
10Commission on Sustainable Agriculture and Climate Change
Table 1. Status of selected global parameters regions. Areas currently suffering from food insecurity are
expected to experience disproportionately negative effects.
People in the world (2011)58 7 billion
To reduce the effect of climate change on food supplies,
Undernourished people (2010)59 0.9 billion livelihoods and economies, incentivizing greatly increased
adaptive capacity in agriculture — both to long-term climatic
Overweight people over age 20 (2008)60 1.5 billion trends and to increasing variability in weather patterns —
is an urgent priority.
People living on less than USD 1.25 per day 1.4 billion
(2005)61 Climate change refers to a broad array of alterations in climatic
People living in dryland areas (2007) 62 2 billion and weather conditions characterized by shifts in average
conditions and in the frequency and severity of extreme
People dependent on degrading land63 1.5 billion conditions. Agriculture is highly sensitive to climate, both in
terms of longer-term trends in the average conditions of
Losses due to climatological events (extreme USD 11.4 billion rainfall and temperature, which determine the global
temperature, drought, forest fire) (2011)64 distribution of food crops, but also in terms of interannual
Area of agricultural land (2009)65 4.9 billion hectares variability and the occurrence of droughts, floods, heat waves,
frosts and other extreme events.70 One of the expected results
Area of croplands, pasture and grazing lands 3.7 billion hectares of climate change is increasing climatic variability; for example,
devoted to raising animals66 even where mean rainfall is not projected to change, there are
likely to be more significant droughts and more significant
Annual growth in world agricultural 2.2%
extreme precipitation events. A changing climate is associated
production (1997–2007)67
with increased threats to food safety, post-harvest losses and
Food produced for human consumption lost 1.3 billion tonnes pressure from invasive species, pests and diseases.71 Already
or wasted annually68 heightened by increased global movement of goods and
people, a warming climate is likely to increase the incidence
and geographic spread of human, animal and plant diseases.72
II-B. Climate change impacts on agriculture
Extreme weather events and climate change will exacerbate
Our climate is changing and, given the levels of GHGs already the fragility of food production systems and the natural
in our atmosphere, will continue to do so, presenting threats resource base — particularly in environments prone to
of serious social, economic and ecological consequence. The degradation and desertification, in areas of widespread or
planet is experiencing more extreme weather (e.g. heavy intense water stress, and wherever poverty undermines the
precipitation events, coastal high water, and geographic shifts capacity of rural people to take the needed preventive steps.73
in storm and drought patterns) and warmer temperatures.69 Farmers can no longer rely on historical averages of
Ever-higher average global temperatures are likely unless temperature and rainfall, making it harder for them to plan
there are dramatic and urgent reductions in GHG emissions and manage production when planting seasons and weather
across a wide range of human activities, including the burning patterns are shifting. Rainfed agriculture and agropastoral
of fossil fuels and land use. In the coming decades, global systems are particularly vulnerable to climatic variability.
climate change will have an adverse overall effect on In some situations, global warming may make water more
agricultural production (see Figure 6) and will bring us available, but for others, the effect will be to make water
towards, and perhaps over, critical thresholds in many scarcity even more acute.74
Modest climate change (at the levels that now seem near-
58
www.un.org/en/development/desa/news/population/world-to-welcome-seven- inevitable, indexed by a global mean temperature rise of
billionth-citizen.html
59
FAO 2010. around 2°C75) will lead to decreases in agricultural production
60
World Health Organization 2011. in some places (notably places already hot and dry) and
61
World Bank: Poverty and Equity Data. http://povertydata.worldbank.org/poverty/
home/
increases in others (these are likely to be local areas within
62
UNCCD 2011. mid- to high-latitude regions).76 Even a 2°C increase is not risk
Ibid. free. Climate change is likely to change rainfall patterns,
63
64
Munich RE Geo Risks Research NatCatSERVICE. Natural catastrophes worldwide 2011.
Climatological events represent 3% of natural catastrophes. Meteorological (storm) resulting in shorter growing seasons in the future, particularly
events represent 19% (USD 72.2 billion) and hydrological (flood, mass movement) for subsistence farmers in Africa and parts of South Asia who
events represent 17% (USD 64.6 billion).
65
Foley et al. 2011. Croplands cover 1.53 billion hectares. Pastures and grazing lands
rely on rainfed agriculture.77 Global food production will still
cover another 3.38 billion hectares. In combination, agriculture uses approximately
38% of the earth’s ice-free land. 70
IPCC 2012.
66
Ibid. Croplands devoted to animal feed cover about 350 million hectares. Combined 71
Costello et al. 2009; IAASTD 2009; Vermeulen et al. 2012.
with 3.38 billion hectares of pasture and grazing lands, land use for raising animals 72
Foresight 2011; IAASTD 2009; Royal Society 2009.
totals approximately 3.73 billion hectares (75% of the world’s agricultural land). 73
IPCC 2012.
67
Bruinsma 2009. 74
Ibid.
68
Gustavsson et al. 2011. This estimate is equivalent to roughly one-third of the edible 75
Moss et al. 2008.
parts of food produced globally for human consumption. 76
IAASTD 2009; Parry et al. 2009; Vermeulen et al. 2012.
69
IPCC 2012. 77
World Bank 2008.
11FINAL REPORT: Achieving food security in the face of climate change
Hugo Ahlenius, UNEP/GRID-Arendal
-50% -15% 0 +15% +35% No data
Figure 6. Projected changes in agricultural production in 2080 due to climate change. Source: Cline. 2007. Projections assume a
uniform 15% increase in yields due to the fertilization effect of rising carbon dioxide in the atmosphere on some plant species.
(Note that this coarse-grain analysis does not project local-scale impacts which require geographically-specific analysis.)
be possible at levels similar to or above current production fertility, biodiversity and water resources. In many regions
levels, but new farming practices to adapt to climate change there are large gaps between potential and actual crop yields
will be needed, and these may increase production costs. (see Figure 7). Every year, an estimated 12 million hectares of
Issues of inequitable burden sharing are more likely, as are agricultural land, which could potentially produce 20 million
potential increases in the already-existing problems of local tonnes of grain, are lost to land degradation, adding to
food insecurity. Climate change above 3°C risks overall the billions of hectares that are already degraded.79
decreases in the global food production capacity that would It is estimated that a third of food produced for human
be profoundly destabilizing even in places where food consumption is lost or wasted across the global food
production remains adequate locally. However, there is still system.80 It is clear that our collective choices relating to
much that is not known, and there are many uncertainties in agriculture and food systems must be revisited to eliminate
future climate trajectories, generated by complicated avoidable waste and losses.
feedback loops and by potential tipping points in the
climate system. Globally, agriculture is both part of the problem and part of
the solution to climate change. Activities relating to the
production of food currently contribute between a quarter
II-C. Food production, supply chains and the and a third of the GHG emissions that cause global climate
environment change. Agriculture continues to expand into forested and
other lands in a number of regions. Land use change, primarily
Inefficiencies in food supply chains have a negative impact on deforestation, is responsible for as much as 18% of global
the environment, lower productivity and waste food. Current GHG emissions and another 12–14% are associated with
farming practices, including land clearing and inefficient use direct agricultural GHG emissions, including from fertilisers
of fertilizers and organic residues, make agriculture a and livestock.81 Agriculture’s contribution to global GHG
significant contributor to GHG emissions.78 From the farm emissions will remain high in the foreseeable future and may
gate to consumers, processing, refrigeration and other even grow relative to emissions from other sectors.82 There is
supply chain activities are an additional source of GHG
emissions. As global demand for food, fodder and bioenergy 79
United Nations Convention to Combat Desertification. 2011; Bai et al. 2008.
crops grows, many agricultural systems are depleting soil 80
Gustavsson et al. 2011.
81
Royal Society 2009; Foresight 2011.
78
IPCC 2007; The Hague Conference 2010. 82
Smith et al. 2007.
12Commission on Sustainable Agriculture and Climate Change
technical potential to reduce the contribution of the food improved land management, have co-benefits for both the
system to climate change, but not eliminate it, given the reliability of food production and the quality of the
growing need for food and the fundamental nature of the environment. However, the contribution of such sinks may be
processes that result in the emissions. small in comparison with the scale of the global climate change
problem and their benefits are realizable in only the short to
GHGs are emitted across the food supply chain. The largest medium term (i.e. there is sink saturation).88 The biophysical
sources of emissions are related to agricultural production potential of agricultural mitigation has been estimated based
through clearing of new land for cultivation, use of nitrogen on highly aggregated data and implementation has been
fertiliser and methane from ruminant livestock. Drivers for limited due to financial and policy constraints89.
many production systems occur throughout the supply chain,
and are influenced through global and national policies.83 Farming systems around the world range between large-scale,
Emissions resulting from land use change, specifically tropical highly specialized, capital-intensive operations (e.g. in Europe
deforestation, are likely to remain significant over the next and North America) and small-scale, labour-intensive
three decades, but their location and cause are likely to production systems with diverse livelihood strategies both on
shift.84 Livestock production is the world’s largest user of land and off farm.90 Some types of food production system
resources for grazing and feed production and an important destabilize the natural resource base, drive the loss of
driver of deforestation.85 biodiversity, and contribute to GHG emissions, with the
potential to damage the environment irreparably and to
There is a large potential for reducing net food system compromize the world’s capacity to produce food in the
emissions, per unit of food consumed as well as in absolute future. Market demand for organic and eco-certified products,
terms, through efficiency measures in production and also consumer expectations for social and environmental
through demand management, for example reduction of loss corporate responsibility and longer-term concerns about
and waste in supply chains and changing food preferences.86 sources of supply have contributed to greater attention being
There is meaningful potential for carbon sinks associated with a paid to sustainability by some agribusinesses.91
number of agricultural practices. Some of these, such as87
million kcals per hectare
0 0.5 1 1.5 2 2.5 3 3.5 4 4.5 5
Figure 7. Closing yield gaps for major crops. Crop production in many parts of the world does not meet its full yield potential. Improved
nutrient and water supplies and other production strategies can lead to significant improvements in crop yield. A recent analysis of 16
major staple food and feed crops87 estimated that increasing yields to within 95% of their potential would add 2.3 billion tonnes of crop
production (5 x 10^15 kilocalories), which is a 58% increase over current production. Source: Foley et al, 2011. Data provided by
University of Minnesota’s Institute on the Environment.
83
Foresight 2011.
84
Lambin and Meyfroidt 2011.
85
Lipper et al. 2010. 88
Smith et al. 2007.
86
Foresight 2011; INRA/CIRAD 2011. 89
Vermeulen et al. 2012.
87
Barley, cassava, groundnut, maize, millet, potato, oil palm, rapeseed, rice, rye, 90
World Bank 2010a.
sorghum, soybean, sugarbeet, sugarcane, sunflower and wheat. 91
Worldwatch 2011.
13FINAL REPORT: Achieving food security in the face of climate change
soil quality through erosion, compaction, acidification and
Going beyond the major cereal crops salinization, and reduce biological activity as a result of
pesticide and herbicide applications, excessive fertilisation,
There is a wide variety of edible plant species in use and loss of organic matter.94 Climate change is likely to
around the world, yet research and development has exacerbate land degradation and desertification. Excessive
been directed to only a very few of the possible crop use of fertilizers and pesticides in water catchment areas can
species suitable for agriculture, most of them cereals. pollute waterways and aquifers, often causing eutrophication
Many understudied edible species compare very in water bodies and damage to aquatic ecosystems. A lack of
favourably with major grains on a production per available access to basic fertilizer and pesticide inputs, leads
growing time basis for protein and calories and have to extreme gaps between potential and actual yields. Rising
more favourable nutritional properties and cooking energy and agricultural input prices and the loss of crop
requirements. Some of these advantages may be offset biodiversity also threaten production systems.
by post-harvest losses, although estimated loss rates
are difficult to determine, especially where the crops are (a) Per capita food losses and waste (kg/year)
used for subsistence. Many of these species can be left 350
to be harvested as needed, or can slot into very short
300
cropping windows, further highlighting the role they can
play in agricultural systems that are more resilient and 250
better manage the risks of climate change and extreme 200
weather. Some species, such as cassava and amaranth,
150
have been shown to thrive under hot and dry growing
conditions. Varieties of beans and millet are already 100
important sources of nutrition in many places around
50
the world. Given strong trends towards the urbanization
of food-insecure populations, peri-urban and urban 0
Europe North Industria- Subsahara North South & Latin
agriculture, which typically include minor crop species, America lized Africa Africa, West Southeast America
& Oceania Asia & Central Asia
are likely to become even more significant with respect Africa
to subsistence and in some cases may lead to the Consumer Production to retailing
development of new markets.
(b) Food losses – Cereals
40%
30%
20%
10%
0%
Europe North Industria- Subsahara North South & Latin
America lized Africa Africa, West Southeast America
Many edible species may be resilient to climate changes, but they are currently & Oceania Asia & Central Asia
understudied. Genebanks and traditional breeds may contain varieties that Africa
offer multiple benefits for food, forage and climate adaptation Consumption Distribution Processing Postharvest Agriculture
Photo: N. Palmer (CIAT)
Figure 8. Food loss and waste within the food system.
(a) Per capita food losses and waste (all agricultural products),
Agricultural production systems are associated with a series at consumption and pre-consumption stages, in different
of interconnected natural resource management challenges. regions. (b) Part of initial cereal production lost or wasted at
Agriculture consumes 70% of total global ‘blue water’ different stages of food supply chains, in different regions.
withdrawals from available rivers and aquifers, and will Please note these figures do not highlight losses due to animal
increasingly compete for water with pressures from industry, feed (gap between the amount of plant calories consumed in
domestic use and the need to maintain environmental flows.92 animal feed and the amount of animal calories recovered).
One-fifth of the world’s freshwater renewable resources are For further information, see Lundqvist et al. (2008).
shared between countries,93 creating tensions over resource Source: Gustavsson, 2011.
sharing. Some modern agricultural practices adversely affect
92
Foresight 2011; The Hague Conference 2010.
93
World Bank 2010b. 94
NAS 2010.
14Commission on Sustainable Agriculture and Climate Change
Food waste and loss vary by region and by point in the food
supply chain (see Figure 8). Overall, food loss in low-income
countries occurs in the production, storage and distribution
stages of supply chains, whereas there is significant waste at
the consumption stage in medium- and high-income
countries. Climatic fluctuations affect post-harvest losses
and food safety during storage (e.g. by causing changes in
populations of toxin-producing fungi). More frequent extreme
weather events caused by climate change will damage
infrastructure (such as warehouses and roads), resulting in
detrimental impacts on food storage and distribution, to
which the poor will be most vulnerable. Food loss will be
greater where links between producers and consumers are
slow. In retail settings, over-ordering of stock, cosmetic
imperfections and other issues contribute to food waste.95
In households, food waste results when consumers buy too
much or at the wrong time or have a careless attitude.96
Producers face a growing set of risks relating to natural
disasters, environmental changes, health threats, resource A farmer in Ghana’s Upper West Region, which has suffered failed rains and rising
constraints and the volatility of food prices.97 Multiple risks temperatures. Areas currently experiencing food insecurity will be hit worst by climate
limit the ability of poor rural farmers to take up new change
Photo: N. Palmer (CIAT)
agricultural practices.98 Access to land and marine resources
for food production is affected by insecure property rights, 4 billion).103 At the beginning of the 21st century, only 6% of
changes in sea level and river flows (with new land in high total spending in low-income countries came from private
latitude countries becoming suitable for cultivation), companies.104 Commercial bank lending to agriculture in
increases in large-scale land acquisition, pressure on common low-income countries is also small — less than 10% in
property resources and emerging land uses such as sub-Saharan Africa.105 Private investment funds targeting
urbanization and biofuel production.99 agriculture in these countries are an interesting recent
development, but such investments are currently still small.
II-D. Investment, trade and food price volatility
Most food system investments are focused on boosting global
food supply, expanding the role of agribusiness and
Agriculture continues to be the economic mainstay of most
increasing trade rather than on reinvigorating local markets
low-income countries, employing the majority of the
and smallholder producers.106 Large institutional gaps remain
population in those countries. Investments made by farm
in supporting the competitiveness of smallholders (e.g. by
households are critical to overall improvements in agricultural
securing access to land, inputs, financing, markets and
productivity. The importance of agricultural research and
insurance). Producer organizations are only just beginning to
development (R&D) has been recognized,100 yet investment
represent the interests of poor smallholders. The rapid growth
has been declining from both donor partners and low-income
of retail chains and higher product and process standards by
country governments over recent decades.101 This has
global retailers tend to inhibit the participation of small-scale
constrained improvements in food security and reductions in
producers in world food markets.107
poverty and has created a knowledge divide between low-
and high-income countries, interspersed with a few high-
From 1961 to 2003, world food trade increased from 1500
investment, high-performance emerging economies.102 The
Gkcal/day to over 7000 Gkcal/day.108 Latin American and
capacity of most low-income countries to fill the investment
Organisation for Economic Co-operation and Development
gap is limited. In low-income countries with agriculture-based
(OECD) countries are net exporters of food calories, while
economies, domestic public support to agriculture is, on
Asia, Africa and the Middle East are net importing regions.109
average, about 4% of gross domestic product (GDP) and
Increasingly, raw materials are standardized, food is more
official development assistance (ODA) provides the balance
highly processed and the role of large-scale distribution
(ODA commitments for agriculture in 2008 were USD
systems is expanding. Important new features of the global
trade in food include the growing integration of global supply
95
Worldwatch 2011.
96
Gustavsson et al. 2011.
97
IAASTD 2009; The Hague Conference 2010. 103
Lipper et al. 2010. World Bank 2008.
98
IFAD 2011. 104
IAASTD 2009.
99
Foresight 2011; Parry et al. 2009; Royal Society 2009. 105
Mhlanga 2010.
100
The Maputo declaration by African governments committed 10% of national budgets 106
The Hague Conference 2010; Worldwatch 2011.
to agriculture. 107
IFAD 2011.
101
IAASTD 2009; World Bank 2008. 108
INRA/CIRAD 2011.
102
World Bank 2008. 109
Ibid.
15You can also read