11 Regional Climate Projections - Coordinating Lead Authors: IPCC
←
→
Page content transcription
If your browser does not render page correctly, please read the page content below
11

Regional Climate Projections

Coordinating Lead Authors:
Jens Hesselbjerg Christensen (Denmark), Bruce Hewitson (South Africa)

Lead Authors:
Aristita Busuioc (Romania), Anthony Chen (Jamaica), Xuejie Gao (China), Isaac Held (USA), Richard Jones (UK),
Rupa Kumar Kolli (India), Won-Tae Kwon (Republic of Korea), René Laprise (Canada), Victor Magaña Rueda (Mexico),
Linda Mearns (USA), Claudio Guillermo Menéndez (Argentina), Jouni Räisänen (Finland), Annette Rinke (Germany),
Abdoulaye Sarr (Senegal), Penny Whetton (Australia)

Contributing Authors:
R. Arritt (USA), R. Benestad (Norway), M. Beniston (Switzerland), D. Bromwich (USA), D. Caya (Canada), J. Comiso (USA),
R. de Elía (Canada, Argentina), K. Dethloff (Germany), S. Emori (Japan), J. Feddema (USA), R. Gerdes (Germany),
J.F. González-Rouco (Spain), W. Gutowski (USA), I. Hanssen-Bauer (Norway), C. Jones (Canada), R. Katz (USA), A. Kitoh (Japan),
R. Knutti (Switzerland), R. Leung (USA ), J. Lowe (UK), A.H. Lynch (Australia), C. Matulla (Canada, Austria), K. McInnes (Australia),
A.V. Mescherskaya (Russian Federation), A.B. Mullan (New Zealand), M. New (UK), M.H. Nokhandan (Iran), J.S. Pal (USA, Italy),
D. Plummer (Canada), M. Rummukainen (Sweden, Finland), C. Schär (Switzerland), S. Somot (France), D.A. Stone (UK, Canada),
R. Suppiah (Australia), M. Tadross (South Africa), C. Tebaldi (USA), W. Tennant (South Africa), M. Widmann (Germany, UK),
R. Wilby (UK), B.L. Wyman (USA)

Review Editors:
Congbin Fu (China), Filippo Giorgi (Italy)

This chapter should be cited as:
Christensen, J.H., B. Hewitson, A. Busuioc, A. Chen, X. Gao, I. Held, R. Jones, R.K. Kolli, W.-T. Kwon, R. Laprise, V. Magaña Rueda, L.
Mearns, C.G. Menéndez, J. Räisänen, A. Rinke, A. Sarr and P. Whetton, 2007: Regional Climate Projections. In: Climate Change 2007:
The Physical Science Basis. Contribution of Working Group I to the Fourth Assessment Report of the Intergovernmental Panel on Climate
Change [Solomon, S., D. Qin, M. Manning, Z. Chen, M. Marquis, K.B. Averyt, M. Tignor and H.L. Miller (eds.)]. Cambridge University
Press, Cambridge, United Kingdom and New York, NY, USA.
Regional Climate Projections                                                                                                                                                         Chapter 11

Table of Contents

      Executive Summary                    .................................................... 849        11.7 Australia – New Zealand.................................. 896
                                                                                                                  Box 11.4: Land Use and Land Cover Change
      11.1 Introduction ......................................................... 852                                       Experiments Related to Climate Change ............. 897
          11.1.1 Summary of the Third Assessment Report ........ 852                                           11.7.1 Key Processes ................................................... 898
          11.1.2 Introduction to Regional Projections ................. 852                                    11.7.2 Skill of Models in Simulating Present
            Box 11.1: Summary of Regional Responses....................... 858                                        Climate ............................................................... 898
          11.1.3 Some Unifying Themes ...................................... 860                               11.7.3 Climate Projections ............................................ 899

      11.2 Africa         ..................................................................... 866        11.8 Polar Regions ....................................................... 902
          11.2.1 Key Processes ................................................... 866                         11.8.1 Arctic .................................................................. 903
          11.2.2 Skill of Models in Simulating Present and                                                     11.8.2 Antarctic ............................................................. 907
                 Past Climates ..................................................... 867
                                                                                                           11.9 Small Islands ........................................................ 909
          11.2.3 Climate Projections ............................................ 867
                                                                                                               11.9.1 Key Processes ................................................... 910
      11.3 Europe and the Mediterranean ....................                                  872
                                                                                                               11.9.2 Skill of Models in Simulating Present
          11.3.1 Key Processes ................................................... 872                                Climate ............................................................... 911
          11.3.2 Skill of Models in Simulating Present                                                         11.9.3 Temperature and Precipitation Projections ........ 911
                 Climate ............................................................... 872                   11.9.4 Sea Level Rise ................................................... 914
            Box 11.2: The PRUDENCE Project.................................... 873
                                                                                                               11.9.5 Tropical Cyclones............................................... 915
          11.3.3 Climate Projections ............................................ 873                             Box 11.5: Coastal Zone Climate Change ........................... 916

      11.4 Asia        ......................................................................... 879       11.10 Assessment of Regional Climate
          11.4.1 Key Processes ................................................... 879                           Projection Methods ........................................ 918
          11.4.2 Skill of Models in Simulating Present                                                         11.10.1 Methods for Generating Regional
                 Climate ............................................................... 880                           Climate Information .......................................... 918
          11.4.3 Climate Projections ............................................ 881                          11.10.2 Quantifying Uncertainties ................................. 921
            Box 11.3: Climatic Change in Mountain Regions ................ 886
                                                                                                           Frequently Asked Question
      11.5 North America ..................................................... 887                             FAQ 11.1: Do Projected Changes in Climate Vary from
          11.5.1 Key Processes ................................................... 887                                   Region to Region?.............................................. 865

          11.5.2 Skill of Models in Simulating Present                                                     References........................................................................ 926
                 Climate ............................................................... 888
          11.5.3 Climate Projections ............................................ 889
                                                                                                       Supplementary Material
      11.6 Central and South America ............................ 892
          11.6.1 Key Processes ................................................... 892                 The following supplementary material is available on CD-ROM and
          11.6.2 Skill of Models in Simulating Present                                                 in on-line versions of this report.
                 Climate ............................................................... 893           Supplementary Figures S11.1–S11.37
          11.6.3 Climate Projections ............................................ 894                  Supplementary Tables S1.1 and S1.2

          11.6.4 Extremes ............................................................ 896             Supplementary References

848
Chapter 11 Regional Climate Projections
Executive Summary Previous chapters describe observed climate change
on regional scales (Chapter 3) and compare global model
simulations with these changes (Chapter 9). Comparisons of
Increasingly reliable regional climate change projections are model simulations of temperature change with observations can
now available for many regions of the world due to advances be used to help constrain future regional temperature projections.
in modelling and understanding of the physical processes of the Regional assessments of precipitation change rely primarily on
climate system. A number of important themes have emerged: convergence in both global and downscaling models along with
physical insights. Where there is near unanimity among models
• Warming over many land areas is greater than global annual
with good supporting physical arguments, as is more typical for
mean warming due to less water availability for evaporative
middle and higher latitudes, these factors encourage stronger
cooling and a smaller thermal inertia as compared to the
statements as to the likelihood of a regional climate change. In
oceans.
some circumstances, physical insights alone clearly indicate the
• Warming generally increases the spatial variability of direction of future change.
precipitation, contributing to a reduction of rainfall in the The summary likelihood statements on projected regional
subtropics and an increase at higher latitudes and in parts climate are as follows:
of the tropics. The precise location of boundaries between
• Temperature projections: These are comparable in
regions of robust increase and decrease remains uncertain
magnitude to those of the TAR and confidence in the
and this is commonly where Atmosphere-Ocean General
regional projections is now higher due to a larger number
Circulation Model (AOGCM) projections disagree.
and variety of simulations, improved models, a better
• The poleward expansion of the subtropical highs, combined understanding of the role of model deficiencies and more
with the general tendency towards reductions in subtropical detailed analyses of the results. Warming, often greater
precipitation, creates especially robust projections of a than the global mean, is very likely over all landmasses.
reduction in precipitation at the poleward edges of the
• Precipitation projections: Overall patterns of change are
subtropics. Most of the regional projections of reductions
comparable to those of TAR, with greater confidence in
in precipitation in the 21st century are associated with areas
the projections for some regions. Model agreement is seen
adjacent to these subtropical highs.
over more and larger regions. For some regions, there are
• There is a tendency for monsoonal circulations to result grounds for stating that the projected precipitation changes
in increased precipitation due to enhanced moisture are likely or very likely. For other regions, confidence in the
convergence, despite a tendency towards weakening of the projected change remains weak.
monsoonal flows themselves. However, many aspects of
• Extremes: There has been a large increase in the available
tropical climatic responses remain uncertain.
analyses of changes in extremes. This allows for a more
Atmosphere-Ocean General Circulation Models remain comprehensive assessment for most regions. The general
the primary source of regional information on the range findings are in line with the assessment made in TAR and
of possible future climates. A clearer picture of the robust now have a higher level of confidence derived from multiple
aspects of regional climate change is emerging due to sources of information. The most notable improvements
improvement in model resolution, the simulation of processes in confidence relate to the regional statements concerning
of importance for regional change and the expanding set of heat waves, heavy precipitation and droughts. Despite these
available simulations. Advances have been made in developing advances, specific analyses of models are not available for
probabilistic information at regional scales from the AOGCM some regions, which is reflected in the robust statements
simulations, but these methods remain in the exploratory phase. on extremes. In particular, projections concerning extreme
There has been less development extending this to downscaled events in the tropics remain uncertain. The difficulty in
regional information. However, downscaling methods have projecting the distribution of tropical cyclones adds to
matured since the Third Assessment Report (TAR; IPCC, this uncertainty. Changes in extra-tropical cyclones are
2001) and have been more widely applied, although only in dependent on details of regional atmospheric circulation
some regions has large-scale coordination of multi-model response, some of which remain uncertain.
downscaling of climate change simulations been achieved.
The following summarises the robust findings of the
Regional climate change projections presented here are
projected regional change over the 21st century. Supporting
assessed drawing on information from four potential sources:
narratives are provided in Sections 11.2 to 11.9. These changes
AOGCM simulations; downscaling of AOGCM-simulated
are assessed as likely to very likely taking into account the
data using techniques to enhance regional detail; physical
uncertainties in climate sensitivity and emission trajectories (in
understanding of the processes governing regional responses;
the Special Report on Emission Scenarios (SRES) B1/A1B/B2
and recent historical climate change.
scenario range) discussed in earlier chapters.
849Regional Climate Projections Chapter 11
All land regions: North America:
It is very likely that all land regions will warm in the 21st The annual mean warming is likely to exceed the global
century. mean warming in most areas. Seasonally, warming is likely to
be largest in winter in northern regions and in summer in the
Africa: southwest. Minimum winter temperatures are likely to increase
more than the average in northern North America. Maximum
Warming is very likely to be larger than the global annual summer temperatures are likely to increase more than the
mean warming throughout the continent and in all seasons, with average in the southwest. Annual mean precipitation is very
drier subtropical regions warming more than the moister tropics. likely to increase in Canada and the northeast USA, and likely to
Annual rainfall is likely to decrease in much of Mediterranean decrease in the southwest. In southern Canada, precipitation is
Africa and the northern Sahara, with a greater likelihood of likely to increase in winter and spring but decrease in summer.
decreasing rainfall as the Mediterranean coast is approached. Snow season length and snow depth are very likely to decrease
Rainfall in southern Africa is likely to decrease in much of the in most of North America except in the northernmost part of
winter rainfall region and western margins. There is likely to be Canada where maximum snow depth is likely to increase.
an increase in annual mean rainfall in East Africa. It is unclear
how rainfall in the Sahel, the Guinean Coast and the southern Central and South America:
Sahara will evolve.
The annual mean warming is likely to be similar to the global
Mediterranean and Europe: mean warming in southern South America but larger than the
global mean warming in the rest of the area. Annual precipitation
Annual mean temperatures in Europe are likely to increase more is likely to decrease in most of Central America and in the
than the global mean. Seasonally, the largest warming is likely to southern Andes, although changes in atmospheric circulation
be in northern Europe in winter and in the Mediterranean area may induce large local variability in precipitation response in
in summer. Minimum winter temperatures are likely to increase mountainous areas. Winter precipitation in Tierra del Fuego
more than the average in northern Europe. Maximum summer and summer precipitation in south-eastern South America is
temperatures are likely to increase more than the average in likely to increase. It is uncertain how annual and seasonal mean
southern and central Europe. Annual precipitation is very likely rainfall will change over northern South America, including
to increase in most of northern Europe and decrease in most of the Amazon forest. However, there is qualitative consistency
the Mediterranean area. In central Europe, precipitation is likely among the simulations in some areas (rainfall increasing in
to increase in winter but decrease in summer. Extremes of daily Ecuador and northern Peru, and decreasing at the northern tip
precipitation are very likely to increase in northern Europe. The of the continent and in southern northeast Brazil).
annual number of precipitation days is very likely to decrease
in the Mediterranean area. Risk of summer drought is likely to Australia and New Zealand:
increase in central Europe and in the Mediterranean area. The
duration of the snow season is very likely to shorten, and snow Warming is likely to be larger than that of the surrounding
depth is likely to decrease in most of Europe. oceans, but comparable to the global mean. The warming is
less in the south, especially in winter, with the warming in
Asia: the South Island of New Zealand likely to remain less than
the global mean. Precipitation is likely to decrease in southern
Warming is likely to be well above the global mean in central Australia in winter and spring. Precipitation is very likely to
Asia, the Tibetan Plateau and northern Asia, above the global decrease in south-western Australia in winter. Precipitation
mean in eastern Asia and South Asia, and similar to the global is likely to increase in the west of the South Island of New
mean in Southeast Asia. Precipitation in boreal winter is very Zealand. Changes in rainfall in northern and central Australia
likely to increase in northern Asia and the Tibetan Plateau, are uncertain. Increased mean wind speed is likely across the
and likely to increase in eastern Asia and the southern parts of South Island of New Zealand, particularly in winter. Increased
Southeast Asia. Precipitation in summer is likely to increase frequency of extreme high daily temperatures in Australia and
in northern Asia, East Asia, South Asia and most of Southeast New Zealand, and a decrease in the frequency of cold extremes
Asia, but is likely to decrease in central Asia. It is very likely is very likely. Extremes of daily precipitation are very likely to
that heat waves/hot spells in summer will be of longer duration, increase, except possibly in areas of significant decrease in mean
more intense and more frequent in East Asia. Fewer very cold rainfall (southern Australia in winter and spring). Increased risk
days are very likely in East Asia and South Asia. There is very of drought in southern areas of Australia is likely.
likely to be an increase in the frequency of intense precipitation
events in parts of South Asia, and in East Asia. Extreme rainfall
and winds associated with tropical cyclones are likely to increase
in East Asia, Southeast Asia and South Asia.
850Chapter 11 Regional Climate Projections
Polar regions:
The Arctic is very likely to warm during this century more
than the global mean. Warming is projected to be largest in
winter and smallest in summer. Annual arctic precipitation
is very likely to increase. It is very likely that the relative
precipitation increase will be largest in winter and smallest in
summer. Arctic sea ice is very likely to decrease in its extent and
thickness. It is uncertain how the Arctic Ocean circulation will
change. The Antarctic is likely to warm and the precipitation
is likely to increase over the continent. It is uncertain to what
extent the frequency of extreme temperature and precipitation
events will change in the polar regions.
Small Islands:
Sea levels are likely to rise on average during the century
around the small islands of the Caribbean Sea, Indian Ocean
and northern and southern Pacific Oceans. The rise will likely
not be geographically uniform but large deviations among
models make regional estimates across the Caribbean, Indian
and Pacific Oceans uncertain. All Caribbean, Indian Ocean and
North and South Pacific islands are very likely to warm during
this century. The warming is likely to be somewhat smaller
than the global annual mean. Summer rainfall in the Caribbean
is likely to decrease in the vicinity of the Greater Antilles but
changes elsewhere and in winter are uncertain. Annual rainfall
is likely to increase in the northern Indian Ocean with increases
likely in the vicinity of the Seychelles in December, January and
February, and in the vicinity of the Maldives in June, July and
August, while decreases are likely in the vicinity of Mauritius
in June, July and August. Annual rainfall is likely to increase
in the equatorial Pacific, while decreases are projected by most
models for just east of French Polynesia in December, January
and February.
851Regional Climate Projections Chapter 11
11.1 Introduction 11.1.2 Introduction to Regional Projections
Assessments of climate change projections are provided
Increasingly reliable regional climate change projections are here on a region-by-region basis. The discussion is organised
now available for many regions of the world due to advances according to the same continental-scale regions used by Working
in modelling and understanding of the physical processes of Group II (WGII) in the Fourth Assessment Report (AR4) and
the climate system. Atmosphere-Ocean General Circulation in earlier assessments: Africa, Europe and Mediterranean, Asia,
Models (AOGCMs) remain the foundation for projections North America, Central and South America, Australia-New
while downscaling techniques now provide valuable additional Zealand, Polar Regions and Small Islands. While the topics
detail. Atmosphere-Ocean General Circulation Models cannot covered vary somewhat from region to region, each section
provide information at scales finer than their computational grid includes a discussion of key processes of importance for
(typically of the order of 200 km) and processes at the unresolved climate change in that region, relevant aspects of model skill
scales are important. Providing information at finer scales can be in simulating current climate, and projections of future regional
achieved through using high resolution in dynamical models or climate change based on global models and downscaling
empirical statistical downscaling. Development of downscaling techniques.
methodologies remains an important focus. Downscaled Each of these continental-scale regions encompasses a
climate change projections tailored to specific needs are only broad range of climates and is too large to be used as a basis for
now starting to become available. conveying quantitative regional climate change information.
Therefore, each is subdivided into a number of sub-continental
11.1.1 Summary of the Third Assessment Report or oceanic regions. The sub-continental regions as defined in
Table 11.1 are the framework for developing specific regional
The assessment of regional climate projections in the Third or sub-continental robust statements of projected change.
Assessment Report (TAR; Chapter 10 of IPCC, 2001) was Area-averaged temperature and precipitation changes are
largely restricted to General Circulation Model (GCM)-derived presented from the coordinated set of climate model simulations
temperature with limited precipitation statements. The major archived at the Program for Climate Model Diagnosis and
assessment of temperature change was that it is very likely Intercomparison (PCMDI; subsequently called the multi-model
all land areas will warm more than the global average (with data set or MMD). The regions are very close to those initially
the exception of Southeast Asia and South America in June, devised by Giorgi and Francesco (2000) with some minor
July and August; JJA), with amplification at high latitudes. modifications similar to those of Ruosteenoja et al. (2003). They
The changes in precipitation assessed to be likely were: an have simple shapes and are no smaller than the horizontal scales
increase over northern mid-latitude regions in winter and over on which current AOGCMs are useful for climate simulations
high-latitude regions in both winter and summer; in December, (typically judged to be roughly 1,000 km).
January and February (DJF), an increase in tropical Africa, These regional averages have some deficiencies for
little change in Southeast Asia, and a decrease in Central discussion of the AOGCM projections. In several instances,
America; an increase or little change in JJA over South Asia the simple definition of these boxes results in spatial averaging
and a decrease over Australia and the Mediterranean region. over regions in which precipitation is projected to increase and
These projections were almost entirely based on analysis of decrease. There are also sub-regions where the case can be made
nine coarse-resolution AOGCMs that had performed transient for a robust and physically plausible hydrological response,
experiments for the 20th century with the specifications for the information about which is lost in the regional averages. Partially
A2 and B2 emission scenarios. Chapter 10 of the TAR noted to help in discussing these features, this chapter also uses maps
that studies with regional models indicate that changes at finer of temperature and precipitation responses, interpolated to a grid
scales may be substantially different in magnitude from these with 128 longitudes by 64 latitudes which is typical of many of
large sub-continental findings. the lower-resolution atmospheric models in the MMD.
Information available for assessment regarding climate In the regional discussion to follow, the starting points are
variability and extremes at the regional scale was too sparse for temperature and precipitation. Changes in temperature are
it to be meaningfully drawn together in a systematic manner. introduced in each continental section by plotting for each of
However, some statements of a more generic nature were the regions the evolution of the range of projected decadal
made. It was assessed that the variability of daily to interannual mean change for the A1B scenario through the 21st century
temperatures is likely to decrease in winter and increase in (simulations hereafter referred to as MMD-A1B). These are
summer for mid-latitude Northern Hemisphere (NH) land put into the context of observed changes in the 20th century
areas, daily high temperature extremes are likely to increase and by plotting the observed changes and how well the models
future increases in mean precipitation are very likely to lead to reproduce these. This summary information is displayed for
an increase in variability. In some specifically analysed regions, continental regions in Box 11.1, which also contains details
it was assessed that extreme precipitation may increase and of how the figures were constructed. The equivalent figures
there were indications that droughts or dry spells may increase for the individual regions of each continental-scale region are
in occurrence in Europe, North America and Australia. displayed in the following sections. These are constructed in
852Chapter 11 Regional Climate Projections
the same way as Box 11.1, Figure 1. The 20th-century parts exists that changes of more abrupt character could happen, such
of these figures are also displayed in Section 9.4, where more as major ocean circulation or land surface/vegetation change,
details on their construction are provided. The discussion on there is little basis to judge the plausibility of these factors (see
precipitation provides a limited view of hydrological changes. Chapter 10). Therefore, this discussion is based on this linear
Supplementary Material Figure S11.1 expands on this issue picture.
by comparing the annual mean responses in precipitation and Table 11.1 also provides some simple estimates of the
in precipitation minus evaporation over the 21st century in signal-to-noise ratio. The signal is the change in 20-year means
the MMD-A1B projections. Over North America and Europe, of seasonal or annual mean temperature or precipitation. The
for example, the region of drying in the sense of precipitation noise is an estimate of the internal variability of 20-year means
minus evaporation is shifted poleward compared to the region of seasonal or annual mean temperature or precipitation, as
of reduced precipitation. A summary of the more significant generated by the models. The signal-to-noise ratio is converted
hydrological cycle changes from the regional discussions is into the time interval that is required before the signal is clearly
presented in Box 11.1. discernible, assuming that the signal grows linearly over the
Table 11.1 provides detailed information for each region century at the average rate in the ensemble mean A1B projection.
generated from the MMD-A1B models focusing on the change ‘Clearly discernible’ is defined in this context as distinguishable
in climate between the 1980 to 1999 period in the 20th-century with 95% confidence. As an example, the annual mean
integrations and the 2080 to 2099 period. The distribution of precipitation increase in northern Europe (NEU) (Table 11.1)
the annual and seasonal mean surface air temperature response is clearly discernible in these models after 45 years, meaning
and percentage change in precipitation are described by the that the 20-year average from 2025 to 2044 will be greater than
median, the 25 and 75% values (half of the models lie between the 20-year mean over 1980 to 1999 with 95% confidence,
these two values) and the maximum and minimum values in accounting only for the internal variability in the models and no
the model ensemble. Information on model biases in these other sources of uncertainty. In contrast, the annual temperature
regional averages for the 1980 to 1999 simulations is provided response in Southeast Asia (SEA) rises above the noise by
in Supplementary Material Table S11.1 in a similar format. this measure after only 10 years, implying that the average
Maps of biases are referred to in some of the following and are temperature over the period 1990 to 2009 is clearly discernible
included in the Supplementary Material as well. Data sources in the models from the average over the control period 1980
used in these comparisons are listed in the table and figure to 1999. This measure is likely an overestimate of the time of
captions where these biases are displayed. emergence of the signal as compared to that obtained with more
Most of the discussion focuses on the A1B scenario. The refined detection strategies (of the kind discussed in Chapter
global mean near-surface temperature responses (between 9). This noise estimate is solely based on the models and must
the period 1980 to 1999 of the 20th-century integrations be treated with caution, but it would be wrong to assume that
and the period 2080 to 2099) in the ensemble mean of the models always underestimate this internal variability. Some
MMD models are in the ratio 0.69:1:1.17 for the B1:A1B:A2 models overestimate and some underestimate the amplitude
scenarios. The local temperature responses in nearly all regions of the El Niño-Southern Oscillation (ENSO), for example,
closely follow the same ratio, as discussed in Chapter 10 and thereby over- or underestimating the most important source of
as illustrated in Supplementary Material Figures S11.2 to interannual variability in the tropics. On the other hand, few
S11.4. Therefore, little is gained by repeating the discussion of models capture the range of decadal variability of rainfall in
the A1B scenario for the other scenarios. The ensemble mean West Africa, for example (Hoerling, et al., 2006; Section 8.4).
local precipitation responses also approximately scale with the Also included in Table 11.1 is an estimate of the probability
global mean temperature response, although not as precisely of extremely warm, extremely wet and extremely dry seasons,
as the temperature itself. Given the substantial uncertainties for the A1B scenario and for the time period 2080 to 2099. An
in hydrological responses, the generally smaller signal/noise ‘extremely warm’ summer is defined as follows. Examining all
ratio and the similarities in the basic structure of the AOGCM of the summers simulated in a particular realisation of a model
precipitation responses in the different scenarios, a focus on in the 1980 to 1999 control period, the warmest of these 20
A1B seems justified for the precipitation as well. The overall summers can be computed as an estimate of the temperature
regional assessments, however, do rely on all available scenario of the warmest 5% of all summers in the control climate. The
information. period 2080 to 2099 is then examined, and the fraction of the
Given the dominantly linear response of the models, summers exceeding this warmth determined. This is referred
the 2080 to 2099 period allows the greatest clarity of the to as the probability of extremely warm summers. The results
background climate change underlying the interannual and are tabulated after averaging over models, and similarly for
decadal variability. In the ensemble mean AOGCM projections both extremely low and extremely high seasonal precipitation
there is no indication of abrupt climate change, nor does the amounts. Values smaller (larger) than 5% indicate a decrease
literature on individual models provide any strong suggestions (increase) in the frequency of extremes. This follows the
of robust nonlinearities. Some local temporal nonlinearities are approach in Weisheimer and Palmer (2005) except that this
to be expected, for example as the sea ice boundary retreats chapter compares each model’s future with its own 20th century
from a particular location in the Arctic. While the possibility to help avoid distortions due to differing biases in the different
853Regional Climate Projections Chapter 11
Table 11.1. Regional averages of temperature and precipitation projections from a set of 21 global models in the MMD for the A1B scenario. The mean temperature and
precipitation responses are first averaged for each model over all available realisations of the 1980 to 1999 period from the 20th Century Climate in Coupled Models (20C3M)
simulations and the 2080 to 2099 period of A1B. Computing the difference between these two periods, the table shows the minimum, maximum, median (50%), and 25 and
75% quartile values among the 21 models, for temperature (°C) and precipitation (%) change. Regions in which the middle half (25–75%) of this distribution is all of the same
sign in the precipitation response are coloured light brown for decreasing and light blue for increasing precipitation. Signal-to-noise ratios for these 20-year mean responses is
indicated by first computing a consensus standard deviation of 20-year means, using those models that have at least three realisations of the 20C3M simulations and using all
20-year periods in the 20th century. The signal is assumed to increase linearly in time, and the time required for the median signal to reach 2.83 (2 × √2) times the standard
deviation is displayed as an estimate of when this signal is significant at the 95% level. These estimates of the times for emergence of a clearly discernible signal are only
shown for precipitation when the models are in general agreement on the sign of the response, as indicated by the colouring. The frequency (%) of extremely warm, wet and dry
seasons, averaged over the models, is also presented, as described in Section 11.2.1. Values are only shown when at least 14 out of the 21 models agree on an increase (bold)
or a decrease in the extremes. A value of 5% indicates no change, as this is the nominal value for the control period by construction. The regions are defined by rectangular
latitude/longitude boxes and the coordinates of the bottom left-hand and top right-hand corners of these are given in degrees in the first column under the region acronym
(see table notes for full names of regions). Information is provided for land areas contained in the boxes except for the Small Islands regions where sea areas are used and for
Antarctica where both land and sea areas are used.
Temperature Response (°C) Precipitation Response (%) Extreme Seasons (%)
Regiona Season Min 25 50 75 Max T yrs Min 25 50 75 Max T yrs Warm Wet Dry
AFRICA
WAF DJF 2.3 2.7 3.0 3.5 4.6 10 -16 -2 6 13 23 100 21 4
MAM 1.7 2.8 3.5 3.6 4.8 10 -11 -7 -3 5 11 100
12S,20W JJA 1.5 2.7 3.2 3.7 4.7 10 -18 -2 2 7 16 100 19
to SON 1.9 2.5 3.3 3.7 4.7 10 -12 0 1 10 15 100 15
22N,18E Annual 1.8 2.7 3.3 3.6 4.7 10 -9 -2 2 7 13 100 22
EAF DJF 2.0 2.6 3.1 3.4 4.2 10 -3 6 13 16 33 55 100 25 1
MAM 1.7 2.7 3.2 3.5 4.5 10 -9 2 6 9 20 >100 100 15 4
12S,22E JJA 1.6 2.7 3.4 3.6 4.7 10 -18 -2 4 7 16 100
to SON 1.9 2.6 3.1 3.6 4.3 10 -10 3 7 13 38 95 100 21 3
18N,52E Annual 1.8 2.5 3.2 3.4 4.3 10 -3 2 7 11 25 60 100 30 1
SAF DJF 1.8 2.7 3.1 3.4 4.7 10 -6 -3 0 5 10 100 11
MAM 1.7 2.9 3.1 3.8 4.7 10 -25 -8 0 4 12 98
35S,10E JJA 1.9 3.0 3.4 3.6 4.8 10 -43 -27 -23 -7 -3 70 100 1 23
to SON 2.1 3.0 3.7 4.0 5.0 10 -43 -20 -13 -8 3 90 100 1 20
12S,52E Annual 1.9 2.9 3.4 3.7 4.8 10 -12 -9 -4 2 6 100 4 13
SAH DJF 2.4 2.9 3.2 3.5 5.0 15 -47 -31 -18 -12 31 >100 97 12
MAM 2.3 3.3 3.6 3.8 5.2 10 -42 -37 -18 -10 13 >100 100 2 21
18N,20E JJA 2.6 3.6 4.1 4.4 5.8 10 -53 -28 -4 16 74 100
to SON 2.8 3.4 3.7 4.3 5.4 10 -52 -15 6 23 64 100
30N,65E Annual 2.6 3.2 3.6 4.0 5.4 10 -44 -24 -6 3 57 100
EUROPE
NEU DJF 2.6 3.6 4.3 5.5 8.2 40 9 13 15 22 25 50 82 43 0
MAM 2.1 2.4 3.1 4.3 5.3 35 0 8 12 15 21 60 79 28 2
48N,10W JJA 1.4 1.9 2.7 3.3 5.0 25 -21 -5 2 7 16 88 11
to SON 1.9 2.6 2.9 4.2 5.4 30 -5 4 8 11 13 80 87 20 2
75N,40E Annual 2.3 2.7 3.2 4.5 5.3 25 0 6 9 11 16 45 96 48 2
SEM DJF 1.7 2.5 2.6 3.3 4.6 25 -16 -10 -6 -1 6 >100 93 3 12
MAM 2.0 3.0 3.2 3.5 4.5 20 -24 -17 -16 -8 -2 60 98 1 31
30N,10W JJA 2.7 3.7 4.1 5.0 6.5 15 -53 -35 -24 -14 -3 55 100 1 42
to SON 2.3 2.8 3.3 4.0 5.2 15 -29 -15 -12 -9 -2 90 100 1 21
48N,40E Annual 2.2 3.0 3.5 4.0 5.1 15 -27 -16 -12 -9 -4 45 100 0 46
854Chapter 11 Regional Climate Projections
Table 11.1 (continued)
Temperature Response (°C) Precipitation Response (%) Extreme Seasons (%)
Regiona Season Min 25 50 75 Max T yrs Min 25 50 75 Max T yrs Warm Wet Dry
ASIA
NAS DJF 2.9 4.8 6.0 6.6 8.7 20 12 20 26 37 55 30 93 68 0
MAM 2.0 2.9 3.7 5.0 6.8 25 2 16 18 24 26 30 89 66 1
50N,40E JJA 2.0 2.7 3.0 4.9 5.6 15 -1 6 9 12 16 40 100 51 2
to SON 2.8 3.6 4.8 5.8 6.9 15 7 15 17 19 29 30 99 65 0
70N,180E Annual 2.7 3.4 4.3 5.3 6.4 15 10 12 15 19 25 20 100 92 0
CAS DJF 2.2 2.6 3.2 3.9 5.2 25 -11 0 4 9 22 84 8
MAM 2.3 3.1 3.9 4.5 4.9 20 -26 -14 -9 -4 3 >100 94 16
30N,40E JJA 2.7 3.7 4.1 4.9 5.7 10 -58 -28 -13 -4 21 >100 100 3 20
to SON 2.5 3.2 3.8 4.1 4.9 15 -18 -4 3 9 24 99
50N,75E Annual 2.6 3.2 3.7 4.4 5.2 10 -18 -6 -3 2 6 100 12
TIB DJF 2.8 3.7 4.1 4.9 6.9 20 1 12 19 26 36 45 95 40 0
MAM 2.5 2.9 3.6 4.3 6.3 15 -3 4 10 14 34 70 96 34 2
30N,50E JJA 2.7 3.2 4.0 4.7 5.4 10 -11 0 4 10 28 100 24
to SON 2.7 3.3 3.8 4.6 6.2 15 -8 -4 8 14 21 100 20
75N,100E Annual 2.8 3.2 3.8 4.5 6.1 10 -1 2 10 13 28 45 100 46 1
EAS DJF 2.1 3.1 3.6 4.4 5.4 20 -4 6 10 17 42 >100 96 18 2
MAM 2.1 2.6 3.3 3.8 4.6 15 0 7 11 14 20 55 98 35 2
20N,100E JJA 1.9 2.5 3.0 3.9 5.0 10 -2 5 9 11 17 45 100 32 1
to SON 2.2 2.7 3.3 4.2 5.0 15 -13 -1 9 15 29 100 20 3
50N,145E Annual 2.3 2.8 3.3 4.1 4.9 10 2 4 9 14 20 40 100 47 1
SAS DJF 2.7 3.2 3.6 3.9 4.8 10 -35 -9 -5 1 15 99
MAM 2.1 3.0 3.5 3.8 5.3 10 -30 -2 9 18 26 100 14
5N,64E JJA 1.2 2.2 2.7 3.2 4.4 15 -3 4 11 16 23 45 96 32 1
to SON 2.0 2.5 3.1 3.5 4.4 10 -12 8 15 20 26 50 100 29 3
50N,100E Annual 2.0 2.7 3.3 3.6 4.7 10 -15 4 11 15 20 40 100 39 3
SEA DJF 1.6 2.1 2.5 2.9 3.6 10 -4 3 6 10 12 80 99 23 2
MAM 1.5 2.2 2.7 3.1 3.9 10 -4 2 7 9 17 75 100 27 1
11S,95E JJA 1.5 2.2 2.4 2.9 3.8 10 -3 3 7 9 17 70 100 24 2
to SON 1.6 2.2 2.4 2.9 3.6 10 -2 2 6 10 21 85 99 26 3
20N,115E Annual 1.5 2.2 2.5 3.0 3.7 10 -2 3 7 8 15 40 100 44 1
NORTH AMERICA
ALA DJF 4.4 5.6 6.3 7.5 11.0 30 6 20 28 34 56 40 80 39 0
MAM 2.3 3.2 3.5 4.7 7.7 35 2 13 17 23 38 40 69 45 0
60N,170W JJA 1.3 1.8 2.4 3.8 5.7 25 1 8 14 20 30 45 86 51 1
to SON 2.3 3.6 4.5 5.3 7.4 25 6 14 19 31 36 40 86 51 0
72N,103W Annual 3.0 3.7 4.5 5.2 7.4 20 6 13 21 24 32 25 97 80 0
CGI DJF 3.3 5.2 5.9 7.2 8.5 20 6 15 26 32 42 30 95 58 0
MAM 2.4 3.2 3.8 4.6 7.2 20 4 13 17 20 34 35 94 49 1
50N,103W JJA 1.5 2.1 2.8 3.7 5.6 15 0 8 11 12 19 35 99 46 1
to SON 2.7 3.4 4.0 5.7 7.3 20 7 14 16 22 37 35 99 62 0
85N,10W Annual 2.8 3.5 4.3 5.0 7.1 15 8 12 15 20 31 25 100 90 0
855Regional Climate Projections Chapter 11
Table 11.1 (continued)
Temperature Response (°C) Precipitation Response (%) Extreme Seasons (%)
Regiona Season Min 25 50 75 Max T yrs Min 25 50 75 Max T yrs Warm Wet Dry
NORTH AMERICA (continued)
WNA DJF 1.6 3.1 3.6 4.4 5.8 25 -4 2 7 11 36 >100 80 18 3
MAM 1.5 2.4 3.1 3.4 6.0 20 -7 2 5 8 14 >100 87 14
30N,50E JJA 2.3 3.2 3.8 4.7 5.7 10 -18 -10 -1 2 10 100 3
to SON 2.0 2.8 3.1 4.5 5.3 20 -3 3 6 12 18 >100 95 17 2
75N,100E Annual 2.1 2.9 3.4 4.1 5.7 15 -3 0 5 9 14 70 100 21 2
CNA DJF 2.0 2.9 3.5 4.2 6.1 30 -18 0 5 8 14 71 7
MAM 1.9 2.8 3.3 3.9 5.7 25 -17 2 7 12 17 >100 81 19 4
30N,103W JJA 2.4 3.1 4.1 5.1 6.4 20 -31 -15 -3 4 20 >100 93 15
to SON 2.4 3.0 3.5 4.6 5.8 20 -17 -4 4 11 24 91 11
50N,85W Annual 2.3 3.0 3.5 4.4 5.8 15 -16 -3 3 7 15 98
ENA DJF 2.1 3.1 3.8 4.6 6.0 25 2 9 11 19 28 85 78 24
MAM 2.3 2.7 3.5 3.9 5.9 20 -4 7 12 16 23 60 86 23 2
25N,85W JJA 2.1 2.6 3.3 4.3 5.4 15 -17 -3 1 6 13 98
to SON 2.2 2.8 3.5 4.4 5.7 20 -7 4 7 11 17 >100 97 19
50N,50W Annual 2.3 2.8 3.6 4.3 5.6 15 -3 5 7 10 15 55 100 29 1
CENTRAL AND SOUTH AMERICA
CAM DJF 1.4 2.2 2.6 3.5 4.6 15 -57 -18 -14 -9 0 >100 96 2 25
MAM 1.9 2.7 3.6 3.8 5.2 10 -46 -25 -16 -10 15 75 100 2 18
10N,116W JJA 1.8 2.7 3.4 3.6 5.5 10 -44 -25 -9 -4 12 90 100 24
to SON 2.0 2.7 3.2 3.7 4.6 10 -45 -10 -4 7 24 100 15
30N,83W Annual 1.8 2.6 3.2 3.6 5.0 10 -48 -16 -9 -5 9 65 100 2 33
AMZ DJF 1.7 2.4 3.0 3.7 4.6 10 -13 0 4 11 17 >100 93 27 4
MAM 1.7 2.5 3.0 3.7 4.6 10 -13 -1 1 4 14 100 18
20S,82W JJA 2.0 2.7 3.5 3.9 5.6 10 -38 -10 -3 2 13 100
to SON 1.8 2.8 3.5 4.1 5.4 10 -35 -12 -2 8 21 100
12N,34W Annual 1.8 2.6 3.3 3.7 5.1 10 -21 -3 0 6 14 100
SSA DJF 1.5 2.5 2.7 3.3 4.3 10 -16 -2 1 7 10 100
MAM 1.8 2.3 2.6 3.0 4.2 15 -11 -2 1 5 7 98 8
56S,76W JJA 1.7 2.1 2.4 2.8 3.6 15 -20 -7 0 3 17 95
to SON 1.8 2.2 2.7 3.2 4.0 15 -20 -12 1 6 11 99
20S,40W Annual 1.7 2.3 2.5 3.1 3.9 10 -12 -1 3 5 7 100
AUSTRALIA AND NEW ZEALAND
NAU DJF 2.2 2.6 3.1 3.7 4.6 20 -20 -8 1 8 27 89
MAM 2.1 2.7 3.1 3.3 4.3 20 -24 -12 1 15 40 92 3
30S,110E JJA 2.0 2.7 3.0 3.3 4.3 25 -54 -20 -14 3 26 94 3
to SON 2.5 3.0 3.2 3.8 5.0 20 -58 -32 -12 2 20 98
11S,155E Annual 2.2 2.8 3.0 3.5 4.5 15 -25 -8 -4 8 23 99
SAU DJF 2.0 2.4 2.7 3.2 4.2 20 -23 -12 -2 12 30 95
MAM 2.0 2.2 2.5 2.8 3.9 20 -31 -9 -5 13 32 90 6
45S,110E JJA 1.7 2.0 2.3 2.5 3.5 15 -37 -20 -11 -4 9 >100 95 17
to SON 2.0 2.6 2.8 3.0 4.1 20 -42 -27 -14 -5 4 >100 95 15
30S,155E Annual 1.9 2.4 2.6 2.8 3.9 15 -27 -13 -4 3 12 100
856Chapter 11 Regional Climate Projections
Table 11.1 (continued)
Temperature Response (°C) Precipitation Response (%) Extreme Seasons (%)
Regiona Season Min 25 50 75 Max T yrs Min 25 50 75 Max T yrs Warm Wet Dry
POLAR REGIONS
ARCb DJF 4.3 6.0 6.9 8.4 11.4 15 11 19 26 29 39 25 100 90 0
MAM 2.4 3.7 4.4 4.9 7.3 15 9 14 16 21 32 25 100 79 0
60N,180E JJA 1.2 1.6 2.1 3.0 5.3 15 4 10 14 17 20 25 100 85 0
to SON 2.9 4.8 6.0 7.2 8.9 15 9 17 21 26 35 20 100 96 0
90N,180W Annual 2.8 4.0 4.9 5.6 7.8 15 10 15 18 22 28 20 100 100 0
ANTc DJF 0.8 2.2 2.6 2.8 4.6 20 -11 5 9 14 31 50 85 34 3
MAM 1.3 2.2 2.6 3.3 5.3 20 1 8 12 19 40 40 88 54 0
90S,180E JJA 1.4 2.3 2.8 3.3 5.2 25 5 14 19 24 41 30 83 59 0
to SON 1.3 2.1 2.3 3.2 4.8 25 -2 9 12 18 36 45 79 42 1
60S,180W Annual 1.4 2.3 2.6 3.0 5.0 15 -2 9 14 17 35 25 99 81 1
SMALL ISLANDS
CAR DJF 1.4 1.8 2.1 2.4 3.2 10 -21 -11 -6 0 10 100 2
MAM 1.3 1.8 2.2 2.4 3.2 10 -28 -20 -13 -6 6 >100 100 3 18
10N,85W JJA 1.3 1.8 2.0 2.4 3.2 10 -57 -35 -20 -6 8 60 100 2 40
to SON 1.6 1.9 2.0 2.5 3.4 10 -38 -18 -6 1 19 100 22
25N,60W Annual 1.4 1.8 2.0 2.4 3.2 10 -39 -19 -12 -3 11 60 100 3 39
IND DJF 1.4 2.0 2.1 2.4 3.8 10 -4 2 4 9 20 >100 100 19 1
MAM 1.5 2.0 2.2 2.5 3.8 10 0 3 5 6 20 80 100 22 1
35S,50E JJA 1.4 1.9 2.1 2.4 3.7 10 -3 -1 3 5 20 100 17
to SON 1.4 1.9 2.0 2.3 3.6 10 -5 2 4 7 21 >100 100 17 2
17.5N,100E Annual 1.4 1.9 2.1 2.4 3.7 10 -2 3 4 5 20 65 100 30 2
MED DJF 1.5 2.0 2.3 2.7 4.2 25 -25 -16 -14 -10 -2 85 96 1 18
MAM 1.5 2.1 2.4 2.7 3.7 20 -32 -23 -19 -16 -6 65 99 0 32
30N,5W JJA 2.0 2.6 3.1 3.7 4.7 15 -64 -34 -29 -20 -3 60 100 1 36
to SON 1.9 2.3 2.7 3.2 4.4 20 -33 -16 -10 -5 9 >100 99 2 21
45N,35E Annual 1.7 2.2 2.7 3.0 4.2 15 -30 -16 -15 -10 -6 45 100 0 50
TNE DJF 1.4 1.9 2.1 2.3 3.3 10 -35 -8 -6 3 10 >100 100
MAM 1.5 1.9 2.0 2.2 3.1 15 -16 -7 -2 6 39 >100 100
0,30W JJA 1.4 1.9 2.1 2.4 3.6 15 -8 -2 2 7 13 >100 100
to SON 1.5 2.0 2.2 2.6 3.7 15 -16 -5 -1 3 9 >100 100
40N,10W Annual 1.4 1.9 2.1 2.4 3.5 15 -7 -3 1 3 7 >100 100
NPA DJF 1.5 1.9 2.4 2.5 3.6 10 -5 1 3 6 17 >100 100 20 2
MAM 1.4 1.9 2.3 2.5 3.5 10 -17 -1 1 3 17 100 14
0,150E JJA 1.4 1.9 2.3 2.7 3.9 10 1 5 8 14 25 55 100 43 1
to SON 1.6 1.9 2.4 2.9 3.9 10 1 5 6 13 22 50 100 31 1
40N,120W Annual 1.5 1.9 2.3 2.6 3.7 10 0 3 5 10 19 60 100 35 1
SPA DJF 1.4 1.7 1.8 2.1 3.2 10 -6 1 4 7 15 80 100 19 4
MAM 1.4 1.8 1.9 2.1 3.2 10 -3 3 6 8 17 35 100 35 1
55S,150E JJA 1.4 1.7 1.8 2.0 3.1 10 -2 1 3 5 12 70 100 27 3
to SON 1.4 1.6 1.8 2.0 3.0 10 -8 -2 2 4 5 100
0,80W Annual 1.4 1.7 1.8 2.0 3.1 10 -4 3 3 6 11 40 100 40 3
Notes: a Regions are: West Africa (WAF), East Africa (EAF), South Africa (SAF), Sahara (SAH), Northern Europe (NEU), Southern Europe and Mediterranean (SEM), Northern Asia (NAS), Central
Asia (CAS), Tibetan Plateau (TIB), East Asia (EAS), South Asia (SAS), Southeast Asia (SEA), Alaska (ALA), East Canada, Greenland and Iceland (CGI), Western North America (WNA),
Central North America (CNA), Eastern North America (ENA), Central America (CAM), Amazonia (AMZ), Southern South America (SSA), North Australia (NAU), South Australia (SAU),
Arctic (ARC), Antarctic (ANT), Caribbean (CAR), Indian Ocean (IND), Mediterrranean Basin (MED), Tropical Northeast Atlantic (TNE), North Pacific Ocean (NPA), and South Pacific
Ocean (SPA).
b land and ocean
c land only
857Regional Climate Projections Chapter 11
Box 11.1: Summary of Regional Responses
As an introduction to the more detailed regional analysis presented in this chapter, Box 11.1, Figure 1 illustrates how continental-
scale warming is projected to evolve in the 21st century using the MMD models. This warming is also put into the context of the observed
warming during the 20th century by comparing results from that subset of the models incorporating a representation of all known
forcings with the observed evolution (see Section 9.4 for more details). Thus for the six continental regions, the figure displays: 1) the
observed time series of the evolution of decadally averaged surface air temperature from 1906 to 2005 as an anomaly from the 1901
to 1950 average; 2) the range of the equivalent anomalies derived from 20th-century simulations by the MMD models that contain a
full set of historical forcings; 3) the evolution of the range of this anomaly in MMD-A1B projections between 2000 and 2100; and 4) the
range of the projected anomaly for the last decade of the 21st century for the B1, A1B, and A2 scenarios. For the observed part of these
graphs, the decadal averages are centred on the decade boundaries (i.e., the last point is for 1996 to 2005), whereas for the future period
they are centred on the decade mid-points (i.e., the first point is for 2001 to 2010). The width of the shading and the bars represents
the 5 to 95% range of the model results. To construct the ranges, all simulations from the set of models involved were considered inde-
pendent realisations of the possible evolution of the climate given the forcings applied. This involved 58 simulations from 14 models
for the observed period and 47 simulations from 18 models for the future. Important in this representation is that the models’ estimate
of natural climate variability is included and thus the ranges include both the potential mitigating and amplifying effects of variability
on the underlying signal. In contrast, the bars representing the range of projected change at the end of the century are constructed
from ensemble mean changes from the models and thus provide a measure of the forced response. These bars were constructed from
decadal mean anomalies from 21 models using A1B scenario forcings, from the 20 of these models that used the B1 forcings and the 17
that used the A2 forcings. The bars for the B1 and A2 scenarios were scaled to approximate ranges for the full set of models. The scaling
factor for B1 was derived from the ratio between its range and the A1B range of the corresponding 20 models. The same procedure was
used to obtain the A2 scaling factor. Only 18 models were used to display the ranges of projected temperature evolution as the control
simulations for the other 3 had a drift of >0.2°C per century, which precludes clearly defining the decadal anomalies from these models.
However, anomalies from all 21 models were included in calculating the bars in order to provide the fullest possible representation of
projected changes in the MMD. Comparison of these different representations shows that the main messages from the MMD about pro-
jected continental temperature change are insensitive to the choices made. Finally, results are not shown here for Antarctica because
the observational record is not long enough to provide the relevant information for the first part of the 20th century. Results of a similar
nature to those shown here using the observations that are available are presented in Section 11.8. (continued)
Box 11.1, Figure 1. Temperature anomalies with respect to 1901 to 1950 for six continental-scale regions for 1906 to 2005 (black line) and as simulated (red
envelope) by MMD models incorporating known forcings; and as projected for 2001 to 2100 by MMD models for the A1B scenario (orange envelope). The bars at
the end of the orange envelope represent the range of projected changes for 2091 to 2100 for the B1 scenario (blue), the A1B scenario (orange) and the A2 scenario
(red). The black line is dashed where observations are present for less than 50% of the area in the decade concerned. More details on the construction of these
figures are given in Section 11.1.2.
858Chapter 11 Regional Climate Projections
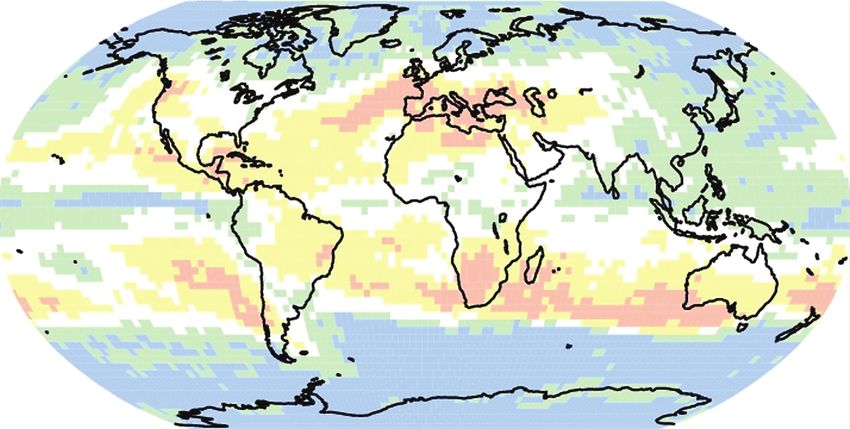
Box 11.1, Figure 2 serves to illustrate some of the more significant hydrological changes, with the two panels corresponding to
DJF and JJA. The backdrop to these figures is the fraction of the AOGCMs (out of the 21 considered for this purpose) that predict an
increase in mean precipitation in that grid cell (using the A1B scenario and comparing the period 2080 to 2099 with the control period
1980 to 1999). Aspects of this pattern are examined more closely in the separate regional discussions.
Robust findings on regional climate change for mean and extreme precipitation, drought and snow are highlighted in the figure
with further detail in the accompanying notes. (continued)
Box 11.1, Figure 2. Robust findings on regional climate change for mean and extreme precipitation, drought, and snow. This regional assessment is based upon
AOGCM based studies, Regional Climate Models, statistical downscaling and process understanding. More detail on these findings may be found in the notes below,
and their full description, including sources is given in the text. The background map indicates the degree of consistency between AR4 AOGCM simulations (21 simula-
tions used) in the direction of simulated precipitation change.
859Regional Climate Projections Chapter 11
(1) Very likely annual mean increase in most of northern Europe and the Arctic (largest in cold season), Canada, and the North-East
USA; and winter (DJF) mean increase in Northern Asia and the Tibetan Plateau.
(2) Very likely annual mean decrease in most of the Mediterranean area, and winter (JJA) decrease in southwestern Australia.
(3) Likely annual mean increase in tropical and East Africa, Northern Pacific, the northern Indian Ocean, the South Pacific (slight,
mainly equatorial regions), the west of the South Island of New Zealand, Antarctica and winter (JJA) increase in Tierra del
Fuego.
(4) Likely annual mean decrease in and along the southern Andes, summer (DJF) decrease in eastern French Polynesia, winter (JJA)
decrease for Southern Africa and in the vicinity of Mauritius, and winter and spring decrease in southern Australia.
(5) Likely annual mean decrease in North Africa, northern Sahara, Central America (and in the vicinity of the Greater Antilles in JJA)
and in South-West USA.
(6) Likely summer (JJA) mean increase in Northern Asia, East Asia, South Asia and most of Southeast Asia, and likely winter (DJF)
increase in East Asia.
(7) Likely summer (DJF) mean increase in southern Southeast Asia and southeastern South America
(8) Likely summer (JJA) mean decrease in Central Asia, Central Europe and Southern Canada.
(9) Likely winter (DJF) mean increase in central Europe, and southern Canada
(10) Likely increase in extremes of daily precipitation in northern Europe, South Asia, East Asia, Australia and New Zealand.
(11) Likely increase in risk of drought in Australia and eastern New Zealand; the Mediterranean, central Europe (summer drought);
in Central America (boreal spring and dry periods of the annual cycle).
(12) Very likely decrease in snow season length and likely to very likely decrease in snow depth in most of Europe and North
America.
models. The results are shown in Table 11.1 only when 14 out 11.1.3 Some Unifying Themes
of the 21 models agree as to the sign of the change in frequency
of extremes. For example, in Central North America (CNA), The basic pattern of the projected warming as described
15% of the summers in 2080 to 2099 in the A1B scenario are in Chapter 10 is little changed from previous assessments.
projected to be extremely dry, corresponding to a factor of three Examining the spread across the MMD models, temperature
increase in the frequency of these events. In contrast, in many projections in many regions are strongly correlated with the
regions and seasons, the frequency of extreme warmth is 100%, global mean projections, with the most sensitive models in
implying that all seasons in 2080 to 2099 are warmer than the global mean temperature often the most sensitive locally.
warmest season in 1980 to 1999, according to every model in Differing treatments of regional processes and the dynamical
this ensemble. interactions between a given region and the rest of the climate
In each continental section, a figure is provided summarising system are responsible for some spread. However, a substantial
the temperature and precipitation responses in the MMD-A1B part of the spread in regional temperature projections is due to
projection for the last two decades of the 21st century. These differences in the sum of the feedbacks that control transient
figures portray a multi-model mean comprising individual climate sensitivity (see also Chapter 10).
models or model ensemble means where ensembles exist. Also The response of the hydrological cycle is controlled in part
shown is the simple statistic of the number of these models that by fundamental consequences of warmer temperatures and the
show agreement in the sign of the precipitation change. The increase in water vapour in the atmosphere (Chapter 3). Water
annual mean temperature and precipitation responses in each is transported horizontally by the atmosphere from regions of
of the 21 separate AOGCMs are provided in Supplementary moisture divergence (particularly in the subtropics) to regions
Material Figures S11.5 to 11.12 and S11.13 to 11.20, of convergence. Even if the circulation does not change, these
respectively. transports will increase due to the increase in water vapour. The
Recent explorations of multi-model ensemble projections consequences of this increased moisture transport can be seen
seek to develop probabilistic estimates of uncertainties and in the global response of precipitation, described in Chapter
are provided in the Supplementary Material Table S11.2. This 10, where, on average, precipitation increases in the inter-
information is based on the approach of Tebaldi et al. (2004a,b; tropical convergence zones, decreases in the subtropics, and
see also section 11.10.2). increases in subpolar and polar regions. Over North America
and Europe, the pattern of subpolar moistening and subtropical
860Chapter 11 Regional Climate Projections
drying dominates the 21st-century projections. This pattern is involved in diagnosing and evaluating hydrological responses
also described in Section 9.5.4, which assesses the extent to in the tropics. With a few exceptions, the spread in projections
which this pattern is visible over land during the 20th century of hydrological changes is still too large to make strong
in precipitation observations and model simulations. Regions statements about the future of tropical climates at regional
of large uncertainty often lie near the boundaries between these scales (see also Section 10.3). Many AOGCMs project large
robust moistening and drying regions, with boundaries placed tropical precipitation changes, so uncertainty as to the regional
differently by each model. pattern of these changes should not be taken as evidence that
High-resolution model results indicate that in regions with these changes are likely to be small.
strong orographic forcing, some of these large-scale findings can Assessments of the regional and sub-regional climate
be considerably altered locally. In some cases, this may result change projections have primarily been based on the AOGCM
in changes in the opposite direction to the more general large- projections summarised in Table 11.1 and an analysis of the
scale behaviour. In addition, large-area and grid-box average biases in the AOGCM simulations, regional downscaling
projections for precipitation are often very different from local studies available for some regions with either physical or
changes within the area (Good and Lowe, 2006). These issues statistical models or both, and reference to plausible physical
demonstrate the inadequacy of inferring the behaviour at fine mechanisms.
scales from that of large-area averages. To assist the reader in placing the various regional
Another important theme in the 21st-century projections assessments in a global context, Box 11.1 displays many of
is the poleward expansion of the subtropical highs, and the the detailed assessments documented in the following regional
poleward displacement of the mid-latitude westerlies and sections. Likewise, an overview of projected changes in various
associated storm tracks. This circulation response is often types of extreme weather statistics is summarised in Table 11.2,
referred to as an enhanced positive phase of the Northern or which contains information from the assessments within this
Southern Annular Mode, or when focusing on the North Atlantic, chapter and from Chapter 10. Thus, the details of the assessment
the positive phase of the North Atlantic Oscillation (NAO). In that lead to each individual statement can all be found in either
regions without strong orographic forcing, superposition of the Chapter 10, or the respective regional sections, and links for
tendency towards subtropical drying and poleward expansion of each statement are identifiable from Table 11.2.
the subtropical highs creates especially robust drying responses
at the poleward boundaries of the five subtropical oceanic
high centres in the South Indian, South Atlantic, South Pacific,
North Atlantic and, less robustly, the North Pacific (where a
tendency towards El-Niño like conditions in the Pacific in
the models tends to counteract this expansion). Most of the
regional projections of strong drying tendencies over land in
the 21st century are immediately downstream of these centres
(south-western Australia, the Western Cape Provinces of South
Africa, the southern Andes, the Mediterranean and Mexico).
The robustness of this large-scale circulation signal is discussed
in Chapter 10, while Chapters 3, 8 and 9 describe the observed
poleward shifts in the late 20th century and the ability of models
to simulate these shifts.
The retreats of snow and ice cover are important for local
climates. The difficulty of quantifying these effects in regions
of substantial topographic relief is a significant limitation of
global models (see Section 11.4.3.2, Box 11.3) and is improved
with dynamical and statistical downscaling. The drying effect
of an earlier spring snowmelt and, more generally, the earlier
reduction in soil moisture (Manabe and Wetherald, 1987) is a
continuing theme in discussion of summer continental climates.
The strong interactions between sea surface temperature
gradients and tropical rainfall variability provides an important
unifying theme for tropical climates. Models can differ in their
projections of small changes in tropical ocean temperature
gradients and in the simulation of the potentially large shifts
in rainfall that are related to these oceanic changes. Chou
and Neelin (2004) provide a guide to some of the complexity
861You can also read