Climate Phenomena and their Relevance for Future Regional Climate Change - IPCC
←
→
Page content transcription
If your browser does not render page correctly, please read the page content below
Climate Phenomena and
     their Relevance for Future
     Regional Climate Change

14   Coordinating Lead Authors:
     Jens Hesselbjerg Christensen (Denmark), Krishna Kumar Kanikicharla (India)

     Lead Authors:
     Edvin Aldrian (Indonesia), Soon-Il An (Republic of Korea), Iracema Fonseca Albuquerque
     Cavalcanti (Brazil), Manuel de Castro (Spain), Wenjie Dong (China), Prashant Goswami (India),
     Alex Hall (USA), Joseph Katongo Kanyanga (Zambia), Akio Kitoh (Japan), James Kossin (USA),
     Ngar-Cheung Lau (USA), James Renwick (New Zealand), David B. Stephenson (UK), Shang-Ping
     Xie (USA), Tianjun Zhou (China)

     Contributing Authors:
     Libu Abraham (Qatar), Tércio Ambrizzi (Brazil), Bruce Anderson (USA), Osamu Arakawa (Japan),
     Raymond Arritt (USA), Mark Baldwin (UK), Mathew Barlow (USA), David Barriopedro (Spain),
     Michela Biasutti (USA), Sébastien Biner (Canada), David Bromwich (USA), Josephine Brown
     (Australia), Wenju Cai (Australia), Leila V. Carvalho (USA/Brazil), Ping Chang (USA), Xiaolong
     Chen (China), Jung Choi (Republic of Korea), Ole Bøssing Christensen (Denmark), Clara Deser
     (USA), Kerry Emanuel (USA), Hirokazu Endo (Japan), David B. Enfield (USA), Amato Evan
     (USA), Alessandra Giannini (USA), Nathan Gillett (Canada), Annamalai Hariharasubramanian
     (USA), Ping Huang (China), Julie Jones (UK), Ashok Karumuri (India), Jack Katzfey (Australia),
     Erik Kjellström (Sweden), Jeff Knight (UK), Thomas Knutson (USA), Ashwini Kulkarni (India),
     Koteswara Rao Kundeti (India), William K. Lau (USA), Geert Lenderink (Netherlands), Chris
     Lennard (South Africa), Lai-yung Ruby Leung (USA), Renping Lin (China), Teresa Losada (Spain),
     Neil C. Mackellar (South Africa), Victor Magaña (Mexico), Gareth Marshall (UK), Linda Mearns
     (USA), Gerald Meehl (USA), Claudio Menéndez (Argentina), Hiroyuki Murakami (USA/Japan),
     Mary Jo Nath (USA), J. David Neelin (USA), Geert Jan van Oldenborgh (Netherlands), Martin
     Olesen (Denmark), Jan Polcher (France), Yun Qian (USA), Suchanda Ray (India), Katharine
     Davis Reich (USA), Belén Rodriguez de Fonseca (Spain), Paolo Ruti (Italy), James Screen (UK),
     Jan Sedláček (Switzerland) Silvina Solman (Argentina), Martin Stendel (Denmark), Samantha
     Stevenson (USA), Izuru Takayabu (Japan), John Turner (UK), Caroline Ummenhofer (USA), Kevin
     Walsh (Australia), Bin Wang (USA), Chunzai Wang (USA), Ian Watterson (Australia), Matthew
     Widlansky (USA), Andrew Wittenberg (USA), Tim Woollings (UK), Sang-Wook Yeh (Republic of
     Korea), Chidong Zhang (USA), Lixia Zhang (China), Xiaotong Zheng (China), Liwei Zou (China)

     Review Editors:
     John Fyfe (Canada), Won-Tae Kwon (Republic of Korea), Kevin Trenberth (USA), David Wratt
     (New Zealand)

     This chapter should be cited as:
     Christensen, J.H., K. Krishna Kumar, E. Aldrian, S.-I. An, I.F.A. Cavalcanti, M. de Castro, W. Dong, P. Goswami, A.
     Hall, J.K. Kanyanga, A. Kitoh, J. Kossin, N.-C. Lau, J. Renwick, D.B. Stephenson, S.-P. Xie and T. Zhou, 2013: Climate
     Phenomena and their Relevance for Future Regional Climate Change. In: Climate Change 2013: The Physical Sci-
     ence Basis. Contribution of Working Group I to the Fifth Assessment Report of the Intergovernmental Panel on
     Climate Change [Stocker, T.F., D. Qin, G.-K. Plattner, M. Tignor, S.K. Allen, J. Boschung, A. Nauels, Y. Xia, V. Bex and
     P.M. Midgley (eds.)]. Cambridge University Press, Cambridge, United Kingdom and New York, NY, USA.
                                                                                                                            1217
Table of Contents
Executive Summary.................................................................... 1219 14.7 Additional Phenomena of Relevance....................... 1253
14.7.1 Pacific–South American Pattern............................... 1253
14.1 Introduction..................................................................... 1222
14.7.2 Pacific–North American Pattern............................... 1253
14.1.1 Monsoons and Tropical Convergence Zones............ 1222
14.7.3 Pacific Decadal Oscillation/Inter-decadal
14.1.2 Modes of Climate Variability.................................... 1222 Pacific Oscillation..................................................... 1253
14.1.3 Tropical and Extratropical Cyclones.......................... 1223 14.7.4 Tropospheric Biennial Oscillation............................. 1253
14.1.4 Summary of Climate Phenomena and their Impact 14.7.5 Quasi-Biennial Oscillation........................................ 1254
on Regional Climate................................................. 1223
14.7.6 Atlantic Multi-decadal Oscillation............................ 1254
Box 14.1: Conceptual Definitions and Impacts of Modes
of Climate Variability............................................................... 1223 14.7.7 Assessment Summary.............................................. 1255
14.2 Monsoon Systems.......................................................... 1225 14.8 Future Regional Climate Change............................... 1255
14.2.1 Global Overview...................................................... 1225 14.8.1 Overview.................................................................. 1255
14.2.2 Asian-Australian Monsoon...................................... 1227 14.8.2 Arctic....................................................................... 1257
14.2.3 American Monsoons................................................ 1232 14.8.3 North America.......................................................... 1258
14.2.4 African Monsoon..................................................... 1234 14.8.4 Central America and Caribbean............................... 1260
14.2.5 Assessment Summary.............................................. 1234 14.8.5 South America.......................................................... 1261
14.8.6 Europe and Mediterranean...................................... 1264
14.3 Tropical Phenomena...................................................... 1235 14.8.7 Africa....................................................................... 1266
14.3.1 Convergence Zones.................................................. 1235 14.8.8 Central and North Asia............................................. 1268
14.3.2 Madden–Julian Oscillation....................................... 1237 14.8.9 East Asia.................................................................. 1269
14.3.3 Indian Ocean Modes................................................ 1237 14.8.10 West Asia................................................................. 1271
14.3.4 Atlantic Ocean Modes.............................................. 1239 14.8.11 South Asia................................................................ 1272
14.3.5 Assessment Summary.............................................. 1240 14.8.12 Southeast Asia......................................................... 1273
14.8.13 Australia and New Zealand...................................... 1273
14.4 El Niño-Southern Oscillation...................................... 1240
14.8.14 Pacific Islands Region............................................... 1275
14.4.1 Tropical Pacific Mean State...................................... 1240
14.8.15 Antarctica................................................................ 1276
14.4.2 El Niño Changes over Recent Decades and
in the Future............................................................ 1240
References ................................................................................ 1290
14.4.3 Teleconnections....................................................... 1243
14.4.4 Assessment Summary.............................................. 1243 Frequently Asked Questions
FAQ 14.1 How Is Climate Change
14.5 Annular and Dipolar Modes........................................ 1243 Affecting Monsoons?............................................ 1228
14.5.1 Northern Modes....................................................... 1244 FAQ 14.2 How Are Future Projections in Regional
14.5.2 Southern Annular Mode........................................... 1245 Climate Related to Projections of Global
Means?................................................................... 1256
14.5.3 Assessment Summary.............................................. 1246
Box 14.2: Blocking.................................................................... 1246 Supplementary Material
Supplementary Material is available in online versions of the report.
14.6 Large-scale Storm Systems......................................... 1248
14.6.1 Tropical Cyclones..................................................... 1248
14.6.2 Extratropical Cyclones............................................. 1251
14.6.3 Assessment Summary.............................................. 1252
14
1218Climate Phenomena and their Relevance for Future Regional Climate Change Chapter 14
Executive Summary precipitation are projected to increase. There is medium confidence that
the increase of the Indian summer monsoon rainfall and its extremes
This chapter assesses the scientific literature on projected changes in throughout the 21st century will be the largest among all monsoons.
major climate phenomena and more specifically their relevance for {14.2.2, 14.8.9, 14.8.11, 14.8.13}
future change in regional climates, contingent on global mean temper-
atures continue to rise. There is low confidence in projections of changes in precipita-
tion amounts for the North American and South American monsoons,
Regional climates are the complex result of processes that vary strong- but medium confidence that the North American monsoon will arrive
ly with location and so respond differently to changes in global-scale and persist later in the annual cycle, and high confidence in expansion
influences. The following large-scale climate phenomena are increas- of the South American monsoon area. {14.2.3, 14.8.3, 14.8.4, 14.8.5}
ingly well simulated by climate models and so provide a scientific
basis for understanding and developing credibility in future regional There is low confidence in projections of a small delay in the devel-
climate change. A phenomenon is considered relevant to regional cli- opment of the West African rainy season and an intensification of
mate change if there is confidence that it has influence on the regional late-season rains. Model limitations in representing central features
climate and there is confidence that the phenomenon will change, par- of the West African monsoon result in low confidence in future projec-
ticularly under the Representative Concentration Pathway 4.5 (RCP4.5) tions. {14.2.4, 14.8.7}
or higher end scenarios. {Table 14.3}
Tropical Phenomena
Monsoon Systems
Based on models’ ability to reproduce general features of the
There is growing evidence of improved skill of climate models Indian Ocean Dipole and agreement on future projections, the
in reproducing climatological features of the global mon- tropical Indian Ocean is likely to feature a zonal (east–west)
soon. Taken together with identified model agreement on pattern of change in the future with reduced warming and
future changes, the global monsoon, aggregated over all mon- decreased precipitation in the east, and increased warming and
soon systems, is likely1 to strengthen in the 21st century with increased precipitation in the west, directly influencing East
increases in its area and intensity, while the monsoon circula- Africa and Southeast Asia precipitation. {14.3, 14.8.7, 14.8.12}
tion weakens. Monsoon onset dates are likely to become earlier
or not to change much and monsoon retreat dates are likely to A newly identified robust feature in model simulations of trop-
delay, resulting in lengthening of the monsoon season in many ical precipitation over oceans gives medium confidence that
regions. {14.2.1} annual precipitation change follows a ‘warmer-get-wetter’
pattern, increasing where warming of sea surface temperature
Future increase in precipitation extremes related to the monsoon is exceeds the tropical mean and vice versa. There is medium con-
very likely in South America, Africa, East Asia, South Asia, Southeast fidence in projections showing an increase in seasonal mean precipi-
Asia and Australia. Lesser model agreement results in medium confi- tation on the equatorial flank of the Inter-Tropical Convergence Zone
dence2 that monsoon-related interannual precipitation variability will (ITCZ) affecting parts of Central America, the Caribbean, South Ameri-
increase in the future. {14.2.1, 14.8.5, 14.8.7, 14.8.9, 14.8.11, 14.8.12, ca, Africa and West Asia despite shortcomings in many models in simu-
14.8.13} lating the ITCZ. There is medium confidence that the frequency of zon-
ally oriented South Pacific Convergence Zone events will increase, with
Model skill in representing regional monsoons is lower compared to the South Pacific Convergence Zone (SPCZ) lying well to the northeast
the global monsoon and varies across different monsoon systems. of its average position, a feature commonly reproduced in models that
There is medium confidence that overall precipitation associated with simulate the SPCZ realistically, resulting in reduced precipitation over
the Asian-Australian monsoon will increase but with a north–south many South Pacific island nations. Similarly there is medium confi-
asymmetry: Indian and East Asian monsoon precipitation is projected dence that the South Atlantic Convergence Zone will shift southwards,
to increase, while projected changes in Australian summer monsoon leading to an increase in precipitation over southeastern South Amer-
precipitation are small. There is medium confidence that the Indian ica and a reduction immediately north thereof. {14.3, 14.8.4, 14.8.5,
summer monsoon circulation will weaken, but this is compensated by 14.8.7, 14.8.11, 14.8.14}
increased atmospheric moisture content, leading to more p recipitation.
For the East Asian summer monsoon, both monsoon circulation and
1 In this Report, the following terms have been used to indicate the assessed likelihood of an outcome or a result: Virtually certain 99–100% probability, Very likely 90–100%,
Likely 66–100%, About as likely as not 33–66%, Unlikely 0–33%, Very unlikely 0–10%, Exceptionally unlikely 0–1%. Additional terms (Extremely likely: 95–100%, More likely
than not >50–100%, and Extremely unlikely 0–5%) may also be used when appropriate. Assessed likelihood is typeset in italics, e.g., very likely (see Section 1.4 and Box TS.1
for more details).
2 In this Report, the following summary terms are used to describe the available evidence: limited, medium, or robust; and for the degree of agreement: low, medium, or high.
A level of confidence is expressed using five qualifiers: very low, low, medium, high, and very high, and typeset in italics, e.g., medium confidence. For a given evidence and
agreement statement, different confidence levels can be assigned, but increasing levels of evidence and degrees of agreement are correlated with increasing confidence (see
Section 1.4 and Box TS.1 for more details).
14
1219Chapter 14 Climate Phenomena and their Relevance for Future Regional Climate Change
There is low confidence in projections of future changes in the Despite systematic biases in simulating storm tracks, most
Madden–Julian Oscillation owing to poor ability of the models to models and studies are in agreement on the future changes in
simulate it and its sensitivity to ocean warming patterns. The implica- the number of extratropical cyclones (ETCs). The global number
tions for future projections of regional climate extremes in West Asia, of ETCs is unlikely to decrease by more than a few percent. A
South Asia, Southeast Asia and Australia are therefore highly uncertain small poleward shift is likely in the Southern Hemisphere (SH)
when associated with the Madden–Julian Oscillation. {14.3, 14.8.10, storm track. It is more likely than not, based on projections with
14.8.11, 14.8.12, 14.8.13} medium confidence, that the North Pacific storm track will shift pole-
ward. However, it is unlikely that the response of the North Atlantic
There is low confidence in the projections of future changes for the storm track is a simple poleward shift. There is low confidence in the
tropical Atlantic, both for the mean and interannual modes, because magnitude of regional storm track changes, and the impact of such
of systematic errors in model simulations of current climate. The impli- changes on regional surface climate. It is very likely that increases in
cations for future changes in Atlantic hurricanes and tropical South Arctic, Northern European, North American and SH winter precipitation
American and West African precipitation are therefore uncertain. {14.3, by the end of the 21st century (2081–2100) will result from more pre-
14.6.1, 14.8.5, 14.8.7 } cipitation in ETCs associated with enhanced extremes of storm-related
precipitation. {14.6, 14.8.2, 14.8.3, 14.8.5, 14.8.6, 14.8.13, 14.8.15}
The realism of the representation of El Niño-Southern Oscilla-
tion (ENSO) in climate models is increasing and models simulate Blocking
ongoing ENSO variability in the future. Therefore there is high
confidence that ENSO very likely remains as the dominant mode Increased ability in simulating blocking in models and higher
of interannual variability in the future and due to increased agreement on projections indicate that there is medium confi-
moisture availability, the associated precipitation variability on dence that the frequency of Northern and Southern Hemisphere
regional scales likely intensifies. An eastward shift in the patterns blocking will not increase, while trends in blocking intensity and
of temperature and precipitation variations in the North Pacific and persistence remain uncertain. The implications for blocking-related
North America related to El Niño and La Niña (teleconnections), a fea- regional changes in North America, Europe and Mediterranean and
ture consistently simulated by models, is projected for the future, but Central and North Asia are therefore also uncertain. {14.8.3, 14.8.6,
with medium confidence, while other regional implications including 14.8.8, Box 14.2}
those in Central and South America, the Caribbean, Africa, most of
Asia, Australia and most Pacific Islands are more uncertain. However, Annular and Dipolar Modes of Variability
natural modulations of the variance and spatial pattern of ENSO are
so large in models that confidence in any specific projected change in Models are generally able to simulate gross features of annular
its variability in the 21st century remains low. {14.4, 14.8.3, 14.8.4, and dipolar modes. Model agreement in projections indicates
14.8.5, 14.8.7, 14.8.9, 14.8.11, 14.8.12, 14.8.13, 14.8.14} that future boreal wintertime North Atlantic Oscillation is very
likely to exhibit large natural variations and trend of similar
Cyclones magnitude to that observed in the past and is likely to become
slightly more positive on average, with some, but not well doc-
Based on process understanding and agreement in 21st century umented, implications for winter conditions in the Arctic, North
projections, it is likely that the global frequency of occurrence America and Eurasia. The austral summer/autumn positive trend
of tropical cyclones will either decrease or remain essentially in Southern Annular Mode is likely to weaken considerably as
unchanged, concurrent with a likely increase in both global stratospheric ozone recovers through the mid-21st century with
mean tropical cyclone maximum wind speed and precipitation some, but not well documented, implications for South Ameri-
rates. The future influence of climate change on tropical cyclones ca, Africa, Australia, New Zealand and Antarctica. {14.5.1, 14.5.2,
is likely to vary by region, but the specific characteristics of the 14.8.2, 14.8.3, 14.8.5, 14.8.6, 14.8.7, 14.8.8, 14.8.13, 14.8.15}
changes are not yet well quantified and there is low confidence
in region-specific projections of frequency and intensity. How- Atlantic Multi-decadal Oscillation
ever, better process understanding and model agreement in specific
regions provide medium confidence that precipitation will be more Multiple lines of evidence from paleo reconstructions and model
extreme near the centres of tropical cyclones making landfall in North simulations indicate that the Atlantic Multi-decadal Oscillation
and Central America; East Africa; West, East, South and Southeast (AMO) is unlikely to change its behaviour in the future as the
Asia as well as in Australia and many Pacific islands. Improvements in mean climate changes. However, natural fluctuations in the AMO
model resolution and downscaling techniques increase confidence in over the coming few decades are likely to influence regional climates
projections of intense storms, and the frequency of the most intense at least as strongly as will human-induced changes, with implications
storms will more likely than not increase substantially in some basins. for Atlantic major hurricane frequency, the West African wet season,
{14.6, 14.8.3, 14.8.4, 14.8.7, 14.8.9, 14.8.10, 14.8.11, 14.8.12, 14.8.13, North American and European summer conditions. {14.7.6, 14.2.4,
14.8.14} 14.6.1, 14.8.3, 14.8.6}
14
1220Climate Phenomena and their Relevance for Future Regional Climate Change Chapter 14
Pacific South American Pattern
Understanding of underlying physical mechanisms and the pro-
jected sea surface temperatures in the equatorial Indo-Pacific
regions gives medium confidence that future changes in the
mean atmospheric circulation for austral summer will project
on this pattern, thereby influencing the South American Conver-
gence Zone and precipitation over southeastern South America.
{14.7.2, 14.8.5}
14
1221Chapter 14 Climate Phenomena and their Relevance for Future Regional Climate Change
14.1 Introduction regional climates but also influence the global atmospheric circula-
tion. Section 14.3 presents an assessment of these and other important
Regional climates are the complex outcome of local physical processes tropical phenomena.
and the non-local responses to large-scale phenomena such as the El
Niño-Southern Oscillation (ENSO) and other dominant modes of cli- 14.1.2 Modes of Climate Variability
mate variability. The dynamics of regional climates are determined by
local weather systems that control the net transport of heat, moisture Regional climates are strongly influenced by modes of climate variabil-
and momentum into a region. Regional climate is interpreted in the ity (see Box 14.1 for definitions of mode, regime and teleconnection).
widest sense to mean the whole joint probability distribution of cli- This chapter assesses major modes such as El Niño-Southern Oscil-
mate variables for a region including the time mean state, the variance lation (ENSO, Section 14.4), the North Atlantic Oscillation/Northern
and co-variance and the extremes. Annular Mode (NAO/NAM) and Southern Annular Mode (SAM) in the
extratropics (Section 14.5) and various other well-known modes such
This chapter assesses the physical basis of future regional climate as the Pacific North American (PNA) pattern, Pacific Decadal Oscillation
change in the context of changes in the following types of phenom- (PDO), Atlantic Multi-decadal Oscillation (AMO), etc. (Section 14.7).
ena: monsoons and tropical convergence zones, large-scale modes of Many of these modes are described in previous IPCC reports (e.g., Sec-
climate variability and tropical and extratropical cyclones. Assessment tion 3.6 of AR4 WG1). Chapter 2 gives operational definitions of mode
of future changes in these phenomena is based on climate model indices (Box 2.5, Table 1) and an assessment of observed historical
projections (e.g., the Coupled Model Intercomparison Project Phase behaviour (Section 2.7.8). Climate models are generally able to sim-
3 (CMIP3) and CMIP5 multi-model ensembles described in Chapter ulate the gross features of many of the modes of variability (Section
12) and an understanding of how well such models represent the key 9.5), and so provide useful tools for understanding how modes might
processes in these phenomena. More generic processes relevant to change in the future (Müller and Roeckner, 2008; Handorf and Dethloff,
regional climate change, such as thermodynamic processes and land– 2009).
atmosphere feedback processes, are assessed in Chapter 12. Local pro-
cesses such as snow–albedo feedback, moisture feedbacks due to local Modes and regimes provide a simplified description of variations in
vegetation, effects of steep complex terrain etc. can be important for the climate system. In the simplest paradigm, variations in climate var-
changes but are in general beyond the scope of this chapter. The main iables are described by linear projection onto a set of mode indices
focus here is on large-scale atmospheric phenomena rather than more (Baldwin et al., 2009; Baldwin and Thompson, 2009; Hurrell and Deser,
local feedback processes or impacts such as floods and droughts. 2009). For example, a large fraction of interannual variance in Northern
Hemisphere (NH) sea level pressure is accounted for by linear combi-
Sections 14.1.1 to 14.1.3 introduce the three main classes of phenom- nations of the NAM and the PNA modes (Quadrelli and Wallace, 2004).
ena addressed in this Assessment and then Section 14.1.4 summarizes Alternatively, the nonlinear regime paradigm considers the probability
their main impacts on precipitation and surface temperature. Specif- distribution of local climate variables to be a multi-modal mixture of
ic climate phenomena are then addressed in Sections 14.2 to 14.7, distributions related to a discrete set of regimes/types (Palmer, 1999;
which build on key findings from the Fourth Assessment Report, AR4 Cassou and Terray, 2001; Monahan et al., 2001).
(IPCC, 2007a), and provide an assessment of process understanding
and how well models simulate the phenomenon and an assessment of There is ongoing debate on the relevance of the different paradigms
future projections for the phenomena. In Section 14.8, future regional (Stephenson et al., 2004; Christiansen, 2005; Ambaum, 2008; Fereday
climate changes are assessed, and where possible, interpreted in terms et al., 2008), and care is required when interpreting these constructs
of future changes in phenomena. In particular, the relevance of the var- (Monahan et al., 2009; Takahashi et al., 2011).
ious phenomena addressed in this chapter for future climate change in
the regions covered in Annex I are emphasized. The regions are those Modes of climate variability may respond to climate change in one or
defined in previous regional climate change assessments (IPCC, 2007a, more of the following ways:
2007b, 2012). Regional Climate Models (RCMs) and other downscaling
tools required for local impact assessments are assessed in Section 9.6 • No change—the modes will continue to behave as they have done
and results from these studies are used where such supporting infor- in the recent past.
mation adds additional relevant details to the assessment.
• Index changes—the probability distributions of the mode indices
14.1.1 Monsoons and Tropical Convergence Zones may change (e.g., shifts in the mean and/or variance, or more com-
plex changes in shape such as changes in local probability density,
The major monsoon systems are associated with the seasonal move- e.g., frequency of regimes).
ment of convergence zones over land, leading to profound season-
al changes in local hydrological cycles. Section 14.2 assesses current • Spatial changes—the climate patterns associated with the modes
understanding of monsoonal behaviour in the present and future cli- may change spatially (e.g., new flavours of ENSO; see Section
mate, how monsoon characteristics are influenced by the large-scale 14.4 and Supplementary Material) or the local amplitudes of the
tropical modes of variability and their potential changes and how the climate patterns may change (e.g., enhanced precipitation for a
monsoons in turn affect regional extremes. Convergence zones over given change in index (Bulic and Kucharski, 2012)).
14 the tropical oceans not only play a fundamental role in determining
1222Climate Phenomena and their Relevance for Future Regional Climate Change Chapter 14
• Structural changes—the types and number of modes and their and modes of climate variability. Both types of cyclone can produce
mutual dependencies may change; completely new modes could extreme wind speeds and precipitation (see Section 3.4, IPCC Spe-
in principle emerge. cial Report on Managing the Risks of Extreme Events and Disasters
to Advance Climate Change Adaptation (SREX; IPCC, 2012)). Sections
An assessment of changes in modes of variability can be problematic 14.6.1 and 14.6.2 assess the recent progress in scientific understand-
for several reasons. First, interpretation depends on how one separates ing of how these important weather systems are likely to change in
modes of variability from forced changes in the time mean or variations the future.
in the annual cycle (Pezzulli et al., 2005; Compo and Sardeshmukh,
2010). Modes of variability are generally defined using indices based 14.1.4 Summary of Climate Phenomena and their Impact
on either detrended anomalies (Deser et al., 2010b) or anomalies on Regional Climate
obtained by removing the time mean over a historical reference period
(see Box 2.5). The mode index in the latter approach will include Box 14.1, Figure 1 illustrates the large-scale climate phenomena
changes in the mean, whereas by definition there is no trend in a mode assessed in this chapter. Many of the climate phenomena are evident
index when it is based on detrended anomalies. Second, it can be diffi- in the map of annual mean rainfall (central panel). The most abundant
cult to separate natural variations from forced responses, for example, annual rainfall occurs in the tropical convergence zones: Inter-Tropical
warming trends in the N. Atlantic during the 20th century that may be Convergence Zone (ITCZ) over the Pacific, Atlantic and African equato-
due to trends in aerosol and other forcings rather than natural internal rial belt (see Section 14.3.1.1), South Pacific Convergence Zone (SPCZ)
variability (see Sections 14.6.2 and 14.7.1). Finally, modes of climate over central South Pacific (see Section 14.3.1.2) and South Atlantic
variability are nonlinearly related to one another (Hsieh et al., 2006) Convergence Zone (SACZ) over Southern South America and Southern
and this relationship can change in time (e.g., trends in correlation Atlantic (see Section 14.3.1.3). In the global monsoon domain (white
between ENSO and NAO indices). contours on the map), large amounts of precipitation occur but only
in certain seasons (see Section 14.2.1). Local maxima in precipitation
Even when the change in a mode of variability index does not con- are also apparent over the major storm track regions in mid-latitudes
tribute greatly to mean regional climate change, a climate mode may (see Section 14.7.2). Box 14.1 Figure 1 also illustrates surface air tem-
still play an important role in regional climate variability and extremes. perature (left panels) and precipitation (right panels) teleconnection
Natural variations, such as those due to modes of variability, are a patterns for ENSO (in December to February and June to August; see
major source of uncertainty in future projections of mean regional Section 14.4), NAO (in December to February; see Section 14.5.1) and
climate (Deser et al., 2012). Furthermore, changes in the extremes of SAM (in September to November; see Section 14.5.2). The telecon-
regional climate are likely to be sensitive to small changes in variance nection patterns were obtained by taking the correlation between
or shape of the distribution of the mode indices or the mode spatial monthly gridded temperature and precipitation anomalies and indi-
patterns (Coppola et al., 2005; Scaife et al., 2008). ces for the modes (see Box 14.1 definitions). It can be seen that all
three modes have far-reaching effects on temperature and precipita-
14.1.3 Tropical and Extratropical Cyclones tion in many parts of the world. Box 14.1, Table 1 briefly summarizes
the main regional impacts of different well-known modes of climate
Tropical and extratropical cyclones (TCs and ETCs) are important variability.
weather phenomena intimately linked to regional climate phenomena
Box 14.1 | Conceptual Definitions and Impacts of Modes of Climate Variability
This box briefly defines key concepts used to interpret modes of variability (below) and summarizes regional impacts associated with
well-known modes (Box 14.1, Table 1 and Box 14.1, Figure 1). The terms below are used to describe variations in time series variables
reported at a set of geographically fixed spatial locations, for example, a set of observing stations or model grid points (based on the
more complete statistical and dynamical interpretation in Stephenson et al. (2004)).
Climate indices
Time series constructed from climate variables that provides an aggregate summary of the state of the climate system. For example,
the difference between sea level pressure in Iceland and the Azores provides a simple yet useful historical NAO index (see Section 14.5
and Box 2.5 for definitions of this and other well-known observational indices). Because of their maximum variance properties, climate
indices are often defined using principal components.
Principal component
A linear combination of a set of time series variables that has maximum variance subject to certain normalization constraints. Principal
components are widely used to define optimal climate indices from gridded datasets (e.g., the Arctic Oscillation (AO) index, defined as
the leading principal component of NH sea level pressure; Section 14.5). (continued on next page) 14
1223Chapter 14 Climate Phenomena and their Relevance for Future Regional Climate Change
Box 14.1 (continued)
Climate pattern
A set of coefficients obtained by ‘projection’ (regression) of climate variables at different spatial locations onto a climate index time series.
Empirical Orthogonal Function
The climate pattern obtained if the climate index is a principal component. It is an eigenvector of the covariance matrix of gridded
climate data.
Teleconnection
A statistical association between climate variables at widely separated, geographically fixed spatial locations. Teleconnections are
caused by large spatial structures such as basin-wide coupled modes of ocean–atmosphere variability, Rossby wave-trains, mid-latitude
jets and storm-tracks, etc.
Teleconnection pattern
A correlation map obtained by calculating the correlation between variables at different spatial locations and a climate index. It is the
special case of a climate pattern obtained for standardized variables and a standardized climate index, that is, the variables and index
are each centred and scaled to have zero mean and unit variance. One-point teleconnection maps are made by choosing a variable at
one of the locations to be the climate index. (continued on next page)
Box 14.1, Table 1 | Regional climate impacts of fundamental modes of variability.
Mode Regional Climate Impacts
Global impact on interannual variability in global mean temperature. Influences severe weather and tropical cyclone activity worldwide. The diverse El Niño
ENSO
flavours present different teleconnection patterns that induce large impacts in numerous regions from polar to tropical latitudes (Section 14.4).
Influences surface air temperature and precipitation over the entire North American continent and extratropical North Pacific. Modulates ENSO rainfall
PDO
teleconnections, e.g., Australian climate (Section 14.7.3).
Modulates decadal variability in Australian rainfall, and ENSO teleconnections to rainfall, surface temperature, river flow and flood risk over Australia,
IPO
New Zealand and the SPCZ (Section 14.7.3).
Influences the N. Atlantic jet stream, storm tracks and blocking and thereby affects winter climate in over the N. Atlantic and surrounding landmasses.
NAO
The summer NAO (SNAO) influences Western Europe and Mediterranean basin climates in the season (Section 14.5.1).
Modulates the intensity of mid-latitude storms throughout the Northern Hemisphere and thereby influences North America and Eurasia climates as well as
NAM
sea ice distribution across the Arctic sea (Section 14.5.1).
NPO Influences winter air temperature and precipitation over much of western North America as well as Arctic sea ice in the Pacific sector (Section 14.5.1).
Influences temperature over Antarctica, Australia, Argentina, Tasmania and the south of New Zealand and precipitation over southern South America,
SAM
New Zealand, Tasmania, Australia and South Africa (Section 14.5.2).
Influences the jet stream and storm tracks over the Pacific and North American sectors, exerting notable influences on the temperature and precipitation in
PNA
these regions on intraseasonal and interannual time scales (Section 14.7.2).
PSA Influences atmospheric circulation over South America and thereby has impacts on precipitation over the continent (Section 14.7.1).
Influences air temperatures and rainfall over much of the Northern Hemisphere, in particular, North America and Europe. It is associated with multidecadal
AMO variations in Indian, East Asian and West African monsoons, the North African Sahel and northeast Brazil rainfall, the frequency of North American droughts
and Atlantic hurricanes (Section 14.7.6).
Influences seasonal hurricane activity in the tropical Atlantic on both decadal and interannual time scales. Its variability is influenced by other modes,
AMM
particularly ENSO and NAO (Section 14.3.4).
Affects the West African Monsoon, the oceanic forcing of Sahel rainfall on both decadal and interannual time-scales and the spatial extension of drought
AN
in South Africa (Section 14.3.4).
Associated with the intensity of Northwest Pacific monsoon, the tropical cyclone activity over the Northwest Pacific and anomalous rainfall over East Asia
IOB
(Section 14.3.3).
Associated with droughts in Indonesia, reduced rainfall over Australia, intensified Indian summer monsoon, floods in East Africa, hot summers over Japan, and
IOD
anomalous climate in the extratropical Southern Hemisphere (Section 14.3.3).
TBO Modulates the strength of the Indian and West Pacific monsoons. Affects droughts and floods over large areas of south Asia and Australia (Section 14.7.4).
Modulates the intensity of monsoon systems around the globe and tropical cyclone activity in the Indian, Pacific and Atlantic Oceans. Associated with enhanced
MJO rainfall in Western North America, northeast Brazil, Southeast Africa and Indonesia during boreal winter and Central America/Mexico and Southeast Asia
during boreal summer (Section 14.3.2).
Strongly affects the strength of the northern stratospheric polar vortex as well as the extratropical troposphere circulation, occurring preferentially
QBO
in boreal winter (Section 14.7.5).
BLC Associated with cold air outbreaks, heat-waves, floods and droughts in middle and high latitudes of both hemispheres (Box 14.2).
Notes:
AMM: Atlantic Meridional Mode IOB: Indian Ocean Basin pattern NAO: North Atlantic Oscillation QBO: Quasi-Biennial Oscillation
AMO: Atlantic Multi-decadal Oscillation IOD: Indian Ocean Dipole pattern NPO: North Pacific Oscillation SAM: Southern Annular Mode
AN: Atlantic Niño pattern IPO: Interdecadal Pacific Oscillation PDO: Pacific Decadal Oscillation TBO: Tropospheric Biennial Oscillation
BLC: Blocking events MJO: Madden-Julian Oscillation PNA: Pacific North America pattern
14 ENSO: El Niño-Southern Oscillation NAM: Northern Annular Mode PSA: Pacific South America pattern
1224Climate Phenomena and their Relevance for Future Regional Climate Change Chapter 14
Box 14.1 (continued)
Mode of climate variability
Underlying space–time structure with preferred spatial pattern and temporal variation that helps account for the gross features in vari-
ance and for teleconnections. A mode of variability is often considered to be the product of a spatial climate pattern and an associated
climate index time series.
Climate regime
A set of similar states of the climate system that occur more frequently than nearby states due to either more persistence or more
often recurrence. In other words, a cluster in climate state space associated with a local maximum in the probability density function.
Temperature Annual precipitation Precipitation
Winter storm-tracks Monsoon precipitation domains
NAO DJF NAO DJF
SOI DJF SOI DJF
SOI JJA SOI JJA
SAM SON SAM SON
0 10 30 50 70 90 120 150 200 250 300 400
-0.8 -0.6 -0.4 -0.2 0.2 0.4 0.6 0.8 -0.8 -0.6 -0.4 -0.2 0.2 0.4 0.6 0.8
Box 14.1, Figure 1 | Global distribution of average annual rainfall (in cm/year) from 1979–2010 Global Precipitation Climatology Project (GPCP) database, monsoon
precipitation domain (white contours) as defined in Section 14.2.1, and winter storm-tracks in both hemispheres (black arrows). In left (right) column seasonal cor-
relation maps of North Atlantic Oscillation (NAO), Southern Oscillation Index (SOI, the atmospheric component of El Niño-Southern Oscillation (ENSO)) and Southern
Annular Mode (SAM) mode indexes vs. monthly temperature (precipitation) anomalies in boreal winter (December, January and February (DJF)), austral winter (June, July
and August (JJA)) and austral spring (September, October and November (SON)). Black contours indicate a 99% significance level. The mode indices were taken from
National Oceanic and Atmospheric Administration (NOAA, http://www.esrl.noaa.gov/psd/data/climateindices/list/), global temperatures from NASA Goddard Institute
of Space Studies Surface Temperature Analysis (GISTEMP, http://data.giss.nasa.gov/gistemp/) and global precipitations from GPCP (http://www.esrl.noaa.gov/psd/data/
gridded/data.gpcp.html).
14.2 Monsoon Systems 14.2.1 Global Overview
Monsoons are a seasonal phenomenon responsible for producing the The global land monsoon precipitation displays a decreasing trend
majority of wet season rainfall within the tropics. The precipitation over the last half-century, with primary contributions from the weak-
characteristics over the Asian-Australian, American and African mon- ened summer monsoon systems in the NH (Wang and Ding, 2006).
soons can be viewed as an integrated global monsoon system, asso- The combined global ocean–land monsoon precipitation has inten-
ciated with a global-scale atmospheric overturning circulation (Tren- sified during 1979–2008, mainly due to an upward trend in the NH
berth et al., 2000). In Section 14.2.1, changes in precipitation of the summer oceanic monsoon precipitation (Zhou et al., 2008b; Hsu et al.,
global monsoon system are assessed. Changes in regional monsoons 2011; Wang et al., 2012b). Because the fractional increase in monsoon
are assessed in Sections 14.2.2 to 14.2.4. area is greater than that in total precipitation, the ratio of the latter
to the former (a measure of the global monsoon intensity) exhibits a
14
1225Chapter 14 Climate Phenomena and their Relevance for Future Regional Climate Change
decreasing trend (Hsu et al., 2011). CMIP5 models generally reproduce imum 5-day precipitation total (R5d) and consecutive dry days (CDD)
the observed global monsoon domain, but the disparity between the all indicate that intense precipitation will increase at larger rates than
best and poorest models is large (Section 9.5.2.4). those of mean precipitation (Figure 14.1). The standard deviation of
interannual variability in seasonal average precipitation (Psd) is pro-
In the CMIP5 models the global monsoon area (GMA), the global jected to increase by many models but some models show a decrease
monsoon total precipitation (GMP) and the global monsoon precipi- in Psd. This is related to uncertainties in projections of future chang-
tation intensity (GMI) are projected to increase by the end of the 21st es in tropical sea surface temperature (SST). Regarding seasonality,
century (2081–2100, Hsu et al., 2013; Kitoh et al., 2013; Figure 14.1). CMIP5 models project that monsoon onset dates will come earlier or
See Supplementary Material Section 14.SM.1.2 for the definitions of not change much while monsoon retreat dates will delay, resulting in a
GMA, GMP and GMI. The CMIP5 model projections show an expan- lengthening of the monsoon season in many regions.
sion of GMA mainly over the central to eastern tropical Pacific, the
southern Indian Ocean and eastern Asia. In all RCP scenarios, GMA is CMIP5 models show a decreasing trend of lower-troposphere wind
very likely to increase, and GMI is likely to increase, resulting in a very convergence (dynamical factor) throughout the 20th and 21st centu-
likely increase in GMP, by the end of the 21st century (2081–2100). The ries (Figure 14.2d). With increased moisture (see also Section 12.4),
100-year median changes in GMP are +5%, +8%, +10%, and +16% the moisture flux convergence shows an increasing trend from 1980
in RCP2.6, RCP4.5, RCP6.0, and RCP8.5 scenarios, respectively. Indices through the 21st century (Figure 14.2c). Surface evaporation shows
of precipitation extremes such as simple daily precipitation intensity a similar trend (Figure 14.2b) associated with warmer SSTs. There-
index (SDII), defined as the total precipitation divided by the number fore, the global monsoon precipitation increases (Figure 14.2a) due to
of days with precipitation greater than or equal to 1 mm, annual max- increases in moisture flux convergence and surface evaporation despite
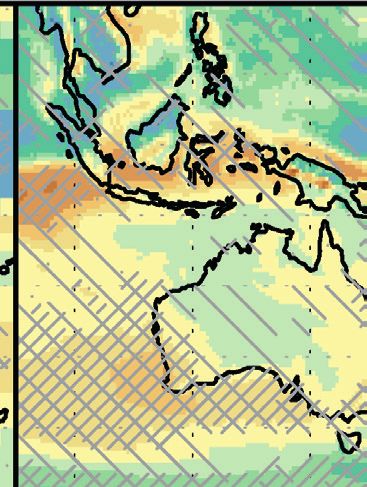
Figure 14.1 | (Upper) Observed (thick contour) and simulated (shading) global monsoon domain, based on the definition of Wang et al. (2011). The observations are based
on GPCP v2.2 data (Huffman et al., 2009), and the simulations are based on 26 CMIP5 multi-model mean precipitation with a common 2.5 by 2.5 degree grid in the present
day (1986–2005) and the future (2080–2099; RCP8.5 scenario). Orange (dark blue) shading shows monsoon domain only in the present day (future). Light blue shading shows
monsoon domain in both periods. (Lower) Projected changes for the future (2080–2099) relative to the present day (1986-2005) in the global monsoon area (GMA) and global
monsoon intensity (GMI), global monsoon total precipitation (GMP), standard deviation of interannual variability in seasonal average precipitation (Psd), simple daily precipitation
intensity index (SDII), seasonal maximum 5-day precipitation total (R5d), seasonal maximum consecutive dry days (CDD) and monsoon season duration (DUR), under the RCP2.6
(dark blue; 18 models), RCP4.5 (light blue; 24 models), RCP6.0 (orange; 14 models) and RCP8.5 scenarios (red; 26 models). Units are % except for DUR (days). Box-and-whisker
plots show the 10th, 25th, 50th, 75th and 90th percentiles. All of the indices are calculated for the summer season (May to September in the Northern Hemisphere; November to
March in the Southern Hemisphere). The indices of Psd, SDII, R5d and CDD calculated for each model’s original grid, and then averaged over the monsoon domains determined by
14 each model at the present-day. The indices of DUR are calculated for seven regional monsoon domains based on the criteria proposed by Wang and LinHo (2002) using regionally
averaged climatological cycles of precipitation, and then their changes are averaged with weighting based on their area at the present day.
1226Climate Phenomena and their Relevance for Future Regional Climate Change Chapter 14
Figure 14.2 | Time series of simulated anomalies, smoothed with a 20-year running mean over the global land monsoon domain for (a) precipitation (mm day–1), (b) evaporation
(mm day–1), (c) water vapour flux convergence in the lower (below 500 hPa) troposphere (mm day–1), and (d) wind convergence in the lower troposphere (10–3 kg m–2 s–1), relative
to the present-day (1986–2005), based on CMIP5 multi-model monthly outputs. Historical (grey; 29 models), RCP2.6 (dark blue; 20 models), RCP4.5 (light blue; 24 models), RCP6.0
(orange; 16 models), and RCP8.5 (red; 24 models) simulations are shown in the 10th and 90th percentile (shading), and in all model averages (thick lines).
a weakened monsoon circulation. Besides greenhouse gases (GHGs), precipitation of the East Asian summer (EAS) monsoon, while more
monsoons are affected by changes in aerosol loadings (Ramanathan than 95% of models project an increase in heavy precipitation events
et al., 2005). The aerosol direct forcing may heat the atmosphere but (Figure 14.4). All models and all scenarios project an increase in both
cools the surface, altering atmospheric stability and inducing horizon- the mean and extreme precipitation in the Indian summer monsoon
tal pressure gradients that modulate the large-scale circulation and (referred to as SAS in Figures 14.3 and 14.4) . In these two regions,
hence monsoon rainfall (Lau et al., 2008). However, the representation the interannual standard deviation of seasonal mean precipitation
of aerosol forcing differs among models, and remains an important also increases. Over the Australian-Maritime Continent (AUSMC)
source of uncertainty (Chapter 7 and Section 12.2.2), particularly in monsoon region, agreement among models is low. Figure 14.5 shows
some regional monsoon systems. the time-series of circulation indices representing EAS, Indian (IND),
Western North Pacific (WNP) and Australian (AUS) summer monsoon
14.2.2 Asian-Australian Monsoon systems. The Indian monsoon circulation index is likely to decrease in
the 21st century, while a slight increase in the East Asian monsoon
The seasonal variation in the thermal contrast between the large Eur- circulation is projected. Scatter among models is large for the western
asian landmass and the Pacific-Indian Oceans drives the powerful North Pacific and Australian monsoon circulation change.
Asian-Australian monsoon (AAM) system (Figure 14.3), which consists
of five major subsystems: Indian (also known as South Asian), East Factors that limit the confidence in quantitative assessment of mon-
Asian, Maritime Continent, Australian, and Western North Pacific mon- soon changes include sensitivity to model resolution (Cherchi and
soons. More than 85% of CMIP5 models show an increase in mean Navarra, 2007; Klingaman et al., 2011), model biases (Levine and 14
1227Chapter 14 Climate Phenomena and their Relevance for Future Regional Climate Change
Frequently Asked Questions
FAQ 14.1 | How is Climate Change Affecting Monsoons?
Monsoons are the most important mode of seasonal climate variation in the tropics, and are responsible for a large
fraction of the annual rainfall in many regions. Their strength and timing is related to atmospheric moisture con-
tent, land–sea temperature contrast, land cover and use, atmospheric aerosol loadings and other factors. Overall,
monsoonal rainfall is projected to become more intense in future, and to affect larger areas, because atmospheric
moisture content increases with temperature. However, the localized effects of climate change on regional mon-
soon strength and variability are complex and more uncertain.
Monsoon rains fall over all tropical continents: Asia, Australia, the Americas and Africa. The monsoon circulation is
driven by the difference in temperature between land and sea, which varies seasonally with the distribution of solar
heating. The duration and amount of rainfall depends on the moisture content of the air, and on the configuration
and strength of the atmospheric circulation. The regional distribution of land and ocean also plays a role, as does
topography. For example, the Tibetan Plateau—through variations in its snow cover and surface heating—modu-
lates the strength of the complex Asian monsoon systems. Where moist on-shore winds rise over mountains, as they
do in southwest India, monsoon rainfall is intensified. On the lee side of such mountains, it lessens.
Since the late 1970s, the East Asian summer monsoon has been weakening and not extending as far north as it used
to in earlier times , as a result of changes in the atmospheric circulation. That in turn has led to increasing drought
in northern China, but floods in the Yangtze River Valley farther south. In contrast, the Indo-Australian and West-
ern Pacific monsoon systems show no coherent trends since the mid-20th century, but are strongly modulated by
the El Niño-Southern Oscillation (ENSO). Similarly, changes observed in the South American monsoon system over
the last few decades are strongly related to ENSO variability. Evidence of trends in the North American monsoon
system is limited, but a tendency towards heavier rainfalls on the northern side of the main monsoon region has
been observed. No systematic long-term trends have been observed in the behaviour of the Indian or the African
monsoons.
The land surface warms more rapidly than the ocean surface, so that surface temperature contrast is increasing in
most regions. The tropical atmospheric overturning circulation, however, slows down on average as the climate
warms due to energy balance constraints in the tropical atmosphere. These changes in the atmospheric circulation
lead to regional changes in monsoon intensity, area and timing. There are a number of other effects as to how
(continued on next page)
(a) present (b) future
solar radiation solar radiation
weaker
circulation
aerosols changes
in aerosols
more rain
land use moisture land use enhanced moisture
warm cool warmer warm
FAQ 14.1, Figure 1 | Schematic diagram illustrating the main ways that human activity influences monsoon rainfall. As the climate warms, increasing water vapour
transport from the ocean into land increases because warmer air contains more water vapour. This also increases the potential for heavy rainfalls. Warming-related
changes in large-scale circulation influence the strength and extent of the overall monsoon circulation. Land use change and atmospheric aerosol loading can also affect
the amount of solar radiation that is absorbed in the atmosphere and land, potentially moderating the land–sea temperature difference.
14
1228Climate Phenomena and their Relevance for Future Regional Climate Change Chapter 14
FAQ 14.1 (continued)
climate change can influence monsoons. Surface heating varies with the intensity of solar radiation absorption,
which is itself affected by any land use changes that alter the reflectivity (albedo) of the land surface. Also, chang-
ing atmospheric aerosol loadings, such as air pollution, affect how much solar radiation reaches the ground, which
can change the monsoon circulation by altering summer solar heating of the land surface. Absorption of solar
radiation by aerosols, on the other hand, warms the atmosphere, changing the atmospheric heating distribution.
The strongest effect of climate change on the monsoons is the increase in atmospheric moisture associated with
warming of the atmosphere, resulting in an increase in total monsoon rainfall even if the strength of the monsoon
circulation weakens or does not change.
Climate model projections through the 21st century show an increase in total monsoon rainfall, largely due to
increasing atmospheric moisture content. The total surface area affected by the monsoons is projected to increase,
along with the general poleward expansion of the tropical regions. Climate models project from 5% to an approxi-
mately 15% increase of global monsoon rainfall depending on scenarios. Though total tropical monsoon rainfall
increases, some areas will receive less monsoon rainfall, due to weakening tropical wind circulations. Monsoon
onset dates are likely to be early or not to change much and the monsoon retreat dates are likely to delay, resulting
in lengthening of the monsoon season.
Future regional trends in monsoon intensity and timing remain uncertain in many parts of the world. Year-to-year
variations in the monsoons in many tropical regions are affected by ENSO. How ENSO will change in future—and
how its effects on monsoon will change—also remain uncertain. However, the projected overall increase in mon-
soon rainfall indicates a corresponding increase in the risk of extreme rain events in most regions.
Turner, 2012; Bollasina and Ming, 2013), poor skill in simulating the Ramanathan, 2006; Lau et al., 2008; Bollasina et al., 2011), land use
Madden–Julian Oscillation (MJO; Section 9.1.3.3) and uncertainties in (Niyogi et al., 2010; see also Chapter 10) and SSTs (Annamalai et al.,
projected ENSO changes (Collins et al., 2010; Section 14.4) and in the 2013). An increase in extreme rainfall events occurred at the expense
representation of aerosol effects (Section 9.4.6). of weaker rainfall events (Goswami et al., 2006) over the central Indian
region, and in many other areas (Krishnamurthy et al., 2009). With a
14.2.2.1 Indian Monsoon declining number of monsoon depressions (Krishnamurthy and Ajay-
amohan, 2010), the upward trend in extreme rainfall events may be
The Indian summer monsoon is known to have undergone abrupt due to enhanced moisture content (Goswami et al., 2006) or warmer
shifts in the past millennium, giving rise to prolonged and intense SSTs in the tropical Indian Ocean (Rajeevan et al., 2008).
droughts (Meehl and Hu, 2006; Sinha et al., 2011; see also Chapter
2). The observed recent weakening tendency in seasonal rainfall and CMIP3 projections show suppressed rainfall over the equatorial Indian
the regional re-distribution has been partially attributed to factors Ocean (Cai et al., 2011e; Turner and Annamalai, 2012), and an increase
such as changes in black carbon and/or sulphate aerosols (Chung and in seasonal mean rainfall over India (Ueda et al., 2006; Annamalai
Figure 14.3 | Regional land monsoon domain based on 26 CMIP5 multi-model mean precipitation with a common 2.5° × 2.5° grid in the present-day (1986–2005). For regional
divisions, the equator separates the northern monsoon domains (North America Monsoon System (NAMS), North Africa (NAF), Southern Asia (SAS) and East Asian summer (EAS))
from the southern monsoon domains (South America Monsoon System (SAMS), South Africa (SAF), and Australian-Maritime Continent (AUSMC)), 60°E separates NAF from SAS, 14
and 20°N and 100°E separates SAS from EAS. All the regional domains are within 40°S to 40°N.
1229You can also read