Victoria's water in a changing climate - Insights from the Victorian Water and Climate Initiative - Water and catchments
←
→
Page content transcription
If your browser does not render page correctly, please read the page content below
Victoria’s water
  in a changing
         climate
  Insights from the Victorian
 Water and Climate Initiative
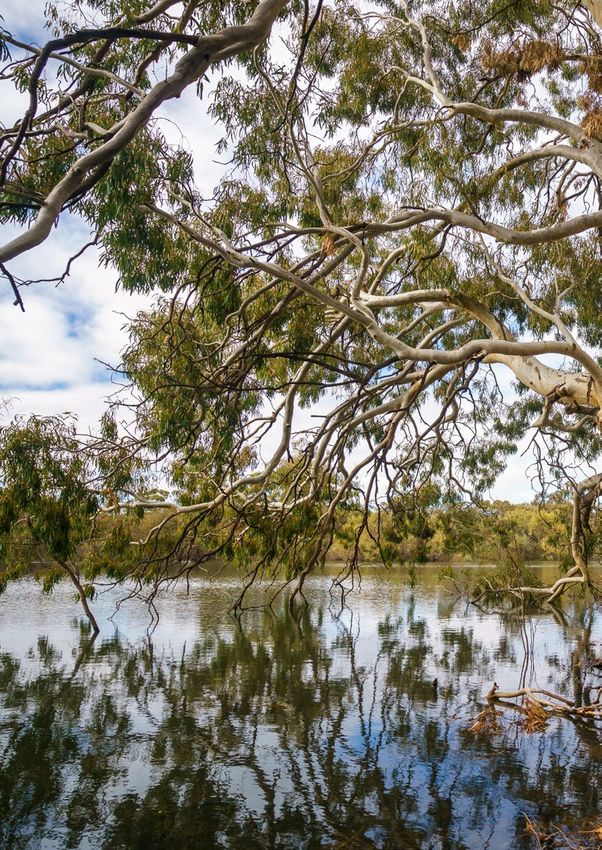
Cover Image: Kings Billabong. Photo credit: Emma Coats, VEWH

Acknowledgements                                                Contributors:
We acknowledge and respect Victorian Traditional                Project leaders: Pandora Hope (Bureau of
Owners as the original custodians of Victoria’s land            Meteorology), Murray Peel (The University of
and waters, their unique ability to care for Country            Melbourne), Francis Chiew (CSIRO), Geoffrey
and deep spiritual connection to it. We honour                  Steendam (DELWP).
Elders past and present whose knowledge and
wisdom has ensured the continuation of culture and              Project teams:
traditional practices.
                                                                Bureau of Meteorology: Linden Ashcroft*, Ghyslaine
We are committed to genuinely partner, and                      Boschat, Andrew Dowdy, Sonya Fiddes*, Chris Lucas,
meaningfully engage, with Victoria’s Traditional                Roseanna McKay, Sugata Narsey, Luke Osburn,
Owners and Aboriginal communities to support the                Acacia Pepler, Scott Power*, Surendra Rauniyar,
protection of Country, the maintenance of spiritual             Irina Rudeva, Bertrand Timbal, Margot Turner,
and cultural practices and their broader aspirations            Peter van Rensch*, Guomin Wang.
in the 21st century and beyond.                                 * Denotes a researcher who is no longer with BoM. VicWaCI
                                                                   thanks their new organisation for allowing them to
This project has been funded by the Victorian                      continue with this important work.
Government Department of Environment, Land,
Water and Planning (DELWP), with financial                      The University of Melbourne: Margarita Saft,
contributions from the Bureau of Meteorology and                Chinchu Mohan.
the CSIRO. The authors wish to acknowledge the
                                                                CSIRO Land and Water: Steve Charles, Guobin Fu,
input from water sector stakeholders and scientists
                                                                Michelle Ho, Nick Potter, Lu Zhang, Hongxing Zheng.
in the development of the Victorian Water and
Climate Initiative research program. We wish to                 Monash University: Tim Peterson.
thank various internal and external reviewers for
providing valuable feedback that has improved this              DELWP (Hydrology and Climate Science team):
report as well as Hydrology and Risk Consulting                 Rachel Brown, Sandra Dharmadi, Glenn Dunks,
(HARC) for contributing to the development of                   Jasmine Errey, Marty Gent*, Thomas Jenkins*,
Figure 3.13. We also acknowledge the in-kind                    Rebecca Lett, Lisa Lowe*, Robert Morden*.
contribution of Monash University.                              * Denotes a former member of the Hydrology and
                                                                   Climate Science team.

                                                                Editorial support: Karen Pearce
                                                                Design and layout: Green Scribble

© The State of Victoria Department of Environment, Land, Water and Planning 2020

This work is licensed under a Creative Commons Attribution 4.0 International licence. You are free to re-use the
work under that licence, on the condition that you credit the State of Victoria as author. The licence does not apply
to any images, photographs or branding, including the Victorian Coat of Arms, the Victorian Government logo
and the Department of Environment, Land, Water and Planning (DELWP) logo. To view a copy of this licence, visit
creativecommons.org/licenses/by/4.0/
ISBN 978-1-76105-348-1 (Print)
ISBN 978-1-76105-349-8 (pdf/online/MS word)
This report should be cited as: Department of Environment, Land, Water and Planning; Bureau of Meteorology;
Commonwealth Scientific and Industrial Research Organisation; The University of Melbourne (2020), Victoria’s Water in a
Changing Climate.
Disclaimer
This publication may be of assistance to you but the State of Victoria and its employees do not guarantee that the
publication is without flaw of any kind or is wholly appropriate for your particular purposes and therefore disclaims all
liability for any error, loss or other consequence which may arise from you relying on any information in this publication.

Accessibility
If you would like to receive this publication in an alternative format, please telephone
the DELWP Customer Service Centre on 136 186, or email customer.service@delwp.
vic.gov.au, or via the National Relay Service on 133 677, www.relayservice.com.au. This
document is also available on the internet at www.delwp.vic.gov.au
Contents
Executive summary                          2    3.4	Why have rainfall–runoff
                                                      relationships changed?                   60
                                                 3.4.1	Key catchment and drought
1. Water in Victoria                       8           characteristics60
1.1    cience to support water
      S                                          3.4.2 Weather changes                         61
      management in Victoria              10
                                                 3.4.3	Groundwater–surface water
1.2   Victoria’s water resources           11          connectivity62
1.3
    Victoria’s variable and changing             3.4.4	Catchment wetness and drought
    climate and water                     14           recovery64
1.4   Implications for the water sector   17    3.5	Magnitude of observed shift
                                                      in rainfall–runoff relationship
                                                      during the Millennium Drought            65
2.	Victoria’s changing
                                                 3.6	Implications for hydrology
    climate                               18         modelling68
2.1   Victoria’s climate                  20
2.2	Recent rainfall decline              24    4. Victoria’s water future                    70
2.3
    Simulated and projected                      4.1   Projections of water futures            72
    rainfall changes                      27
                                                 4.2 Understanding uncertainty                 77
2.4
    Changes in global circulation
                                                 4.2.1	Uncertainty in future rainfall
    influencing Victoria’s rainfall       31
                                                        projections78
2.5
    Variability drivers – from the               4.2.2	Use of downscaled rainfall in
    tropics and mid-latitudes             34           hydrological modelling                 79
2.6
    Weather systems influencing                  4.2.3	Range of uncertainty in rainfall
    Victorian rainfall                    36           and runoff projections for Victoria    80
2.7   Extreme rainfall events             40    4.2.4	Uncertainty in hydrological
                                                        modelling84

3.	Victoria’s changing                          4.3	Using projections to inform
                                                      planning, management and
    hydrology                             44         adaptation decisions                     85
3.1   Victoria’s hydrology                46
3.2
    Pre-drought, drought and                     5. Research application                       88
    post-drought runoff generation        51
3.3
    How have rainfall–runoff
    relationships changed?                52
                                                 Glossary90
3.3.1 Annual changes53
3.3.2 Seasonal changes56                        References91
3.3.3
      Types of catchment drought
      response and recovery58
Executive
    summary
    The Victorian Water and Climate Initiative
    (VicWaCI) is a partnership between the Victorian
    Department of Environment Land, Water and
    Planning (DELWP), the Bureau of Meteorology, The
    University of Melbourne and the Commonwealth
    Scientific and Industrial Research Organisation
    (CSIRO). VicWaCI is managed by the Hydrology
    and Climate Science team of DELWP’s Water
    and Catchments Group who worked closely with
    researchers and water sector stakeholders to
    design the program.

    VicWaCI sought to answer questions and better
    understand our climate and water resource
    situation. The findings from the initiative are
    presented in this report, with some of the new
    findings highlighted on page 7. This initiative
    continues on from earlier work by the South
    Eastern Australian Climate Initiative and the
    Victorian Climate Initiative.

2
Water in Victoria                                      are themselves subject to climate change, with
                                                       consequent effects on rainfall.
Findings from VicWaCI are helping to better
understand how the climate has and will                Rainfall from cold fronts and low-pressure
continue to change and the impacts on                  systems in the cooler half of the year has
Victoria’s water resources, allowing better            declined across Victoria, while thunderstorm-
preparation for the future.                            related rainfall has increased in northern
                                                       Victoria in the warmer half of the year.
Victoria’s water resources are under pressure
from increasing demand and decreasing supply.          Extreme, short-duration rainfall events are
                                                       generally becoming more intense in Victoria, a
Victoria’s already highly variable rainfall            trend that is expected to continue into the future.
and streamflow are now occurring against a
backdrop of climate change, with the drying
                                                       Implications for the water sector
trend of recent decades projected to continue
into the future.                                       Most of the rainfall and runoff in Victoria
                                                       occurs during the cooler half of the year. The
The water sector, including water-dependent
                                                       reductions in rainfall during this part of the
industries and water entitlement holders, need
                                                       year have a disproportionately large impact
to continue managing and planning for large
                                                       on water availability because this is the time
variability along with increasingly hotter and
                                                       of year when a larger proportion of rainfall
drier conditions.
                                                       becomes runoff.

                                                       From a runoff perspective, possible increases in
Victoria’s changing                                    rainfall during the warmer months are unlikely
                                                       to offset the impact of rainfall declines during
climate                                                the cooler time of the year.
Victoria’s climate is highly variable; however, the    A significant reduction in the number of very
trend in recent decades is towards warmer and          wet months since 1997, particularly during the
drier conditions.                                      cooler time of the year, has also reduced water
                                                       availability. The wetter catchment conditions
The decline in cool-season rainfall in recent
                                                       during these very wet months generally result
decades is unlikely to have been as large
                                                       in a larger proportion of rainfall becoming
without the influence from increasing levels of
                                                       runoff and provide improved resilience for water
atmospheric greenhouse gases.
                                                       users or environmental systems to cope during
The majority of climate models project a drier         any subsequent dry periods. Changes in rural
climate future for Victoria, particularly later this   hydrology and rural flooding will depend on the
century under a high emissions scenario.               conditions in any given catchment.

Most global climate models underestimate the           The intensity of short-duration (hour-long)
magnitude of the observed decline in rainfall.         rainfall events is increasing in some places but
This lowers confidence in projections based on         is not expected to offset the water availability
the same models.                                       impact of overall declines in rainfall. However, it
                                                       is likely to have implications for urban hydrology
Changes in the global circulation are associated       and urban flooding, depending on the influence
with an increased frequency of high-pressure           of overall drier catchment conditions and other
systems and reduced frequency of low-pressure          factors, including the capacity of drainage
systems across Victoria.                               systems to accommodate these short-duration
Large-scale climate drivers, such as El Niño           rainfall events.
and the Indian Ocean Dipole, that are largely
responsible for Victoria’s climate variability

                                    Lake Elizabeth. Courtesy of
                                    Visit Victoria and photographed   Victoria’s water in a changing climate   3
                                    by Mark Watson
Victoria’s changing                                The rainfall–runoff relationship in some
                                                       catchments can recover even if they don’t
    hydrology                                          receive all of the ‘missing’ rainfall that they went
                                                       without in the drought years.
    Average runoff has declined over recent times,
    largely due to rainfall declines.                  During the Millennium Drought, more than
                                                       half of the Victorian catchments analysed
    Runoff reductions in some catchments are           experienced an extra 20–40% decline in their
    larger than expected from reduced rainfall.        annual streamflow due to the shift in rainfall–
                                                       runoff relationships.
    There was a downward shift in the rainfall–
    runoff relationship in many Victorian              The current generation of hydrologic models
    catchments in the Millennium Drought.              do not replicate well the observed changes in
                                                       the rainfall–runoff relationship during and after
    Catchments can respond to and recover from
                                                       extended drought.
    drought in distinctly different ways.

    The shifts in the rainfall–runoff relationships    Implications for the water sector
    were largely governed by catchment resilience
    or vulnerability to drought, rather than           The low-runoff conditions experienced in many
    differences in drought severity.                   catchments during and after the Millennium
                                                       Drought need to be factored into water resource
    Changes in weather systems may be less             planning decisions.
    important in determining if a catchment is more
    likely to experience a shift in rainfall–runoff    Until there are improvements in the ability of
    relationship compared to internal catchment        hydrological models to represent the impact
    characteristics, such as catchment mean slope.     of multi-year drought and shifting rainfall–
                                                       runoff relationships, selection of calibration
    Groundwater–surface water disconnection is an      periods will be important to ensure that model
    important feature of catchments with shifted       results account for shifts in rainfall–runoff
    rainfall–runoff relationship during the drought.   relationships.

4
Yea - wetlands. Photo credit: Wendy West, DELWP

Victoria’s water future                               Hydrological models developed and calibrated
                                                      against past observations may not robustly
Future runoff in Victoria is likely to be lower       predict the future under hotter conditions,
because of the projected decline in cool-season       enhanced atmospheric carbon dioxide
rainfall and higher potential evapotranspiration.     concentration and longer dry spells not seen in
Variability will remain high, with wet and dry        the past.
years on a background of a drying trend.
                                                      Assessments focused on a systems approach
The runoff projections developed through              that characterise resilience to climate variability
the Victorian Climate Initiative continue to be       and climate change can provide insights and
the most appropriate for the water sector in          a foundation for considering the risk versus
Victoria and can be considered as projected           reward of adaptation options.
change relative to post-1975 averages.

There is considerable uncertainty in future           Implications for the water industry
water availability projections, largely due to the
                                                      Given the large range of plausible climate
uncertainty in future rainfall projections.
                                                      futures, water resource planning should
Finer-scale dynamic downscaled projections            consider a wide range of possible futures.
(like the Victorian Climate Projections 2019) can
                                                      In addition to considering hydroclimate
potentially add value, particularly for local scale
                                                      projections, approaches that consider how
assessments.
                                                      vulnerable a water system is to change can also
Although dynamic downscaling is improving,            be used to inform climate change adaptation.
there is significant bias in the downscaled           The Guidelines for Assessing the Impact
rainfall that needs to be robustly bias corrected     of Climate Change on Water Availability in
for hydrological application.                         Victoria (DELWP 2020) have been developed
                                                      to provide tailored guidance on how to apply
Projection products from different selections of      hydroclimate science for water resource
global climate models and dynamic downscaled          planning applications and to promote a
products do not necessarily converge to a             consistent approach to climate change impact
narrower range of change.                             assessment across the water industry.

                                                                     Victoria’s water in a changing climate   5
Research application                                The Guidelines for Assessing the Impact of
                                                        Climate Change on Water Availability in Victoria
    The findings that have emerged from VicWaCI         (DELWP 2020) draw on the science from
    have implications for many different parts          VicWaCI in the selection of a climate reference
    of the Victorian water sector, particularly         period, in defining the range of recommended
    flooding, drainage, urban runoff, water supply      hydroclimate change projections and in
    and demand, water availability, infrastructure      recommending approaches to sensitivity and
    investment and water resource policy.               stress testing of water resources systems.

                                                     Mornington Peninsula. Photo credit: DELWP, Craig Moodie

6
New research findings
The four-year investment in the Victorian Water and Climate Initiative has continued to
build on the scientific knowledge base formed since the publication of the Victorian Climate
Initiative’s findings in 2017. The initiative focused on partnering with Victorian water sector
stakeholders to share the knowledge for application across the sector.

VicWaCI research has:

•   identified the roles of natural variability   •   classified catchment response to
    and climate change in cool-season                 droughts, based on timing of the change
    rainfall reductions experienced since 1997,       in runoff response and recovery, which
    and the prospects for future cool-season          may be useful to predict future runoff
    rainfall (Section 2.2)                            response (Section 3.3.3)
•   improved our understanding of how             •   assessed the possible causes of the
    changes in global circulation have                change in runoff response to rainfall
    increased the frequency of high-pressure          (Section 3.4) and the magnitude of
    systems and reduced the frequency of              reductions in runoff response during the
    low-pressure systems across Victoria              Millennium Drought (Section 3.5)
    (Section 2.4 and Section 2.5)                 •   identified that catchment runoff response
•   identified the contribution of different          can recover after drought prior to the
    weather systems to the amount of rainfall         cumulative rainfall deficit fully recovering
    received across Victoria, how this changes        (Section 3.4.4)
    seasonally and observed trends in these       •   used high-resolution rainfall projections
    weather systems over time (Section 2.6)           to project runoff, which highlighted the
•   quantified how much sub-daily rainfall            challenges in robustly bias correcting
    intensities have increased across some            dynamically downscaled rainfall for
    parts of Victoria (Section 2.7)                   hydrological application (Section 4.2.1 and
•   identified the catchments across Victoria         Section 4.2.2)
    where a significant shift in the runoff       •   improved understanding of how different
    response to rainfall was observed during          climate and runoff projections compare,
    the Millennium Drought, and catchments            and methods for developing improved
    where these reductions have continued             runoff projections (Section 4.2.3).
    since the end of the drought (Section 3.3)

                                                                  Victoria’s water in a changing climate   7
1.
    Water in
    Victoria

8
CH 1
Water in Victoria: at a glance
• Findings from the Victorian Water and Climate Initiative
are helping to better understand how the climate
has and will continue to change and the impacts on
Victoria’s water resources, allowing better preparation
for the future.
• Victoria’s water resources are under pressure from
increasing demand and decreasing supply.
• Victoria’s already highly variable rainfall and streamflow
are now occurring against a backdrop of climate change,
with the drying trend of recent decades projected to
continue into the future.
• The water sector, including water-dependent industries
and water entitlement holders, need to understand the
nature of Victoria’s variable and changing water supply
to effectively manage this critical resource.
Cardinia Reservoir. Photo credit: Asanka Brendon Ratnayake, DELWP
Victoria’s water in a changing climate 91.1 Science to support water management
in Victoria
Findings from the Victorian Water and Climate Initiative
are helping to better understand how the climate has and
will continue to change and the impacts on Victoria’s water
resources, allowing better preparation for the future.
The Victorian Water and Climate Initiative Similarly, understanding past runoff changes
(VicWaCI) forms part of the Victorian and future water projections allows us to better
Government’s plan for management of our understand streamflow and other hydrology
water resources as laid out in the framework trends we are currently experiencing in Victoria
document Water for Victoria (DELWP 2016). and how these may change in the future.
In particular, the work of the initiative is a
response to the specific action around the Our understanding of these physical processes
understanding and application of climate and of recent climate change and its impact on
science to water management in order to water was improved by research carried out in
better meet the requirements of the water the South Eastern Australian Climate Initiative
sector and the community. (SEACI) and the Victorian Climate Initiative
(VicCI). However, many questions remained.
While the whole climate system influences the
hydrological cycle, understanding rainfall is Building on these earlier research programs,
particularly important because: VicWaCI was developed in consultation with
stakeholders in the water sector to address
• It is the primary climate variable driving some of these remaining questions, in
water availability. particular:
• Projections of rainfall have larger uncertainty
than projections of temperature due to • How much is climate change already
variability in time and space. impacting Victorian rainfall?
• Rainfall declines over the past two decades • Where is runoff declining and why?
have generally been much greater than • Can we improve projections of future water
the change simulated by most climate availability in Victoria?
models. This raises important questions for VicWaCI sought to answer these questions by
the water sector about how much of the looking at the past to see what trends we have
recent experience is natural variability and experienced so that we can better understand
how much is a permanent shift due to the our climate and water resource situation today,
changing climate. as well as looking at the future so we can have
With greater understanding of the underlying as much knowledge as possible about where
physical processes for the changes observed, things are heading. The findings from the
we are better able to interpret observed initiative are presented in this report, along with
changes and identify and disentangle the examples of how this information can support
influences of natural climate variability planning and decision-making.
and climate change. This provides greater The initiative was managed by the Hydrology
confidence for decision-making. and Climate Science team of the Victorian
Department of Environment, Land, Water and
Planning’s Water and Catchments Group.
The team worked closely with researchers
and water sector stakeholders to design the
program. Research was delivered by the
Bureau of Meteorology, The University of
Melbourne and CSIRO.
101.2 Victoria’s water resources CH 1
Victoria’s water resources are under pressure from
increasing demand and decreasing supply.
Water is critical to Victoria’s economy, are also responsible for administering the
environment and communities. A healthy diversion of water from waterways and the
environment and safe, affordable and reliable extraction of groundwater on behalf of the
water services are essential for people, jobs and Victorian Minister for Water.
a thriving economy.
Urban and regional water corporations
As of November 2020, Victoria’s water resources manage water resources and deliver water
are managed by 19 water corporations supply and wastewater services within cities
constituted under the Water Act 1989 (Vic) and towns. The forecast growth in urban
(Figure 1.1). Rural water corporations are population will increase pressure on existing
commonly required to provide irrigation, water systems, placing a growing demand on
drainage and storage services. These services current assets, infrastructure, water supply and
are critical for agricultural water users and wastewater services.
underpin on-farm investment decisions. They
!
City / Town SUNBURY
!
Urban Water Corporation TULLAMARINE
HEALESVILLE
!
Rural Water Corporation Yarra Valley
!
City West Water
MILDURA
Metropolitan Water Retailer Water
Lower
DANDENONG
Murray !
South East
Lower Murray FRANKSTON WARRAGUL
!
Water !
SWAN HILL
GWMWater
GWMWater
WODONGA
SHEPPARTON WANGARATTA
Coliban
North
Goulburn East
HORSHAM BENDIGO Valley
Goulburn-Murray
Central East
Highlands Southern Gippsland
Western Rural
BALLARAT
Wannon Melbourne Water BAIRNSDALE
SEE INSET FOR Central
Southern METRO RETAILERS Gippsland
GEELONG
Rural
Barwon TRARALGON
PORTLAND
WARRNAMBOOL
South
Gippsland
Westernport
Figure 1.1 Jurisdictions of Victoria’s water corporations (Source: DELWP).
*In November 2020, the Victorian Government announced that metropolitan water retailer City West Water
and urban water corporation Western Water would merge to form one larger, integrated entity called Greater
Western Water that would commence on 1 July 2021.
Victoria’s water in a changing climate 11MELBOURNE STORAGES: BY THE NUMBERS
615 GL
418 GL 404 GL
376 GL
1913–1996 1997–2019 2015–2019 1997–2009
historic average average average
average (Millennium
Drought)
463 GL 25% 18/20
2019 inflow into 2019 inflow 25% Melbourne storages have
Melbourne below historic received below historic average
storages average (1913-1996) inflows in 18 of the last 20 years
Figure 1.2 Declining inflows to Melbourne's water storages (Source: DELWP).
12CH 1
The two greatest pressures on Victoria’s water
resources are population growth and climate
change.
In 2015, Victoria became the fastest growing
state in Australia. Victoria’s population is
projected to reach 10.1 million people by 2051
— almost double what it is today (DELWP 2016).
Melbourne and the major regional centres
Ballarat, Bendigo and Geelong are expected
to almost double their population. The western
suburbs of Melbourne will have an extra one
million people. This population growth increases
the demand for water, and rapid urbanisation
increases stormwater, which can adversely
impact waterways.
While demand for water is growing, supply is
decreasing, with recent years seeing significant
reductions in the amount of water flowing
into Victoria’s water storages (Figure 1.2).
Understanding the role that climate change
is playing in Victoria’s water supply and how it
will impact future supply is critical for ensuring
Victoria’s water sector can continue to meet the
state’s water supply needs.
Photo credit: David Fletcher, GWMWater
Victoria’s water in a changing climate 131.3 Victoria’s variable and changing climate and
water
Victoria’s already highly variable rainfall and streamflow are
now occurring against a backdrop of climate change, with
the drying trend of recent decades projected to continue into
the future.
Victoria’s rainfall varies considerably from year to year (Figure 1.3) and also across the state. The
annual average rainfall varies from less than 300 mm per year in parts of the north-west to over
1500 mm in parts of the Alps, while the wettest years can have more than twice as much rainfall as
the driest years.
1000
900
800
700
Rainfall (mm)
600
500
400
300
200
100
0
1900 1910 1920 1930 1940 1950 1960 1970 1980 1990 2000 2010
Year
Figure 1.3 Total annual rainfall in Victoria from 1900 to 2019 showing high year-to-year
variability (Source: BoM).
14CH 1
Rainfall variability is amplified in Victoria’s Increases in thunderstorm activity have been
streamflow, which varies from year to year and observed in recent decades, particularly in
between catchments. Longer-term changes in eastern Victoria (Dowdy 2020), which can
rainfall and streamflow are occurring against increase warm-season rainfall. However,
the backdrop of this high variability. future trends in warm-season rainfall are
less clear than for the cool season. There are
Over the past few decades, Victoria has large uncertainties around projected future
experienced its warmest period on record, changes in thunderstorm activity in general
as well as declining cool-season (April to for Australia. Even if there is an increase in
October) rainfall (Hope et al. 2017). This decline warm-season rainfall, it is unlikely to offset
is associated with an increase in the number the impact of reduced cool-season rainfall
of high-pressure systems over southern on total annual rainfall, or the impact on total
Australia (Pepler et al. 2019) and a decrease in annual runoff. Although some projections
rainfall from fronts and low-pressure systems have suggested increased flooding due to
(Pepler et al. 2020b). A majority of global increases in the intensity of rainfall events,
climate models (GCMs) indicate that climate recent research suggests that extreme rainfall at
change has contributed to the rainfall decline higher temperatures only results in increases in
(Rauniyar and Power 2020). While rainfall streamflow in the most extreme rainfall events in
will continue to vary from year to year, the smaller catchments (Wasko and Sharma 2017).
underlying downward trend in cool-season
rainfall due to climate change is projected When rain falls, it does not all end up in our
to intensify, unless global greenhouse gas waterways: some rainfall infiltrates into the
emissions are markedly reduced. soil, some is captured in surface depressions,
some evaporates away from the surface and
Streamflows over the past decades have a large amount of rainfall transpires back to
also been the lowest on record, with many the atmosphere via plants. The hotter and
catchments experiencing significantly greater drier the conditions before a rainfall event, the
declines than expected based on past rainfall– more water is lost before it can contribute to
runoff relationships. Streamflow is likely to streamflow and flooding.
continue to decline over coming decades
(Potter et al. 2016). This is driven mostly by
declines in future cool-season rainfall, along
with increasing temperatures and potential
for evapotranspiration (the transfer of water
vapour to the air directly from the soil, from
open water or through plants). While future
declines in rainfall and streamflow are expected,
there is a wide range of uncertainty about the
speed and magnitude of the reductions.
Victoria’s water in a changing climate 15Melton. Photo credit: DELWP, Craig Moodie 16
CH 1

1.4 Implications for the water sector
The water sector, including water-dependent industries and
water entitlement holders, need to continue managing and
planning for large variability along with increasingly hotter
and drier conditions.

We can expect the large variability in rainfall     feeding, breeding and movement throughout
and streamflow that we currently experience         the landscape. Changes in climate and
to continue into the future, and we can expect      streamflow will disrupt these patterns, not only
some aspects of the variability (e.g. rainfall      affecting ecosystems but also with knock-on
extremes and drought periods) to increase. It       effects for the health of waterways.
is important that the water sector continues to
manage for this large variability, along with the   Warmer and drier conditions will also result in
underlying changes over time.                       increasing frequency and intensity of bushfire
                                                    (Dowdy et al. 2019; Harris and Lucas 2019).
An increasingly hotter and drier climate is         Bushfires can affect the quantity and quality of
expected to significantly reduce inflows to         water flowing in our rivers and streams and into
storages. Due to the interaction between            our storages for many years after they occur
rainfall and catchment runoff generation,           (DELWP 2016).
streamflow is projected to decrease by a
greater proportion than the percentage              Warming temperatures increase the potential
decrease in rainfall. Climate models indicate       for greater specific humidity and storm
the largest reductions are expected in              intensity (Wasko et al. 2018). Flash floods
Victoria’s south-west. Projected changes in         caused by heavy, short-duration rainfalls
runoff under the medium climate change              may impact urban areas and infrastructure
scenario suggest a possible average annual          and disrupt essential water and wastewater
streamflow reduction of up to 50% in some           services. In coastal areas rising sea levels and
catchments by 2065 (Potter et al. 2016).            increases in storm surges may damage or limit
Reductions of this scale could have serious         the function of water infrastructure.
future consequences for water availability          Climate change will also impact water demands
across Victorian catchments.                        and water use in catchments. A hotter, drier
Climate change and streamflow reduction             climate will threaten communities as less water
also pose risks to water quality (DELWP             and more extreme events may compromise
2016). Higher air temperatures increase             the liveability of cities and towns. Increased
evapotranspiration rates, while reduced             temperatures and less water flowing in our
streamflow and more extreme events such             waterways may also cause an increase in
as heatwaves and bushfires could have               harmful algal blooms. This could affect the
short- and longer-term impacts on water             safety of our water supplies for drinking,
temperature, turbidity and the frequency and        supporting stock and recreation.
severity of algal blooms. Ecological impacts
are also likely (DELWP 2016). The species that
live in and around our waterways rely on
well-established flow patterns for successful

                                                                   Victoria’s water in a changing climate      17
2.
Victoria’s
changing
climate
How much is climate change
already impacting Victorian
rainfall?
Understanding Victoria’s variable climate, along
with the impact of climate change, is important
to ensure informed decision-making across the
Victorian water sector. Victoria’s climate has
already changed, and the majority of global
climate model projections indicate a likely warmer
and drier future for Victoria. This means that a
significant challenge for water sector planners
and decision-makers is understanding how much
the climate now differs from past decades and
the timing and severity of future rainfall changes.
What rainfall patterns can we expect with our
current climate, and how might these change into
the future?
Johnsons Swamp.
Photo credit: Erin Ashcroft, VEWH
18CH 2
Victoria’s changing climate: at a glance
• Victoria’s climate is • Most global climate climate variability are
highly variable; however, models underestimate themselves subject to
the trend in recent the magnitude of the climate change, with
decades is towards observed decline in consequent effects on
warmer and drier rainfall. This lowers rainfall.
conditions. confidence in projections • Rainfall from cold
• The decline in cool- based on the same fronts and low-pressure
season rainfall in recent models. systems in the cooler half
decades is unlikely to • Changes in the of the year has declined
have been as large global circulation are across Victoria, while
without the influence associated with an thunderstorm-related
from increasing levels of increased frequency of rainfall has increased in
atmospheric greenhouse high-pressure systems northern Victoria in the
gases. and reduced frequency warmer half of the year.
• The majority of climate of low-pressure systems • Extreme, short-duration
models project a drier across Victoria. rainfall events are
climate future for • Large-scale climate generally becoming more
Victoria, particularly later drivers, such as El Niño intense in Victoria, a
this century under a high and the Indian Ocean trend that is expected to
emissions scenario. Dipole, that are largely continue into the future.
responsible for Victoria’s
Implications for the water sector
• Most of the rainfall and • A significant reduction depend on the conditions
runoff in Victoria occurs in the number of very in any given catchment.
during the cooler half of wet months since 1997, • The intensity of short-
the year. The reductions particularly during the duration (hour-long)
in rainfall during this cooler time of the year, rainfall events is increasing
part of the year have has also reduced water in some places but is not
a disproportionately availability. The wetter expected to offset the
large impact on water catchment conditions water availability impact of
availability, because this during these very wet overall declines in rainfall.
is the time of year when a months generally result However, it is likely to have
larger proportion of rainfall in a larger proportion of implications for urban
becomes runoff. rainfall becoming runoff hydrology and urban
• From a runoff perspective, and provide improved flooding, depending on the
possible increases in resilience for water users influence of overall drier
rainfall during the warmer or environmental systems catchment conditions and
months are unlikely to to cope during any capacity of the urban form
offset the impact of rainfall subsequent dry periods. and drainage systems to
declines during the cooler Changes in rural hydrology accommodate these short-
time of the year. and rural flooding will duration rainfall events.
Victoria’s water in a changing climate 192.1 Victoria’s climate
Victoria’s climate is highly variable; however, the trend in
recent decades is towards warmer and drier conditions.
In line with Australian and global warming, Victoria’s average annual temperature has risen by
around 1.2°C from 1910 to 2018 (Clarke et al. 2019). Since 1970, Victoria has only experienced 12
cooler than average years, the most recent in 1996 (Figure 2.1).
Victorian annual mean temperature
1.0
Mean temperature (°C)
0.5
0.0
−0.5
−1.0
1920 1940 1960 1980 2000 2020
Year
Figure 2.1 Annual average temperature anomaly for the whole of Victoria. The average (1961–
1990) is 14.1°C. The dark line shows the 11-year moving average.
FIG. 2.1 KEY TAKEAWAY:
The past 23 years in Victoria have all been warmer than the 1961–
1990 average.
20CH 2
Victoria’s rainfall is highly variable (Figure 2.2), as it is influenced by large-scale climate drivers
(see Section 2.5) and a range of weather systems over different timescales (Hope et al. 2017). The
variability and timing of extremes differ by season. Around two-thirds of Victoria’s total annual
rain falls during the cool season (April to October). This rainfall is important for many crops
and for replenishing reservoirs (Delage and Power 2020; Rauniyar and Power 2020). With lower
temperatures and less radiation at this time of year, proportionally less of this rainfall is lost to
evaporation and transpiration from catchments, and more rainfall is converted into runoff.
April−October November−March
300
300
200
200
100
100
Rain (mm)
0
0
−100
−100
−200
−200
1900 1920 1940 1960 1980 2000 2020 1900 1920 1940 1960 1980 2000 2020
Year Year
Figure 2.2 Victorian average rainfall anomaly in April–October (left) and November–March
(right). The averages (1961–1990) are 448.2 mm and 212.9 mm. The dark line shows
the 11-year moving average.
FIG. 2.2 KEY TAKEAWAY:
Victoria’s rainfall is highly variable and how Victoria’s rainfall
changes in response to climate change differs between seasons.
Victoria’s water in a changing climate 21Rainfall and temperature are Measures of actual and potential
intimately linked across Victoria, evapotranspiration provide indicators of water
availability. Potential evapotranspiration is
with rainfall linked to cooler daytime
the estimated evapotranspiration that would
conditions in all seasons (Hope
occur if there was no limit to the surface water
and Watterson 2018). Those cooler available to evaporate (Figure 2.3). Potential
conditions can persist for several evapotranspiration has a strong seasonal
months following very wet months, cycle in Victoria, peaking in January and
and result in relatively cooler annual with a minimum in June (in line with sunlight
temperatures, such as in 2010–2011. hours). Actual evapotranspiration only occurs
when water is available to evaporate and
The reason for this is that additional
has a more variable seasonal cycle, generally
rainfall causes higher soil moisture, peaking in spring.
resulting in increased evaporation
that keeps surface temperatures Potential evapotranspiration gives an indication
of how much extra moisture the air can hold. For
lower. However, minimum
example, in 2010, which had a very wet summer,
temperatures (usually night-time) are there was plenty of surface water to evaporate,
initially warmer during wet conditions, so actual evapotranspiration was high.
as additional cloud cover keeps However, the air was already very moist, and
surfaces warmer. The converse is likely could not accept more moisture, so potential
to be the case during dry conditions, evapotranspiration was low (Figure 2.3).
with more frequent and severe The actual evapotranspiration is far lower than
heatwaves during periods of drought the potential evaporation, highlighting that
(Perkins et al. 2015) and an increased Victoria is a generally water-limited environment
chance of frost (Crimp et al. 2016). and the actual evapotranspiration tends to
Although the variability of rainfall follow the surface water availability. The data in
Figure 2.3 is from the Australian Water Resource
drives some variability in temperature,
Assessment Landscape (AWRA-L) model,
there is still an underlying upward which uses satellite-based radiation data
trend in temperature (Figure 2.1). that starts in 1990. Since 1990 there has been
a downward shift in the cool-season actual
evapotranspiration and an upward trend in
potential evapotranspiration (Figure 2.3).
22 Tarago River. Photo credit: Sarah Gaskill, VEWHCH 2
Potential evapotranspiration: April−October Potential evapotranspiration: November−March
Evapotranspiration (mm)
Evapotranspiration (mm)
540
900
520
850
500
800
480
1950 1960 1970 1980 1990 2000 2010 2020 1950 1960 1970 1980 1990 2000 2010 2020
Year Year
Actual evapotranspiration: April−October Actual evapotranspiration: November−March
Evapotranspiration (mm)
Evapotranspiration (mm)
450
350
350
300
250
250
150
1950 1960 1970 1980 1990 2000 2010 2020 1950 1960 1970 1980 1990 2000 2010 2020
Year Year
Figure 2.3 Victorian average potential (top) and actual (bottom) evapotranspiration drawn
from the AWRA-L model for April–October (left) and November–March (right). The
dark line shows the 11-year moving average and the horizontal black line shows the
1961–1990 average. Note the different scales on the vertical axes.
FIG. 2.3 KEY TAKEAWAY:
The actual evapotranspiration is far lower than the potential
evapotranspiration, highlighting that Victoria is a generally water-
limited environment. Both are highly variable.
Victoria’s water in a changing climate 232.2 Recent rainfall decline
The decline in cool-season rainfall in recent decades is
unlikely to have been as large without the influence from
increasing levels of atmospheric greenhouse gases.
Cool-season rainfall was the lowest on record without the influence from increasing levels of
when averaged across the state during the atmospheric greenhouse gases (Rauniyar and
Millennium Drought (1997–2009; Figure 2.4, Power 2020).
top middle). It has continued to be low across
the state (Figure 2.4, top right) and, for many The warm season (November to March) also
locations, the 23 years since 1997 have had saw low rainfall totals across the south and
the lowest cool-season rainfall compared east of the state during the Millennium Drought
to any other 23-year period (Figure 2.4, top (Figure 2.4, bottom middle). Since the end of the
left). Averaged over the state, cool-season drought in 2010, there has been more warm-
rainfall since the beginning of the Millennium season rainfall than average in the north of the
Drought in 1997 through to the end of 2018 state and through the southern Murray Darling
was approximately 12% below the 1900–1959 Basin (Figure 2.4, bottom right), particularly due
average (Rauniyar and Power 2020). This early to heavy rains in 2010–2011 and 2016. Over the
climate reference period serves as a reference whole 22 years since the start of the Millennium
for recent observed change (see the box on Drought, the pattern of generally lower than
climate reference period in Section 4). The normal warm-season rainfall in the south and
majority of Global Climate Models (GCMs) higher than normal warm-season rainfall in
estimate that the decline in cool-season rainfall the north of the state is amplified (Figure 2.4,
in recent decades would not have been as large bottom left).
Mt Porepunkah. Photo credit: Stephen Routledge North East CMA
24CH 2
Cool season (April–October)
1997–2019 1997–2009 2010–2019
Warm season (November–March)
1997–2019 1997–2009 2010–2019
Rainfall decile ranges
1 2–3 4–7 8–9 10
Lowest on Very much Below Average Above Very much Highest on
record below average average average above average record
Figure 2.4 Rainfall decile maps for the cool season (April–October, top row) and warm season
(November–March, bottom row). For the full period since the start of the Millennium
Drought in 1997 (left column: 1997–2019), relative to all other 23-year periods; the
Millennium Drought years (middle column: 1997–2009), relative to all other 13-year
periods; and the years following the Millennium Drought (right column: 2010–2019),
relative to all other 10-year periods. Data: Australian Gridded Climate Data (Evans
et al. 2020).
FIG. 2.4 KEY TAKEAWAY:
There are still many dry regions post-drought despite the very wet
years of 2010–2011 and 2016.
Victoria’s water in a changing climate 25While the past 23 years have seen less than average rainfall across Victoria, it is particularly the
lack of very wet months that made the Millennium Drought and following years so unusual in the
record (Figure 2.5), except for 2010 which had five consecutive wet months between October 2010
and February 2011. This suggests a possible change in the distribution of monthly rainfall.
6
Warm season
Number of very wet months
Cool season
5
4
3
2
1
0
1900 1910 1920 1930 1940 1950 1960 1970 1980 1990 2000 2010 2020
Figure 2.5 Number of very wet months for Victoria in each year from April 1900 to March 2020,
where ‘very wet’ is defined as being above the 90th percentile of rainfall. By chance,
one would expect one or two of these in every year. Cool-season months (April–
October) are marked in blue and the following warm-season months (November–
March) are marked in red, together making up each ‘year’.
FIG. 2.5 KEY TAKEAWAY:
The Millennium Drought stands out as having only one very wet
month until 2010. After 2010, only 2016 has had more than one very
wet month.
Modelling suggests that the likelihood of dry conditions has increased due to increasing levels of
atmospheric greenhouse gases (Rauniyar and Power 2020). See Section 2.5 for more about drivers
of variability.
26CH 2
2.3 Simulated and projected rainfall changes
The majority of climate models project a drier climate future
for Victoria, particularly later this century under a high
emissions scenario.
Cool-season rainfall declines are projected to continue (on average) into the future by global
climate models (GCMs) (Figure 2.6).
Cool season (April–October) rainfall anomaly
40
30
Rainfall anomaly (mm per month)
20
10
0
-10
-20
-30
-40
1900 1920 1940 1960 1980 2000 2020 2040
Figure 2.6 Observed cool-season rainfall anomalies from the 1976–2018 climate period serves
as a reference for Victoria in mm per month (in bars). The solid and dashed lines
through the observations are 20-year and 15-year running averages respectively. The
coloured wedge represents the projected rainfall across 40 GCMs (CMIP5) by scaling
the observation for the 1975–2018 period with the model-based mid-decile scaling
factors derived by comparing the modelled future period with the modelled 1975–2018
period for different 30-year future periods centered at 2020, 2025 and every decade
afterwards to 2050. The dashed black line is the middle of the range across the 40
models and the pink shaded area shows the 10th to 90th percentiles range of the 40
models. In grey, the observed 1900–2018 decadal variability is added.
FIG. 2.6 KEY TAKEAWAY:
Victoria’s cool-season downward trend in rainfall is projected to
likely continue by GCMs. Current observations, which also include
natural climate variability, are tracking at the drier end of these
projections.
Victoria’s water in a changing climate 27Teasing out the influence of internal climate coming years and decades is unknown. Climate
variability (e.g. La Niña) from the effect of models suggest that for 2018–2037 there is
climate change (particularly greenhouse gas a small chance (12%) that internal rainfall
increases) on recent decades with low rainfall is variability will completely offset drying due to
important. This is because the part of any trend climate change under all emissions scenarios
attributed to increasing levels of greenhouse (Rauniyar and Power 2020).
gases is likely to continue into the future, while
changes due to internal climate variability might We do know, however, that dry conditions
shift back to rainfall totals seen prior to the dry become increasingly likely as the century
decades. Over any particular decade, internal unfolds, especially if international efforts do
variability might either temporarily enhance or not have a major impact on reducing global
lessen the drying trend due to climate change. greenhouse gas emissions.
Global ocean-atmosphere climate models and Up to 2060, climate models project similar
earth system models from the Coupled Model drying in Victoria for low, medium and high
Intercomparison Project Phase 5 (CMIP5) forced emissions scenarios (Rauniyar and Power
by the observed changes in the concentration 2020). After this, the degree of drying is related
of atmospheric greenhouse gases and other to emissions, with the least drying (6.5%
factors each simulate their own representation compared to the period 1900–1959) under a
of the Earth’s weather and climate. Of the 42 low scenario and the most (16%) under a high
models in CMIP5, 13 have provided two extra scenario. Like the historical change signal,
sets of results forced with only greenhouse gas the average over 24 models will smooth out
forcing or ‘natural’ forcing (solar variability and variations due to El Niño (for example) and
volcanoes). Averaging the results from many reveal the climate change signal.
GCMs reveals the signal above the natural For finer detail, such as catchment features,
variability. More than two-thirds of the climate results from downscaling should be considered,
model simulations show that rainfall in Victoria such as presented in the Victorian Climate
in the past two decades is below the pre- Projections 2019 (VCP19). VCP19 has results from
industrial average in response to increases in an atmosphere-only climate model with much
greenhouse gases (Rauniyar and Power 2020). finer resolution over Victoria, with forcing from
The implication is that, even though internally six of the 42 CMIP5 GCM results. The set of six
generated rainfall variability (e.g. in response GCMs were chosen to be representative of the
to El Niño) is an important part of our climate, range of results from all GCMs. The use of only
most of the climate models are indicating that six models and a single downscaling model
the likelihood of drier conditions is higher now mean these results are not a comprehensive
than it was early last century. set of projections in isolation. However, when
The influence of climate change becomes taken alongside other modelling and lines of
clear from 2010–2029, when more than 90% evidence, there are several notable insights that
of models show increased drying. While the can be gained. For example, there is very likely
impact of global warming on Victorian rainfall to be effects from topography on the projected
tends to increase as the 21st century unfolds, change in rainfall that are not adequately
large internal variability will continue to occur. captured by GCMs. This includes an enhanced
In some years and decades this might tend drying on the windward slopes of the Alps in
to either offset or exacerbate the underlying the cooler seasons, and possibly an enhanced
drying (Figure 2.7). The combined impact of the precipitation increase on the peaks of the Alps
anthropogenic forcing and natural variability in in summer (Clarke et al. 2019; Grose et al. 2019).
28CH 2
Chinamans Bend
Gunbower Forest Photo
credit: A Chatfield, North
Most global climate models underestimate the magnitude
Central CMA
of the observed decline in rainfall. This lowers confidence in
projections based on the same models.
The modelled drying during all periods from the underestimation of multidecadal rainfall
1900–2050 is smaller in magnitude than the variability (Rauniyar and Power 2020) and
drying that was observed during the Millennium the differences between the model and real-
Drought. This suggests that the observed world representations of key features of the
extreme conditions in the Millennium Drought atmospheric circulation and modes of climate
were affected by variability above and beyond variability (e.g. subtropical ridge, Southern
the variability represented by models, or that Annular Mode) and their relationship with
they were enhanced by climate change beyond Victorian rainfall (Grose et al. 2015, 2017; Hope
the modelled response, or that there are some et al. 2017; Lim and Hendon 2015; Timbal et al.
processes that climate models do not simulate 2015; Timbal et al. 2016). It should also be noted
adequately, which should be explored further. that the figures quoted above are based on
results obtained using rainfall averaged across
Global warming will significantly increase the the entire state. The impact of anthropogenic
risk of decadal droughts in the cool season that forcing on Victorian rainfall is expected to
are more severe than the World War 2 Drought be different between the north and south of
and the drying observed over 1997–2018, Victoria and also in the mountains (e.g. Grose et
particularly towards the end of 21st century al. 2019). Further work examining these regions
under high emissions (Figure 2.7). Under mid- separately will likely provide better estimates
level future emissions cool-season drying is with higher confidence.
projected to be less than under high emissions,
but the drying at the end of the century could Taking both global warming (under a high
still be similar in magnitude to the World War 2 emissions scenario, RCP8.5) and variability into
Drought (1935–1945). Furthermore, the risk of account, most models project drying in Victoria
experiencing droughts more extreme than towards the end of the century (2080–2100)
those that occurred during the historical period that is greater than the drying experienced
is also increased (Delage and Power 2020). during the World War 2 Drought (Figure 2.7).
Approximately 40% of models exhibit conditions
Note that confidence in estimates of the during 2080–2100 under RCP8.5 which are drier
contribution of anthropogenic forcing to past than those experienced during the Millennium
rainfall declines and estimates of future rainfall Drought. Major reductions in global greenhouse
is lowered because the models have difficulty gas emissions result in much less drying
simulating rainfall declines as large as those towards the end of the century. Internal climate
that have been observed. The reasons for variability can enhance or reduce any drying
this are not fully understood, although several signal in any given decade.
factors have been identified. These include
Victoria’s water in a changing climate 29Changes in cool season (April–October) rainfall relative to (1900–1959)
20
10
0
Percentage change
-10
-20
World War 2 Drought
Millennium Drought
Recent 22 years
-30 RCP8.5
RCP4.5
RCP2.6
-40
-50
5
9
8
9
9
9
9
9
9
9
9
94
01
00
02
03
04
05
06
07
08
09
–2
–2
–2
–1
–2
–2
–2
–2
–2
–2
–2
97
35
60
10
40
70
20
50
80
30
97
19
19
20
20
19
20
20
20
20
20
20
Figure 2.7 Simulated % changes in cool-season rainfall compared with observed changes
during the World War 2 (WW2) and Millennium Droughts, and 1997–2018, all relative
to 1900–1959. The distribution of changes in 24 models under high emissions
(RCP8.5) are represented as box plots for each 20-year period. The horizontal
line in the box indicates the median, the shaded box represents the inter-quartile
range (IQR: 25th and 75th percentiles) and the whiskers indicate the minimum and
the maximum values based on 24 CMIP5 models. The median values for medium
(RCP4.5) and low (RCP2.6) emissions scenarios are overlaid on the box plots as
blue and green circles, with corresponding IQRs represented by the blue and green
vertical lines, respectively. The black dots and three horizontal dotted lines show the
observed anomalies of rainfall during 1935–1945 (WW2 Drought), the last 22 years
(1997–2018) and 1997–2009 (Millennium drought) Source: Rauniyar and Power (2020).
FIG. 2.7 KEY TAKEAWAY:
The rainfall Victoria will receive in the future will depend on both the
amount of drying caused by the forcing due to human activities and
the impact of variability.
30You can also read