ENVIRONMENTAL CONDITION OF RIVERS AND STREAMS IN THE LATROBE, THOMSON AND AVON CATCHMENTS - ENVIRONMENT REPORT
←
→
Page content transcription
If your browser does not render page correctly, please read the page content below
ENVIRONMENT REPORT

    ENVIRONMENTAL
CONDITION OF RIVERS AND
STREAMS IN THE LATROBE,
  THOMSON AND AVON
     CATCHMENTS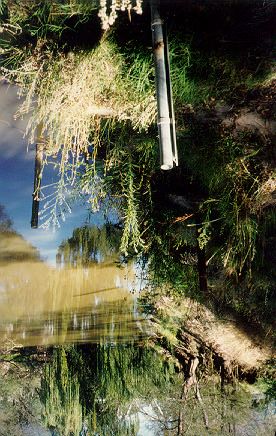
ENVIRONMENT REPORT

ENVIRONMENTAL CONDITION OF RIVERS AND STREAMS IN THE LATROBE,
              THOMSON AND AVON CATCHMENTS

                                Freshwater Sciences
                                    EPA Victoria
                              40 City Road, Southbank
                                    Victoria 3006
                                     AUSTRALIA

         Key contributors: Rhonda Butcher, George Canale, and David Robinson

                                   Publication 831
                                 ISBN 0 7306 7617 X

                             © EPA Victoria, March 2002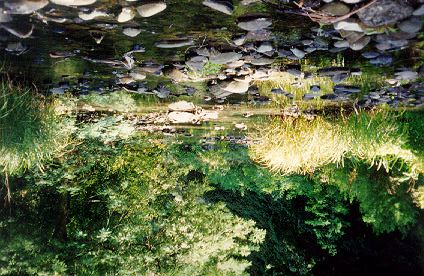
ABSTRACT

The Latrobe, Thomson and Avon river catchments contain some of Victoria’s most significant river systems.
Located in the Gippsland region of Victoria, these three river systems form the total catchment of Lake Wellington,
the western-most of the Gippsland Lakes.

Water is the fundamental resource that sustains all activities within the Gippsland region. Consequently, the
demands on water resources are considerable and include the nation’s largest pulp and paper mill, most of the
State’s power industry, much of Melbourne’s water supply, and the State’s second largest agricultural irrigation
district. Much of the region’s tourism is water based and requires the maintenance of high water quality and the
natural beauty of waterways to sustain this thriving industry.

Substantial change has occurred in these catchments since early settlement. Forests have been cleared,
extensive gold mining operations were common, large-scale coal mining and power generation, industrialisation,
development of intensive agriculture, and impoundment and diversion of water from the major tributaries has
occurred. These activities have contributed to a significant change in the quantity and quality of water delivered
to Lake Wellington and there is a significant amount of public concern regarding impacts on the health of the
Gippsland Lakes.

This report provides an assessment of the environmental condition of the rivers and streams in the Latrobe,
Thomson and Avon catchments. While most of the upper catchments and highland areas were found to be in
good to excellent condition, the lowland reaches of most rivers in the three catchments were clearly in very poor
condition. The loss of native streamside vegetation has resulted in destabilisation of the banks, direct loss of
habitat for biota, and invasion by exotic vegetation. Degraded in-stream habitat, resulting from removal of in-
stream woody debris, straightening of channels, and changes to the flow regime, also contributes to
destabilisation of the bed and banks, and increased erosion. The impact of river regulation in the lower Latrobe,
Thomson and Macalister rivers is evident, and it is likely that all river reaches below dams and weirs in the region
are being affected by regulation of flows. Very high levels of nutrients in the lower reaches of the Latrobe,
Thomson and Macalister rivers are clearly the main water quality problem. Irrigation drainage, runoff from
intensively farmed areas, sewage treatment plant discharges, industrial discharges, urbanisation, and erosion are
the key contributors.

The many initiatives now being implemented to significantly reduce runoff from irrigation areas, improve or
remove STP discharges, and restore the quality and quantity of streamside vegetation and in-stream habitat are
supported. There is a need for increased and co-ordinated investment in monitoring and assessment to ensure
the value of current programs, and the capacity to improve and adapt to new challenges as they arise.

                                                                                                                       i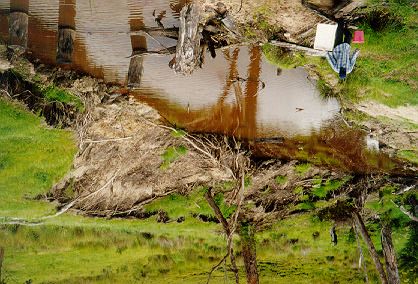
LIST OF ACRONYMS

AUSRIVAS   Australian Rivers Assessment System

AWT        Australian Water Technologies

CMA        Catchment Management Authority

CRCFE      Co-operative Research Centre for Freshwater Ecology

DNRE       Department of Natural Resources and Environment

DWR        Department of Water Resources

EPA        Environment Protection Authority (Victoria)

EPT        Ephemeroptera, Plecoptera, Trichoptera

GW         Gippsland Water

ISC        Index of Stream Condition

LVWSB      Latrobe Valley Water and Sewerage Board

MID        Macalister Irrigation District

NRHP       National River Health Program

RBA        Rapid Biological Assessment

RHA        Rapid Habitat Assessment

SEPP       State environment protection policy

SIGNAL     Stream Invertebrate Grade Number Average Level

SRW        Southern Rural Water

STP        Sewage Treatment Plant

USEPA      United States Environmental Protection Agency

VWQMN      Victorian Water Quality Monitoring Network

WGCMA      West Gippsland Catchment Management Authority

WoV        Waters of Victoria

ii
ACKNOWLEDGEMENTS

George Canale, Rhonda Butcher, and David Robinson all made major contributions to the collation and
interpretation of background data and information, and writing this report. Lisa Dixon provided extensive editing
and review of the various drafts. Stephen Perriss prepared the figures and tables, carried out data manipulations
and calculation of biological indices, and provided editorial comments.

EPA also acknowledges the financial support of the Commonwealth under the National River Health Program, for
the collection of the biological information that forms the primary basis for this assessment of environmental
condition.

                                                                                                                 iii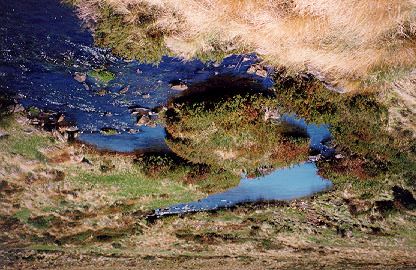
TABLE OF CONTENTS

ABSTRACT ................................................................................................................................................ I
LIST OF ACRONYMS ...................................................................................................................................II
1      INTRODUCTION ..................................................................................................................................1
     1.1      THE LATROBE, THOMSON AND AVON CATCHMENTS: FEATURES AND HISTORY........................................................1
     1.2      SCOPE ....................................................................................................................................... 2
     1.3      DATA SOURCES............................................................................................................................. 2
2.     ASSESSING ENVIRONMENTAL CONDITION ............................................................................................ 4
     2.1      ENVIRONMENTAL QUALITY OBJECTIVES .................................................................................................. 4
     2.2      W ATER QUALITY .............................................................................................................................5
     2.3      BIOLOGICAL QUALITY .......................................................................................................................7
       AUSRIVAS ....................................................................................................................................... 10
       Key Families .................................................................................................................................... 10
       SIGNAL ........................................................................................................................................... 10
       Number of Families .......................................................................................................................... 11
       EPT Index ........................................................................................................................................ 11
       Index of Stream Condition – ISC......................................................................................................... 11
       Rapid Habitat Assessment – RHA ....................................................................................................... 11
     2.4      HABITAT CONDITION....................................................................................................................... 12
3.     BIOLOGICAL REGIONS IN THE LATROBE, THOMSON AND AVON CATCHMENTS ........................................... 13
     3.1      HIGHLANDS (REGION 1) .................................................................................................................. 13
     3.2      F ORESTS A (REGION 2)................................................................................................................... 13
     3.3      F ORESTS B (REGION 3)................................................................................................................... 14
     3.4      CLEARED HILLS AND COASTAL PLAINS (REGION 4) .................................................................................... 15
4.     LATROBE RIVER CATCHMENT .............................................................................................................. 16
     4.1      STUDY AREA............................................................................................................................... 16
     4.2      W ATER QUALITY CHARACTERISATION AND ASSESSMENT.............................................................................. 18
     4.3      BIOLOGICAL ASSESSMENT ...............................................................................................................23
       Upper Latrobe and Northern Tributaries .............................................................................................. 27
       Middle Latrobe and Western Tributaries..............................................................................................30
       Latrobe River below Lake Narracan..................................................................................................... 31
       Macalister Irrigation District ..............................................................................................................33
     4.4      LATROBE CATCHMENT SUMMARY ........................................................................................................33
5.     THOMSON RIVER CATCHMENT ............................................................................................................ 35
     5.1      STUDY AREA............................................................................................................................... 35
     5.2      W ATER QUALITY CHARACTERISATION AND ASSESSMENT..............................................................................36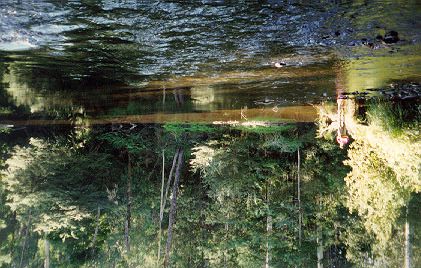
5.3      BIOLOGICAL ASSESSMENT ...............................................................................................................42
       Highlands .......................................................................................................................................43
       Upper Thomson Catchment...............................................................................................................46
       Upper Macalister Catchment ............................................................................................................. 47
       Lower Thomson and Macalister Rivers ................................................................................................48
       Macalister Irrigation District ..............................................................................................................49
     5.4      THOMSON CATCHMENT SUMMARY ......................................................................................................49
6.     AVON RIVER CATCHMENT .................................................................................................................. 51
     6.1      STUDY AREA............................................................................................................................... 51
     6.2      W ATER QUALITY CHARACTERISATION AND ASSESSMENT.............................................................................. 52
     6.3      BIOLOGICAL ASSESSMENT ............................................................................................................... 53
       Upper Avon Catchment ..................................................................................................................... 56
       Lower Avon Catchment ..................................................................................................................... 56
       Macalister Irrigation District .............................................................................................................. 57
     6.4      AVON CATCHMENT SUMMARY ........................................................................................................... 57
7.     OVERVIEW OF THE CATCHMENTS ........................................................................................................ 59
     7.1      INTRODUCTION............................................................................................................................. 59
     7.2      HIGHLANDS ................................................................................................................................60
     7.3      UPPER CATCHMENTS......................................................................................................................60
     7.4      LOWLAND REACHES....................................................................................................................... 61
       Lower Latrobe River .......................................................................................................................... 61
       Moe River .......................................................................................................................................62
       Lower Thomson and Macalister rivers.................................................................................................62
       Lower Avon River .............................................................................................................................62
     7.5      MACALISTER IRRIGATION DISTRICT.......................................................................................................63
     7.6      URBAN CREEKS............................................................................................................................63
     7.7      MAIN F ACTORS INFLUENCING ENVIRONMENTAL CONDITION ..........................................................................64
       Habitat Degradation .........................................................................................................................64
       Modified Flow Regimes .....................................................................................................................64
       Water Quality .................................................................................................................................. 65
8.         MANAGEMENT INITIATIVES IN THE REGION .......................................................................................66
     8.1      CATCHMENT AND W ATERWAYS MANAGEMENT .........................................................................................66
     8.2      MANAGEMENT OF NUTRIENTS IN THE MACALISTER IRRIGATION DISTRICT ............................................................ 67
     8.3      MANAGEMENT OF SEWAGE TREATMENT PLANT DISCHARGES.........................................................................68
9.     CONCLUSIONS................................................................................................................................. 70
     9.1      HABITAT DEGRADATION................................................................................................................... 70

2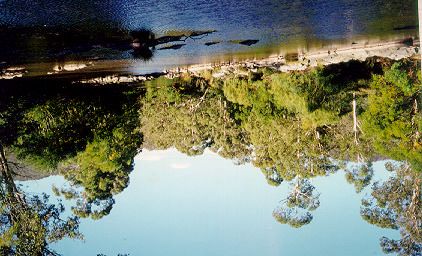
9.2      ENVIRONMENTAL F LOWS ................................................................................................................. 70
   9.3      W ATER QUALITY ........................................................................................................................... 70
   9.4      MONITORING AND ASSESSMENT......................................................................................................... 71
10.      REFERENCES AND FURTHER READING .............................................................................................. 73
APPENDIX 1: BIOLOGICAL INDICATORS AND REGIONS ................................................................................... 78

TABLES

TABLE 1: SCHEDULE F5 (LATROBE AND THOMSON RIVER BASINS AND MERRIMAN’S CREEK)
IN-STREAM WATER QUALITY INDICATORS AND OBJECTIVES............................................................................. 6

TABLE 2: DRAFT BIOLOGICAL OBJECTIVES AND CONDITION CATEGORIES FOR EACH BIOLOGICAL
REGION IN THE LATROBE, THOMSON AND AVON CATCHMENTS ....................................................................... 9

TABLE 3: WATER QUALITY DATA FOR BIOLOGICAL SITES IN THE LATROBE RIVER CATCHMENT ..............................22

TABLE 4: TRENDS IN WATER QUALITY IN THE LOWER LATROBE RIVER, 1963 – 1993. ...........................................23

TABLE 5: RESULTS FOR DRAFT BIOLOGICAL OBJECTIVES, ISC, AND RHA FOR SITES IN THE LATROBE CATCHMENT. .. 25

TABLE 6: WATER QUALITY DATA FOR BIOLOGICAL SITES IN THE THOMSON RIVER CATCHMENT. ........................... 37

TABLE 7: TOTAL PHOSPHORUS CONCENTRATIONS IN THE LOWER THOMSON
AND MACALISTER RIVERS, 1997-1999. ........................................................................................................38

TABLE 8: RESULTS FOR DRAFT BIOLOGICAL OBJECTIVES, ISC, AND RHA FOR
SITES IN THE THOMSON CATCHMENT. ........................................................................................................ 45

TABLE 9: WATER QUALITY DATA FOR BIOLOGICAL SITES IN THE AVON RIVER CATCHMENT................................... 53

TABLE 10: RESULTS FOR DRAFT BIOLOGICAL OBJECTIVES, ISC, AND RHA FOR SITES IN THE AVON CATCHMENT. ..... 55

TABLE 11: EXAMPLE AUSRIVAS O/E FAMILY SCORE CATEGORIES.....................................................................80

FIGURES

FIGURE 1: LOCATION OF THE LATROBE, THOMSON AND AVON CATCHMENTS IN VICTORIA.................................... 3

FIGURE 2: BIOLOGICAL REGIONS OF VICTORIA............................................................................................... 9

FIGURE 3: CALEDONIA RIVER AT HOWITT HUT – ALPINE GRASSLAND MEADOW.................................................. 13

FIGURES 4 AND 5: TRARALGON CREEK AT KOORNALLA, AND LATROBE RIVER AT HAWTHORN BRIDGE.................... 14
FIGURES 6 AND 7: MACALISTER RIVER DOWNSTREAM OF STRINGYBARK CREEK AND THOMSON RIVER AT THE
NARROWS. ............................................................................................................................................. 15

FIGURES 8 AND 9: LATROBE RIVER AT ROSEDALE AND NEWRY CREEK SHOWING STOCK
ACCESS AND CLEARING OF STREAM SIDE VEGETATION. ................................................................................. 15

FIGURE 10: RIVERS AND STREAMS IN THE LATROBE CATCHMENT, MAJO R TOWNS, WATER STORAGES AND
BIOLOGICAL REGIONS. ............................................................................................................................. 16

FIGURES 11-14: WATER QUALITY FOR SITES ON THE LATROBE RIVER. ................................................................ 21

FIGURES 15 AND 16: EXAMPLES OF ‘GOOD CONDITION’ AND ‘DEGRADED’ STREAMS
FOUND IN THE LATROBE RIVER CATCHMENT.................................................................................................24

FIGURE 17: AUSRIVAS AND SIGNAL RATINGS FOR SITES IN THE LATROBE RIVER CATCHMENT...............................24

FIGURE 18: RIVERS AND STREAMS IN THE THOMSON CATCHMENT, MAJOR TOWNS, WATER STORAGES
AND BIOLOGICAL REGIONS. ...................................................................................................................... 35

FIGURES 19-22: WATER QUALITY FOR SITES ON THE THOMSON RIVER. .............................................................40

FIGURES 23-26: WATER QUALITY FOR SITES ON THE MACALISTER RIVER. ......................................................... 41

FIGURES 27 AND 28: EXAMPLE OF ‘GOOD CONDITION AND DEGRADED’ RIVERS IN THE THOMSON RIVER
CATCHMENT. ..........................................................................................................................................42

FIGURE 29: AUSRIVAS AND SIGNAL RATINGS FOR SITES IN THE THOMSON RIVER CATCHMENT ............................43

FIGURE 30: RIVERS AND STREAMS IN THE AVO N CATCHMENT, MAJOR TOWNS AND BIOLOGICAL REGIONS. ........... 51

FIGURES 31 AND 32: EXAMPLES OF UPLAND AND LOWLAND RIVERS IN THE AVON RIVER CATCHMENT. ................. 54

FIGURE 33: AUSRIVAS AND SIGNAL RATINGS FOR SITES IN THE AVON RIVER CATCHMENT. .................................. 54

FIGURE 34: COMBINED TOTAL PHOSPHORUS LOADS TO RIVERS FROM GIPPSLAND WATER STP
OPERATIONS FROM 1994 TO PRESENT, WITH PROJECTIONS TO 2003. ..............................................................69

4
ENVIRONMENTAL CONDITIONS OF RIVERS AND STREAMS
       IN THE LATROBE, THOMSON AND AVON CATCHMENTS

1         INTRODUCTION

1.1       The Latrobe, Thomson and Avon Catchments: Features and History

The Latrobe, Thomson and Avon river catchments contain some of Victoria’s most significant river systems and
the demands on these freshwater resources are considerable. The three catchments are located in the Gippsland
region of Victoria, east of Melbourne (Figure 1). The nation’s largest pulp and paper mill, most of the State’s
power industry, much of Melbourne’s water supply and the State’s second largest irrigation district fall within
their boundaries. Approximately 25 per cent of the Latrobe and Thomson rivers mean annual flows are diverted
for off stream uses. Major population centres include Moe, Morwell, and Traralgon.

Combined, the three river systems form the total catchment of Lake Wellington, the western-most of the three
major lakes forming the Gippsland Lakes. Lake Wellington connects to Lake Victoria via McLennan’s Strait, flows
into Lake King and finally Bass Strait at Lakes Entrance. While Lake Victoria and Lake King are more influenced by
marine waters than Lake Wellington, freshwater inputs into Lake Wellington heavily influence the water quality of
the lakes system as a whole, particularly the western end of Lake Victoria.

Since European settlement there has been considerable change in the catchment of Lake Wellington. Forests
have been cleared, extensive gold mining operations were common, large scale coal mining and power
generation, industrialisation, development of intensive agriculture, and impoundment and diversion of water
from the major tributaries has occurred. These activities have contributed to a significant change in the quantity
and quality of water delivered to the Gippsland Lakes from the Latrobe and Thomson river catchments. Harris et
al. (1998) state that the reduction of flows (through regulation) from the Gippsland catchments has reduced
flushing rates. This, in turn, increases salinity and the likelihood of algal blooms, and cascade to cause other
ecological imbalances.

As a consequence of land use changes within these catchments, the Latrobe and Thomson river systems
contribute approximately twice the nutrient inputs to the Gippsland Lakes than all other riverine inputs. The
Latrobe River provides approximately half the flows and two thirds of the nutrient load to Lake Wellington (EPA
1995). The most significant nutrient loading is associated with high flow events and reflects the increased surface
runoff and erosion caused through land clearance and urbanisation.

The West Gippsland Catchment Management Authority (WGCMA) has identified water as ‘the fundamental
resource’ that sustains all activities within the region, and considers water quality to be the single most important
regional issue (West Gippsland Regional Catchment and Land Protection Board 1997). Much of the tourism of
Gippsland is centred on water resources and the natural beauty of waterways and wetland ecosystems, and
contributes approximately $480 million annually to the regional economy. Tourism leads to additional pressures
on water resources in the region, and relies on the maintenance of high water quality and natural values to
support the industry.

                                         Environment Report                                                          1
E N V I R O N M E N TA L C O N D I T I O N S O F R I V E R S A N D S T R E A M S
IN THE LATROBE, THOMSON AND AVON CATCHMENTS
Most reports and agencies agree that the only long-term solution to improve the condition of Lake Wellington is to
significantly reduce the nutrient loads from the Latrobe and Thomson river systems. The State environment
protection policy (SEPP) for the Latrobe and Thomson river Basins (Government of Victoria 1996), and the
accompanying Policy Impact Assessment (EPA 1996), emphasise the need to reduce nutrient inputs, in particular
phosphorus, to Lake Wellington. The SEPP requires a 40 per cent reduction in phosphorus loads to Lake
Wellington by 2005, and that in-stream nutrient concentrations are much reduced. Restoration of the catchment
to a more sustainable land use, revegetating riparian zones and reducing erosion are considered critically
important.
1.2 Scope
This report provides an assessment of the environmental condition of the rivers and streams in the Latrobe,
Thomson and Avon catchments. The main focus of the study considered the impacts of broad catchment-wide
issues. The effects of specific point source discharges, urban areas or the highly modified section of the lower
Morwell River are not addressed in detail. The assessment is based largely on biological indicators, being the
best indicators of overall condition, but also incorporates water and habitat quality assessments.
1.3 Data Sources
The information presented in this report incorporates a number of data sources, but relies predominantly on
biological monitoring undertaken by EPA between 1990 and 1999 as part of the National River Health Program
(NRHP) (Davies 1994) and State-wide biological monitoring programs. Other primary sources of information
include the Index of Stream Condition assessment (Victorian Water Resources Data Warehouse) and water quality
data collected for the Victorian Water Quality Monitoring Network (1977 to present).
2
EPA VictoriaENVIRONMENTAL CONDITIONS OF RIVERS AND STREAMS
IN THE LATROBE, THOMSON AND AVON CATCHMENTS
Figure 1: Location of the Latrobe, Thomson and Avon catchments in Victoria
Environment Report 3E N V I R O N M E N TA L C O N D I T I O N S O F R I V E R S A N D S T R E A M S
IN THE LATROBE, THOMSON AND AVON CATCHMENTS
2. ASSESSING ENVIRONMENTAL CONDITION
Monitoring and assessment of environmental condition provides essential feedback on the state of our river
systems. This feedback enables managers to develop and refine management programs, and to direct resources
and activities to where they are needed most.
Traditionally, assessment programs have relied upon physical and chemical indicators of water quality. EPA
Victoria has moved in recent years towards a more holistic approach to environmental assessment in rivers and
streams, which incorporates biological indicators of ecosystem health.
When using physical and chemical indicators alone, the underlying assumption has been that if these are met,
then the aquatic environment can be considered to be in good health. However, the problems with using physical
and chemical indicators alone include:
• interactions between contaminants, which may affect biota, are not taken into account;
• the type of measurements, as spot measurements in time, do not reflect the full variability of water quality.
Intermittent inputs and flood events are often missed;
• appropriate parameters may not be measured; and
• a reliance on physical and chemical data does not allow for assessment of other factors which affect
distribution of biota, such as inadequate physical habitat, water volume, or introduced species.
The use of biological indicators largely overcomes these problems and provides a means for directly assessing
the health of an ecosystem. Importantly, the impacts of factors other than water quality, such as habitat
degradation and altered flows, can also be detected using biological indicators.
2.1 Environmental Quality Objectives
State environment protection policies set a statutory framework for the protection of agreed beneficial uses and
values of Victoria’s water environments. One of the key beneficial uses is the protection of aquatic ecosystems.
Other beneficial uses include water supply for domestic, industrial and agricultural uses, and recreational use of
surface waters.
Each beneficial use of water has its own quality requirements. SEPPs protect beneficial uses by establishing
environmental quality objectives for key indicators. These objectives are based upon what is achievable in the
context of natural background levels and constraints placed by human land uses and activities within a
catchment. Objectives are set to maintain the quality of a healthy ecosystem or, in the case of degraded systems,
are more usually set as targets to bring about a significant improvement in the condition of a water body within a
specified timeframe.
4
EPA VictoriaENVIRONMENTAL CONDITIONS OF RIVERS AND STREAMS
IN THE LATROBE, THOMSON AND AVON CATCHMENTS
In Victoria, all surface waters are covered by the SEPP Waters of Victoria (WoV) (Government of Victoria 1988)
which sets the strategic framework and environmental quality objectives for the protection of all surface waters
within Victoria. Within the framework of the SEPP WoV, schedules are developed for specific water bodies and
catchments in Victoria. The waters of the Latrobe, Thomson and Avon catchments are covered by Schedule F5:
Waters of the Latrobe and Thomson Basins and Merriman Creek Catchment (Government of Victoria 1996). For
indicators of environmental condition not covered by Schedule F5, the objectives in the principal policy SEPP WoV
apply.
The SEPP WoV is currently under review (EPA publication 795). Building on the knowledge gained in the last
decade, objectives that better reflect environmental quality, including biological objectives, have been developed
as a part of the review process. Because Schedule F5, which is the relevant SEPP for the Latrobe and Thomson
River catchments, does not have quantitative biological objectives, this condition assessment uses the draft
biological objectives developed as a part of the WoV review.
2.2 Water Quality
The key physical and chemical indicators considered in this report are nutrients (phosphorus and nitrogen),
turbidity, salinity, pH, temperature and dissolved oxygen. The SEPP WoV Schedule F5 has been used as the basis
for the assessment of physical and chemical indicators of water quality (Table 1).
Water quality assessments are based on data from a number of sources. Firstly, EPA site data from water samples
taken and field parameters measured at the time of biological sampling. There are, however, limitations in the
use of these data in that it only represents two points in time and trends cannot be described, nor can it be clearly
stated whether water quality meets established objectives. These data can only be used to give an indication of
the conditions in which the biota were living at the time of collection, and to help explain differences in
community composition. The site based water quality data are, in effect, water quality snap-shots of the
catchments. These snap-shots can be used to graphically display longitudinal patterns in chemical gradients
along the rivers, but should be interpreted cautiously due to the small number of samples and because the snap-
shot samples are spread out over a period of weeks.
A number of reports and databases exist which assess or provide long-term water quality data throughout the
Latrobe, Thomson and Avon catchments. The major sources used are annual reporting from the Victorian Water
Quality Monitoring Network (AWT 1999), trend analysis based on sites with a minimum of 10 years data (Smith
and Nathan 1999) and an analysis of water quality exceedence based on current management policy objectives.
The information from these sources is used in conjunction with the water quality data collected during the
biological sampling to complement and strengthen our understanding of environmental quality in the rivers and
streams throughout the three catchments.
Environment Report 5E N V I R O N M E N TA L C O N D I T I O N S O F R I V E R S A N D S T R E A M S
IN THE LATROBE, THOMSON AND AVON CATCHMENTS
Table 1: Schedule F5 (Latrobe and Thomson River Basins and Merriman’s Creek) in-stream water quality indicators and objectives
Indicators (units) Segment A Segment B Segment C Segment D Segment E Segment F Segment G
(predominantly (predominantly (mixed forestry and (predominantly (predominantly the (natural watercourses draining (wetlands)
reserves and forests and forestry agricultural agricultural industrial area of the irrigation)
conservation activities) activities) activities) Latrobe valley)
areas)
pH (pH units) acceptable range N 5.5 to 8.0 5.5 to 8.0 6.0 to 8.5 6.0 to 8.5 6.0 to 8.5 6.0 to 8.5
Dissolved Oxygen min. concentration N >8.0 >7.0 >6.0 >5.0 >5.0 >6.0
(mg/l & %
min. saturation N >85% >75% >65% >55% >55% >65%
saturation)
Salinity ( mg/l) an. 90th percentile NENVIRONMENTAL CONDITIONS OF RIVERS AND STREAMS
IN THE LATROBE, THOMSON AND AVON CATCHMENTS
2.3 Biological Quality
During the last decade, EPA Victoria, in recognition of the shortcomings of using only physical and chemical
objectives for the protection of aquatic ecosystems, has developed biological monitoring methods, together with
indicators and draft objectives, to supplement existing water quality objectives in environmental policies.
The SEPP Schedule F7 for the Yarra River (Government of Victoria 1999) was the first to include quantitative
biological objectives for aquatic macroinvertebrates as well as the presence of certain species of fish. Schedule
F5 (Waters of the Latrobe and Thomson Basins and Merriman Creek Catchments) does not include quantitative
biological objectives. Draft biological objectives have been developed and are being considered for the revised
SEPP WoV (Table 2). If adopted, these draft objectives will apply to all surface water streams in the State that do
not have specific catchment based objectives in place.
Given that it is not practical to develop objectives for all ecosystem components and processes, EPA selected
aquatic macroinvertebrates as the most appropriate component for developing biological objectives (see
Appendix 1.1). A fundamental feature of the draft objectives is that they are based on biological regions. This was
needed due to the obvious differences between, for example, an alpine stream and a stream in the Wimmera.
Biota in different regions are distinctive and require their own regionally based objectives. This approach is
similar to that used to develop water quality objectives in catchment based policies in which segments are
defined, usually based upon land use. In this case, the regions have been defined by the biota (Figure 2) and are
further described in Chapter 3 and Appendix 1.2.
The draft biological objectives represent goals for the restoration of some streams and minimum maintenance
standards for others. Some streams of very high quality will easily meet the draft objectives and, in these cases,
maintenance of background condition is required.
Seven indices of river condition are used to assess the environmental condition of the rivers and streams in the
Latrobe, Thomson and Avon catchments. They are AUSRIVAS (Australian Rivers Assessment System), SIGNAL
(Stream Invertebrate Grade Number Average Level), Key Families, Number of Families, EPT (Ephemeroptera +
Plecoptera + Trichoptera) Index, the Index of Stream Condition (ISC), and the USEPA Rapid Habitat Assessment
(RHA) Protocol.
Of these indices, five specifically assess the status of the aquatic macroinvertebrate community (AUSRIVAS,
SIGNAL, Key Families, Number of Families, and EPT), one is specific to stream habitat values (RHA); and the other
(ISC) is a general overview incorporating five components of stream condition. The latter two indices (RHA and
ISC) are mainly used to assist the interpretation of the biological assessments.
Draft objectives for ecological health, within each biological region, are generally provided for each of four
macroinvertebrate community indices (AUSRIVAS, SIGNAL, Number of Families, and EPT). These indices can be
broadly grouped into three categories – a measure of diversity (Number of Families), biotic indices (SIGNAL and
EPT) and measures of community structure (AUSRIVAS). Where AUSRIVAS results are not appropriate, the Key
Environment Report 7E N V I R O N M E N TA L C O N D I T I O N S O F R I V E R S A N D S T R E A M S
IN THE LATROBE, THOMSON AND AVON CATCHMENTS
Families indicator is used. Draft objectives are provided for both riffle and edge habitats as different invertebrate
communities occur in each habitat and both habitats may not occur at all sites.
The draft biological objectives cover a broad range of sizes and stream types, and some anomalies are expected
to occur. It is possible, for example, that one habitat will pass while the other habitat fails to meet all objectives.
When this discrepancy between habitats occurs, then the overall site assessment is usually based on the worst
outcome; that is, an environmentally conservative approach is followed. If a site does not meet one or more of
the draft biological objectives, the judgement or opinion of qualified stream ecologists is needed to determine
whether the stream is anomalous within its assigned region or is truly failing to meet objectives. In some cases,
this could highlight the need for further sampling of the site to clarify the assessment.
Assessment against the draft biological objectives requires that:
• the Rapid Bioassessment Protocol (RBA) (EPA 1998) has been used to collect the data;
• edge and/or riffle habitat data are used;
• samples are collected from two seasons (spring and autumn) within one year, and combined for assessment;
and
• presence or absence of all invertebrate families are recorded.
8
EPA VictoriaENVIRONMENTAL CONDITIONS OF RIVERS AND STREAMS
IN THE LATROBE, THOMSON AND AVON CATCHMENTS
Biological Regions
Highl ands
Forests A
Forests B
Clear ed Hills and Coastal Plains
Murray and Western Plains
Unclassifi ed
N
0 50 100 150 200 Kilometers
Figure 2: Biological Regions of Victoria.
Table 2: Draft biological objectives and condition categories for each Biological Region in the Latrobe, Thomson
and Avon catchments
Indicator Highlands Forests A Forests B Cleared Hills and
(Region 1) (Region 2) (Region 3) Coastal Plains
(edge/riffle) (edge/riffle) (edge/riffle) (Region 4)
(edge/riffle)
AUSRIVAS N/A Band A Band A Band A
SIGNAL 6.2/5.8 5.7/6.0 5.8/6.0 5.5/5.5
Number of 13/22 22/21 24/23 26/23
Families
EPT Index score 4/10 7/9 9/10 N/A
Key Families Combined habitat 18 N/A N/A N/A
ISC/RHA Condition Excellent Good Marginal Poor Very Poor
Rating
ISC score 42-50 35-41 26-34 20-25 0-19
RHA score >150 140-150 130-140 120-130E N V I R O N M E N TA L C O N D I T I O N S O F R I V E R S A N D S T R E A M S
IN THE LATROBE, THOMSON AND AVON CATCHMENTS
AUSRIVAS
AUSRIVAS is a classification and predictive modelling technique based upon the River InVertebrate Prediction and
Classification System (RIVPACS), originally developed in Britain (Wright 1995). AUSRIVAS was developed under
the Federal Government’s National River Health Program as a means to assess the condition of rivers and streams
across Australia. The models predict the aquatic macroinvertebrate families expected to occur at a site in the
absence of environmental stressors, such as water pollutants or habitat degradation. By comparing the totalled
probabilities of predicted families and the number of families actually found, a ratio can be calculated for each
test site. This ratio is expressed as the observed number of families/expected number of families (the O/E
index). The O/E scores are used to place a site into a band or category that summarises its ecological health. The
derivation of AUSRIVAS scores and the banding categories are given in Appendix 1.3.
Regional models have been developed for all biological regions except the Highlands Region where a State-wide
model is used to provide an O/E ratio. As a consequence, there is no draft AUSRIVAS objective for the Highlands
Region. In this case, the site is assessed against the alternate draft Key Families objective.
In this report, unless otherwise noted, collections from two seasons (spring/autumn) are combined for
assessment. Where multiple visits to a site have occurred, only the most recent sampling data are used. If data
from two seasons are not available for a site then a single season assessment is presented.
Key Families
This method focuses mainly on the loss of the taxa indicative of good habitat and water quality. The families that
are selected are those that are typically found in the streams in that region. For example, families such as
Coloburiscidae and Austroperlidae occur in cool, forested streams typical of the upland and mountain areas of
the State. Other families, such as Calamoceratidae, Coenagrionidae and Hydrophilidae become more common in
the warmer streams of the foothills and lowlands. Not all of the families can be expected to occur in every stream
throughout each region. The Key Families include taxa that are representative of all major habitats expected in
each region and are commonly collected when present.
SIGNAL
The SIGNAL index (Stream Invertebrate Grade Number – Average Level, Chessman 1995), is an arithmetic average
of pollution sensitivity values assigned at the family level for aquatic macroinvertebrate taxa. It was developed
for south-eastern Australian streams and is more sensitive to organic pollution than to habitat degradation.
Sensitivity values range from one to 10 with lower values representing pollution tolerant families. Some
macroinvertebrate families were not assigned scores in Chessman (1995) but have subsequently been allocated
sensitivity ratings (B. Chessman, pers. Comm.).
10
EPA VictoriaENVIRONMENTAL CONDITIONS OF RIVERS AND STREAMS
IN THE LATROBE, THOMSON AND AVON CATCHMENTS
Number of Families
The number of families of aquatic macroinvertebrates collected using a rapid biological assessment method
provides a general indication of the health of a site. Generally, a healthy site will support a large number of
families, whereas the presence of stressors will eliminate some families. The number of families of invertebrates
found at a site will vary over time and also across a catchment. This is a simple index of health and is used in
conjunction with other biotic indices.
EPT Index
Species from the insect Orders of the Ephemeroptera (mayflies) Plecoptera (stoneflies) and Trichoptera
(caddisflies) are considered to be some of the most sensitive to pollution and disturbance. High numbers of
families from these Orders at a site are considered to indicate a healthy stream.
Index of Stream Condition – ISC
The ISC is a general indicator of environmental condition of rivers and streams that integrates information from
five sub-indices (Victorian Water Resources Data Warehouse):
1. Hydrology – flow volume and seasonality of flow
2. Physical Form – stream bank and bed condition, presence of and access to physical habitat
3. Streamside Zone – quality and quantity of streamside vegetation
4. Water Quality – nutrient concentration (total P), turbidity, electrical conductivity and pH
5. Aquatic Life – diversity of macroinvertebrates
The final ISC score is a weighted mean of the five sub-indices and ranges from zero to 50 with higher scores
(greater than 35) indicating good stream condition (see Table 2).
The data for the Hydrology, Water Quality and Aquatic Life sub-indices were collated by the DNRE from the
Victorian Hydrographic Network, the Victorian Water Quality Monitoring Network and the NRHP, respectively. In
some cases, data for the Water Quality and Aquatic Life sub-indices were not available and were estimated by
EPA. Physical Form and Streamside Zone data were collected by the West Gippsland CMA during site visits in
1999.
Rapid Habitat Assessment – RHA
Rapid Habitat Assessment (Barbour et al. 1999) classifies a stream’s habitat condition based upon the variety
and quality of the substrate, channel morphology, bank structure, and riparian vegetation. Ten parameters are
evaluated visually and rated on a numerical scale of zero to 20 giving a possible range of scores from zero to 200.
Scores greater than 140 are considered to indicate good to very good habitat conditions (Table 2).
Environment Report 11E N V I R O N M E N TA L C O N D I T I O N S O F R I V E R S A N D S T R E A M S
IN THE LATROBE, THOMSON AND AVON CATCHMENTS
2.4 Habitat condition
Water quality has in the past been a major focus of attention, however a problem receiving increased recognition
is the physical degradation of waterways, and poor in-stream and riparian habitat. Maintenance of a stream’s
habitat features is a key component of river health. Even with good water quality and flows, a healthy aquatic
ecosystem cannot be supported if suitable habitat is not present.
While quantitative environmental quality objectives for habitat have yet to be developed, the importance of
habitat is emphasised in the SEPP WoV management objectives, which feature strongly in the policy’s attainment
measures. In this report, general qualitative or semi-quantitative assessments of habitat condition have been
used.
Habitat quality assessments are based on the USEPA Rapid Habitat Assessment (RHA) Protocol and the Index of
Stream Condition (ISC) (Table 2). RHA data were collected by the NRHP while ISC data on Physical Form and
Streamside Zone were collected by the West Gippsland CMA during site visits in 1999.
12
EPA VictoriaENVIRONMENTAL CONDITIONS OF RIVERS AND STREAMS
IN THE LATROBE, THOMSON AND AVON CATCHMENTS
3. BIOLOGICAL REGI ONS IN THE LATROBE, THOMSON AND AVON
CATCHMENTS
3.1 Highlands (Region 1)
As the name suggests, the Highlands Biological Region is restricted to the high country of Victoria, with streams
often on steep slopes, generally above 1000m and subject to high rainfall. The vegetation tends to be native
forest, woodland and grassland. Riparian shading varies from moderate to low cover, depending on the flow of
streams through forested or grassland areas, respectively. The streams tend to be small (compared to other
biological regions). They also have the lowest water temperatures, and very low alkalinity, turbidity and salinity.
The stream habitat is generally characterised by the presence of riffles and limited edge habitat, with coarse
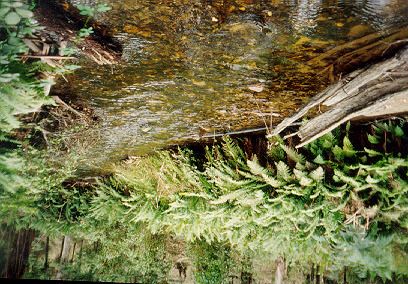
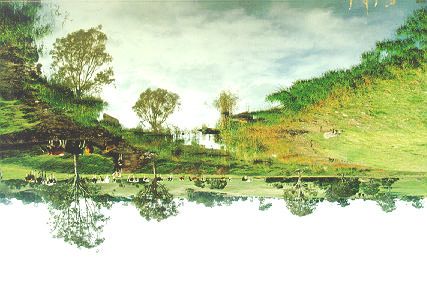
substrate, and low macrophyte cover and diversity. Figure 3 shows the Caledonia River at Howitt Hut in 1998. This
is a relatively large stream for those found in the Highlands Biological Region.
Figure 3: Caledonia River at Howitt Hut – alpine grassland meadow.
3.2 Forests A (Region 2)
Five separate areas form the Forests A Region, including the Grampian and Strzelecki Ranges, the upper
catchments of the Yarra and Murray rivers, Wilson’s Promontory and the far east of the State. Although
discontinuous, they share similar environmental and biological characteristics. The streams are generally located
on moderately steep slopes at much lower altitudes than the Highlands Region, but at moderately high altitudes
relative to the remaining regions. Rainfall is moderate to high. Tall forests and woodlands are the typical
vegetation cover. Streams generally have considerable shading from the riparian zone, and tend to be larger than
streams in the Highlands Region. Cool waters with very low alkalinity, turbidity and salinity characterise the
Environment Report 13E N V I R O N M E N TA L C O N D I T I O N S O F R I V E R S A N D S T R E A M S
IN THE LATROBE, THOMSON AND AVON CATCHMENTS
region, except in the Grampians where there is low to moderate salinity. Streams typically have both riffle and
edge habitat with moderately coarse substrate, and very low macrophyte cover and diversity. Figures 4 and 5
show rivers in the Latrobe catchment typical of the Forests A Region.
Figures 4 and 5: Traralgon Creek at Koornalla, and Latrobe River at Hawthorn Bridge.
3.3 Forests B (Region 3)
The Forests B Region incorporates the Otway Ranges and the foothills both north and south of the Great Dividing
Range to form a discontinuous region supporting tall open forests. The region generally covers an area similar in
altitude to the Forests A Region, but stream slopes are less steep and rainfall is slightly lower. A greater degree of
clearing for forestry, grazing and some intensive agriculture occurs in this region compared with the Highlands
and Forests A Regions. This results in a lower level of riparian shading. Streams are generally larger, with more
than double the catchment area of streams in the Forests A Region. Alkalinity of the cool waters typical of this
region is slightly elevated relative to the Highlands and Forests A Regions, but still remains low along with
turbidity and salinity. Stream habitat is characterised by the presence of riffles and edges, with very coarse
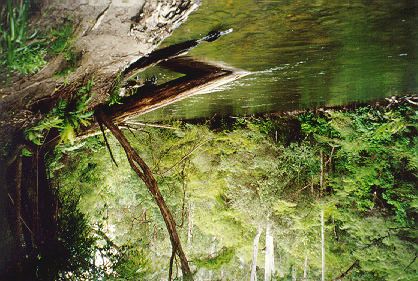
substrate and high macrophyte diversity and cover. Figures 6 and 7 are examples of this type of river in the
Thomson River catchment.
14
EPA VictoriaENVIRONMENTAL CONDITIONS OF RIVERS AND STREAMS
IN THE LATROBE, THOMSON AND AVON CATCHMENTS
Figures 6 and 7: Macalister River downstream of Stringybark Creek and Thomson River at The Narrows.
3.4 Cleared Hills and coastal Plains (Region 4)
The urban area of Melbourne divides this region which is characterised by coastal plains in the south, and inland
plains and low foothills in the north and east. Streams flow through an undulating landscape of low altitude with
little gradient and relatively low rainfall. The region has been substantially cleared for intensive agriculture
including dryland pasture and some irrigated pasture, resulting in poor riparian shading. Warm stream waters
with high alkalinity, and low to moderate turbidity and salinity characterise the region. The edge habitat is more
developed and extensive runs and riffles are less common. The substrate tends to be composed of moderate to
fine particles, and there is a very high diversity and moderate cover of macrophytes. Examples of the types of
rivers found in the Cleared Hills and Coastal Plains are the Latrobe River at Rosedale (Figure 8) and Newry Creek
(Figure 9).
Figures 8 and 9: Latrobe River at Rosedale and Newry Creek showing stock access and clearing of stream side
vegetation.
Environment Report 15E N V I R O N M E N TA L C O N D I T I O N S O F R I V E R S A N D S T R E A M S
IN THE LATROBE, THOMSON AND AVON CATCHMENTS
4. L A T R O B E R I V E R C A TC H M E N T
4.1 Study Area
The Latrobe River rises at an elevation of approximately 750m due west of Noojee, in the north east corner of its
catchment (Figure 10). Its headwaters, together with the Ada, Loch and Toorongo rivers, drain the eastern and
southern slopes of the Yarra Ranges, which form a southern extension of the Great Dividing Range. This part of
the upper catchment area is mostly forested. Coarse gravel, sand and cobbles dominate the streambed of the
main rivers. Sand and gravel dominate the streambeds of the main stem of the Latrobe and Ada rivers in
particular. In the Willow Grove area, approximately 70km from its source, the Latrobe River emerges from the
foothills onto its floodplain. A sandy substratum predominates throughout much of the river’s lower reaches to
its termination at Lake Wellington, approximately another 140km downstream. The catchment area of the Latrobe
River is approximately 4900km2 representing approximately 23 per cent of the total catchment of the Gippsland
Lakes. The catchment has a temperate climate and precipitation varies greatly, from about 1600mm in high
elevation northern areas, approximately 1200mm in the Strzelecki Ranges, to about 600mm in the eastern part of
the Latrobe Valley near Rosedale. The Baw Baw Plateau also receives significant snowfall in the winter months.
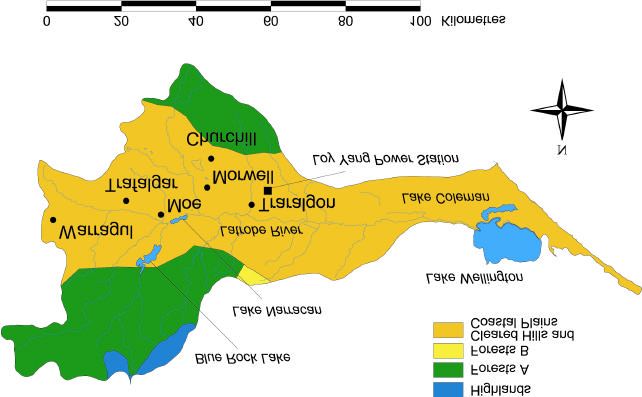
Figure 10: Rivers and streams in the Latrobe catchment, major towns, water storages and Biological Regions.
16
EPA VictoriaENVIRONMENTAL CONDITIONS OF RIVERS AND STREAMS
IN THE LATROBE, THOMSON AND AVON CATCHMENTS
Two major rivers flow into the Latrobe River in its middle reaches: the Tanjil and the Tyers. Both rivers drain the
south-western slopes of the Baw Baw Plateau at a maximum altitude of 1566m. Much of the catchment for both
rivers consists of native forest and only in their lower reaches has significant clearing occurred. Both rivers also
have large impoundments located on their middle reaches that provide domestic and industrial supply to the
area. Blue Rock Lake on the Tanjil River has a storage capacity of 200,000ML while Moondarra Reservoir on the
Tyers River has a storage capacity of 30,000ML.
The forested areas of the upper Latrobe, Tanjil and Tyers rivers have been used for timber extraction since early
settlement, and largely fall within the General Management Zone of the Central Highlands Regional Forest
Agreement. The only significant public land set aside as parks or reserves in the Latrobe catchment are Mt Baw
Baw National Park, and Moondarra and Tyers Parks; all within the upper parts of the Tanjil and Tyers sub-
catchments.
The Strzelecki Ranges form the southern and south-western borders of the Latrobe catchment, and major
tributaries draining these ranges include the Moe and Morwell rivers and Traralgon Creek. Tributaries in this part
of the Latrobe catchment tend to have much smaller areas remaining under forest, with the majority of their
length running through agricultural land. Much of the forest is plantation timber.
The Moe River flows through agricultural land in the south-western part of the catchment, becoming an artificial
channel called the Moe Drain near the township of Yarragon. It receives treated effluent from Warragul and Moe
sewage treatment plants (STPs) before joining the Latrobe River near the township of Moe, and upstream of its
confluence with the Tanjil River. The Latrobe River main stem has been impounded to form Lake Narracan
approximately 2km downstream of the confluence with the Tanjil River. This storage is relatively small at 8400ML
but can have an important influence on the flow regime of the lower Latrobe River. In particular, it can contribute
to rapid rises and falls in water level in the river downstream.
At the town of Sale, approximately 15km from its terminus into Lake Wellington, the Latrobe River receives waters
from the Thomson River. The Thomson River and its tributaries are discussed in detail in Chapter 5. It is in this
lower reach from Rosedale to Sale that the Latrobe River receives significant inputs of irrigation drainage from the
Macalister Irrigation District (MID). The MID, which covers an area of about 45,000 hectares, lies to the north of
this reach of the Latrobe River, straddling the lower reaches of the Thomson River and is bounded in the east by
the Avon River. It is the second largest irrigation area in Victoria and is largely devoted to intensive dairy farming.
The MID draws most of its water from the Thomson and Macalister rivers and its drainage flows into the lower
reaches of the Latrobe, Thomson, Macalister and Avon rivers. The drainage from the MID carries a large load of
nutrients to the rivers, which has been estimated at 70 tonnes per year of total phosphorus (EPA 2001b). This
represents about 40 per cent of the total annual phosphorus load to Lake Wellington (EPA 1995). The Latrobe
River receives inputs from three large drains (Central Gippsland Drains 1, 2 and 3) which together account for
about 30 per cent of the drainage flow from the MID.
Environment Report 17E N V I R O N M E N TA L C O N D I T I O N S O F R I V E R S A N D S T R E A M S
IN THE LATROBE, THOMSON AND AVON CATCHMENTS
Mean annual flow from the Latrobe River into Lake Wellington is approximately 980,000ML. Approximate surface
water usage is: urban 12,000ML, industrial 60,000ML, rural 150ML and irrigation 52,000ML (West Gippsland
Catchment Management Authority 1997).
As well as urban and agricultural runoff, the Latrobe River system receives a number of EPA licensed discharges
from industrial sources. These include Australian Paper located at Maryvale which discharges directly into the
Latrobe River, and wastewaters from numerous power station and coal mining activities through the Latrobe
Valley, most of which discharge into the Morwell River and Traralgon Creek. The Latrobe Valley power industry
supplies the bulk of Victoria’s electricity needs and historically has been a major force in shaping the
management of water flows, storage requirements and waste inputs to the Latrobe River system.
4.2 Water Quality Characterisation and Assessment
The SEPP (Schedule F5) water quality objectives for each segment are given in Table 1. Water quality results for
salinity (electrical conductivity), turbidity, total nitrogen (N) and total phosphorus (P) for biological sites are
presented in Table 3. These EPA site data provide an indication of possible non-compliance with objectives (see
2.2). Selections of the data in Table 3 are presented graphically in Figures 11 to 14 to provide a snapshot of
longitudinal changes in the Latrobe River.
In addition to the water quality data collected during the biological surveys, there are six Victorian Water Quality
Monitoring Network (VWQMN) sites in the Latrobe River catchment that were assessed for compliance with water
quality objectives. Water quality trends have also been assessed in the VWQMN data (AWT 1999, Smith and
Nathan 1999). The VWQMN dataset commences in 1977 for most parameters, however regular monthly
monitoring for nutrients did not occur until 1991. A longer-term dataset is also available for Thoms Bridge and
Rosedale on the Latrobe River for the period 1963 to 1993. These data, which were collected by the Latrobe Valley
Water and Sewerage Board (LVWSB, now Gippsland Water) have been analysed for trends (Table 4).
Figures 11 to 14 clearly show the longitudinal changes in water quality on the main stem of the Latrobe River. All
four indicators increase with distance downstream and are much higher in the reach downstream of Willow Grove.
Grayson et al. (1993) also undertook a low flow snap shot investigation in the Latrobe River catchment and found
that the Morwell River, Traralgon Creek and the Moe River/Drain all had a major influence on the levels of these
indicators during low flows. Discharges from industry and the influence of townships were identified as major
contributors.
Although increasing significantly with distance downstream, the data in Table 3 show that all indicators, except
for phosphorus, appear to comply with SEPP Schedule F5 objectives. Assessment of VWQMN data confirms
compliance for salinity and turbidity, however, both nitrogen and phosphorus were found to have a low level of
compliance at Thoms Bridge. At Rosedale, phosphorus had a low level of compliance, and nitrogen was only fair.
Willow Grove can experience quite high values of total P, with the 90th percentile value of 0.078mg/l (AWT 1999)
greatly exceeding the SEPP Schedule F5 objective. Both nutrients increase from Rosedale to Kilmany (Figures 13
18
EPA VictoriaYou can also read