Assessment of Water Quality and Pollution Index in Coastal Waters of Mimika, Indonesia
←
→
Page content transcription
If your browser does not render page correctly, please read the page content below
Journal of Ecological Engineering Received: 2018.08.30
Revised: 2018.10.01
Volume 20, Issue 2, February 2019, pages 87–94 Accepted: 2018.11.06
https://doi.org/10.12911/22998993/95266 Available online: 2018.12.10
Assessment of Water Quality and Pollution Index in Coastal Waters
of Mimika, Indonesia
Rosye Hefmi Rechnelty Tanjung1, Baigo Hamuna2*, Alianto3
1
Department of Biology, Cenderawasih University, Kamp Wolker Street, Jayapura City 99351, Papua, Indonesia
2
Department of Marine Science and Fisheries, Cenderawasih University, Kamp Wolker Street,
Jayapura City 99351, Papua, Indonesia
3
Department of Fisheries, University of Papua, Gunung Salju Street, Manokwari 98314, West Papua, Indonesia
* Corresponding author’s e-mail: bhamuna@yahoo.com.sg
ABSTRACT
A good water quality is essential to sustaining the life of the organisms. The determination of water quality is needed
as a direction to monitoring the water pollution. The purpose of this study is to examine the quality of the water and
to determine the water pollution index based on the physicochemical parameters in Mimika waters, Indonesia. The
sampling of water quality was carried out in October 2016 at six stations (Moga, Puriri, Inaoga, Keakwa, Atuka and
Pomako waters). Then, the results were compared with the standard of sea water quality for biota marine based on
the Decree of the Minister of Environment No. 51 year 2004. This study showed that the physicochemical param-
eters of the waters, such as water turbidity, BOD, NH3 and heavy metals (Hg, As, Cd, Pb, Cu, Zn, Ni and Cr), are still
appropriate to the biota marine in all study stations. However, there is a parameter for which the quality standards
were exceed in all locations, including water salinity for coral and seagrass, NO3, PO4 and H2S. The result of pollu-
tion index calculation at coastal waters Mimika are classified as lightly polluted (Keakwa and Pomako waters), and
moderately polluted (Moga, Puriri, Inaoga and Atuka waters) with the pollution index values of 3.51 to 6.95. It is
important to notice that the parameters of quality standards which had been exceed such as NO3, PO4 and H2S are
the environmental parameter for nutrient elements and can trigger eutrophication in the waters.
Keywords: water quality; water pollution index; physicochemical parameters; quality standards; marine biota;
Mimika waters
INTRODUCTION ter discharge (Chen et al., 2007; Tjahjono et al.,
2017; Drira et al., 2017).
The main issue in the territorial waters is the The development of buildings in the Mimika
condition of polluted waters, which can reduce region, especially in coastal areas has an influ-
the quality of the aquatic environment. The or-
ence on the existence of ecosystems in the low-
ganic and inorganic pollutants in the coastal wa-
land and coastal areas (IFACS, 2014). In addition,
ters can lead to the quality of water such as the
the high activity in the coastal and marine waters
biological function degradation and make an im-
pact to the water. The water quality depends on of Mimika can make an impact on the pollution
the environment and it is determined based on the and the quality of coastal and marine waters.
physicochemical parameters of the waters (Ha- The number of large and small rivers flowing in
muna et al., 2018). Organic and inorganic materi- coastal waters will bring industrial waste, agri-
als flow through rivers, upwelling processes, ver- cultural waste and anthropogenic waste from the
tical mixing of water masses and anthropogenic mainland. These conditions can disturb the po-
sources such as agriculture, aquaculture, industry, tential in coastal and marine waters as a source
fisheries activities, fuel use and vessel ballast wa- of food for the community.
87
Journal of Ecological Engineering Vol. 20(2), 2019

    The research on the sea waters quality of         Measurement and Analysis of Waters Quality
Mimika and its surroundings was carried out by
                                                          The in situ measurement of yjr water quality
Ilahude et al. (2004), Herlisman et al. (2010) and
                                                      at each study station was carried out using ac-
Pranowo et al. (2013). However, only a few en-
                                                      credited methods. Meanwhile, the sampling of
vironmental parameters were reported in these
                                                      sea water sample using laboratory analysis. It was
studies. On the other hand, the water quality in-     conducted by taking sea water samples into poly-
formation is very important in supporting the         ethylene and 500 mL glass bottles, with the vol-
planning and management of coastal and marine         ume of 350 mL, 200 mL and 100 mL, which were
areas. This water quality assessment can provide      given preservatives, then stored in the coolbox for
information whether the quality water can threat-     analysis. The seawater sampling is done based on
en the utilization biota marine. The assessment of    the Indonesian National Standard (SNI) method
water quality is a complex process and involves       No. 6964.8.2015. The sea water samples were
a variety of water parameters which are able to       analyzed in the BINALAB Laboratory, Bandung.
influence the quality of the waters.                  This laboratory was accredited by KAN (National
    The purpose of this study is to determine the     Accreditation Committee). The types of physics
quality of the coastal waters of Mimika which fo-     and chemistry parameters of seawater were in this
cus on the concentration of physical and chemical     study. The measurement methods and standard
                                                      analysis were presented in Table 1. The data anal-
parameters of the waters according to the water
                                                      ysis was done by comparing the results of field
quality standard for marine biota. The results of
                                                      measurements (in situ) and the results of labora-
this study are expected to provide basic informa-     tory analysis with the sea water quality standards
tion, especially the quality of marine waters as an   based on Minister of Environment Decree No. 51
advice for the management of the coastal and ma-      year 2004 about Sea Water Quality Standards es-
rine areas of Mimika.                                 pecially the life of marine biota.

                                                      Water Pollution Index
MATERIALS AND METHODS
                                                          The pollution index is a useful tool to provide
Study Area                                            information about the water quality. It was deter-
                                                      mined based on the Decree of the Minister of En-
    Mimika is one of the districts in Papua Prov-     vironment No. 51 year 2004 using the following
ince, Indonesia. It has complete landscapes from      forumla (Nemerow and Sumitomo, 1970):
mangroves in coastal areas, peat swamp forests,
lowland forests, mountainous areas to ice alpine                       (Ci /Lij )2 +(Ci /Lij )2       (1)
                                                                PIj = √          M            R
zones. There are 94% of the mangrove forests and                                   2
some other lowland forest types with the range
                                                      where: Lij: standard water quality parameter for
of about 54–97% being conservation targets (IF-
                                                             each parameter at specifed water quality
ACS, 2014). In addition, there are 17 watersheds
                                                             purpose (j)
in Mimika Regency that flow to coastal and ma-               Ci: measured water quality parameters i
rine waters. Mimika Regency waters are part of               PIj: the pollution index for a specifed j wa-
the Arafura Sea, characterized by dynamic wa-                ter quality purpose (j)
ters with a depth of about 50–80 meters. It also             (Ci/Lij)M: maximum value of Ci/Lij
has the potential for high fisheries resources such          (Ci/Lij)R: average value of Ci/Lij
as demersal fish and several types of shrimp
(Pranowo et al., 2013).                                   The relation between the level of water pollu-
                                                      tion and the pollution index criteria based on the
    This study located in Mimika waters was con-
                                                      Decree of the Minister of Environment No. 115
ducted in October 2016 . The locations for mea-
                                                      year 2003 about Determination of Water Quality
surement and sampling of seawater include 6 sta-      Status is as follows:
tions, namely (1) Moga waters; (2) Puriri waters;         0 ≤ PIj ≤ 1 : meets the standard/good quality
(3) Inaoga waters; (4) Keakwa waters; (5) Atuka           1 ≤ PIj ≤ 5 : lightly polluted
waters; and (6) Pomako waters. The sampling lo-           5 ≤ PIj ≤ 10 : moderately polluted
cation in this study is presented in Figure 1.            PIj > 10      : heavily polluted

88
Journal of Ecological Engineering Vol. 20(2), 2019
Figure 1. Locations of the sampling stations in coastal waters of Mimika, Indonesia
RESULTS AND DISCUSSION of fresh water through the river. According to the
results obtained by Ilahude et al. (2004), the tem-
Water Quality perature in coastal waters of Timika ranges from
28.0 to 30.0oC and slightly lower salinity – from
The quality value of marine waters which had 24.0 to 30.0‰. Another study showed that the
been exceeded at the maximum level will be clas- temperature in Arafura waters ranges to 29.1°C
sified as polluted waters. The results of field mea- and salinity ranges from 24.14 to 33.71‰ (Herl-
surements and laboratory analysis on the quality isman et al., 2010). The water temperature in this
of Mimika waters using physical and chemical study is the same as the sea surface temperature in
parameters are presented in Table 2. Tempera- the northern waters of Papua which ranges from
ture and salinity water are important factors for 25 to 31°C and dominant range is from 27 to
the life of organisms in the waters. The results of 29°C (Hamuna et al., 2015). According to Decree
measurements of the Mimika waters temperature of the Minister of Environment of the Republic
range from 27.5 to 29.3oC, while salinity ranges of Indonesia No. 51 year 2004 about sea water
from 30.0 to 36.3‰. Low salinity at stations 2, 4 quality standards, only the low water tempera-
and 5 was caused bz the entering of huge amount ture at station 3 and station 6 do not comply with
89Journal of Ecological Engineering Vol. 20(2), 2019
Table 1. Standard and analytical methods of physicochemical parameters for water quality
Parameters Units Standards* Analytical Methods
Coral: 28–30
Temperature o
C Mangrove: 28–32 APHA 2550 B 2012
Seagrass: 28–30
Turbidity NTU 5 IK-S2 (DO meter)
Biochemical Oxygen Demand
mg L -1
20 APHA 5210 B 2012
(BOD)
Ammonia Total (NH3) mg L-1 0.3 SNI 19–6964.3–2003
Nitrate (NO3) mg L-1 0.008 SNI 19–6964.7–2003
Phosphate (PO4) mg L -1
0.015 SNI 06–6989.31–2005
Sulfide (H2S) mg L-1 0.1 SNI 19–6964.4–2003
Mercury (Hg) mg L-1 0.001 IK-L 42-MP-AES
Arsenic (As) mg L-1 0.012 IK-L 42-MP-AES
Cadmium (Cd) mg L-1 0.001 APHA 3111 B 2012
Lead (Pb) mg L-1 0.008 APHA 3111 B 2012
Copper (Cu) mg L -1
0.008 APHA 3111 B 2012
Zinc (Zn) mg L-1 0.05 APHA 3111 B 2012
Nickel (Ni) mg L-1 0.05 APHA 3111 B 2012
Chromium (Cr) mg L-1 0.05 APHA 3111 B 2012
Remarks: *Minister of Environment Decree No. 51 year 2004 about Seawater Quality Standards for Marine Biota
Table 2. The physicochemical parameters in coastal waters of Mimika, Indonesia
Stations
Parameters
St. 1 St. 2 St. 3 St. 4 St. 5 St. 6
Temperature ( C) o
28.3 29.3 27.5 29.3 28.1 27.8
Turbidity (NTU) 0.49 0.19 1.32 0.16 1.33 0.63
TSS (mg L-1) 13 6.67 17.43 28 13.71 8.57
pH 6.5 6.7 7.3 7.6 6.9 6.7
Salinities (‰) 35.4 30.4 36.3 30 30.1 32
DO (mg L )
-1
4.7 4.7 4.4 4.6 5.2 5.2
BOD (mg L-1) 0.27 0.3 0.18 0.29 0.24 1.08
NH3 (mg L-1) 0.1 0.05 0.1 0.1 0.07 0.18
NO3 (mg L-1) 0.32 0.04 0.07 0.07 0.3 0.08
PO4 (mg L-1) 0.13 0.37 0.85 0.14 0.09 0.02
H2S (mg L-1) 0.04 0.03 0.04 0.06 0.06 0.06
Hg (mg L )
-1Journal of Ecological Engineering Vol. 20(2), 2019 sea water quality standards for the life of marine and activity. The DO and BOD parameters are biota. Meanwhile, the results of measurements of important to determine the quality of waters. DO water salinity show that salinity at all study sta- shows the total amount of dissolved oxygen in tions does not comply with sea water quality stan- the waters for breathing and metabolic processes, dards for marine biota life (coral and seagrass), while BOD shows the amount of dissolved oxy- but it is still appropriate for mangrove growth. gen needed by microorganisms to decompose or Although the water temperature and salinity in decompose organic matter under aerobic condi- some study stations did not appropriate with the tions (Salmin, 2005). The results of The Mimika quality standards, the changes of temperature to waters DO analysis ranges from 4.4 to 5.2 mg
Journal of Ecological Engineering Vol. 20(2), 2019
erated by agricultural, aquaculture, industrial and Cd (0.032 to 0.071 mg L-1) in Ambon waters also
household or waste activities population (Cloern, exceeded the quality standards for marine biota
2001; Casali et al., 2007). (Tupan and Uneputty, 2017). Furthermore, the
Similarly to the NO3 and PO4 concentrations, heavy metal content of Cr (0.14 to 0.16 mg L-1)
the H2S concentrations in the waters exceeded exceeded the quality standards in Tugu coastal
the quality standards. The results of H2S concen- waters, Semarang (Suryono and Rochaddi, 2013).
tration analysis range from 0.03 to 0.06 mg L-1. The heavy metal pollution from industry, domes-
According to Poppo et al. (2012), the source of tic activities, transportation and natural sources
high concentrations of H2S in the waters stems from rocks flow to the river or ocean waters and
from decomposition process of organic materi- accumulate in the waters and marine biota. The
als which contain of sulfur by anaerobic and – a heavy metals in waters at certain concentrations
result of reduction– anaerobic conditions against will change their function to toxic to the life of
sulfates by microorganisms. The H2S concen- waters (Murtini et al., 2001).
tration varies based on season and H2S can af-
fect the cycle of some trace metals in the waters Water Pollution Index
(Cutter and Krahforst, 1988).
According to the results of heavy metal con- Most studies about the water quality assess-
tent analysis in the Mimika waters, the content of ment use a water quality index (Dunca, 2018).
heavy metals (Hg, As, Cd, Pb, Cu, Zn, Ni and Cr) The water pollution index provides a single as-
in all station was low (below detection limit). That sessment score on the environmental parameters
is why the content of heavy metal in the Mimika and it will be analyzed to interpret the water qual-
waters is safe for marine biota. Compared with ity (Popovic et al., 2016). The water pollution in-
some waters in Indonesia, the content of heavy dex can be used to determine the level of water
metals dissolved in waters exceeded the qual- pollution in coastal areas. The results of the pol-
ity standards for marine biota. For example, the lution index calculation can give an advice to the
heavy metal content of Pb (0.6037 to 0.6647 mg decision makers in order to assess the quality of
L-1) and Cu (0.064 to 0.1707 mg L-1) in the waters waters and improve the quality of water if there is
of Demak, Central Java exceeded the quality stan- a quality reduction due to the existence of pollut-
dards for marine biota (Tjahjono and Suwarno, ant compounds. The results from the analysis of
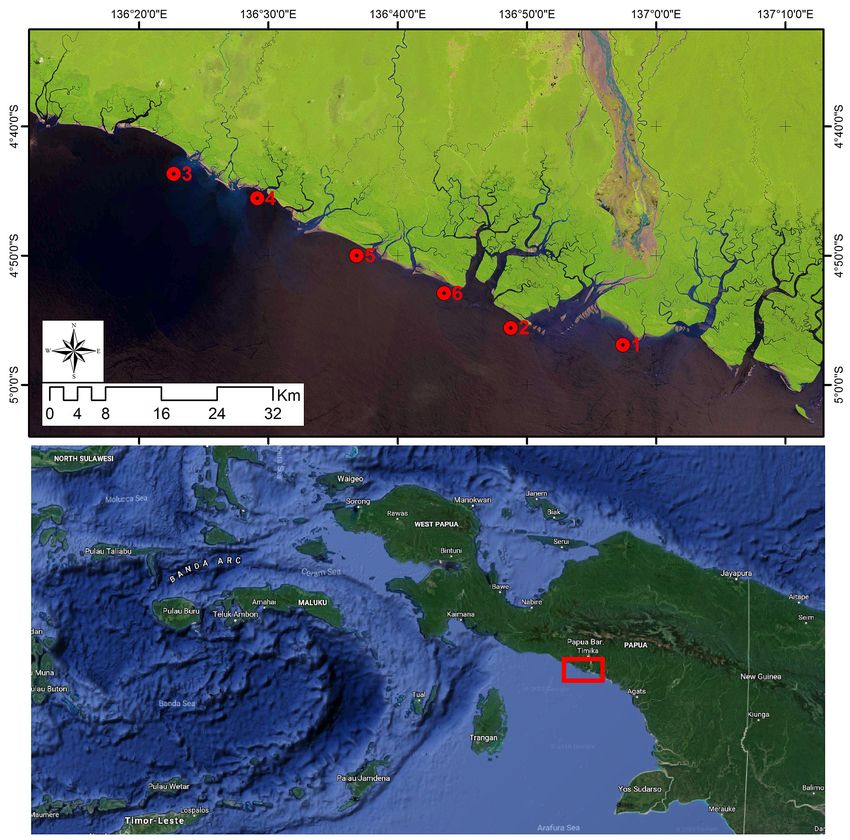
2018). For some cases in the waters of Madura, the pollution index values at
each station are fully
East Java (Apriani et al., 2018) the heavy metal presented in Figure 2.
content of Pb reached (0.07 to 0.42 mg L-1) and According to the results of the pollution in-
Cu (0.08 to 1.56 mg L-1). In addition, the heavy dex calculation in Figure 2, it can be seen that
metal content of Pb (0.013 to 0.084 mg L-1) and all observation stations are characterized by mild
Figure 2. Water pollution index in coastal waters of Mimika, Indonesia
92Journal of Ecological Engineering Vol. 20(2), 2019
to moderate polluted conditions, where only the REFERENCES
waters of Keakwa and Pomako are categorized as
lightly polluted with a pollution index value of 1. Abdel-Halim A.M., Aly-Eldeen M.A. 2016. Char-
4.21 and 3.51, respectively. Moga, Puriri, Inaoga acteristics of Mediterranian sea water in vicinity of
and Atuka waters are in the moderately polluted Sidikerir region, west of Alexandria, Eqypt. Eqyp-
tian Journal of Aquatic Research, 42, 133–140.
category with the pollution index values of 5.46,
5.66, 6.95 and 5.36, respectively. According to 2. Apriani M., Hadi W., Masduqi A. 2018. Physi-
the results of water quality analysis, the parama- cochemical properties of sea water and bittern in
Indonesia: Quality improvement and potential
ters of quality standards for marine biota such as
resources utilization for marine environmental
pH, salinity, DO, NO3, PO4 and H2S, are exceed- sustainability. Journal of Ecological Engineering,
ed. This condition Has become an issue because 19(3), 1–10.
NO3, PO4 and H2S are environmental parameters 3. Bonnin E.P., Biddinger E.J., Botte G.G. 2008. Ef-
with contain nutrient element. If figh concentra- fect of catalyst on electrolysis of ammonia efflents.
tions of nutrients accumulate and increase in ma- Journal of Power Sources, 182, 284–290.
rine waters, they cause danger the eutrophication 4. Casali J.R., Gimenez J., Diez J., Álvarez Mozos J.,
for marine biota (Hamuna et al., 2018). de Lersundi D.V., Goni M., Campo M. A., Chahor
Y., Gastesi R., Lopez J. 2010. Sediment production
and water quality of watersheds with contrasting
CONCLUSIONS land use in Navarre (Spain). Agricultural Water
Management, 97, 1683–1694.
The parameters of water environment consist- 5. Chen C.W., Kao C.M., Chen C.F., Dong C.D. 2007.
ing of water turbidity, BOD, NH3 and heavy met- Distribution and accumulation of heavy metals in
als (Hg, As, Cd, Pb, Cu, Zn, Ni and Cr) are within sediments of kaoshiung harbor. Chemosphere, 66:
the standards quality for marine biota in all study 1431–1440.
stations. Water temperature did not meet the qual- 6. Cloern J.E. 2001. Our Evolving conceptual mod-
ity nails in the waters of Inaoga and Pomako. el of the coastal eutrophication problem. Marine
Ecology Progress Series, 210, 223–253.
TSS exceeded the quality standards for coral and
seagrass in the waters of Keakwa, the pH of the 7. Cutter G.A., Krahforst C.F. 1988. Sulfide in surface
waters of the western Atlantic Ocean. Geophysical
waters did not appropriate with the quality stan-
Research Letters, 15(2), 1393–1396.
dards in the waters of Moga, Puriri, Atuka and
8. Drira Z., Sahnoun H., Ayadi H. 2017. Spatial dis-
Pomako, while DO did not agree with the stan- tribution and source identifcation of heavy metals
dards quality in Moga, Puriri, Inaoga and Keakwa in surface waters of three coastal areas of Tunisia.
waters. There are parameters that exceeded qual- Polish Journal of Environmental Studies, 26(3),
ity standards in all study locations such as water 1057–1069.
salinity for coral and seagrass, NO3, PO4 and H2S. 9. Dunca A.M. 2018. Water pollution and water qual-
It became a concern that most of the parameters ity assessment of major transboundary rivers from
exceeded the quality standards for marine biota Banat (Romania). Journal of Chemistry, 2018, 1–8.
such as pH, salinity, DO, NO3, PO4 and H2S pa- 10. Fabry V.J., Seibel B.A., Feely R.A., Orr J.C. 2008.
rameters. This condition is becoming an issue Impact of ocean acidification on marine fauna and
because NO3, PO4 and H2S are environmental pa- ecosystem processed. University of Rhode Island,
rameters that contain element nutrients which can Kingston.
lead to eutrophication in the water. 11. Hamuna B., Paulangan Y.P., Dimara L. 2015. Study
On the basis of the results of the pollution in- of sea surface temperature using Aqua-MODIS sat-
ellite data in Jayapura waters, Papua. Depik, 4(3),
dex calculation, the Mimika waters are classified
160–167. (in Indonesian)
as lightly polluted to moderately polluted with
12. Hamuna B., Tanjung R.H.P., Suwito, Maury H.K.
pollution index values of 3.51 to 6.95. The wa-
2018. Study of sea water quality and pollution in-
ters of Keakwa and Pomako ware categorized as dex based on physical-chemical parameters in De-
lightly polluted, while the waters of Moga, Puriri, papre District waters, Jayapura. Jurnal Ilmu Ling-
Inaoga and Atuka are moderately polluted. It can kungan, 16(1), 35–43. (in Indonesian)
be concluded that using the water pollution index 13. Herlisman, Tubalawony S., Ramdhan M., Talakua
can provide information on water quality such as B.F. 2010. Physical oceanography. Chapter II in
the level of water pollution. ATSEA Cruise Report, 2nd Edition, in S. Wiras-
93Journal of Ecological Engineering Vol. 20(2), 2019
antosa, T. Wagey, S. Nurhakim and D. Nugroho of coastal waters quality in fisheries industry area,
(eds.). ATSEA Program. Pengambengan Village, Negara District, Jembrana
14. Ilahude A.G., Hortle K., Kusmanto E., Amirud- Regency. Ecotrophic, 3(2), 98–103. (in Indonesian).
din. 2004. Oceanography of coastal and riverine 24. Pranowo W.S., Wirasantosa S., Amri S.N., Dewi
waters around Timika, West Central Irian Jaya, L.C., Ratnawati H.I., Ati R.N.A., Prihantono J.,
Arafura Sea. Continental Shelf Research, 24(19), Makarim S., Hutahean A.A. 2013. Characteristics
2511–2520. of Arafura marine resources and southwest coast of
15. Indonesia Forest and Climate Support (IFACS). Papua. Research and Development Center for Ma-
2014. Landscape Conservation Plan for Mimika rine and Coastal Resources, Ministry of Maritime
District, Papua Province. USAID-Indonesia Forest Affairs and Fisheries, Jakarta. (in Indonesian).
and Climate Support, Indonesia. (in Indonesian). 25. Romimohtarto K., Juwana S. 2001. Marine biol-
16. Mackereth F.J.H., Heron J., Talling J.F. 1989. Water ogy: Science about marine biota. Puslitbang Os-
analysis. Fresh Water Biological Association, UK. eanologi LIPI, Jakarta. (in Indonesian).
17. Minister of Environment. 2003. Decree of the 26. Salmin. 2005. Dissolved oxygen (DO) and biologi-
Minister of Environment No. 51 year 2004 about cal oxygen demand (BOD) as indicator to deter-
Guidelines on Water Quality Status Determination. mine water quality. Oseana, 30(3), 21–26. (in In-
Minister of Environment of the Republic Of Indo- donesian).
nesia, Jakarta. (In Indonesian). 27. Suryono C.A., Rochaddi B. 2013. Connectivity
18. Minister of Environment. 2004. Decree of the Min- heavy metals in shallow groundwater, sediment
ister of Environment No. 51 year 2004 about Water and seawater in coastal area. Ilmu Kelautan, 18(2),
Quality Standard for Coastal water. Minister of En- 91–96. (in Indonesian).
vironment of the Republic Of Indonesia, Jakarta. 28. Swingle H.S. 1967. Standardization of chemical
(In Indonesian). analysis for water and pond muds. FAO Fish Rep.,
19. Murtini J.T., Ariyani F., Wahyuni I.S., Hak N., 4(44), 397–421.
Suherman M., Dolaria N., Nurwiyanto. 2001. In- 29. Tjahjono A., Bambang A.N., Anggoro S. 2017.
ventory research and identification of heavy metal Analysis of heavy metal content of Pb in ballast
pollution in waters and fish. Technical Report. water tank of commercial vessels in port of Tan-
Pusat Riset Pengolahan Produk dan Bioteknologi jung Emas Semarang, Central Java Province. Jour-
Kelautan dan Perikanan. Jakarta. (in Indonesian). nal of Ecological Engineering, 18(2), 7–11.
20. Nemerow N.L. Sumitomo H. 1970. Benefts of wa- 30. Tjahjono A., Suwarno D. 2018. The spatial distri-
ter quality enhancement. Report no. 16110 DAJ, bution of heavy metal lead and cadmium pollution
prepared for the U.S. Environmental Protection and coliform abundance of waters and surface sed-
Agency. iment in Demak. Journal of Ecological Engineer-
21. Pescond M.B. 1973. Investigation of rational ef- ing, 19(4), 43–54.
fluent and stream standard for tropical countries. 31. Tupan C.I., Uneputty P.A. 2017. Concentration of
Asian Institute Technology, Bangkok. heavy metals lead (Pb) and cadmium (Cd) in wa-
22. Popovic N.Z., Diknic J.A., Atlagic J.Z.C., Rakovic ter, sediment and seagrass Thalassia hemprichii
M.J., Marinkovis N.S., Tubic B.P., Paunovic M.M. in Ambon Island waters. AACL Bioflux, 10(6),
2016. Application of the water pollution index in 1610–1617.
the assessment of the ecological status of rivers: a 32. Widiadmoko W. 2013. Physical and chemical wa-
case study of the Sava River, Serbia. Acta Zoolog- ter quality monitoring in Hurun Bay waters. Balai
ica Bulgarica, 68(1), 97–102. Besar Pengembangan Budidaya Laut (BBPBL)
23. Poppo A., Mahendra M.S., Sundra I.K. 2012. Study Lampung, Bandar Lampung. (in Indonesian).
94You can also read