WELLHEAD PROTECTION: "Keeping Public Water Safe" Brian Williams Minnesota Department of Agriculture 507-665-6806
←
→
Page content transcription
If your browser does not render page correctly, please read the page content below
WELLHEAD PROTECTION:
“Keeping Public Water Safe”

     Brian Williams
 Minnesota Department of
       Agriculture
      507-665-6806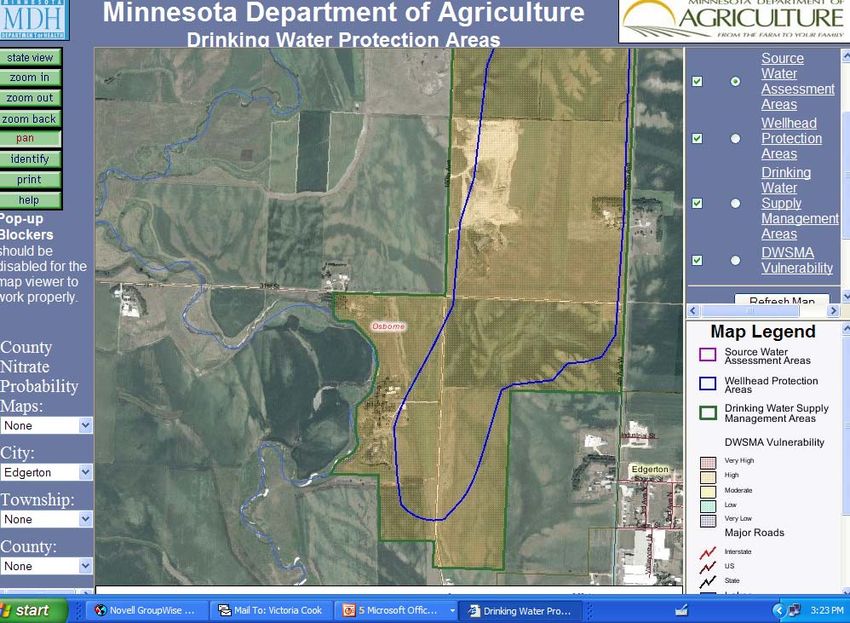
What is Wellhead Protection?
z   IT’S ALL ABOUT
    PREVENTION !

z   Preventing contaminants that
    can adversely affect human
    health from entering a public
    water supply and the aquifer
    supplying water to the well(s)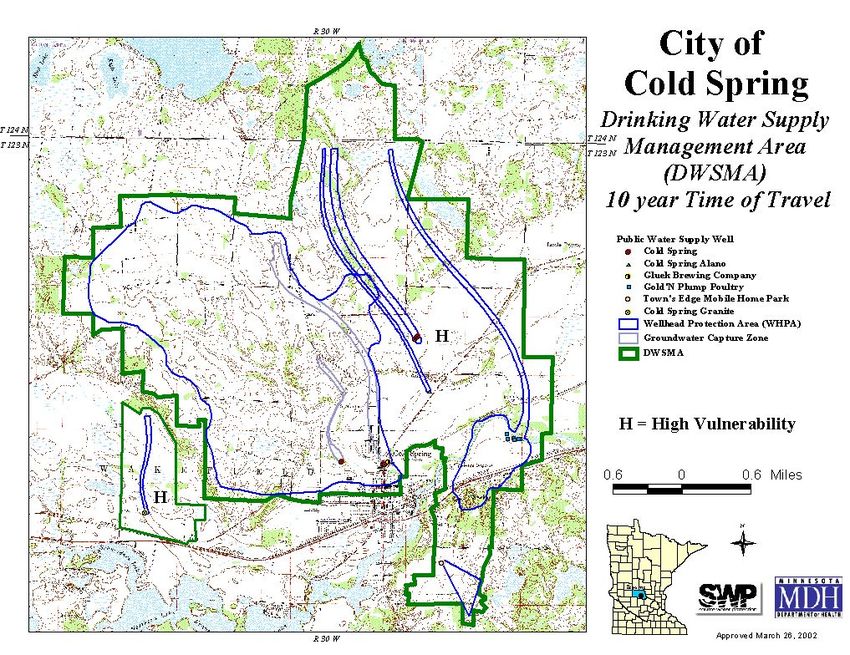
WELLHEAD PROTECTION
       A HISTORIC PERSPECTIVE
 JAMESTOWN’S SOURCE WATER PROTECTION PROGRAM

                THE PROCLAMATION
“There shall be no man or woman dare to wash any unclean
 linen, wash clothes...nor rinse or make clean any kettle, pot
 or pan, or any suchlike vessel within twenty feet of the old
 well or new pump. Nor shall anyone aforesaid within less
 than a quarter mile of the fort, dare to do the necessities of
 nature, since by these unmanly, slothful, and loathsome
 immodesties, the whole fort may be choked and poisoned.”
                                 Governor Gage
                                    1610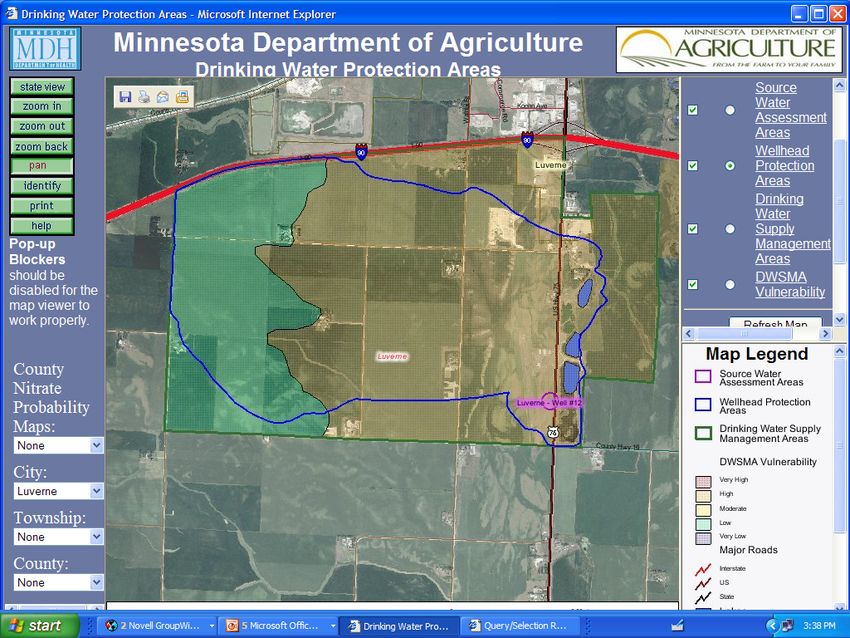
Why emphasize prevention?
z   More effective and cost-efficient than clean-
    up, treatment or drilling a new well
    – Currently 6 public water suppliers with nitrate
      removal systems—expensive alternative
z   Large community investment in public water
    supply system
z   Protect public health from short-term or long-
    term effects from consuming contaminated
    drinking water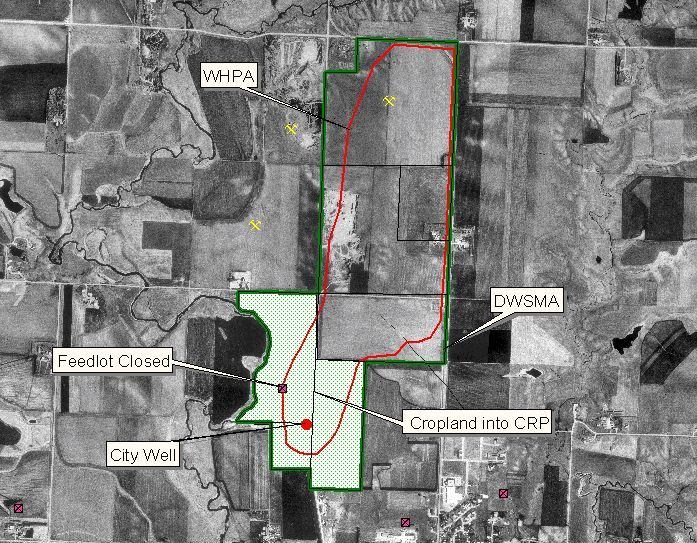
Wellhead Protection (WHP) History:
z   Mn. Dept. of Health—Source Water Protection Unit
    administers Wellhead Protection Program
z   1986 Federal Safe Drinking Water Act (SDWA):
    Amendments
    – required States to develop WHP Program & Processes
z   1996 Federal SDWA: Additional Amendments
    – Identify Source Water Protection Areas
z   1989 MN Groundwater Protection Act: Framework for
    protection efforts, rules.
z   1997 MN WHP Rule Approved—requiring public
    water suppliers to develop plans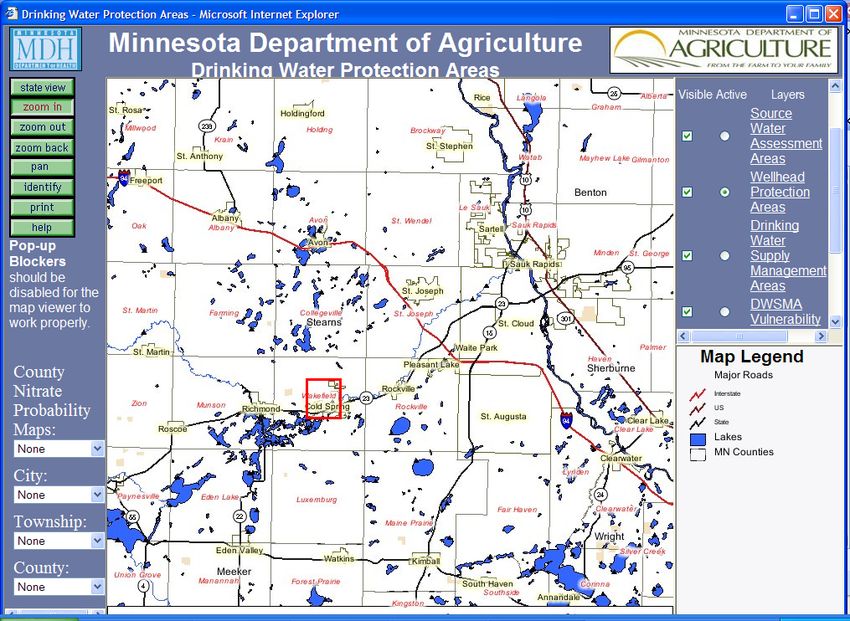
MDA’s Role
z   Work with the MN Dept. of Health
    – Provide technical assistance to public water
      suppliers where agricultural land use activities
      influence water quality
z   The Minnesota Department of Agriculture
    (MDA) is the lead state agency for all aspects
    of pesticide and fertilizer environmental and
    regulatory functions. Mn. Stat. Ch. 18B & 18C
    – A person may not store, handle, distribute, use, or
      dispose of a fertilizer or pesticide in a manner that
      that will cause unreasonable adverse effects on
      the environment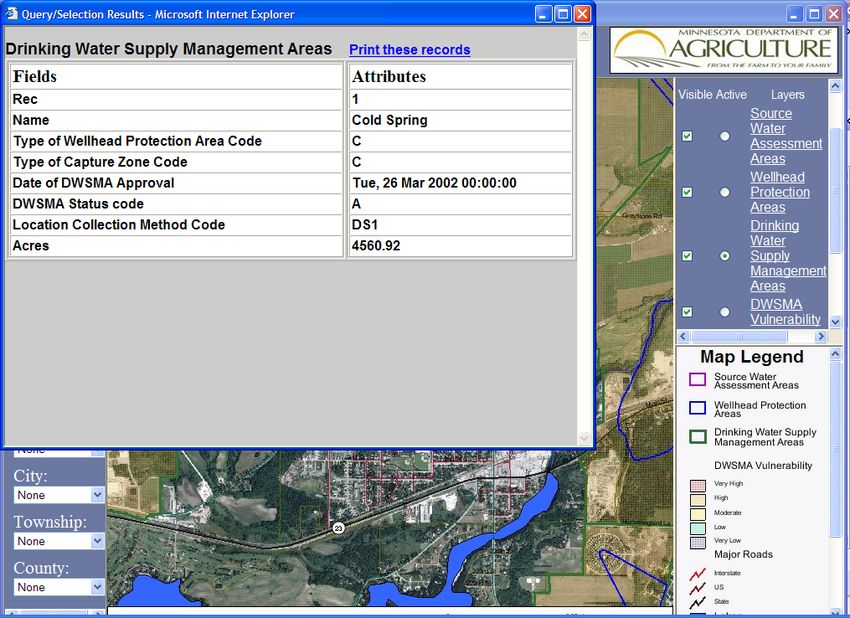
Nitrogen Management Plan
z   Minnesota Statute (1989). Chapter 326,
    Article 6, Section 33, Subdivision, 2b gave
    responsibility for the development of
    recommendations on a nitrogen fertilizer
    management plan for the prevention,
    evaluation and mitigation of non-point source
    occurrences of nitrogen fertilizer in waters of
    the State.
z   The nitrogen fertilizer management plan must
    include components promoting the
    prevention, and developing appropriate
    responses to, the detection of inorganic
    nitrogen from fertilizer sources in ground or
    surface water.
What is a public water supply
            well?

zA well that provides piped drinking
 water for human use to 15 or more
 service connections or to 25 or
 more people for at least 60 days
 per year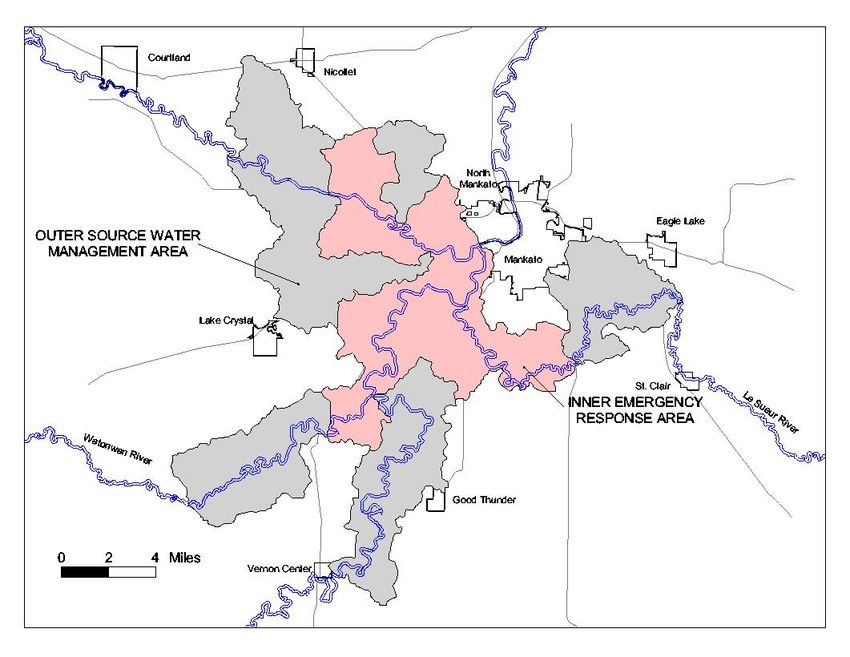
Public water supply wells include:
z   Community water supply wells, (970)
z   Non-community non-transient wells (562)
    – serve the same population on a regular
      basis (schools, factories, hospitals, day
      care centers)
z   Non-community transient wells (5978)
    – serve a temporary or transient population
      (churches, restaurants, parks,
      campgrounds)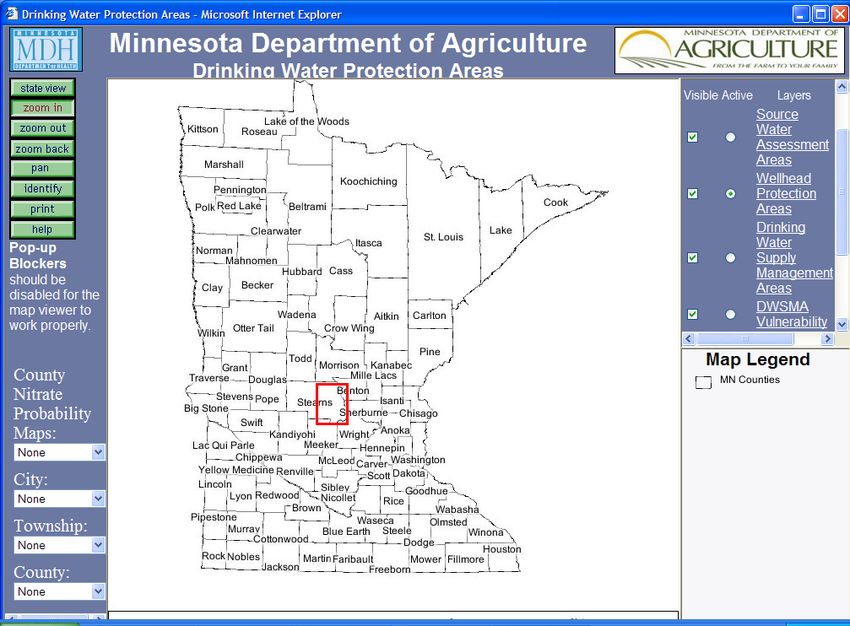
General Requirements of All Public
         Water Suppliers
z   200’ radius surrounding public water
    supply
     – Maintain isolation distances for
       potential sources of contamination
     – Monitor existing sources of
       contamination that do not comply
     – Implement protection measures for
       potential contaminant sources
Components of a Wellhead Protection Plan: Community & Non-Community—Non Transient z Appointing a Wellhead Protection Manager z Appointing a Wellhead Protection Planning group z Determining the Wellhead Protection Area WHPA (the area that will contribute water to the well[s] in the next ten years)
Wellhead Protection Area WHPA
z Surface and subsurface area surrounding a
  well that supplies water to the well
z Boundaries scientifically calculated
    – Time of Travel—minimum of 10 years
    – Flow Boundaries—geologic composition
    – Daily Volume Pumped
    – Groundwater Flow Field—direction & hydraulic
      gradient
    – Aquifer Transmissivity—ability of the aquifer to
      yield water
Wellhead
Protection Area
(366 acres)
Drinking Water
Supply Management
Area (545 acres)Components of a Wellhead Plan cont.
z Conducting an inventory of potential
contamination sources in the Wellhead
Protection Area
1.Transportation Corridors
2.Agricultural Land Uses
3.Commercial Land Uses
4.Residential Wells & Septics
5.Storm Water Run-off
6.Storage Tanks
7.Mining operations
z Develop map identifying potential sourcesComponents of a Wellhead Plan cont.
z Well vulnerability—An assessment of the
likelihood of contamination entering the well
based on:
– Unknown well construction
– Well water containing elevated nitrates,
pathogens, or other chemical compounds
– Well water containing traces of tritium
– Geological sensitivityWhat does “vulnerability” mean
and how does it impact WHP
Plan development?
z Vulnerable: All land uses considered in the
development
(agriculture, turf, tanks, septics, wells, etc.)
z Moderately Vulnerable:
Other wells and tanks
z Nonvulnerable:
Only consider other wellsVulnerable Public Water Supply Wells in Minnesota Photo courtesy of MDH
Percent of
wells
exceeding 3
mg/L.
MDH County
Well Index
nitrate results
summarized by
agroecoregion.

Photo courtesy of Dr.
Dave Mulla
Components of a Wellhead Plan cont.

 z   Define strategies for managing potential
     sources of contamination
     – 10 year implementation time frame
 z   Develop a plan for an alternative water
     supply in the event of contamination or
     mechanical failure
     (emergency plan)
Surface Drinking Water
Suppliers
How are they different from
groundwater systems?Surface Water Based Community
Public Water Supply Systems
z Aurora (mine pit) z Int’l Falls (Rainy R.)
z Beaver Bay L. Sup.) z Mankato (Blue Earth/Minn.
z Biwabik (mine pit) Rivers)
z Chisholm (mine pit) z McKinley (mine Pit)
z Duluth (L. Sup.) z Minneapolis (Miss. R.)
z E. Grand Forks (Red Lake z Moorhead (Red River)
River) z St. Cloud (Miss. R.)
z Ely (Burntside L.) z St. Paul (Miss R.)
z Eveleth (St. Mary’s L.) z Silver Bay (L. Sup.)
z Fairmont (Budd L.) z Thief River Fls, (Red Lk. R)
z Fergus Falls (Otter Tail R.) z Two Harbors (L Sup.)
z Grand Marais (L. Sup.) z Virginia (mine pit)
z Hoyt Lakes (Colby L.)Source Water Assessments for Surface
Water Systems
z Source Water Assessments identify an “inner
emergency response area.”
– This areas reflects the time needed to receive
notification & shut down an intake to respond to an acute
health risk in the event of a spill or toxic release
z An “outer management area” is also delineated
– protects water users from long term or chronic health
effects related to contaminates at low levels in the
surface water.
All surface water systems are vulnerable!!!!!7700 Square Miles
CITY OF MANKATO
                       Ranney Well 57’ Deep

76,500 Acres

                        36,500 Acres

                   GROUNDWATER UNDER
                   THE DIRECT INFLUENCE
                   OF SURFACE WATER
Source Water Assessments for Surface
Water Systems
z Only Source Water Assessments are required
by the Federal SDWA. Not protection plans.
z Most surface water systems are developing
management plans to protect their water supply
and intakes to proactively protect and prevent
the need for additional “expensive” treatment
options.
z St. Cloud, Minneapolis, and St. Paul have
obtained federal funds to complete a Source
Water Protection Plan for the Mississippi River.
(Little Falls to St. Anthony Falls)What are some common wellhead protection objectives? Tools for implementation.
Common Wellhead Plan Objectives
“Promote voluntary adoption of Best Management Practices”

z   Educational Activities & Demonstrations
z   Promote Nutrient Management Planning
z   Promote EQIP and other Conservation Practices
z   Promote Ag & Turf Best Management Practices
z   Other non-ag related activities
    –   Well sealing
    –   Septic systems
    –   Storm Water Runoff
    –   Storage Tanks
    –   Mining Operations
Examples of WHP Actions Steps
z Promoting alternative crops in most sensitive
areas.
– Perennial covers (CRP), alfalfa, sourgham-
sudangrass, small grains
– New varieties requiring less N—Altura potatoes
– Cover Crops—can absorb excess N
z Nutrient/Manure management planning
z Irrigation--Low pressure & scheduling
z Nitrogen rate, timing, & stabilized N
– Split application, side-dress, & fertigation
– Polymer coated urea & N-Serveor
f n
c es t io
e
ur t e c i t
s o o S n
e P r e b ti o
R d W te c
a g pro
e A r/
l l h f ate
e t . o s/w
W p n . u
D e e. m
. t at
Mn a.s
md
w .
wwPriority Concerns
Program
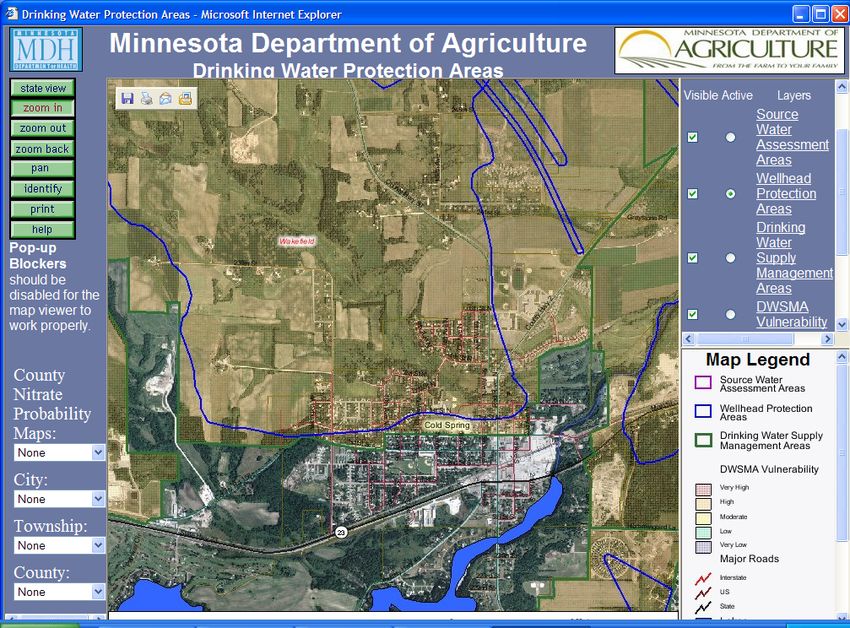
Program SponsorInteractive mapping program z Ability to view WHPA, DWSMA boundaries on aerial map. z Ability to view vulnerability & acres. z Enable ag professionals, farmers & others to identify land located within sensitive areas.
Low
                High
vulnerability
                vulnerability
(586 acres)
                (1639 acres)
Wellhead Protection Case Studies
Edgerton—population 1050

– Elevated nitrate levels ≈22 ppm
   z   Installation of nitrate removal system in 2002
   z   Construction costs of $368,000
– Shallow wells 21’ and 39’ depth
– Manure applications in close proximity to city wells
– Worked with farmer to change manure
  applications in sensitive areas
– Converted 47 acres to CRP
– Nitrate levels dropped to ≈ 8 ppm raw water
Current Land Use in Edgerton DWSMA
Case Study:
    St. Peter—population 10,358
z Seven supply wells 130’ to 670’ deep
z Increasing nitrate levels in Jordan
  aquifer
z City currently blends water from deeper
  wells to meet drinking water standards
z Two tile drainage ditches drain to
  course textured soils and infiltrate to
  aquifer
z Protection area covers 4600 acres
N itrate-N (m g /l)
-2
0
2
4
6
8
10
12
14
19
Fe 91
b
M -9 4
ay
Au -9 4
g
N o -9 4
v
J a - 94
n
A p - 95
r-
J u 95
l
O -9 5
ct -
J a 95
n
A p - 96
r-
J u 96
l
O -9 6
ct
J a - 96
n-
A p 97
r-
J u 97
l-
O 97
ct -
J a 97
n-
J u 98
n
M -9 8
ar
J u -9 9
Year
n
Se -9 9
p-
D e 99
c
M -9 9
ar
J u -0 0
City of St. Peter Drinking Water Wells
n
Se -0 0
p
Monthly Nitrate-Nitrogen Levels
D e - 00
c
M -0 0
ar
J u -0 1
n-
Se 0 1
p
D e - 01
c
M -0 1
ar
J u -0 2
n-
Se 0 2
p
D e - 02
Well # 9 (Jordan)
Well # 6 (Jordan)
c
M -0 2
ar
J u -0 3
n-
St. Julian (North Water Plant)
Se 0 3
Jefferson (South Water Plant)
p-
03Supply
Wells
Infiltration
Pond Tile Drainage
DitchesSt. Peter Case Study cont.
z N rates on large portion of protection area have
decreased 25 lbs. per acre past 2 years
z Since 90’s ave. yields increased by ≈40-50 bu.
/acre Farmers haven’t increased nitrogen
applications significantly.
– 1996 MDA FANMAP Survey concluded farmers applying
on average 154#/ N (corn-soy rotation)
z Large dairy operation—increased alfalfa acres &
manure nutrient source.
z City exploring upland treatment basins along with
storm water run-off—future developmentsCase Study:
Perham—population 2559
z Five supply wells 95-120 feet deep
z Deeper aquifers contain high levels of iron
z Course textured soils
z Irrigation
z High nitrogen requiring crops-corn, potatoes,
edible beans
z Nitrate levels sporadically reach safe drinking
water standards of 10 ppm
z Protection area covers 11,500 acresPerham Case Study cont.
z 10 year private well monitoring program
z Farming practice changes
– Nutrient management planning
– Altura potatoes—lower N requirement
– Polymer coated urea v.s. multiple UAN app.
– Cropping changes—alfalfa, sourgham
sudangrass, CRP
– City purchased land—converted grass cover
future development
z Education & outreachPerham Voluntary Private well
Sampling 1993-2005
20.0
N itrate-N Co n c.(m g /L)
15.0
10.0
5.0
0.0
93
94
96
97
99
02
05
0
3
\0
\0
4\
9\
5\
9\
6\
5\
5\
10
10
Sampling Dates 721 SamplesNitrogen Suction Lysimeter Data near Perham
Potato 2000, Soy Beans 2001, Potato 2002, Alfalfa 2003, Alfalfa 2004
100.0
Linear (AVG.)
80.0
Soy Beans 2001 Altura
P a r ts p e r M illio n
N itr a te N itr o g e n
60.0 Potato 2002
Alfalfa 2003 Alfalfa 2004
40.0
Alfalfa 2005
Burbank
20.0 Potato
0.0 2000
-20.0
9 /2 /0 0
5 /2 /0 2
9 /1 /0 4
/0 5
6 /2 /00
8 /4 0
5 /1 0
7 /25 /01
1 2 4 /01
9 /4 2
6 /2 /03
7 /3 3
1 0 1 /03
4
8 /1 5
6 / 1 /0 1
6 /9/0 3
6 /0
0 /0
9 /0
6 /0
0 /0
0 /0
6
0
/1 8
/2 4
5 /1
6 /2
Sampling DatesNitrate-N in Soil Solution (mg/L)
5/
12
0.0
5.0
10.0
15.0
20.0
25.0
30.0
35.0
40.0
5/ /20
1 9 05
5/ /20
2 6 05
/2
6/ 0 0
2/ 5
2
6/ 00
9/ 5
6/ 2 0
16 05
6/ /20
Altura
2 3 05
6/ /20
3 0 05
/2
7/ 0 0
7/ 5
7/ 20
14 05
7/ /20
2 1 05
7/ /20
2 8 05
/2
Altura Potatoes Perham
8/ 0 0
4/ 5
8/ 200
11 5
8/ /20
Nitrate Losses—Russet Burbank v.s.
1 8 05
Russet
8/ /20
Burbank
2 5 05
/2
00
5Community Water Suppliers Currently
Responding to Nitrate Problems
Park Rapids
Cold Spring
Perham St. Peter
Lincoln Pipestone Hastings
Rural Water System
Edgerton, Ellsworth,
Luverne, Adrian,
FuldaCity of Hastings Water Quality
z Supply wells 300-400’ deep
z Well #3 Shut down summer of 2005
– Cyanizine (Bladex) levels exceeded safe
drinking water standards
– Nitrate levels neared safe drinking water
standards (10 ppm)
z 4 test wells drilled in past 2 years
– 2 exceeded 10 ppm safe drinking water
standards—other 2 with elevated levelsCity of Cold Spring Water Quality
z Well # 2 shut down sporadically due to high
nitrates
z 3 new wells drilled in late 90’s & early 00’s
– increasing nitrate levels—
– increased from 3 ppm to 6 ppm
z Very rapid recharge—Water moves 1/4 -1/2
mile per year in narrow bands
z Increased pumping rate by city increases nitrate
concentration
z Large number of individual septic systems in
recharge areaAgriculture Considerations z Knowledge of “where” WHP and Source Water Protection Areas are z Already working with producers—be conscience of vulnerable protection areas. z Willingness to promote & support a variety of management tools and options z Support Wellhead Protection efforts in your community.
Agriculture Considerations

z   Wellhead Protection rely heavily on the
    adoption and implementation of
    “voluntary” BMP’s…..

z   Need Support & Involvement of
    Agricultural Professionals……….
Thank-you
Brian Williams
507-665-6806
brian.c.williams@state.mn.us
www.mda.state.mn.us/water/protectionNutrient Management Initiative
z Eligible counties south-central N BMP area
z Establish replicated strips comparing 2 rates of
nitrogen or phosphorus on farms
z Enable farmers to compare current N & P
nutrient management practices to NRCS
nutrient guidelines
z Provide educational information to assist
farmers with tailoring nutrient management
z To assist NRCS in adjusting future nutrient
management guidanceNutrient Management Initiative z No manure of alfalfa history for past 5 years z Only high and very high testing phosphorous fields are eligible z Farmer must work with a Certified Crop Adviser: demonstration set-up, recommendations, recordkeeping, & harvest z Preferably no course textured soils
Nutrient Management Design
z Corn-soybeans or corn-corn rotations
z Minimize variables—keep all cropping
  practices identical except phosphorous or
  nitrogen applications
z Field uniformity desired—soil variability
  perpendicular to rows
Nutrient Management Design
z Soil test prior to participation
z Two rates—replicated 3 times
z Nitrogen sites require 100-200’—check
  with 0 N rate
z Strip size—minimum of 40’ wide by
  minimum of 600’ long
z Harvest—1 combine swath per 40’
z Weigh wagon—future yield monitor??
Nitrogen Design

0 Rate Strip
100’-200’ X 1
swath width
                    NRCS Nutrient Guidelines

                Normally Applied Application Rate

                    NRCS Nutrient Guidelines

                Normally Applied Application Rate

                    NRCS Nutrient Guidelines

                Normally Applied Application Rate

0 Rate Strip
100’-200’ X 1
swath width
Phosphorous Design
z High testing phosphorus soils
z Soil test >16 ppm Bray &/or 12 ppm Olsen
z Must keep N rate constant
NRCS Nutrient Guidelines
Normally Applied Application Rate
NRCS Nutrient Guidelines
Normally Applied Application Rate
NRCS Nutrient Guidelines
Normally Applied Application RateData Submittal
z Farmer works with CCA
z Cropping information submitted by July 1st
– Farmer receives $200 & CCA receives
$200
z Harvest information submitted by
December 1st
– Farmer receives $400 & CCA receives
$400Data Review z Farm results used as a pool of data z Farmers identity kept confidential z Farm Business Management review results and evaluate economics z Educational meetings to review outcomes
Nutrient Management Initiative
          Information

www.mda.state.mn.us/nmi
   Program administered
 through Rural Advantage
    Fairmont, Minnesota
       507-238-5449
You can also read