Technology context and social media adoption among small and medium enterprises - IOPscience
←
→
Page content transcription
If your browser does not render page correctly, please read the page content below

Journal of Physics: Conference Series

PAPER • OPEN ACCESS

Technology context and social media adoption among small and
medium enterprises
To cite this article: Desi Ilona et al 2019 J. Phys.: Conf. Ser. 1339 012101

View the article online for updates and enhancements.

                                This content was downloaded from IP address 46.4.80.155 on 29/04/2021 at 20:55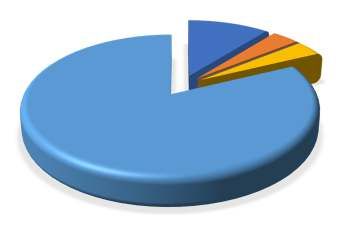
International Conference Computer Science and Engineering                                                       IOP Publishing
Journal of Physics: Conference Series           1339 (2019) 012101                        doi:10.1088/1742-6596/1339/1/012101

Technology context and social media adoption among small
and medium enterprises

                     Desi Ilona1, Zerni Melmusi1, Hanna Pratiwi1 and Zaitul2*
                     1
                         Universitas Putra Indonesia YPTK, Padang, Indonesia
                     2
                         Universitas Bung Hatta, Indonesia

                     zaitul@bunghatta.ac.id*

                     Abstract. This research paper aims to investigate the relationship between technology context
                     and social media adoption among small and medium enterprise. Technology-organization-
                     environment (TOE) is used to understand the relationship. Twenty-eight small and medium
                     enterprises operating in west Sumatra province (Indonesia) is as research samples. SEM-PLS is
                     applied to analyse the data. In this case, smart-pls is employed. It has two assessments:
                     measurement model and structural model assessment. The result shows that there is a positive
                     and significant relationship between technology context and social media adoption. This paper
                     has practical and theoretical implication and they are discussed in detail. Recommendation for
                     future work is also informed in this paper.

1. Background of the study
Small-medium enterprises (SMEs) have been contributing significantly to the country’s economic
development [1]. Reference [2] argue that SMEs became the centre of rotation of the economy in local
government in Indonesia. There are five benefits of SMEs for Indonesia economy that are owned by
local people, mainly agriculture based, labour intensive, financial operation from personal saving, and
mainly consumer goods [3]. Reference [1] add that there is almost 75% of employment in Indonesia
works in SMEs, and contributing enormously to country’s Gross Domestic Product (GDP). To gain the
survival and keep growing, SMEs have to fit with its environment. Due to changing in external business
environment, especially technology changes, SMEs must reformulate its competitiveness position and
come out with strategy. One of functional strategy is marketing strategy. Social media adoption is one
of marketing strategy to keep survival and growing for small and medium enterprise.
   Social media refers to using real time feedback, exchanging user-generated content and building
communities of consumers to support business process [4]. Reference [5] argue that social media
adoption by business organization can enhance the business operation, customer support, research and
development, and sales and marketing. There are several previous studies investigating the role of social
media to boost the SMEs’s performance [6]–[13]. Reference [12] develop a framework of social media
adoption readiness among SMEs. Reference [7] interview SMEs owners/managers in UAE regarding to
adoption of social media. They conclude that SMEs use social media, such as Facebook, Twitter, and
Instagram. It will increases their performance. Reference [6] carried out a survey to explore factors

              Content from this work may be used under the terms of the Creative Commons Attribution 3.0 licence. Any further distribution
              of this work must maintain attribution to the author(s) and the title of the work, journal citation and DOI.
Published under licence by IOP Publishing Ltd                          1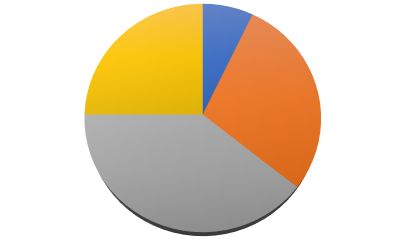
International Conference Computer Science and Engineering                                  IOP Publishing
Journal of Physics: Conference Series           1339 (2019) 012101   doi:10.1088/1742-6596/1339/1/012101

affecting the social media adoption among UAE’s SMEs and its impact on SMEs performance.
Reference [9] investigated the factors influencing the Facebook usage among SMEs in Malaysia. They
find that by using Facebook for SMEs’s business will impact on business performance. Reference [8]
studies the effect of internet-based social media on SMEs’s competitive advantage in Gulf Cooperation
Council (GCC) countries. Reference [13] perform a similar survey to establish the effect of social media
on SMEs’s growth in Nairobi. Reference [10] study the use and measurement of social media for
Scottish SMEs. Reference [11] conduct a series of interview regarding to the use of social media and
found that social media usage for building customer relationship, advertising and promotion,
information search, and branding.
    There is no prior study to investigate social media adoption using an Indonesia’s SMEs. Even though,
there is studies using SMEs in Indonesia [1]–[3], but they focus on other aspect of SME. For example,
reference [1] assess the Indonesia’s SMEs competitiveness. In addition, reference [2] identify the critical
success factor for downstream palm oil based SMEs. Finally, reference [3] describes three factor in
developing SMEs cluster in Indonesia: network, government role and network for cluster SMEs.
Besides, there is one study regarding to social media adoption among SMEs [14], but the study is
technical study in nature and qualitative approach. Therefore, there is a gap in the literature in term of
why Indonesia’s SME adopting social media. Thus, this study aims to investigate the effect of
technology context on social media adoption among SMEs in west Sumatra, Indonesia. Technology
context is suggested by technology-organization-environment (TOE) theory [15]. The theory suggests
that there is technology-environment and organization outcome relationship. In fact, reference [16] The
hypotheses of this study that is there is positive significant relationship between technology context and
social media adoption. Yet, [16]’s finding is not supported. Reference [6] also investigate the
relationship between technology context and social media adoption among SMEs in UAE and found the
consistent result with [16]. reference [17] investigate the effect of technology context on social media
adoption using Malaysia’s SMEs. They conclude that relative advantage and compatibility has
significant relationship with social media adoption. The effect of technology context on social media
adoption is not conclusive. Therefore, this study proposed the hypothesis that technology context has a
positive relationship with social media adoption. Further, the proposed conceptual model is as follow.

                   Technology                                               Social Media
                    Context                                                  Adoption

                                     Figure 1. Research Framework

2. Material and methods
This study uses SMEs owners or managers operating in west Sumatra province as research object.
Primary data is used and collected through online survey. There are two types of variable used here:
independent latent variable (technology context) and dependent latent variable (social media adoption).
Technology context refers to any technology that is either used by the organization, or that is available,
and is known to be potentially useful, but is not yet being used [18]. In this study, technology context
has twenty four items which are developed by several authors [19]–[22]. Social media adoption has five
items and adapt from [23]. Variables are measured by five-scale Likert ranging from strongly disagree
and strongly agree. Data is analysed using SEM-PLS due to the conditions relating to sample size,
normal distribution are not met [24], [25]. In smart-pls, there are two assessments to achieve the final
result that are measurement and structural model [26]. The measurement model assessment has two type
of validity test, that are convergent validity and discriminant validity [27]. Structural model assessment
is conducted for hypothesis testing [28]. Predictive relevance and power have to be assessed before
interpreting a path coefficient and p-value to decide to reject or accept the hypotheses.

                                                     2
International Conference Computer Science and Engineering IOP Publishing
Journal of Physics: Conference Series 1339 (2019) 012101 doi:10.1088/1742-6596/1339/1/012101
3. Result and Conclusion
3.1. Demographic Variables
Small and medium enterprises (SMEs) participated in this study is twenty-eight. Based on type of social
media adopted, eight small and medium enterprises are dominantly select WhatsApp to promote their
business and product/services. Eleven (39%) SMEs use an Instagram. Followed by seven (25%) SMEs
use Facebook. In addition, two SMEs do not provide us with information about type of social media
being used. According to number of workers are employed by SMEs, twenty-three (82%) SMEs have
workers less than ten workers. In addition, one SMEs have ten to fifty and greater hundred workers.
Three SMEs do not supply this type of data.
Social Media Adoption Number of Workers 51 to 100
worker…
NA; 3;
2; 7% 11% 10 to 50
7; 25% workers;
1; 4%
8; 29%
> 100
workers;
1; 3%
11; 39%
< 10
workers;
NA whatsapp istagram facebook 23; 82%
Figure 2. Type of social media adopted (dominated) and number of workers
3.2. Measurement Model Assessment
Measurement model assessment consists of two validity assessment that is convergent validity and
discriminant validity. Table 1 presents the result of convergent validity test. from outer loading, both
construct has outer loading greater than 0.700 [29] after deleting two items for social media adoption,
and four items for technology context. Second criteria for convergent validity test is assessing
Cronbach's Alpha and Composite Reliability. Its value must be greater than 0.700 [30]. In addition, final
assessment for convergent validity is average variance extracted (AVE) and its value must be greater
than 0.500 [30].
Table 1. Measurement Model Assessment: Convergent validity
Outer
Construct Items Loading Cronbach's Alpha Composite Reliability AVE
Social sma1 0.907
media sma3 0.882 0.982 0.983 0.738
adoption sma5 0.780
tcb1 0.853
tcb2 0.872
tcb3 0.722
tcb4 0.760
Technology
tco1 0.896 0.819 0.893 0.736
context
tco2 0.882
tco3 0.892
tco4 0.906
tco5 0.870
3International Conference Computer Science and Engineering IOP Publishing
Journal of Physics: Conference Series 1339 (2019) 012101 doi:10.1088/1742-6596/1339/1/012101
tob1 0.916
tob2 0.790
tob3 0.889
tob4 0.902
tr1 0.893
tr3 0.928
tra1 0.847
tra2 0.868
tra3 0.831
tra4 0.792
tra5 0.838
tra6 0.859
The second assessment for model is structural model assessment. There are at least two criteria’s that
we have to evaluate: Fornell-Lacker criterion and cross-loading [31], [32]. Table 2 provides the result
of Fornell-Lacker criterion. It can be concluded that measurement model has better discriminant validity
due to the value of square AVE for construct social media adoption (bold, 0.859) is greater than
correlation coefficient between social media adoption and technology context (0.647) [31].
Table 2. Discriminant validity-Fornell-Lacker Criterion
Construct Social Media Adoption Technology Context
Social media adoption 0,859
Technology context 0,647 0,858
Second assessment for discriminant validity is cross-loading. Table 3 shows the result of cross
loading. Loading of items for social media adoption (sma1, sma3, and sma4) is higher than loading on
other construct (technology context). Therefore, both constructs have achieved the discriminant validity
requirement.
Table 3. Discriminant Validity-Cross Loading
Items Social Media Adoption Technology Context
sma1 0.907 0.511
sma3 0.882 0.613
sma5 0.780 0.530
tcb1 0.461 0.853
tcb2 0.573 0.872
tcb3 0.358 0.722
tcb4 0.364 0.760
tco1 0.570 0.896
tco2 0.580 0.882
tco4 0.530 0.906
tco5 0.692 0.870
tob1 0.568 0.916
tob2 0.444 0.790
tob3 0.658 0.889
tob4 0.476 0.902
tr1 0.611 0.893
tr3 0.596 0.928
tra1 0.623 0.847
tra2 0.584 0.868
4International Conference Computer Science and Engineering IOP Publishing
Journal of Physics: Conference Series 1339 (2019) 012101 doi:10.1088/1742-6596/1339/1/012101
tra3 0.571 0.831
tra4 0.493 0.792
tra5 0.612 0.838
tra6 0.510 0.859
3.3. Structural model assessment
Second assessment using smart-pls is structural model assessment. This assessment begins with
evaluating the predictive relevance and predictive power. It continues to the hypothesis testing by using
the path coefficient and P value [33]. the structural model has medium predictive relevance [34] and
moderate predictive power [24].
Table 4. Assessment of Structural Model
Endogenous Construct Q square Decision R square Decision
Social media adoption 0.268 Medium 0.419 Moderate
Relationship Path coef. t statistic P-value Decision
Technology context -> social media adoption 0.647 8.756 0.000 Supported
Based on the result of t statistic, we can conclude that technology context has a positive relationship with the
social media adoption among SME (p-value= 0.000, β=0.647). This finding is supported by previous
research [17]. However, this result is not consistent compared to finding of [16]. Figure 2 provides us
with structural model. Social media adoption is relatively low (means=2.76). Social media adoption is
due to the perceived relative advantage, compatibility, complexity, trialability, and observability of
social media. SMEs manager/owner believe that they will gain some benefit because adopt the social
media. The benefit could be in term of business performance, financial gain and competitive advantage.
Social media adoption by SMEs are due to fitness of social media with its business process, including
with its suppliers and customers. Besides, social media adoption by SMEs is also perceived as something
which is not complex and applicable to their current business. In addition, SMEs perceive that social
media is easy to try and observe it.
Figure 3. Structural model
Note: latent variable 1 and 2 are technology context and social media adoption respectively
5International Conference Computer Science and Engineering IOP Publishing
Journal of Physics: Conference Series 1339 (2019) 012101 doi:10.1088/1742-6596/1339/1/012101
4. Conclusion and recommendation
Business environment has been changing over the time. In strategic perspective, technology is one of
external environment factors (PEST) that have to be monitored their changes. This technology changes
influence the way the business to be managed. It is usually an input in strategy formulation. In addition,
technology should be accommodated into strategy, including in functional management, such as
marketing. Social media is derived from digital marketing strategy. Social media adoption among large
company has been explored. However, lack of prior study uses SMEs in Indonesia’s case. The result
shows that social media adoption is determined by technology context. Due to technology advantage,
compatibility, complexity, trialability and observability, SMEs tend to adopt the social media as a
strategic tool to gain the competitive advantage. This finding contributes to the technology-organization-
environment (TOE) model [15]. Practically, this finding can be used by SMEs owners/managers or other
stakeholders to increase the social media adoption among SMEs. The SMEs stakeholders, such as local
government, can increase the awareness of the important of a technology. This effort will change the
attitude of SMEs owners/managers toward technology. If they have a positive attitude toward
technology, they will tend to accept or adopt that technology. Our finding in this article is subject to a
least three limitations. First, this study uses a limited number SMEs. Second, this study investigates the
social media adoption for only one variable. Finally, this study sees the social media adoption from one
perspective (TOE). Future research should therefore concentrate on investigation of social media
adoption by adding other variables from other perspective. Besides, further investigation also can widen
the number of SMEs participating in research.
References
[1] Anton SA, Muzakan I, Muhammad WF, Syamsudin, Sidiq NP. An Assessment of SME Competitiveness in
Indonesia. J Compet. 2015;7(2):60–74.
[2] Muda I, Sihombing M, Jumilawati E, Dharsuky A. Ciritical succes factors downstream palm oil based small
and medium enterprises (SME) in Indonesia. IJER. 2016;13(8):3531–8.
[3] Tambunan T. Export-oriented small and medium industry clusters in Indonesia. J Enterprising Communities
People Places Glob Econ. 2009;3(1):25–58.
[4] Constantinides E, Fountain SJ. Web 2 . 0 : Conceptual foundations and marketing issues. J Direct, Data Digit
Mark Pract January. 2008;9(3):231–44
[5] Bernoff J, Li C. Harnessing the power of the oh-so-social web. MIT Sloan Manag Rev. 2008;49(3):36–42.
[6] Ahmad SZ, Bakar ARA, Ahmad N. Social media adoption and its impact on firm performance : the case of
the UAE. Int J Entrep Behav Res. 2018;25(1):84–111..
[7] Ahmad SZ, Ahmad N, Bakar ARA. Reflections of entrepreneurs of small and medium-sized enterprises
concerning the adoption of social media and its impact on performance outcomes : Evidence from the UAE.
Telemat Informatics [Internet]. 2018;35:6–17.
[8] Bakri AA Al. The impact of social media adoption on competitive advantage in the small and medium
enterprises. Int J Bus Innov Res. 2017;13(2):255–69.
[9] Ainin S, Parveen F, Moghavvemi S, Jaafar NI, Shuib NLM. Factors influencing the use of social media by
SMEs and its performance outcomes. Ind Manag Data Syst. 2015;115(3):570–88
[10] McCann M, Barlow A. Use and measurement of social media for SMEs. J Small Bus Enterp Dev.
2015;22(2):273–87.
[11] Parveen F, Jaafar NI, Ainin S. Social media usage and organizational performance : Reflections of Malaysian
social media managers. Telemat Informatics [Internet]. 2014;32(1):67–78. Available from:
http://dx.doi.org/10.1016/j.tele.2014.03.001.
[12] Abeysinghe G, Alsobhi AY. Social media readiness in small businesses. In: International Conference
Information Systems [Internet]. 2013. p. 267–72. Available from: http://eprints.mdx.ac.uk/ 11433.
[13] Jagongo A, Kinyua C. The Social Media and Entrepreneurship Growth ( A New Business Communication
Paradigm among SMEs in Nairobi ). Int J Humanit Soc Sci. 2013;3(10):213–27
[14] Sarosa S. Adoption of social media networks by Indonesian SME : A case study. Procedia Econ Financ
[Internet]. 2012;4:244–54. Available from: http://dx.doi.org/10.1016/S2212-5671(12)00339-5.
[15] Tornatzky, Fleischer M. The processes of technological innovation. Lexington, MA: Lexington Books; 1990.
[16] AlSharji A, Ahmad SZ, Bakar ARA. Understanding Social Media Adoption in SMEs : Empirical Evidence
from the United Arab Emirates. J Entrep Emerg Econ. 2018;10(2):302–28.
[17] Ahmad SZ, Bakar ARA, Faziharudean TM, Zaki KAM. An empirical study of factors affecting e-commerce
adoption among Small and Medium-sized enterprises in a developing country : evidence from Malaysia. Inf
6International Conference Computer Science and Engineering IOP Publishing
Journal of Physics: Conference Series 1339 (2019) 012101 doi:10.1088/1742-6596/1339/1/012101
Technol Dev. 2014
[18] Zhu K, Kraemer KL. Post-adoption variations in usage and value of e-business by organizations : cross-
country evidence from the retail industry. Inf Syst Res. 2005;16(1):61–84.
[19] Grandon EE, Pearson JM. Electronic commerce adoption : an empirical study of small and medium US
businesses. Inf Manag. 2004;42:197–216.
[20] Al-qirim N. The adoption of eCommerce communications and applications technologies in small businesses
in New Zealand. Electron Commer Res Appl. 2007;6:462–73.
[21] Lorenzo-romero C, Constantinides E, Brünink LA. Co-Creation : Customer Integration in Social Media
Based Product and Service Development. Procedia - Soc Behav Sci [Internet]. 2014;148:383–96. Available
from: http://dx.doi.org/10.1016/j.sbspro.2014.07.057
[22] Tan KS, Chong SC, Lin B, Eze UC. Internet-based ICT adoption : Evidence from Malaysian SMEs. Ind
Manag Data Syst. 2009;109(2):224–44.
[23] Cesaroni FM, Consoli D. Are small businesses really able to take advantage of social media ? Electron J
Knowl Manag. 2015;14(4):257–68
[24] Chin W. The partial least squares approach to structural equation modeling in G. A. Marcoulides (Ed.). In:
Modern methods for business research. London: Lawrence Erlbaum Associates; 1998. p. 295–236.
[25] Chin WW, Newsted PR. Structural equation modeling analysis with small samples using partial least squares.
In: R. H. Hoyle (Ed.), Statistical strategies for small sample research (pp. 307 – 342). In: Structural equation
modeling analysis with small samples using partial least squares In: R H Hoyle (Ed), Statistical strategies for
small sample research. Thousand Oaks, CA: SAGE; 1999. p. 307–42.
[26] Hair JF, Hult GTM, Ringle CM, Sarstedt M. A primer on partial least squares structural equation modeling
(PLS-SEM). Los Angeles: SAGE Publication; 2017. 390
[27] Vinzi VE, Chin WW, Henseler J, Wang H. Handbook of Partial Least Square: Concepts, Methods and
Applications. Berlin, German: Springer; 2010. 791.
[28] Wong KK. Partial Least Squares Structural Equation Modeling ( PLS-SEM ) Techniques Using SmartPLS.
Mark Bull. 2013;24:1–32.
[29] Hulland J. Use of partial least square (PLS) in strategic management research: a review of four recent studies.
Strateg Manag J. 1999;20:195–204
[30] Bagozzi RR, Yi Y. On the Evaluation of Structural Equation Models. J Acad Mark Sci. 1988;16(1):74–94.
[31] Fornell C, Larcker DF. Structural Equation Models with Unobservable Variables and Measurement Error:
Algebra and Statistics. J Mark Res [Internet]. 1981;18(3):382. Available from:
http://www.jstor.org/stable/3150980?origin=crossref
.[32] Henseler J, Ringle CM, Sarstedt M. A new criterion for assessing discriminant validity in variance-based
structural equation modeling. J Acad Mark Sci. 2015;43:115–35.
[33] Hair J, Sarstedt M, Hopkins L, G. Kuppelwieser V. Partial least squares structural equation modeling (PLS-
SEM)-An Emerging Tool in Business Resarch. Eur Bus Rev. 2014.
[34] Henseler J, Ringle CM, Sinkovics RR. The use of partial least squares path modeling in international in
international marketing. Adv Int Mark. 2009;20:277–319
7You can also read