EXPLORING CONGESTION PRICING FOR THE REGION - METRO REGIONAL CONGESTION PRICING STUDY
←
→
Page content transcription
If your browser does not render page correctly, please read the page content below
METRO REGIONAL CONGESTION
PRICING STUDY

EXPLORING
CONGESTION
PRICING FOR
THE REGION
AUGUST 2020

3

  WHAT IS THIS STUDY?

The Metro Regional Congestion Pricing
                                                    Congestion pricing was
Study is exploring whether congestion
pricing can benefit the Portland metro
                                                    identified in the RTP as a
region. Metro is looking at many different          high impact strategy
pricing tools to understand how pricing
could support an equitable, safe and                Four RTP goals will be used to evaluate the
                                                    pricing scenarios:
sustainable transportation system.
                                                      EQUITY                        SAFETY
Congestion pricing was documented                     Reduce disparity              Getting to Vision Zero
as a high priority, high impact strategy
in the 2018 Regional Transportation
Plan (RTP). A range of scenarios testing
different congestion pricing tools will               CLIMATE SMART                 CONGESTION
                                                      Reduce emissions              Reduce traffic
help Metro understand if pricing can
help the region meet four of the goals set
out in the RTP.

What is Metro’s timeline?
The study is planned to take about 18 months with findings released in early 2021. Leaders around
the region may use these findings to inform policies and other transportation projects such
as Oregon Department of Transportation’s (ODOT) I-5 and I-205 Tolling Project and Portland’s
Pricing Options for Equitable Mobility (POEM). The findings may also provide information for
policymakers who want to propose new congestion pricing projects at the local level.

   2019     2020                                                                            2021

     PROJECT            EXISTING              SCENARIO              SCENARIO                    NEXT
    START-UP           CONDITIONS            DEFINITION             ANALYSIS                    STEPS
   SUMMER 2019 -         WINTER 2020 -        SPRING 2020 -         SUMMER 2020 -              EARLY 2021
    WINTER 2020          SPRING 2020          SUMMER 2020             LATE 2020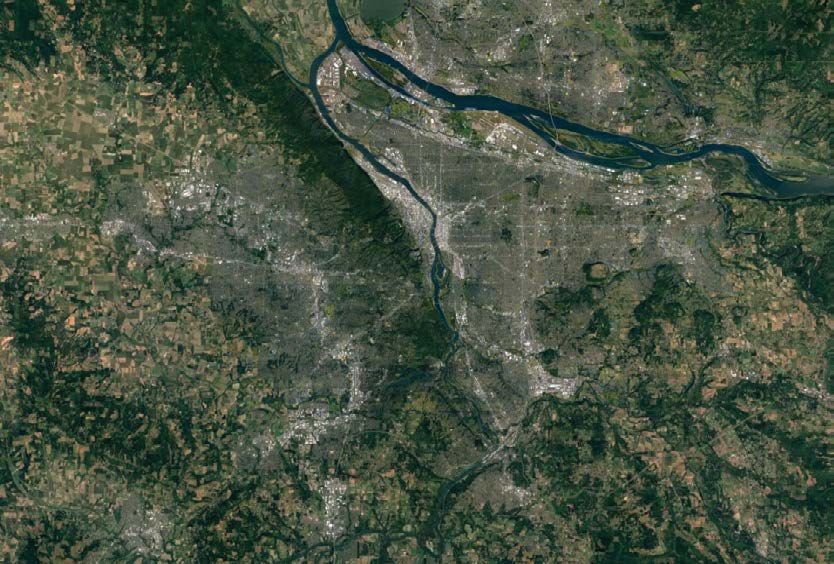
4
32323636+018+ 0+ 1830+ 30
Why this study?
Congestion is a problem in the Portland metro region. Changing travel patterns and a growing
population mean more traffic and less freedom to travel reliably around the region. Congestion
also has devastating economic, social and environmental impacts.
The region Portland metro is the In 2019, people in the
expects 8th most congested Portland metro region spent
600,000 new region in the country. 89 hours stuck in traffic.
++ ++ ++ ++
residents Source: 2019 Inrix Global Source: 2019 Inrix Global Scorecard
and 350,000 Scorecard
89 =
new jobs by 1 BOSTON
+$1-2
�� �
2040. 2 CHICAGO
�� �
Source: 2018 RTP 3 PHILADELPHIA
HRS
$1,300
MILLION 4 NEW YORK CITY
5 WASHINGTON, DC
Due to increasing
+$1-2
+$1-2
6 LOS ANGELES
3236+0+03618+ ��
+018+ 30
congestion, TriMet 7 SAN FRANCISCO
must add service each 8 PORTLAND PER
MILLION 9 BALTIMORE PERSON
year to get residents
and employees to their
MILLION 10 ATLANTA
destinations on time.
3030 � 3236+018+ 30
Source: 2018 City of Portland
Enhanced Transit Corridors
Plan
Congestion
got 10% worse 2018
between 2018
+ + of the region’s
and 2019.
Source: 2019 Inrix
2019
���
residents think Global Scorecard
congestion
76%
++
is a serious TRA
problem. % NS
PO
Transportation
18
Source: 2019 Oregon
R accounts for over
RT
HE
Transportation Survey 40% of Multnomah
AT
OT
County’s
ION
ENTIAL 18%
greenhouse gas
+ +
Greenhouse
42%
emissions.
Gas Emissions
CONGESTION & Source: Multnomah County
2017 Carbon Emissions and
COVID-19
SID
Trends, Portland Bureau of
Planning and Sustainability
RE
With stay-at-home orders related to CO 2%
MMERCIAL 2
COVID-19, congestion in the Portland
metro region has declined significantly.
But as businesses reopen and the
region goes back to work, congestion In the Portland region, the 10 lowest
will return and may be worse if more income and 10 highest minority
people choose to drive. As income neighborhoods experience more
disparities and unemployment worsen, exposure to toxic air than the average
inequities in the transportation system
neighborhood.
will be more important than ever to
Source: 2012 Portland Air Toxics Solutions Committee
address. Report and Recommendations, Oregon Department
of Environmental Quality
5

The Cycle of Congestion

                                                                               PUBLIC
  ROADS FILL                                                                  PRESSURE
  WITH CARS                      CONGESTION                                  TO INCREASE
                                                                              ROADWAY
                                                                              CAPACITY

                    The Portland metro region can’t
                                                                                NEW
                                                                              CAPACITY
                                                                               ADDED

                     build its way out of congestion

                                   INDUCED
  MORE CARS                         TRAVEL                                    MOVEMENT
 ON THE ROAD                       DEMAND                                      IS EASIER
                                  DRIVERS CHANGE
                                     BEHAVIOR

What pricing strategies is Metro exploring?
Metro is exploring if and
                                     VEHICLE MILES TRAVELED FEE
how four congestion pricing
                                     Drivers pay a fee for every mile they travel
strategies can support the
region’s priorities to provide
an equitable transportation          CORDON PRICING
                                     Drivers pay to enter an area, like downtown Portland
system. Each of the pricing          (and sometimes pay to drive within that area)
strategies could vary by time
of day, by area, by types of
                                     CORRIDOR PRICING
drivers on the road and by           Drivers pay a fee to drive on a particular road, bridge
income levels.                       or highway

                                     PARKING PRICING
                                     Drivers pay to park in certain areas
6

WHY IS THE CURRENT
TRANSPORTATION SYSTEM
INEQUITABLE?
Transportation investments in the Portland metro region have a long history of contributing
to racial inequity and neighborhood displacement. Decades ago, public agencies planned
and built new highways that cut through Black communities, splitting neighborhoods
and contributing to poor air quality, noise pollution and safety issues. Recently, transit
investments have been made without complementary affordable housing strategies, leading to
gentrification and further displacement.

Today, while the region’s residents all feel the impacts of congestion, historic inequities in the

                                                                              ���
transportation system amplify impacts on people of color and low-income people:

  • Housing costs are increasing faster than              In the Portland                             +13%
    incomes, making travel distances longer for           region, average
                                                          commute
    people of color and low-income people.                times for Black
  • Communities of color and low-income                   commuters are
                                                          13% longer than
    communities have longer commutes, made                white commuters.
    slower and more unreliable when roadways
    are congested.
  • Major roads and freeways often run                                            The lowest income
    through communities of color and                                              households spend
                                                                                  35% of their income
    low-income communities, resulting
    in disproportionately high rates of air
    pollution and chronic illnesses.
                                                                  vs.             on transportation.
                                                                                  Those with the highest
                                                                                  income spend 13% or
                                                                                  less.
                                                                                  Source: U.S. Bureau of
                                                                                  Transportation Statistics

 FEDERAL, STATE AND LOCAL INFLATION AND             MOST REVENUES ARE SPENT   REMAINDER CAN BE SPENT ON
 GAS TAXES AND FEES       HIGH-EFFICIENCY VEHICLES ON PRESERVING AND          TRANSIT, BICYCLE AND
 PROVIDE REVENUE          SHRINK POTENTIAL REVENUES BUILDING STREETS          PEDESTRIAN PROJECTS
7

How can congestion pricing advance equity?
Congestion pricing strategies have the potential to enhance racial equity and benefit
historically marginalized communities (people of color, people with limited English proficiency
and people in poverty), as well as all residents of the region. This largely depends on how
people are charged and how revenue from congestion pricing strategies is spent.

                     AFFORDABILITY
                     Unlike sales taxes, fuel taxes and many other transportation funding
                     sources, congestion pricing programs can offer discounts, set caps
                     (the maximum amount that someone might need to pay), provide
                     rebates or fully exempt certain drivers based on income level or other
                     characteristics.

                     SAFER STREETS
                     Pricing revenues can be invested in enhanced bicycle and pedestrian
                     networks to improve street safety and provide benefits to historically
                     disadvantaged communities. Pricing can also decrease the number of
                     cars on the road, increasing safety for people walking and biking.

                     HEALTHIER COMMUNITIES
                     Pollution from cars and trucks is tied to increased rates of asthma, heart
                     disease and impaired lung function. In the Portland region, urban low-
                     income neighborhoods and communities of color are disproportionately
                     exposed to air pollution. Congestion pricing can help reduce traffic and
                     the associated health risks to these groups.

                     BETTER MOBILITY OPTIONS
                     Revenue from congestion pricing strategies can help to fund a variety of
                     mobility options, such as more transit service, roadway improvements
                     to make transit travel times more predictable, carpool and vanpool
                     programs and new mobility programs to increase choices for people who
                     spend more time in traffic.

                     PROGRAMS FOR SENIORS AND PEOPLE WITH DISABILITIES
                     Special programs for those with limited mobility can ensure that
                     seniors and people with disabilities can travel around the region. These
                     programs can be funded by revenues from congestion pricing.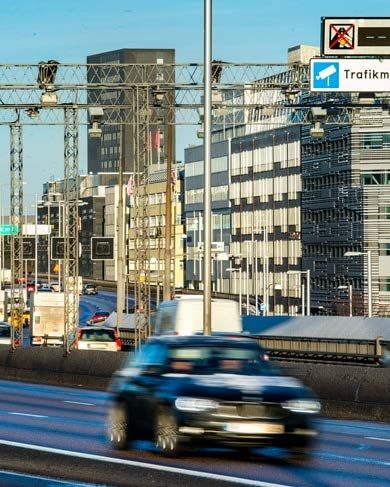
8

WHO ELSE PRICES?

This study will build on lessons learned from other cities to explore whether pricing makes
sense for the region. Many European cities have had congestion pricing programs in place
for decades, and major North American cities are now studying whether pricing could help
to ease their congested streets.

For cities that have implemented congestion pricing programs:
    • Their programs have built on aggressive transportation demand management
      programs, much like Metro’s Regional Travel Options program, which provides grants
      and supports efforts that increase walking, biking, ridesharing, telecommuting and
      public transit use.
    • The goals of congestion pricing programs are wide ranging—they are not just about
      reducing the number of vehicles on the road. They’re also focused on improving air
      quality and equity.
    • Most programs provide a revenue stream that funds transportation options and
      services. In many cases, this means significant increases in public transit investments
      that serve people of color and low-income people.
    • Public and business acceptance typically increases dramatically after implementation.

Congestion pricing programs in place or under study

                                             GOTHENBURG     STOCKHOLM
 VANCOUVER, BC                                LONDON
                   SEATTLE   CHICAGO
     PORTLAND                                             MILAN
 SAN FRANCISCO               DC   NYC        MADRID
                    LA
                             ATLANTA

                                                                             SINGAPORE

     IN PLACE
                                        BUENOS AIRES
     IN PLACE, BUT DELAYED
     UNDER STUDY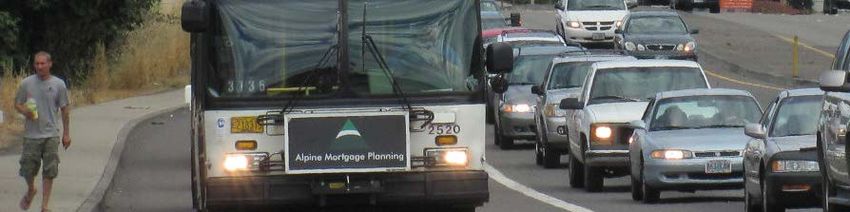
9

What benefits have
international cities seen?
STOCKHOLM
  • The congestion pricing program has reduced traffic by 22% and reduced
    greenhouse gas emissions by 14%. Source: SFCTA, Mobility, Access, and Pricing Study: Case
     Studies: Stockholm and London, 2010

  • Program revenues have funded 18 new regional bus lines and 2,800 new
    regional park-and-ride spaces. Source: SFCTA, Mobility, Access, and Pricing Study: Case Studies:
     Stockholm and London, 2010

  • After congestion pricing was implemented, the number of acute asthma
    cases in young children dropped by about 50%. Source: Simeonova, E, et al., Congestion
     Pricing, Air Pollution and Children’s Health, 2018

LONDON
  • Prior to congestion pricing, traffic in central London averaged 2-5 mph.
    Since implementation, the average traffic speed has increased to 10 mph.
     Source: SFCTA, Mobility, Access, and Pricing Study: Case Studies: Stockholm and London, 2010

  • London increased bus service in the pricing zone by 27%, adding more
    predictability and faster trips. As a result, bus ridership increased 38% in
    two years. Source: Congestion Charging Central London, Impacts Monitoring Second Annual Report, 2004

What can Metro learn from
North American studies?
NEW YORK CITY
In 2019, New York City implemented a congestion zone surcharge on for-hire
vehicles (like taxis, Uber and Lyft) in Manhattan as part of its phased approach
to pricing. Future phases, planned for implementation in 2021, include a
vehicle fee for crossing into a specified zone. A portion of the revenue will be
reinvested in the city’s subway system.

SAN FRANCISCO
In 2019, the San Francisco County Transportation Authority (SFCTA) began
to explore how a fee to drive downtown could achieve congestion, climate,
equity and safety goals. The study builds on a 2010 Study, which evaluated the
applicability of congestion pricing to San Francisco.

VANCOUVER B.C.
A 2018 study considered how congestion pricing could reduce traffic
congestion, promote fairness and support transportation investment. A second
phase of study is developing a more detailed approach to a pricing program.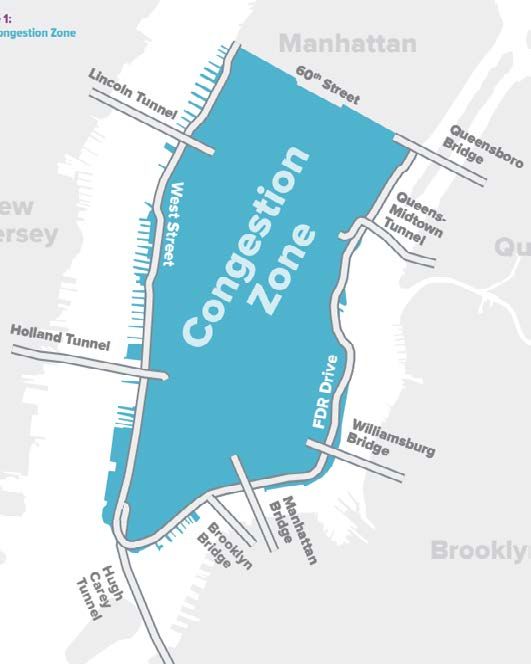
10

HOW DOES THIS RELATE TO
METRO’S PARTNERS’ WORK?

Metro, the ODOT, and the City of Portland are all working on projects that consider ways to
price transportation to address challenges related to equity, climate change, congestion, and
safety. Each agency makes decisions for different parts of our region’s transportation system.
Each has separate projects underway to help address issues specific to those geographies.
The three agencies are coordinating their efforts to leverage each other’s work, learn from one
another and share findings.
                                       CITY OF PORTLAND’S
METRO’S REGIONAL                       PRICING OPTIONS FOR
CONGESTION PRICING                     EQUITABLE MOBILITY                  ODOT’S I-5 AND I-205
STUDY                                  PROJECT                             TOLL PROJECTS

Metro is studying potential            Portland is studying                ODOT has identified
effects of congestion pricing          how pricing might                   segments of I-5 and I-205 for
for the entire Portland metro          produce a more equitable            future tolling.
region.                                transportation system within
                                       the City.

			 Metro’s Regional Congestion Pricing
			 Study
PROJECT ELEMENTS                                        PROJECT OUTCOMES
 • Conduct technical study of different pricing tools   • Technical papers on best practices, equity in
 • Coordinate with existing committees                    pricing, current transportation funding, and
   (Transportation Policy Alternatives Committee,         barriers to implementation
   Joint Policy Advisory Committee on Transportation,   • Report on performance of pricing tools
   and Metro Council) for guidance                      • Foundational understanding of whether pricing
 • Conduct transportation modeling and other              can work for the region to inform policy makers
   analyses                                             • Identification of needs for further study
 • Convene Expert Panel to review results
11
City of Portland’s Pricing Options for
Equitable Mobility (POEM) Project
POEM is exploring if and how new pricing strategies could be used in the City of Portland to improve mobility,
address the climate crisis, and advance equity for people historically underserved by the transportation
system. The project will consider pricing strategies that the City can implement itself and inform the City’s
participation in interjurisdictional conversations about pricing. Topics to explore include prices on parking,
commercial fleets and right-of-way access, tolling, cordons and congestion zones and vehicle miles traveled.
PROJECT ELEMENTS PROJECT OUTCOMES
• Convene a community Task Force • Inform the City’s transportation pricing policies
• Develop an Equitable Mobility Framework for and role in interjurisdictional pricing conversations
analyzing pricing strategies • Final report summarizing technical analysis, Task
• Explore conditions and complementary strategies Force recommendations, and City next steps
needed for making pricing equitable
2020 2021
DEVELOP
IDENTIFY EQUITY DEVELOP
EQUITABLE FINAL
PRICING ANALYSIS OF RECOMMEN-
MOBILITY REPORT
STRATEGIES STRATEGIES DATIONS
FRAMEWORK
ODOT’s I-5 and I-205 Toll Projects
ODOT is implementing tolls to both manage congestion and raise revenue on segments of I-205 and I-5,
as identified during the 2017-2018 Value Pricing Feasibility Analysis. ODOT is committed to using an equity
focus and has convened an Equity and Mobility Advisory Committee (EMAC) to provide recommendations
to the project team and the Oregon Transportation Commission (OTC). The Committee will adopt an equity
framework to make recommendations on I-205 and I-5 toll strategies to benefit communities that are
currently and historically underrepresented and underserved. The Region 1 Area Commission is also providing
recommendations to the OTC and toll team on the tolling program.
PROJECT ELEMENTS PROJECT OUTCOMES
• I-5 and I-205 toll project environmental review • Toll equity framework
• Equity and Mobility Advisory Committee • Selection of preferred alternatives for I-205 and I-5
• Toll implementation
2020 2021 2022 2023 2024
TOLL
I-205 NEPA I-5 NEPA I-5
ALTERN-
NEPA SYSTEMS I-205
PROCESS PROCESS PROCESS
ATIVES AND BACK TOLLING
BEGINS BEGINS REFINEMENT
BEGINS OFFICE BEGINS
DEVELOP-
MENT
EMACPhoto Credits Cover photo: Beth Nakamura via OregonLive Page 1: Jimmy_Scrambles via reddit Page 2: Robert Ashworth via Flickr Page 6: Nelson\Nygaard Page 8: Johnathan Chng via Unsplash Page 9 (top to bottom): Marcus Ericsson via The Local, Wikipedia Commons, Regional Plan Association, SFCTA, Mobility Pricing Independent Commission Page 10: Metro
You can also read