Annual Operations Plan Hunter Valley 2019-20 - WaterNSW
←
→
Page content transcription
If your browser does not render page correctly, please read the page content below
Annual Operations Plan Hunter Valley 2019-20
Acronym     Definition

                                                              AWD         Available Water
                                                                          Determination

Contents                                                      BLR         Basic Landholder Rights

                                                              BoM         Bureau of Meteorology

                                                              CWAP        Critical Water Advisory Panel
Introduction        			                                  2
   The Hunter River System				                           2    CWTAG       Critical Water Technical

   Regulated and unregulated system flow trends          3                Advisory Group

   Rainfall trends                                       3    DPI CDI     Department of Primary
                                                                          Industries - Combined
   Water users in the valley					                        4
                                                                          Drought Indicator

Water availability			                                    9    DPIE EES    Department of Planning,
                                                                          Industry and Environment
   Current drought conditions                            9
                                                                          - Environment, Energy &
   Glenbawn and Glennies Creek dams storages		           10
                                                                          Science
   Resource assessment                                   11
                                                              DPI         Department of Primary
                                                              Fisheries   Industries - Fisheries
Water resource forecast                                  13
                                                              DPIE        Department of Planning,
   Hunter Valley - past 24-month rainfall                13   Water       Industry and Environment -
   Glenbawn and Glennies Creek Dams - past 24-month                       Water
   inflows/statistical inflows                           14
                                                              FSL         Full Supply Level
   Three-month weather forecast                          14
                                                              HS          High Security
   Glenbawn and Glennies Creek Dams - storage forecast   15
                                                              IRG         Incident Response Guide

Annual operations                                        15   ISEPP       Infrastructure State
   Deliverability                                        15               Environmental Planning
                                                                          Policy

Critical dates                                           16   LGA         Local Government Areas

                                                              ROSCCo      River Operations Stakeholder
Projects				                                             16               Consultation Committee

                                                              D&S         Domestic and Stock

                                                              vTAG        Valley Technical Advisory
                                                                          Group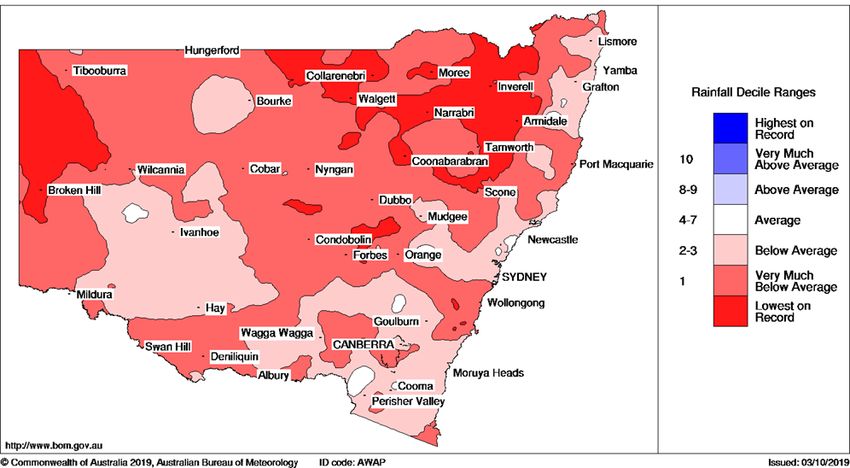
Introduction
The annual operations plan provides an outlook for the coming year in the Hunter Valley. The plan
considers the current volume of water in storage and weather forecasts. This plan may be updated as
a result of significant changes to the water supply situation.
This year’s plan outlines WaterNSW’s response to the drought in the Hunter Valley including:
• identification of critical dates
• our operational response
• potential projects to mitigate the impact of the drought on customers and communities within the
  valley.
The NSW Department of Planning, Industry and Environment’s Extreme Events Policy and Incident
Response Guides outline 4 stages of drought. The Hunter Regulated River system is assessed to be in
stage 1, which is reflecting the normal river operation in 2019-2020.

The Hunter River System

The Hunter Valley is located around 130 kilometres (km) north of Sydney. The catchment is bordered
by the Barrington, Mount Royal, Great Dividing, Liverpool and Watagan Ranges. It is the largest
coastal catchment in New South Wales and has an area of around 21,500 km2. The Hunter River
begins in the Mount Royal Range on the western side of Barrington Tops and flows around 460 km to
enter the sea at Newcastle.

The largest tributary of the Hunter River is the Goulburn River which accounts for 40% of the
catchment area. The Hunter is regulated by two major headwater storages (Glenbawn Dam and
Glennies Dam), as well as a number of minor dams. Glenbawn Dam on the upper Hunter River and
Glennies Creek Dam on Glennies Creek are operated to supply water for irrigation, town water,
Domestic and Stock supplies, as far downstream as Maitland. Lostock Dam is a smaller storage that
provides a regulated water supply to users along the Paterson River. Large volumes of water are also
taken and stored for power station use in Lake Liddell and Lake Plashett.

   N

                                                                   PAGES RIVER    GLENBAWN DAM
   Key
         Major towns
                                          HUNTER RIVER MURRURUNDI
         Major dams

         Dams
         (not waterNSW)                                                                            ROUCHEL BROOK
                                                                                                    GLENNIES CREEK
         River system                CASSILIS
                                                                    SCONE                              GLENNIES CREEK DAM
         River catchment
                                                     MERRIWA
                                                                                                          LOSTOCK DAM
         Water bodies
                                                                             MUSWELLBROOK
                                                  SANDY HOLLOW
                              ULAN                                                                            CHICHESTER DAM

                                                       DENMAN
                                                                                                       DUNGOG
                                                                                                                  WILLIAMS RIVER
                                          FLOW                                        SINGLETON
                                                 D IRE C
                                                           T ION                                              PATERSONS RIVER
                   GOULBURN RIVER                                                                             GRAHAMSTOWN
                                                                                       GRETA                  LAKE
                                                                                          MAITLAND
                                                                                                           RAYMOND TERRACE
                                                      LAKE PLASHETT
                                                              LAKE LIDDELL
                                                                                                           NEWCASTLE
                                                                   HUNTER RIVER
                                                                                                 WOLLOMBI BROOK

                                                                                                                                   2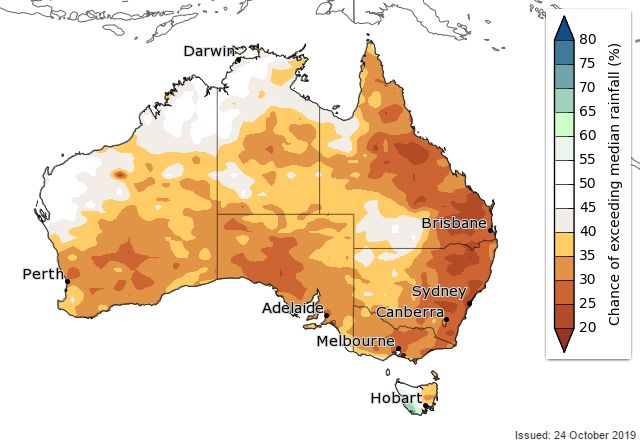
The main tributaries of the Hunter River include the following streams, as well as many smaller streams:
• Pages River
• Goulburn River
• Glennies Creek
• Wollombi Brook.
Towns along the Hunter River include Raymond Terrace, Morpeth, Maitland, Singleton, Jerry’s Plains,
Denman, Muswellbrook and Aberdeen.
Regulated and unregulated system flow trends
The Hunter River system is regulated by releases from Glenbawn and Glennies Creek Dams. Greta
represents the end of the Hunter regulated system, with flows at this point derived from releases from
Glenbawn and Glennies Creek Dams, as well as inflows from the river’s many tributaries. The Hunter
regulated system has flow targets at Liddell and Greta set out in the water sharing plan.
The graph below represents flows at Greta. It is a good point to assess flows in the regulated and
unregulated Hunter systems. The figure shows that flows during the current year and the previous two
years are among the lowest observed.
Hunter River at Greta Total Flow
1,200,000
1,000,000
800,000
Flow (ML)
600,000
400,000
200,000
0
5
6
8
9
0
1
2
3
5
6
8
9
0
4
7
4
7
/0
/0
/0
/0
/1
/1
/1
/1
/1
/1
/1
/1
/2
/0
/0
/1
/1
04
05
07
08
09
10
11
12
14
15
17
18
19
03
06
13
16
20
20
20
20
20
20
20
20
20
20
20
20
20
20
20
20
20
Hunter River at Greta Total Flow
Rainfall trends
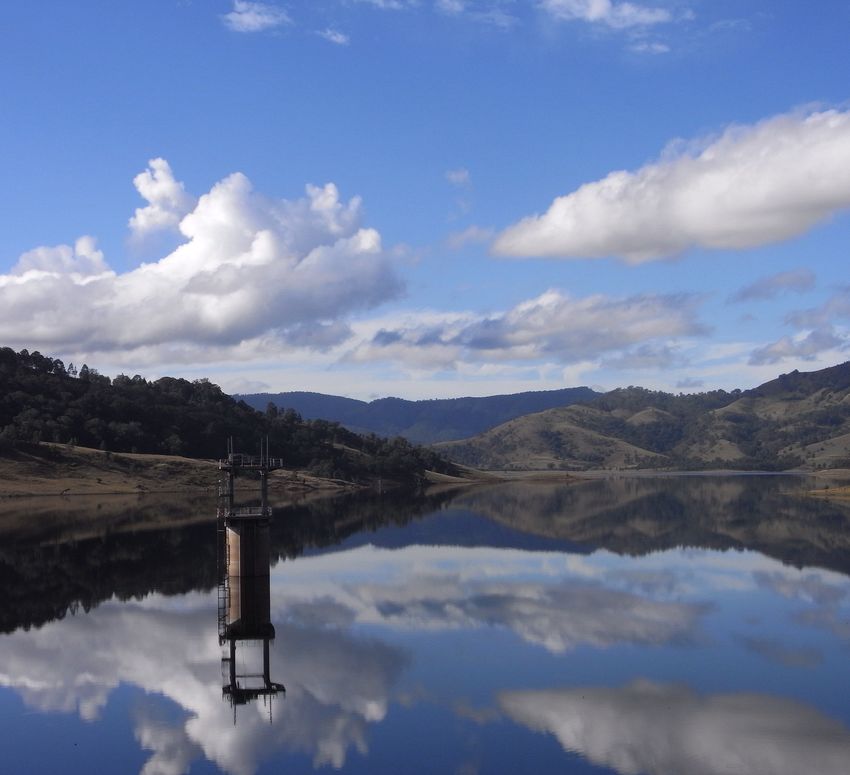
For the period November 2017 to October 2019, Hunter Valley received below average rainfall. Over
most of this area, rainfall for the period was less than 600 – 1200 millimetres (mm) of the long-term
average. Hunter Valley has seen rainfall totals between 70% to 80% of this average.
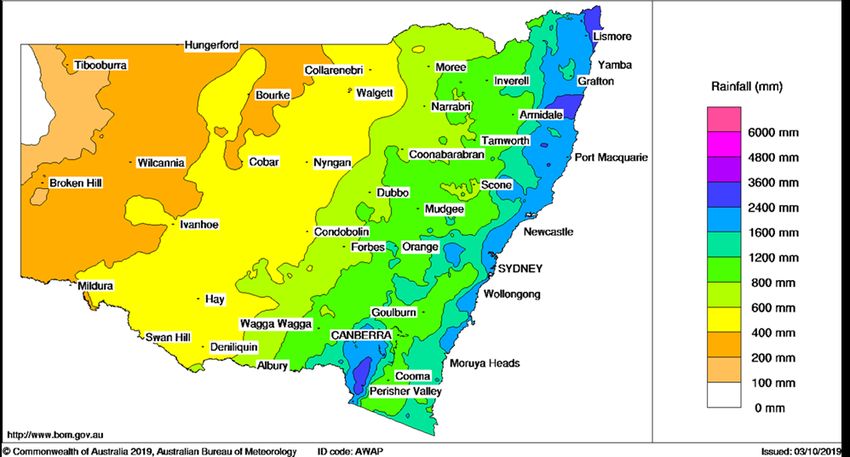
3NSW rainfall deciles for 24 months - 1 October 2017 to 30 September 2019
Water users in the valley
Basic Land Holder Rights (BLR)
BLR includes water for Domestic and Stock extracted from a water source fronting a landholder’s
property, or from any aquifer underlying the land, and for native title rights.
The water requirements of persons entitled to Domestic and Stock rights in this water source are
estimated to total 5,515 megalitres per year (ML/year), distributed as follows:
a. 1,628 ML/year in Management Zone 1A (Hunter River from Glenbawn Dam to Goulburn River
Junction)
b. 964 ML/year in Management Zone 1B (Hunter River from Goulburn River Junction to Glennies
Creek Junction)
c. 141 ML/year in Management Zone 2A (Hunter River from Glennies Creek Junction to Wollombi
Brook Junction)
d. 2,234 ML/year in Management Zone 2B (Hunter River from Wollombi Brook Junction to
Downstream Extent of the Hunter River)
e. 548 ML/year in Management Zone 3A (Glennies Creek).
Domestic and Stock use
The share components of Domestic and Stock access licences authorised to take water from this
water source is estimated to total 1,836 ML/year, distributed as follows:
a. 672 ML/year in Management Zone 1A (Hunter River from Glenbawn Dam to Goulburn River
Junction)
b. 101 ML/year in Management Zone 1B (Hunter River from Goulburn River Junction to Glennies
Creek Junction)
4c. 7 ML/year in Management Zone 2A (Hunter River from Glennies Creek Junction to Wollombi
Brook Junction)
d. 855 ML/year in Management Zone 2B (Hunter River from Wollombi Brook Junction to
Downstream Extent of the Hunter River)
e. 181 ML/year in Management Zone 3A (Glennies Creek).
Local water utilities
The share components of local water utility access licences authorised to take water from this water
source is estimated to total 10,832 ML/year, distributed as follows:
a. 5,800 ML/year in Management Zone 1A (Hunter River from Glenbawn Dam to Goulburn River
Junction)
b. 32 ML/year in Management Zone 1B (Hunter River from Goulburn River Junction to Glennies
Creek Junction)
c. 0 ML/year in Management Zone 2A (Hunter River from Glennies Creek Junction to Wollombi
Brook Junction)
d. 0 ML/year in Management Zone 2B (Hunter River from Wollombi Brook Junction to
Downstream Extent of the Hunter River)
e. 5,000 ML/year in Management Zone 3A (Glennies Creek).
Major utility
The share components of major utility access licences authorised to take water from this water source
is estimated to total 36,000 ML/year in Management Zone 1B (Hunter River from Goulburn River
Junction to Glennies Creek Junction).The share components of major utility (Barnard) access licences
authorised to take water from this water source is estimated to total 0 ML/year in Management Zone
1B (Hunter River from Goulburn River Junction to Glennies Creek Junction).
High security
The share components of regulated river (high security) access licences authorised to take water from
this water source totals 21,740 unit shares, distributed as follows:
a. 5,182 unit shares in Management Zone 1A (Hunter River from Glenbawn Dam to Goulburn
River Junction)
b. 5,128 unit shares in Management Zone 1B (Hunter River from Goulburn River Junction to
Glennies Creek Junction)
c. 2,809 unit shares in Management Zone 2A (Hunter River from Glennies Creek Junction to
Wollombi Brook Junction)
d. 6,971 unit shares in Management Zone 2B (Hunter River from Wollombi Brook Junction to
Downstream Extent of the Hunter River)
e. 1,650 unit shares in Management Zone 3A (Glennies Creek).
General security
The share components of regulated river (general security) access licences authorised to take water
from this water source totals 128,544 unit shares, distributed as follows:
a. 46,925 unit shares in Management Zone 1A (Hunter River from Glenbawn Dam to Goulburn
River Junction)
5b. 29,475 unit shares in Management Zone 1B (Hunter River from Goulburn River Junction to
Glennies Creek Junction)
c. 3,053 unit shares in Management Zone 2A (Hunter River from Glennies Creek Junction to
Wollombi Brook Junction)
d. 43,298 unit shares in Management Zone 2B (Hunter River from Wollombi Brook Junction to
Downstream Extent of the Hunter River)
e. 5,793 unit shares in Management Zone 3A (Glennies Creek).
This year the general security users have received 95% allocation. The valley has received 100%
allocation every year since 2006-07. The major irrigation industries in the valley are wine grapes,
lucerne and dairy farming.
Environmental water
Environmental flow rules for Glenbawn Dam and Glennies Creek Dam
1. Subject to subclause (2), the water supply system in this water source will be managed to ensure
that target environmental flows exceed those specified in Column 2 of Table A at both flow
reference points specified in Column 3 of Table A, for the dates specified in Column 1 of Table A.
These targets will take into account the monthly variations and measures listed in subclause (6) in
the Water Sharing Plan.
Table A: Normal conditions daily flow targets
Dates for which flow target Target environmental Flow reference point
applies flow (ML/day)
17 Hunter River at Liddell gauge (210083)
1 December to 28/29 February
36 Hunter River at Greta gauge (210064)
18 Hunter River at Liddell gauge (210083)
1 March to 31 May
40 Hunter River at Greta gauge (210064)
56 Hunter River at Liddell gauge (210083)
1 June to 31 August
73 Hunter River at Greta gauge (210064)
38 Hunter River at Liddell gauge (210083)
1 September to 30 November
61 Hunter River at Greta gauge (210064)
2. The targets specified in subclause (1) do not apply when the flow at the Hunter River at Belltrees
gauge (210039) is less than the flow specified in Column 2 of Table B for more than 14 consecutive
days, within the date ranges specified in Column 1 of Table B.
Table B: Dry flow conditions rule triggers
Dates for which dry flow Flow (ML/day) at Hunter River at Belltrees
condition target applies gauge (210039)
1 December to 28/29 February 10
1 March to 31 May 17
1 June to 31 August 50
1 September to 30 November 37
63. When flow conditions as specified in subclause (2) occur, the water supply system in this water
source will be managed to ensure that target environmental flows exceed those specified in
Column 2 of Table C, at both the flow reference points specified in Column 3 of Table C for
the dates specified in Column 1 of Table C. These targets will take into account the monthly
variations and measures listed in subclause (6).
Table C: Dry conditions daily flow targets
Dates for which flow target Target environmental Flow reference point
applies flow (ML/day)
10 Hunter River at Liddell gauge (210083)
1 December to 28/29 February
21 Hunter River at Greta gauge (210064)
10 Hunter River at Liddell gauge (210083)
1 March to 31 May
27 Hunter River at Greta gauge (210064)
34 Hunter River at Liddell gauge (210083)
1 June to 31 August
45 Hunter River at Greta gauge (210064)
30 Hunter River at Liddell gauge (210083)
1 September to 30 November
39 Hunter River at Greta gauge (210064)
Planned environmental water
1. An environmental water allowance (EWA) must be maintained in this water source as per water
sharing plan.
2. At the commencement of each water year, 20,000 megalitres (ML) must be credited to the EWA.
3. Releases from the EWA may only be made for the following purposes:
a. to assist in the management of critical environmental events, including algal blooms and
chemical spills
b. to provide flows to maintain ecosystem health, including for facilitating fish migration or stony
bed scouring
c. to support environmental assets or environmental functions within this water source that have
been identified as water-dependent Aboriginal cultural values
4. The EWA must be debited with a volume of water equal to the amount released from Glenbawn
Dam or Glennies Creek Dam under subclause (3).
5. Any unused water remaining in the EWA at the end of the water year cannot be carried over to
the following water year.
6. The Minister may seek the advice of an Environmental Water Advisory Group (EWAG) in making
releases from the EWA under subclause (3).
Uncontrolled flows in the Hunter Regulated River
Uncontrolled flows in the Hunter Regulated River refer to unregulated inflows that enter the system
either downstream of the dam or from dam spills, or releases from the dam as stimulus and/or ECA
flows.
Rules for uncontrolled flow access to unregulated inflows:
1. The taking of water from uncontrolled flows under regulated river (high security) access licences
and regulated river (general security) access licences will only be permitted in accordance with
announcements made by the Minister.
72. Announcements under subclause (1) must only be made when uncontrolled flows are in excess
of those necessary to satisfy:
a. the environmental flow rules in clause 28 (1) of the Hunter water sharing plan, and
b. the volume required to supply Domestic and Stock rights, native title rights and higher priority
access licences, and
c. any losses expected to be involved in meeting the requirements under paragraphs (a) and
(b).
3. The maximum volume of uncontrolled flows permitted to be taken from time to time under this
clause will be expressed as a percentage of each access licence share component.
4. The taking of water from uncontrolled flows under a regulated river (high security) access licence
will only be permitted when the sum of available water determinations for regulated river (high
security) access licences in any water year is less than 1 megalitre per unit share, and:
a. if the sum of available water determinations for regulated river (general security) access
licences in any water year is less than 0.75 megalitres per unit share, when flows are either
sufficient or insufficient to permit water to be taken under supplementary access licences, or
b. if the sum of available water determinations for regulated river (general security) access
licences in any water year is greater than or equal to 0.75 megalitres per unit share and less
than 1 megalitre per unit share, when flows are sufficient to permit water to be taken under
supplementary access licences.
5. The taking of water from uncontrolled flows under a regulated river (general security) access
licence will only be permitted:
a. if the sum of available water determinations for regulated river (general security) access
licences in any water year is less than 0.75 megalitres per unit share, when flows are either
sufficient or insufficient to permit water to be taken under supplementary access licences, or
b. if the sum of available water determinations for regulated river (general security) access
licences in any water year is greater than or equal to 0.75 megalitres per unit share and less
than 1 megalitre per unit share, when flows are sufficient to permit water to be taken under
supplementary access licences.
6. At any point in the water year the total volume of uncontrolled flows taken under regulated
river (high security) access licences and regulated river (general security) access licences, when
water is permitted to be taken under supplementary water access licences, must not exceed
11% of the annual high flow tally calculated under clause 55 of the Hunter Water Sharing Plan.
7. The taking of water from uncontrolled flows in each management zone will be managed to
ensure that the total volume of water taken on any day under all access licences, Domestic and
Stock rights and native title rights does not exceed 50% of the total inflows to that management
zone.
8Water availability
Water allocations in the Hunter Regulated River water source for 2019-20, as of 11 November 2019:
• local water utility and Domestic and Stock water access license holders receive an allocation of
100% of entitlement
• high security water access license holders in the Hunter regulated river water source receive an
allocation of 100% of entitlement
• general security water access license holders receive an allocation of 95% of entitlement
• all local water utility and Domestic and Stock water access license holders in the Hunter
unregulated river and Hunter alluvium water sources receive an allocation of 100% of entitlement.
Current drought conditions
The system continues to experience low inflows to Glenbawn and Glennies Creek Dams and
downstream tributaries. Over the last 10 years, good inflows occurred only in three years: 2010-11,
2011-12 and 2012-13.
Extremely low inflows also occurred in the recent three years: 2013-14, 2017-18 and 2018-19. The
occurrence of two extremely low inflows in consecutive years is rare.
Hunter Valley Inflows
500,000
450,000
400,000
350,000
300,000
Inflows (ML)
250,000
200,000
150,000
100,000
50,000
0
2009-10 2010-11 2011-12 2012-13 2013-14 2014-15 2015-16 2016-17 2017-18 2018-19
Comb Dams Goulburn River
The combined dam inflows for the 24-months (October 2017 to September 2019) was 25,700 ML. This is
35% of the previous minimum observed 24-month inflow of 72,300 ML.
As of 31 October, Glenbawn Dam is 46% full, holding 344,000 ML. Glennies Creek Dam is 47% full, holding
about 133,000 ML. At this time last year, Glenbawn was 63% full and Glennies Creek was 65% full.
9Glenbawn and Glennies Creek Dams storage
As a result of the low inflows over the past two years, the volume of water in Glenbawn and Glennies
Creek Dams has slowly declined since being nearly full in October 2017. The graph below shows
Glenbawn and Glennies Creek Dams’ behaviour for the 2018-19 water year, compared to the last
four water years, with the percentages expressed in relation to the current dams’ capacity.
From the figure, it can be seen that last year the volume of Glenbawn Dam was around 67% at the
start of the water year and was drawn down to 51% of total capacity at the end of the year. Similarly,
it can be seen that the volume of Glennies Creek Dam was around 68% at the start of the water year,
and was drawn down to 52% of total capacity at the end of the year.
Over the last water year (July 2018-June 2019), about 45,802 ML was supplied to high security users,
75,659 ML was provided to general security irrigation and 4,992 ML was extracted as supplementary
water.
Glenbawn Dam Storage
100
90
80
Storgae Capacity %
70
60
50
40
30
20
10
0
Jul Aug Sep Oct Nov Dec Jan Feb Mar Apr May Jun
2015/16 2016/17 2017/2018 2018/19 2019/20
Glennies Creek Storage
100
90
80
Sorage Capacity %
70
60
50
40
30
20
10
0
Jul Aug Sep Oct Nov Dec Jan Feb Mar Apr May Jun
2015/16 2016/17 2017/2018 2018/19 2019/20
10Resource assessment
The resource assessment is the process of calculating how much water is available based on the rules
of the Water Sharing Plan (WSP). This is done at the end of the month and when any significant inflow
event occurs.
The planning horizon for this resource assessment is 24 months. Taken into consideration is the volume
of water held in storage, plus the expected minimum inflow based on historical records for the
12-month period, as well as a storage reserve for the following year.
As of 1 October 2019, the total amount of water available in Glenbawn and Glennies Creek Dams
was 500,000 ML. Added to this was the expected minimum inflow to the dams over the planning
horizon of 14,000 ML and minimum downstream tributaries inflows of 12,800 ML. Commitments for the
planning horizon were then subtracted to find the remaining available resource for Available Water
Determination (AWD) announcement.
Commitments for the planning horizon include 136,900 ML of general security allocations, 104,100 ML
of essential supplies water which is required to be set aside under the water sharing plan to provide
for town water, major utility, high security, basic landholder rights, environmental water account,
Domestic and Stock, and minimum flow targets at Greta, from 1 October 2019 to 30 June 2020. A
storage reserve of 281,100 ML is set aside to ensure essential requirements and system losses for the
2020-21 and 2021-22 water years can be met. About 61,500 ML is set aside for storage evaporation
and losses resulting from the running of the river to end June 2020. A volume of 31,700 ML is allocated
to major utility carryover.
Currently the total commitment is higher than the available resource and the shortfall is about
88,000 ML. Therefore, no additional allocation is possible at this time.
This assessment is simulated below in charts and in a water balance table.
Resource distribution 1 October 2019 to 30 June 2020 Volume ML Volume ML
Available resource 526,800
less
Essential supplies 104,100
System losses 61,500
Storage reserve 281,100
General security account balance 136,900
Major utility carryover 31,700
equals
Additional inflows required (88,500)
11Hunter Valley resource distribution - 1 October 2019 to 30 June 2020
32,000 ML
137,000 ML
Storage reserve
Essential supplies
System losses 281,000 ML
Major utility carryover
General security account balance
104,000 ML
Total commitments: 615,000 ML
61,000 ML
Additional inflows required -
88,000 ML
Drought minimum downstream
tributaries inflows - 13,000 ML
Minimum storages inflows -
Total resource = 527,000 ML
14,000 ML
Glennies Creek Dam active
storage volume - 138,000 ML
Glenbawn Dam active storage
Supply source: 527,000 ML volume - 362,000 ML
12Water resource forecast
Hunter Valley - past 24-month rainfall
Over the last two years, the total rainfall across the Hunter catchment was in the range of
1,200 mm-2,400 mm. The average annual rainfall across the Hunter catchment is around
1,000 mm-1,500 mm per year.
Total NSW rainfall (mm) for 24 months - 1 October 2017 to 30 September 2019
NSW rainfall deciles for 24 months - 1 October 2017 to 30 September 2019
13Glenbawn and Glennies Creek Dams - past 24-month inflows/statistical inflows
The inflows for last the 24 months were 25,700 ML which is lower than the minimum observed historic
flows of 81,600 ML.
Hunter Storages past 24 months cumulative inflow/statistical inflow
600,000
500,000
Inflows (ML)
400,000
300,000
200,000
100,000
0
NOV
DEC
JAN
FEB
MAR
APR
MAY
JUN
AUG
SEP
NOV
DEC
JAN
FEB
MAR
APR
MAY
JUN
AUG
SEP
JUL
JUL
OCT
OCT
OCT
Minimum 99% COE Dry 80%COE Median 50% COE Wet 20% COE Actual
Three-month weather forecast
Forecasts from the Bureau of Meteorology (BoM) indicate a warmer and drier spring. BoM have
indicated that the main influence on weather patterns across New South Wales at present is the positive
Indian Ocean dipole, as sea surface temperatures in the Indian Ocean impact rainfall and temperature
patterns over Australia. Cooler than average sea surface temperatures can provide less moisture for
frontal systems and lows crossing Australia. Generally, this means there is less moisture than normal in
the atmosphere to the northwest of Australia. Rainfall is likely to be below average across most of the
country during November and December. Daytime temperatures are very likely to be above average
across Australia for the remainder of 2019 and into early 2020. The strong positive Indian Ocean Dipole
(IOD) is continuing to influence Australian climate, while a negative Southern Annular Mode (SAM)
is also likely to affect the southern half of the country for the remainder of spring. Both these drivers
typically bring warmer and drier conditions to much of the southern mainland and coastal region
during spring. The figure below shows that there is a 25-30% probability of the Hunter Valley receiving
above median rainfall during spring.
14Glenbawn and Glennies Creek Dams storage forecast
While rainfall over spring is forecast to be below average, weather patterns can change especially
over summer where coastal New South Wales can see increased rainfall with the northern monsoonal
season. The figure below demonstrates the behaviour of Glenbawn and Glennies Creek Dams under
different inflow conditions through to June 2020.
Hunter Dams - forecast storgae volume - chance of exceedance (COE)
800,000
700,000
Storgae volume (ML)
600,000
500,000
400,000
300,000
200,000
100,000
0
8
Se 8
O 8
N 8
D 18
Ja 8
Fe 9
M 9
A 9
M 19
Ju 9
19
9
Se 9
O 9
N 9
D 19
Ja 9
Fe 0
M 0
A 0
M 20
Ju 0
20
l-1
-1
1
-1
-1
1
1
-1
-1
l-1
-1
1
-1
-1
2
2
-2
-2
p-
-
n-
b-
-
n-
p-
-
n-
b-
-
n-
ug
ct
ov
ec
ar
pr
ay
ug
ct
ov
ec
ar
pr
ay
Ju
Ju
A
A
WET 20% COE Median 50% COE DRY 80% COE Minimum Actual
Under wet conditions (dark blue line) with 20th percentile inflows (meaning flows that are expected to
exceed in only 2 years out of 10), the dam may reach 744,000 ML (72%).
Under median conditions (light blue line) with inflows expected to exceed 5 years out of 10, the
storage is likely to exceed 58% capacity by June 2020.
A dry scenario (green line), where conditions are expected to exceed this inflow 8 years out of 10,
would still see the storage improve to above 50% capacity by June 2020.
The forecast under minimum inflow conditions (grey line) indicates that Glenbawn and Glennies
Creek Dams storage will reduce to a minimum of about 34% capacity by June 2020.
Annual operations
Deliverability
Water availability for 2019-20 is 0.95 ML/unit share for general security users and 1.0 ML/unit share to all
other user categories. However, due to the ongoing dry conditions, the system will be operated to the
minimum daily flow targets.
Accurate water orders and extractions are essential to the efficient operation of the system in all
years, but particularly in drought conditions. Accurate orders are required to schedule dam releases
to avoid both operational shortfalls and operational surplus. Operational shortfalls are caused by
customers taking more than their order leading to downstream flows being insufficient for customers
to pump their orders. Over-ordering will lead to excess flows at the end of the system, and further
restrictions on next year’s water availability.
15Critical dates
General security account balances at 30 June 2020 will determine the amount of carryover available
in 2020-21. Customers are reminded to consider their carryover into next year when planning this
year’s operations and water trading. Carryover is limited to 25% of each general security share
component.
Storage volumes in the dams at 30 June 2020 will determine the water availability for 2020-21.
Projects
Operational measures may be required to extend water supplies in 2020-21 if drought conditions
continue.
If drought conditions continue, infrastructure options will be considered to extend supplies for 2020-21
and beyond. At this stage, no infrastructure projects have been identified for 2020-21 operations.
1617
You can also read