Assessment of Streamflow and Water Quality in the Upper Yampa River Basin, Colorado, 1992-2018 - USGS Publications Repository
←
→
Page content transcription
If your browser does not render page correctly, please read the page content below
Prepared in cooperation with Upper Yampa River Watershed Group, Upper Yampa Water
Conservancy District, Colorado Water Conservation Board, Yampa-White-Green Basin
Roundtable, Mount Werner Water and Sanitation District, Routt County, Colorado, and the city of
Steamboat Springs, Colorado

Assessment of Streamflow and Water Quality in the
Upper Yampa River Basin, Colorado, 1992–2018

Scientific Investigations Report 2021–5016

U.S. Department of the Interior
U.S. Geological Survey
Cover. Photograph of the Yampa River taken at the site of the U.S. Geological Survey streamgage
Yampa River at Steamboat Springs, Colo. (site number 09239500) [Photograph by Jeff Foster, U.S.
Geological Survey, 2019].
Assessment of Streamflow and Water
Quality in the Upper Yampa River Basin,
Colorado, 1992–2018

By Natalie K. Day

Prepared in cooperation with Upper Yampa River Watershed Group, Upper
Yampa Water Conservancy District, Colorado Water Conservation Board,
Yampa-White-Green Basin Roundtable, Mount Werner Water and Sanitation
District, Routt County, Colorado, and the city of Steamboat Springs, Colorado

Scientific Investigations Report 2021–5016

U.S. Department of the Interior
U.S. Geological Survey
U.S. Geological Survey, Reston, Virginia: 2021 For more information on the USGS—the Federal source for science about the Earth, its natural and living resources, natural hazards, and the environment—visit https://www.usgs.gov or call 1–888–ASK–USGS. For an overview of USGS information products, including maps, imagery, and publications, visit https://store.usgs.gov/. Any use of trade, firm, or product names is for descriptive purposes only and does not imply endorsement by the U.S. Government. Although this information product, for the most part, is in the public domain, it also may contain copyrighted materials as noted in the text. Permission to reproduce copyrighted items must be secured from the copyright owner. Suggested citation: Day, N.K., 2021, Assessment of streamflow and water quality in the Upper Yampa River Basin, Colorado, 1992–2018: U.S. Geological Survey Scientific Investigations Report 2021–5016, 45 p., https://doi.org/10.3133/sir20215016. Data associated with this publication: Day, N.K., 2021, Input and output data from streamflow and water-quality regression models used to characterize streamflow and water-quality conditions in the Upper Yampa River Basin, Colorado, from 1992 to 2018: U.S. Geological Survey data release, https://doi.org/10.5066/P9L7S3NQ. ISSN 2328-031X (print) ISSN 2328-0328 (online) ISBN 978-1-4113-4402-0
iii

Contents
Abstract�����������������������������������������������������������������������������������������������������������������������������������������������������������1
Introduction����������������������������������������������������������������������������������������������������������������������������������������������������1
     Purpose and Scope������������������������������������������������������������������������������������������������������������������������������4
     Previous Studies�����������������������������������������������������������������������������������������������������������������������������������4
     Description of the Study Area������������������������������������������������������������������������������������������������������������4
           Hydrology and Water Use����������������������������������������������������������������������������������������������������������5
Approach and Methods��������������������������������������������������������������������������������������������������������������������������������7
     Data Compilation and Quality Assurance�����������������������������������������������������������������������������������������7
     Extension of Streamflow Record��������������������������������������������������������������������������������������������������������8
     Streamflow Trend Analysis�����������������������������������������������������������������������������������������������������������������9
     Concentration and Load Estimates����������������������������������������������������������������������������������������������������9
     Comparison to Interim Concentrations for Water-Quality Standards����������������������������������������10
     Normalized Mean Daily Streamflows, Loads, and Yields������������������������������������������������������������10
     Concentration and Load Trend Analysis�����������������������������������������������������������������������������������������11
           Multiple Linear Regression Trend Analysis���������������������������������������������������������������������������11
           Weighted Regression Trend Analysis������������������������������������������������������������������������������������11
     Stagecoach Reservoir�����������������������������������������������������������������������������������������������������������������������11
     Changes in Land Use��������������������������������������������������������������������������������������������������������������������������12
Assessment of Streamflow and Water Quality���������������������������������������������������������������������������������������12
     Streamflow Trends������������������������������������������������������������������������������������������������������������������������������12
     Concentration Estimates and Comparisons to Interim Concentrations for
               Water-Quality Standards�����������������������������������������������������������������������������������������������������16
     Regression Equation Variable Coefficients and Statistical Diagnostics�����������������������������������16
           Suspended Sediment����������������������������������������������������������������������������������������������������������������16
           Nitrogen���������������������������������������������������������������������������������������������������������������������������������������21
           Phosphorus���������������������������������������������������������������������������������������������������������������������������������21
     Load Estimation and Streamflow-Normalized Load and Yield Analysis������������������������������������26
           Suspended Sediment����������������������������������������������������������������������������������������������������������������26
           Nitrogen���������������������������������������������������������������������������������������������������������������������������������������26
           Phosphorus���������������������������������������������������������������������������������������������������������������������������������26
     Concentration and Load Trend Analysis�����������������������������������������������������������������������������������������26
           Suspended Sediment����������������������������������������������������������������������������������������������������������������29
           Nitrogen���������������������������������������������������������������������������������������������������������������������������������������29
           Phosphorus���������������������������������������������������������������������������������������������������������������������������������29
     Stagecoach Reservoir Water Quality and Algae���������������������������������������������������������������������������29
     Changes in Land Use��������������������������������������������������������������������������������������������������������������������������33
     Synthesis of Streamflow and Water-Quality Results��������������������������������������������������������������������35
Summary�������������������������������������������������������������������������������������������������������������������������������������������������������40
Acknowledgments���������������������������������������������������������������������������������������������������������������������������������������42
References Cited�����������������������������������������������������������������������������������������������������������������������������������������42
iv
Figures
1. Map showing the location of the Upper Yampa River Basin, Colorado, with
selected U.S. Geological Survey water-quality sites and water year 2018
streamgage sites��������������������������������������������������������������������������������������������������������������������������2
2. Map showing Cretaceous-aged sandstones, shales, and major coal beds of the
Upper Yampa River Basin, Colorado������������������������������������������������������������������������������������������6
3. Graph showing the mean monthly streamflow at selected streamgage sites in
the Upper Yampa River Basin, Colorado, for water years 2013 through 2018��������������������7
4. Graphs showing changes in 1-day maximum, mean, and 7-day minimum
streamflow statistics at five main-stem Yampa River sites in the Upper Yampa
River Basin from climate years 1992 to 2018��������������������������������������������������������������������������12
5. Graphs showing changes in 1-day maximum, mean, and 7-day minimum
streamflow statistics for various time periods at 3 tributary sites in the Upper
Yampa River Basin and 1 Yampa River main-stem site��������������������������������������������������������14
6. Graph showing the temporal deviation from the mean peak streamflow date at
Yampa River at Steamboat Springs, Colo., for water years 1910–2018������������������������������15
7. Discrete concentrations and boxplots of model-estimated daily mean
concentrations of suspended sediment at five sites in the Upper Yampa River
Basin, Colorado, on a monthly basis for water years 2010–18��������������������������������������������20
8. Discrete concentrations and boxplots of model-estimated daily mean
concentrations of Kjeldahl nitrogen at eight sites in the Upper Yampa River
Basin, Colorado, for various starting water years through water year 2018��������������������22
9. Discrete concentrations of total nitrogen at eight sites in the Upper Yampa
River Basin, Colorado, for various starting water years through water year 2018����������22
10. Graphs showing discrete concentrations of total phosphorus and suspended
sediment at five sites in the Upper Yampa River Basin, Colorado, for water
years 2010–18������������������������������������������������������������������������������������������������������������������������������24
11. Discrete concentrations and boxplots of model-estimated daily mean
concentrations of total phosphorus at eight sites in the Upper Yampa River
Basin, Colorado, for various starting water years through 2018����������������������������������������25
12. Graphs of discrete concentrations of orthophosphate at eight sites in the Upper
Yampa River Basin, Colorado, for various starting water years through 2018�����������������27
13. Graphs showing annual loads and net yields of suspended sediment, Kjeldahl
nitrogen, and total phosphorus, based on normalized hydrographs at select
sites in the Upper Yampa River Basin, Colorado, for water years 2010–18����������������������30
14. Graphs showing estimated annual concentrations and loads and
streamflow-normalized trends for Kjeldahl nitrogen and total phosphorus using
weighted regression trend analysis at Yampa River at Steamboat Springs,
Colorado (CO), and Yampa River at Craig, CO, in the Upper Yampa River Basin
for water years 1999–2018���������������������������������������������������������������������������������������������������������32
15. Graphs showing water temperature, dissolved oxygen concentration, total
phosphorus concentration, total nitrogen concentration, ratio of total nitrogen
to total phosphorus, and chlorophyll a concentrations at two depths at
Stagecoach Reservoir at Dam, Colorado, in July–September 2017 and 2018������������������34
16. Graph showing planktonic algal cell densities, in cells per milliliter, in
Stagecoach Reservoir at Dam, Colorado, in July–September 2017 and 2018������������������35
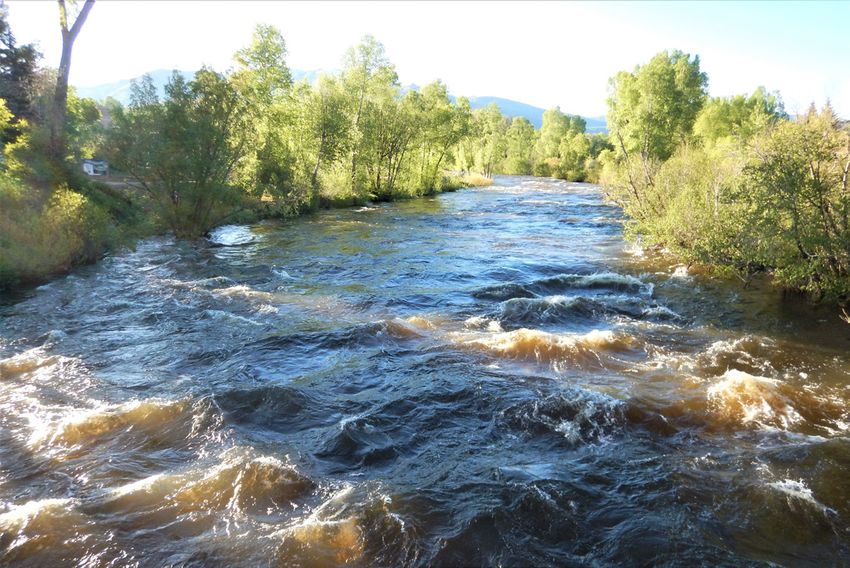
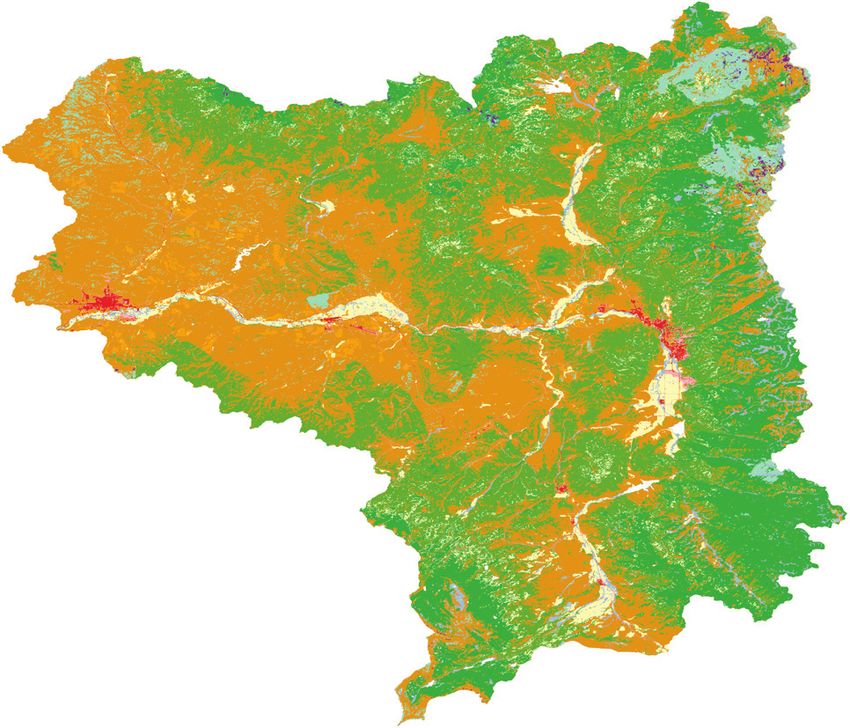
17. Map showing land cover in the Upper Yampa River Basin, Colorado, in 2016�����������������36
18. Graph showing percentage of land-use cover classes in the Upper Yampa
River Basin, Colorado, and its subbasins in 2016������������������������������������������������������������������37v
Tables
1. Summary of U.S. Geological Survey water-quality and streamgage sites in the
Upper Yampa River Basin, Colorado, included in this report������������������������������������������������3
2. Colorado Department of Public Health and Environment interim concentrations
for total nitrogen, total phosphorus, and chlorophyll a water-quality standards
for surface water in the Upper Yampa River Basin, Colorado��������������������������������������������10
3. Regression model coefficients and statistical diagnostics for concentrations of
suspended sediment at 5 sites, and Kjeldahl nitrogen and total phosphorus at 7
sites in the Upper Yampa River Basin, Colorado�������������������������������������������������������������������17
4. Regression model coefficients and statistical diagnostics for loads of
suspended sediment at 5 sites, and Kjeldahl nitrogen and total phosphorus at 7
sites, in the Upper Yampa River Basin, Colorado������������������������������������������������������������������18
5. Estimated annual median and median annual concentrations of suspended
sediment at 5 water-quality sites in the Upper Yampa River Basin, Colorado,
and Kjeldahl nitrogen and total phosphorus at 7 water-quality sites in the Upper
Yampa River Basin for water years 2010–18��������������������������������������������������������������������������19
6. Estimated monthly and annual loads and annual yields, based on normalized
hydrographs, of suspended sediment for 5 sites, and Kjeldahl nitrogen and
total phosphorus for 7 sites listed in downstream order in the Upper Yampa
River Basin, Colorado, for water years 2010–18, and changes in annual loads at
Yampa River sites������������������������������������������������������������������������������������������������������������������������28
7. Results of weighted-regression trend analysis and regression statistics for
annual streamflow-normalized concentrations and loads at Yampa River at
Steamboat Springs, Colorado, and Yampa River below Craig, CO for water
years 1999–2018��������������������������������������������������������������������������������������������������������������������������31
8. Change in forest and development land-cover classes in the Upper Yampa
River Basin, Colorado, and subbasins from 2001 to 2016�����������������������������������������������������38vi
Conversion Factors
U.S. customary units to International System of Units
Multiply By To obtain
Length
foot (ft) 0.3048 meter (m)
Area
square mile (mi2) 2.590 square kilometer (km2)
Volume
gallon (gal) 3.785 liter (L)
acre-foot (acre-ft) 1,233 cubic meter (m3)
Flow rate
cubic foot per second (ft3/s) 0.02832 cubic meter per second (m3/s)
inch per year (in/yr) 25.4 millimeter per year (mm/yr)
Mass
ton, short (2,000 lb) 0.9072 metric ton (t)
International System of Units to U.S. customary units
Multiply By To obtain
Length
micron 0.001 millimeter
Area
square meter (m2) 0.0002471 acre
Volume
liter (L) 33.81402 ounce, fluid (fl. oz)
Temperature in degrees Celsius (°C) may be converted to degrees Fahrenheit (°F) as follows:
°F = (1.8 × °C) + 32.
Temperature in degrees Fahrenheit (°F) may be converted to degrees Celsius (°C) as follows:
°C = (°F – 32) / 1.8.
Datum
Vertical coordinate information is referenced to the North American Vertical Datum of 1988.
Horizontal coordinate information is referenced to the Geographic Coordinate System North
America coordinate system of 1983.
Elevation, as used in this report, refers to distance above the vertical datum.vii
Supplemental Information
Concentrations of chemical constituents in water are given in milligrams per liter (mg/L) or
micrograms per liter (µg/L).
Streamflow is given in cubic feet per second (ft3/s).
“Water year” is the 12-month period from October 1 through September 30. The water year is
designated by the year in which it ends.
“Climate year” is the 12-month period beginning April 1 and ending March 31 of the following
year. The climate year is designated as the year in which it begins.
Abbreviations
> greater than
< less than
CDPHE Colorado Department of Public Health and Environment
CO Colorado, in USGS site names
CY climate year
CyanoHABs cyanobacterial harmful algal blooms
MOVE.2 Maintenance of Variance Extension Type 2
NWIS National Water Information System
2
R coefficient of determination
TN:TP total nitrogen to total phosphorus ratio
USGS U.S. Geological Survey
UYRB Upper Yampa River Basin
WRTDS Weighted Regressions on Time, Discharge, and Season
WY water yearAssessment of Streamflow and Water Quality in the
Upper Yampa River Basin, Colorado, 1992–2018
By Natalie K. Day
phosphorus from upstream inputs. Yampa River at Milner,
Abstract Colo., and Yampa River above Elkhead Creek, Colo., had the
highest net yields of suspended sediment, Kjeldahl nitrogen,
The Upper Yampa River Basin drains approximately and total phosphorus, and are likely influenced by land use and
2,100 square miles west of the Continental Divide in north- erosion as the basins of both of these sites are underlain by
western Colorado. There is a growing need to understand highly erodible Cretaceous shales.
potential changes in the quantity and quality of water Upward trends in estimated Kjeldahl nitrogen and total
resources as the basin is undergoing increasing land and water phosphorus concentrations and loads were found at Yampa
development to support growing municipal, industrial, and River at Steamboat Springs, Colo. From 1999 to 2018, the
recreational needs. The U.S. Geological Survey, in cooperation Kjeldahl nitrogen concentration increased by 10 percent or
with stakeholders in the Upper Yampa River Basin water com- 0.035 milligram per liter, and load increased by 22 percent or
munity, began a study to characterize and identify changes in 26 tons. Total phosphorus concentration increased by 20 percent
streamflow and selected water-quality constituents, including or 0.0081 milligram per liter, and loads increased by 41 percent
suspended sediment, Kjeldahl nitrogen, total nitrogen, total or 6.2 tons. Decreases in streamflow and changes in land use
phosphorus, and orthophosphate, in the basin. This study may contribute to these trends.
used streamflow and water-quality data from selected U.S. During multiple summer sampling events at Stagecoach
Geological Survey sites to provide a better understanding Reservoir, the physical and chemical factors indicated condi-
of how major factors, including land use, climate change, tions conducive to cyanobacterial blooms, including surface-
and geological features, may influence streamflow and water temperatures greater than 20 degrees Celsius and total
water quality. phosphorus and total nitrogen concentrations in exceedance
Analysis of long-term (1910–2018) and short-term of Colorado Department of Public Health and Environment
(1992–2018) records of streamflow at main-stem Yampa River interim concentrations for water-quality standards. Local
and tributary sites indicate downward trends in one or more geological features (predominately sandstones and shales) and
streamflow statistics, including 1-day maximum, mean, and additional inputs from upstream land use likely contribute to
7-day minimum. Long-term downward trends in daily mean
the elevated nutrient conditions in Stagecoach Reservoir.
streamflow in April (22 percent overall) at Yampa River at
Steamboat Springs, Colorado, correspond to observed changes
in streamflow documented across western North America and
the Colorado River Basin that are predominately associated Introduction
with changes in snowmelt runoff and temperatures. During
the short-term period of analysis, decreases in streamflow The Yampa River, in the Upper Colorado River Basin in
at main-stem Yampa River and some tributary sites are northwestern Colorado, is the largest mostly free-flowing river
likely related to changes in consumptive use and reservoir in the Colorado River system. Because of limited reservoir
management or, at sites with no upstream flow impoundments, storage, the river is known for its largely unaltered natural
changes in irrigation diversions and climate. condition, biological diversity, and water quality, and is a
Concentrations of water-quality constituents were typically valued multiuse resource in the Upper Yampa River Basin
highest in spring (March, April, and May) during the early (UYRB; Bauch and others, 2012). The UYRB, as defined in
snowmelt runoff period as material that is washed off the land this report, is the area of land drained by the Yampa River
surface drains into streams. Highest concentrations occurred from its headwaters near the Flat Tops, a mountain range in
slightly later, in May, June, and July, at Yampa River above Garfield County, to near Craig, Colorado (fig. 1). Table 1 pro-
Stagecoach Reservoir, Colo., and slightly earlier, in February vides information on the water-quality and streamgage sites
and March at Yampa River at Milner, Colo., indicating shown in figure 1.
that these sites may have different or additional sources of2 Assessment of Streamflow and Water Quality in the Upper Yampa River Basin, Colorado, 1992–2018
–106°45'
–107°00'
–107°30'
Steamboat
Lake
–107°15' Pearl Lake
e
Rang
River
40°45' ad Mountains Elk
Elkhe
Park
MOFFAT eek
Cr CONTINENTAL
a d DIVIDE
he
Elk MOUNT ZIRKEL
WILDERNESS
k
Lake
ree
Elbert
on C
11
a ti
ic Elkhead
ti f
For Reservoir
Craig 10 pa River ROUTT
Yam 8 Steamboat k
Springs ree
40°30' Milner hC
12 Hayden 7 Fis JACKSON
eek 9 6 Fish Creek
Reservoir
Cr
ge 5
Sa
Will
iams ree k ree
Fis h C
k
EXPLANATION Fork
M ountains Lake
kC
Oa Catamount GRAND
Subbasin
Yampa River below Craig k Oak Stagecoach
ree
Gore
C Creek Reservoir
Yampa River above Elkhead Creek, ut 3 4 GRAND
Rang
Tro
near Hayden 1 2
e
Yampa River at Milner 40°15' SARVIS CREEK
Phippsburg
Y WILDERNESS
Elk River near Milner am
pa
Yampa River at Steamboat Springs Allen Basin R
Reservoir Yampa
ive
Yampa River below Oak Creek, near RIO BLANCO
r
Flat Tops ver
Steamboat Springs Ri Phillips
e ar Creek
Yampa River above Stagecoach FLAT TOPS B
Reservoir WILDERNESS
Subbasin boundary GARFIELD
0 5 10 15 20 MILES
12 Streamflow and water-quality analysis
40°00' Yamcolo 0
site and site number (table 1) Reservoir
5 10 15 20 KILOMETERS
11 Stillwater
Streamflow only site and site number Reservoir
(table 1) Upper Yampa
River Basin
2 Water-quality only site and site number Base from U.S. Geological Survey digital data, 1:750,000, 2020
(table 1) Geographic Coordinate System North America 1983 projection DENVER
Decimal degrees
North American Datum of 1983
Figure 1. Map showing the location of the Upper Yampa River Basin, Colorado, with selected U.S. Geological Survey water-quality
sites and water year 2018 streamgage sites.Introduction 3
Table 1. Summary of U.S. Geological Survey (USGS) water-quality and streamgage sites in the Upper Yampa River Basin (UYRB),
Colorado (CO), included in this report.
[USGS information from the USGS National Water Information System database (https://doi.org/10.5066/F7P55KJN). “Streamflow trends period of analysis”
refers to climate years. A “climate year” is defined as a 12-month period beginning April 1 and ending March 31 of the following year and is designated as the
year in which it begins. “Water-quality period of analysis” refers to water years. A “water year” is defined as a 12-month period beginning October 1 and ending
September 30 of the following year and is designated as the year in which it ends. NA, not applicable]
Site number UYRB monitoring Streamflow trends Water-quality period
USGS site number USGS site name
(fig. 1) program? period of analysis of analysis
1 09237450 Yampa River above Stagecoach Yes 1992–2018 2010–18a
Reservoir, CO
2 401634106502200 Little Morrison Creek near No NA 2012–14, 2017–18b
Stagecoach, CO
3 401707106495800 Stagecoach Reservoir at Dam, CO No NA 2012–18b
4 09237500 Yampa River below Stagecoach No 1992–2018 2010–18b
Reservoir, CO
5 402544106493600 Yampa River below Oak Creek Yes NA 2010–18a
near Steamboat Springs, COc
6 09238900 Fish Creek at Upper Station No 1992–2018 NA
near Steamboat Springs, CO
7 09239500 Yampa River at Steamboat Yes 1910–2018 1999–2018a
Springs, CO
8 09242500 Elk River near Milner, COd Yes 1992–2018 2010–18a
9 402840107004200 Yampa River at Milner, COc Yes NA 2010–18a
10 09244490 Yampa River above Elkhead Yes 1992–2018 2010–18a
Creek near Hayden, CO
11 09246200 Elkhead Creek above Long Gulch No 1996–2018 NA
near Hayden, CO
12 09247600 Yampa River below Craig, CO No 1992–2018 1999–2018a
a
Water-quality analysis including regression (concentrations, loads, and streamflow-normalized loads and yields) and trend analysis.
b
Water-quality analysis using discrete data only.
c
Site is missing continuous streamflow data, and an estimated hydrograph was created; limitations are discussed in “Extension of Streamflow Record” section.
d
Site is missing streamflow data from January 1 to April 31 during water years 2008–12, and an estimated hydrograph was created; limitations are discussed
in “Extension of Streamflow Record” section.
In 2012, the U.S. Geological Survey (USGS) published In recent years, Colorado Department of Public Health
an analysis of water-quality data in the UYRB for 1975–2009 and Environment (CDPHE) interim concentrations for
(Bauch and others, 2012). The USGS concluded that water-quality standards (Regulation No. 31; CDPHE, 2017)
concentrations of constituents in surface water are likely and concerns related to algae blooms in Stagecoach Reservoir
controlled primarily by geological features, streamflow, and have become important topics to local stakeholders (Halliday,
land use, but that additional streamflow data were needed 2016). The potential for cyanobacterial blooms and elevated
to assess the effects of land use and geological features on phosphorus concentrations have been documented since the
observed water quality in the basin. Analysis of changes in completion of the Stagecoach Reservoir in 1993 (Bureau of
water quality over time was limited because of the absence of Reclamation, 1986). Cyanobacterial blooms in Stagecoach
long-term data collected in the UYRB (Bauch and others, 2012). Reservoir have been observed with increasing frequency in
In response to these information gaps, the USGS and local the past several years (2015–18), and there have been anec-
stakeholders established a comprehensive long-term water-quality dotal reports by residents and land managers of blooms in the
monitoring program for the UYRB in October 2010, which main stem of the Yampa River below Stagecoach Reservoir,
continues to the present day (2020). Six sites in the monitoring drawing additional interest from stakeholders. Direct and
program (table 1) were selected for this study as representative indirect effects of land use, hydrology, and climate change can
of different geologic and land-use types in the UYRB to enhance exacerbate conditions that favor bloom-forming algae, some
understanding of how these factors influence water quality.4 Assessment of Streamflow and Water Quality in the Upper Yampa River Basin, Colorado, 1992–2018
of which can produce toxins that are harmful to humans and and in the reservoir. Cyanobacteria blooms of Aphanizomenon
animals, degrade water quality, and decrease water supply sp. and Aphanocapsa sp. were measured in the reservoir dur-
(Paerl and Otten, 2013). ing 1990–92.
In 2019, the USGS, in cooperation with stakeholders The USGS has studied the water quantity and quality, and
in the water community, began this study to evaluate tempo- aquatic ecology, of the Upper Yampa River watershed (Bauch
ral and spatial trends in streamflow, water temperature, and and others, 2012). The Bauch study (2012) summarized avail-
water-quality data in the basin. Water-quality data include able water-quality, water-quantity, and aquatic-ecology data
suspended sediment, Kjeldahl nitrogen, total nitrogen, total collected from 1975 to 2009 by various agencies for streams,
phosphorus, orthophosphate, dissolved oxygen, planktonic lakes, reservoirs, and groundwater. Bauch and others (2012)
algal densities, and algal toxin concentrations for streams found a statistically significant upward trend in total phospho-
and Stagecoach Reservoir. The involved stakeholder groups rus concentration at Yampa River at Steamboat Springs, Colo.
are the Upper Yampa River Watershed Group, Upper Yampa (USGS site number 09239500), herein referred to as “Yampa
Water Conservancy District, Colorado Water Conservation River at Steamboat Springs.” Bauch and others (2012) indi-
Board, Yampa-White-Green Basin Roundtable, Mount Werner cated that population growth and land-use changes may have
Water and Sanitation District, Routt County, and the city contributed to the trend.
of Steamboat Springs. This analysis provides an enhanced The Upper Yampa River Watershed Plan (Halliday, 2016)
understanding of water resources for the region and high- was initiated by the Upper Yampa Watershed Group in 2013.
lights potential impairments to water supply and the ecologi- The purpose of the plan is to increase local partnerships and
cal health of the basin. This study utilized streamflow and their capacity to protect and enhance water quality, promote
water-quality data collected by the USGS to characterize and water conservation, and sustain and improve the present health
identify changes in streamflow and selected water-quality of the basin.
constituents in the UYRB.
Description of the Study Area
Purpose and Scope
The UYRB drains approximately 2,100 square miles
This report describes an assessment of streamflow of the Yampa River Basin west of the Continental Divide
and water-quality data in the UYRB in Colorado during in northwestern Colorado (fig. 1). The boundaries of the
1992–2018. The time periods for analysis and site selections basin extend from the Williams Fork and the Flat Tops in the
were done to provide a better understanding of how major southwestern and southern parts of the basin, respectively, to
factors, including land use and geological features, may con- the Gore and Park Ranges and the Continental Divide to the
tribute to trends in streamflow and water quality in the UYRB east and to the Elk River and Fortification Creek drainages
study area. This report includes a summary of these results, to the north and west, respectively. Elevations in the basin
which may facilitate resource management decisions regard- range from more than 12,000 feet (ft) (above North American
ing water supply, water quality, and algal-sourced toxicity Vertical Datum of 1988) in the Flat Tops and Park Range to
concerns. This report (1) describes seasonal variation and tem- 6,100 ft (above North American Vertical Datum of 1988) near
poral trends in streamflow, suspended sediment, and nutrient the confluence of the Yampa River with Fortification Creek
concentrations and loads; (2) provides comparisons of nutrient south of the city of Craig. Most of the UYRB is within Routt
concentrations to State of Colorado interim concentrations for County, with small parts in Grand, Garfield, Jackson, Moffat,
water-quality standards; (3) identifies subbasins with higher and Rio Blanco Counties.
suspended sediment and nutrient yields; (4) summarizes water The population of Routt County during 2018 was
temperature, water-quality and algal data for Stagecoach estimated to be 25,733 (U.S. Census Bureau, 2020). The
Reservoir; and (5) describes land-cover changes in the basin. population of the county grew by more than 9.5 percent from
2010 through 2018, and the growth was largely driven by
recreation-related tourism. The largest municipality in the
Previous Studies UYRB is Steamboat Springs (13,212 residents) and the next
largest is Craig (8,888 residents).
Several studies have investigated streamflow and water
For the greater part of the past century, ranching, includ-
quality in the UYRB. Tobin (1996) assessed the initial effects
ing hay and wheat production, and mining were the economic
of the construction and filling of Stagecoach Reservoir on the
base of the Yampa River Valley. More recently, recreation-
hydrology of the Upper Yampa River. The study examined
based tourism, including skiing, fishing, hunting, rafting, and
physical, chemical, and biological data collected from 1988
camping, and second-home development, became economic
to 1991 at sites upstream and downstream from the reservoir
drivers. Tourism accounted for approximately 37 percent ofIntroduction 5
the total jobs in Routt County during 2018, whereas mining Surface water in the UYRB is utilized for multiple uses.
and agriculture accounted for only about 7 percent of the total The principal use of water is for irrigation, and irrigation
jobs during the same year (Colorado State Demography Office, ditches divert water from the Yampa River and tributary
2018). During 2018, tourism accounted for only 8 percent of the streams throughout the basin. The ditch water is used
total jobs in Moffat County, whereas mining and agriculture primarily to irrigate hay and alfalfa crops and pasture lands.
accounted for 25 percent of the total jobs (Colorado State Total surface-water withdrawals for irrigation purposes in
Demography Office, 2018). Routt and Moffat Counties were 171 and 121 million gallons
Temperature and precipitation in the UYRB are typical per day in 2015, respectively (Dieter and others, 2018).
of that found in other mountainous and semiarid regions The city of Steamboat Springs Utilities Division and
of Colorado. Mean temperatures in the cities of Steamboat the Mount Werner Water and Sanitation District divert most
Springs and Craig range from minimum temperatures of 3.2 of their municipal water supplies directly from Fish Creek
and 6.6 degrees Fahrenheit (°F), respectively, during January, east of Steamboat Springs (AECOM and Colorado Water
to maximum temperatures of 82.6 and 85.3 °F, respectively, Conservation Board, 2009). Water can be released from Fish
during July from 1977 to 2020 (High Plains Regional Climate Creek Reservoir for augmentation when flow in the creek is
Center, 2020). On average, almost 25 inches per year (in/ insufficient for supply. These two municipal water suppliers
yr) of precipitation falls in Steamboat Springs, and 16.5 in/ can also withdraw water from alluvial wells adjacent to
yr falls in Craig. Much of the precipitation is snow during the Yampa River; however, these wells are not a preferred
winter months. Snowfall means are 181 in/yr in Steamboat source of municipal water because the quality of the water is
Springs and 77 in/yr in Craig (High Plains Regional Climate considered to be inferior to that of the surface-water supplies
Center, 2020). (AECOM and Colorado Water Conservation Board, 2009).
Much of the UYRB is underlain by sedimentary rocks of The city of Craig diverts most of its municipal water from
Cretaceous age, including sandstones, shales, and major coal the Yampa River upstream from Fortification Creek. Surface
beds (fig. 2). Less resistant shales in the form of broad valleys water is the primary water source for the towns of Hayden and
and small rounded hills are found in the western two-thirds of Oak Creek, whereas groundwater is the primary water source
the basin and with more resistant sandstones found in areas as for towns of Phippsburg and Yampa and part of the source for
ridges and mesas (Bauch and others, 2012). Hayden (Topper and others, 2006).
The nine largest reservoirs in the UYRB, each with
storage capacity greater than (>) 4,000 acre-feet, store
Hydrology and Water Use water that is used for irrigation, recreational, and municipal
The Yampa River originates in the Flat Tops as the Bear purposes (AECOM and Colorado Water Conservation Board,
River, flows northward to the town of Yampa, Colo., and 2009). Stillwater Reservoir No. 1, Allen Basin Reservoir,
becomes the Yampa River where Phillips Creek converges and Yamcolo Reservoir store water primarily for irrigation;
with the Bear River (fig. 1). Major tributaries to the Yampa Lake Catamount, Pearl Lake, and Steamboat Lake are
River include Oak Creek, upstream from Steamboat Springs; predominantly used for recreation and fishing; Fish Creek
the Elk River, downstream from Steamboat Springs; and Reservoir stores water for municipal use; and Stagecoach
Elkhead Creek, downstream from Hayden, Colo. Minor Reservoir and Elkhead Reservoir store water for multiple
tributaries include Fish Creek east of Steamboat Springs, Trout purposes, including municipal, industrial, irrigation, and
Creek, Sage Creek, and Fortification Creek. recreation (fig. 1). Stagecoach Reservoir, upstream from
Streamflow in the UYRB is dominated by snowmelt Steamboat Springs on the Yampa River, is the largest storage
runoff; streamflows increase in April, peak in May and facility in the UYRB with a total capacity of approximately
June, and decrease in July (USGS, 2020). Streamflow from 36,500 acre-feet. Allocation of water from the Stagecoach
August through March is often dominated by base flow from Reservoir includes approximately 18,000 acre-feet for
groundwater discharge and supplementation from reservoirs. recreation and dead-pool storage, 11,000 acre-feet for
Mean monthly streamflow for water years (WYs) 2013 industrial water, and 2,000 acre-feet for municipal water. An
through 2018 for 2 sites on the Yampa River and 1 site on the additional 2,000 acre-feet is unallocated water for municipal
Elk River show seasonal patterns of streamflow (fig. 3). A WY and industrial purposes (AECOM and Colorado Water
is the 12-month period from October 1 through September 30 Conservation Board, 2009). The dam at Stagecoach Reservoir
and is designated by the year in which it ends. supports a hydroelectric power station, and the dam and
reservoir are owned and operated by the Upper Yampa Water
Conservancy District. There are no main-stem reservoirs
downstream from Steamboat Springs.6 Assessment of Streamflow and Water Quality in the Upper Yampa River Basin, Colorado, 1992–2018
–106°45'
–107°00'
–107°30'
–107°15'
River
40°45' Elk
eek
Cr
d
he a
Elk
11
10 pa River 8
Yam
40°30'
12 9 7 6
5
3 4
iver
EXPLANATION aR 1 2
40°15'
Yamp
Cretaceous-age sandstones and shales
Yampa coal field
Upper Yampa River Basin boundary
12 USGS streamgage or water-quality
site (table 1)
0 5 10 15 20 MILES
Base from U.S. Geological Survey digital data, 1:750,000, 2020
40°00' 0 5 10 15 20 KILOMETERS
Geographic Coordinate System North America 1983 projection
Decimal degrees
North American Datum of 1983
Figure 2. Map showing Cretaceous-aged sandstones, shales, and major coal beds of the Upper Yampa River Basin, Colorado.
Modified from Tweto (1979) and Kirschbaum and Biewick (2000). (USGS, U.S. Geological Survey)Approach and Methods 7
Mean monthly streamflow for water years 2013 through 2018,
4,000
in cubic feet per second
3,000
2,000
1,000
0
ne
ch
ry
ay
r
r
r
y
ly
r
st
ril
be
be
be
be
ar
gu
ua
Ju
Ju
ar
M
Ap
nu
em
to
m
m
M
Au
br
ve
ce
Oc
Ja
pt
Fe
No
De
Se
Month
EXPLANATION
Site name
Yampa River at Steamboat Springs, CO
(site 7, table 1)
Elk River near Milner, CO (site 8, table 1)
Yampa River above Elkhead Creek near
Hayden, CO (site 10, table 1)
Figure 3. Graph showing the mean monthly streamflow, in cubic feet per second, at selected streamgage sites in the Upper Yampa
River Basin, Colorado (CO), for water years 2013 through 2018.
Approach and Methods Data Compilation and Quality Assurance
The approach of this study was to characterize and This study analyzed data collected and processed by
identify changes in streamflow and selected water-quality the USGS following USGS methods to assess streamflow
constituents in the UYRB. The constituents of interest and water-quality conditions in the UYRB. Streamflow data
were selected for analysis in consultation with local were collected and processed according to the methods in
stakeholders. The nature and extent of changes in streamflow Turnipseed and Sauer (2010). Water-quality data were col-
were examined. Statistical models were used to estimate lected following USGS protocols in the USGS National Field
concentrations and loads for suspended sediment, nitrogen, Manual (USGS, variously dated). Data for most water-quality
and phosphorus. Nitrogen and phosphorus concentrations constituents for streams were collected quarterly to capture
were compared to State of Colorado interim concentrations seasonal changes in concentrations related to changes in
for water-quality standards. Streamflow-normalized loads streamflow (for example, spring runoff, summer base flow).
and yields were used to compare water quality across sites Water-quality data from Stagecoach Reservoir were collected
and identify source areas of loading. Trends in concentration once a month from July to September in 2017 and 2018.
and load were examined. Selected physical, chemical, and Data for water-quality constituents are reported as
biological characteristics of Stagecoach Reservoir were filtered (through a 0.45-micron filter, dissolved) or unfiltered.
assessed. Changes in land use in the UYRB were assessed Data may also be reported as total; for example, total nitro-
using spatial data. All data analysis was performed in R gen includes all chemical species of nitrogen. Total nitrogen
(R Core Team, 2020). represents all inorganic and organic species of nitrogen present
in a stream and is a calculated value that comprises separate8 Assessment of Streamflow and Water Quality in the Upper Yampa River Basin, Colorado, 1992–2018 measures of inorganic and organic chemical species. At the Time periods were selected for analysis to capture the sites considered in this study, total nitrogen was calculated effects of reservoir construction, maximize comparability as the sum of unfiltered nitrite plus nitrate and unfiltered among sites, and limit the use of censored data. The year Kjeldahl nitrogen (organic nitrogen plus ammonia), herein 1992 was chosen as the starting year for streamflow trend referred to as “Kjeldahl nitrogen.” At multiple sites in this analysis because construction of a major reservoir, Stagecoach study, >50 percent of total nitrogen values were censored, Reservoir, was completed and the reservoir was filled to meaning that either one or both of the constituents used spillway capacity by that time (Tobin, 1996). The period of to calculate total nitrogen were reported as “less than” the analysis for water-quality data for five stream sites began in long-term method detection level concentration. Most regres- April 2010 when the UYRB Monitoring Program was initi- sion techniques require less than (
Approach and Methods   9

and Elk River near Milner. All model fits (coefficient of          Concentration and Load Estimates
determination [R2]) were >0.95 and met the assumptions of the
MOVE.2 analysis. Input and output streamflows associated                 Multilinear regression techniques were used to estimate
with the MOVE.2 analysis are included in the data release          concentrations and loads of suspended sediment and nutri-
(Day, 2021). Because of the large proportion of streamflow         ent constituents at sites that met selection criteria, including
data estimated, Yampa River at Milner and Yampa River              sample period of record, sample density, and percentage of
below Oak Creek were not included in the streamflow trend          data censored. Seven sites met the criterion of having a mini-
analysis. These sites were used in regression equations to         mum of 8 years of water-quality data with at least 20 observa-
estimate concentrations and loads; however, interpretation         tions (Runkel and others, 2004). Regression models define the
of these results warrants a higher degree of caution because       relation between the concentration of a selected water-quality
errors in the estimated hydrograph will be propagated into         constituent and explanatory variables, such as daily mean
concentration and load calculations.                               streamflow, seasonality, and time (Cohn, 2005; Helsel and
                                                                   others, 2020). Each explanatory variable explains part of the
                                                                   variation in the response variable. The regression model used
Streamflow Trend Analysis                                          to calculate daily concentrations and loads was developed
                                                                   using the R-LOADEST program (Lorenz and others, 2015),
      To explore the nature and extent of changes in streamflow
                                                                   which is an R-based version of the USGS statistical program
in the UYRB, this study reviewed temporal changes in daily
                                                                   LOAD ESTimator (LOADEST; Runkel and others, 2004).
streamflow statistics for 5 main-stem Yampa River sites and 3
                                                                   R-LOADEST uses up to six explanatory variables to build a
tributary sites on an annual and monthly basis. The time period
                                                                   regression model that defines the relation of a constituent to
of analysis for assessing trends in streamflow extended from
                                                                   streamflow, time, and season. The general form of the multiple
climate year (CY) 1992, when the Stagecoach Reservoir was
                                                                   linear regression model is as shown in equation 1:
completed, to CY 2018. A CY is defined as a 12-month period
beginning April 1 and ending March 31 of the following year
and is designated as the year in which it begins. Climatic years
                                                                   lnC=b0+b1(lnQ−lnQ*)+b2(t−t*)+b3(sin(2πT))+b4(cos(2πT))+e,(1)
are used in streamflow trend analysis to avoid breaking a long
low-flow period (that is, November to February) into two
                                                                         where
segments. Elkhead Creek above Long Gulch near Hayden, CO
                                                                            ln     is the natural log;
(USGS site number 09246200), herein referred to as “Elkhead
                                                                            C      is the constituent concentration, in milligrams
Creek above Long Gulch,” had a slightly shorter time period
                                                                                       per liter;
of analysis, from CY 1996 through CY 2018. Streamflow
                                                                             b0    is the regression equation intercept;
trends were examined across a longer time scale at Yampa
                                                                             bn    is the coefficient on the nth regression
River at Steamboat Springs, from CY 1910 through CY 2018,
                                                                                       variable, where n is 1 through 4;
to examine long-term trends in streamflow. Streamflow sta-
                                                                             Q     is a streamflow term, in cubic feet per second;
tistics included 1-day maximum, mean, and 7-day minimum,
                                                                            Q*     is the streamflow centering value, in cubic
and were assessed using the R package Estimation of Graphics
                                                                                       feet per second;
for RivER Trends, also known as EGRET (Hirsch and De
                                                                              t    is time, in decimal years;
Cicco, 2015). Trend slopes were calculated using the Thiel-
                                                                             t*    is the time centering value from the
Sen slope estimator and expressed as percentage changes per
                                                                                       calibration dataset, in decimal years;
decade (Hirsch and De Cicco, 2015). The statistical strength
                                                                            sin    is the sine function;
of the trends was assessed using the Mann-Kendall trend test,
                                                                              π    is 3.14159;
and 90-percent confidence intervals were used to determine
                                                                              T    is the decimal part of the year starting
significance.
                                                                                       January 1;
      Changes in timing of peak streamflow were also assessed
                                                                           cos     is the cosine function; and
at Yampa River at Steamboat Springs from WY 1910 through
                                                                             e     is the error associated with the regression
WY 2018. The mean date of peak streamflow was obtained
                                                                                       equation.
by averaging dates of peak streamflow obtained from NWIS
(USGS, 2020) across the period of analysis. Deviation from               Loads were calculated by multiplying sample concentra-
the mean peak streamflow date was calculated as the differ-        tions or regression estimates by daily mean streamflow and a
ence between the peak streamflow date for each year from the       unit conversion constant. Concentration and streamflow values
mean peak streamflow date for the period of analysis. Linear       were log transformed to meet the assumptions of normality
regression was used to look for trends in deviation of peak        and constant variance (Hirsch and others, 1991). Streamflow
streamflow date from the long-term mean, where a downward          and decimal time were centered around their means to reduce
slope would correspond to an earlier peak streamflow date.         the likelihood of multicollinearity and to ensure orthogonal-
                                                                   ity in the streamflow and decimal time variables (Cohn and
10 Assessment of Streamflow and Water Quality in the Upper Yampa River Basin, Colorado, 1992–2018
others, 1992). A Fourier series was used to account for differ- for Surface Waters was revised to include interim concentra-
ences in seasonal load (Runkel and others, 2004; Cohn, 2005). tions for total nitrogen, total phosphorus, and chlorophyll
A Fourier series uses sine and cosine functions to describe a for rivers and streams, and lakes and reservoirs (table 2).
continual change over the seasonal period. Model coefficients Estimated daily and median concentrations for 7 stream sites
were estimated using adjusted maximum likelihood estima- and discrete concentrations at 1 stream site and 1 reservoir site
tion, which is designed to correct for bias caused by the inclu- in the UYRB were compared to CDPHE interim concentra-
sion of censored data (Runkel and others, 2004). tions for nitrogen and phosphorus for cold water.
The final model equations were selected by compar-
ing Akaike Information Criteria scores, diagnostic plots, and
statistics (Runkel and others, 2004) that are used to indicate Normalized Mean Daily Streamflows, Loads,
whether the model fit met the assumptions of multilinear and Yields
regression (Helsel and others, 2020). A consistent model form
was used among sites where Fourier series and decimal time Normalized mean daily streamflows, loads, and yields
were retained at an alpha of 0.05, and the streamflow variable were estimated for seven sites in the UYRB (table 1). Daily
was always included to facilitate comparison among sites. The mean streamflow values for a site were averaged to produce
adjusted R2 indicates how much variance in the response vari- a mean daily streamflow for each day of the calendar year
able is explained by the regression model (Helsel and others, during the period of analysis for that site. An averaging func-
2020). Values of adjusted R2 closer to 1.0 indicate that more tion available on the National Water Information System
of the variance is being explained by the model compared to website (https://waterdata.usgs.gov/co/nwis/dvstat/) was used
values closer to 0.0, which indicate that less of the variance to calculate the normalized mean daily streamflow. At sites
is being explained by the model. Regression analysis was with an estimated hydrograph, the averaging was performed
performed on water-quality data at 2 sites for WYs 1999–2018 in R. For example, the mean daily streamflow for January 1,
and at 5 sites for WYs 2010–18 (table 1). All input and output 2010–18, at Elk River near Milner was calculated from each
data associated with the regression analysis are included in the January 1 value from the beginning of the analysis period
data release (Day, 2021). through the end of the analysis period (2010–18). Calculating
a mean daily streamflow for every day of the year removes
differences in the year-to-year fluctuations in daily streamflow
Comparison to Interim Concentrations for and allows estimates of annual load for water-quality constitu-
Water-Quality Standards ents (Helsel and others, 2020). Regression models using the
mean daily streamflows were used to predict annual loads at
Estimated daily concentrations of nitrogen and phos- each of the seven sites. All input and output data associated
phorus, as well as annual median concentrations calculated with the regression analysis are included in the data release
from estimated daily concentrations, were compared to State (Day, 2021).
of Colorado interim water-quality standards for nitrogen and Relative yields were calculated for seven subbasins
phosphorus concentrations. Instream water-quality standards (fig. 1) by dividing the regression-based estimates of annual
for surface water in Colorado have been established by the load at each site by the total subbasin area contributing to that
CDPHE to protect the beneficial uses of surface water, which site, after excluding all upstream subbasin loads and basin
include support of aquatic life, and use for domestic water areas. The normalized loads and yields can be used to assess
supply, agriculture, and recreation (CDPHE, 2017). In 2012, the influence of land-use activities, population, and water
Regulation No. 31—The Basic Standards and Methodologies consumption on water quality.
Table 2. Colorado Department of Public Health and Environment (CDPHE) interim concentrations for total nitrogen, total phosphorus,
and chlorophyll a water-quality standards for surface water in the Upper Yampa River Basin, Colorado (CDPHE, 2017).
[mg/L, milligrams per liter; mg/m2, milligrams per square meter; µg/L, micrograms per liter]
Constituent Cold rivers and streams Cold lakes and reservoirs
Total nitrogen 1.25 mg/La 0.426 mg/Lb
Total phosphorus 0.11 mg/La 0.025 mg/Lb
2c
Chlorophyll a 150 mg/m 8.0 µg/Lb
a
Annual median, allowable exceedance frequency 1-in-5 years.
b
Summer (July 1–September 30) mean in the mixed layer of the lakes (median of multiple depths), allowable exceedance frequency 1-in-5 years.
c
Summer (July 1–September 30) maximum attached algae, not to exceed.Approach and Methods 11
Concentration and Load Trend Analysis day for which an estimate is sought. The degree of similar-
ity and, thus, weight on each observation, is based on their
Characterizing long-term changes (trends) in water- similarity in terms of time, streamflow, and season to the day
quality constituents can provide insight regarding changes in being calibrated. The variable-parameter weighted-regression
land use and climate. Trends can be compared among sites approach allows WRTDS to represent complex relations
across a common time period. A trend is often presented as between concentration and streamflow at a site, as well as
a percentage change per year, or change in concentration complex trends over time.
(milligrams per liter [mg/L]) or load (tons) per year, and Because estimates of daily concentration and load are
is described by the direction of change, either upward or strongly influenced by random variations in streamflow,
downward. Two different methods were used to assess trends WRTDS also produces flow-normalized estimates of daily
in water quality as a function of data availability. Trends in concentration and load for a site. The flow-normalized esti-
concentrations and loads of suspended sediment, nitrogen, mates remove variations in concentration or load resulting
and phosphorus were assessed using multiple linear regres- from random streamflow variations but not variations from
sion models at seven sites. An additional method for assessing nonrandom seasonal streamflow variations. See Hirsch and De
trends, using a weighted regression technique, was applied at Cicco (2015) for more details.
two sites that met the requirements for such analysis. Confidence intervals on trend analysis were obtained
using the WRTDS Bootstrap Test, which is a block boot-
strap approach that uses a set of Monte Carlo simulations to
Multiple Linear Regression Trend Analysis estimate Type I error probability (that is, the probability of
Multiple linear regression techniques can be used to detecting a trend when a trend is not present; Hirsch and oth-
estimate long-term changes in mean concentrations and loads ers, 2015). The WRTDS Bootstrap Test output includes (1)
of water-quality constituents during a designated time scale. hypothesis tests for trend flow-normalized concentration and
The coefficients of a regression model describe the size and flow-normalized load (reject or do not reject the null hypoth-
direction of the relation between a predictor and the response esis at alpha = 0.1), (2) p-values for those tests, (3) 90-percent
variable (Helsel and others, 2020). Thus, the presence of a sig- confidence intervals for the magnitude of the trend in flow-
nificant time coefficient was interpreted to indicate a temporal normalized concentration and flow-normalized load, and (4)
trend (either upward or downward) in concentration and load. likelihood statements (in numerical form and as descriptive
A significance level (α) of 0.1 was applied to the time coeffi- statements) about trends in flow-normalized concentration and
cient for inclusion in the regression model. flow-normalized load. Likelihood designations are computed
from the two-sided attained p-value and follow the pattern
described in Hirsch and others (2015) where a range of likeli-
Weighted Regression Trend Analysis hood values from 0.95 to 1.0 is considered “highly likely,”
0.90 toYou can also read