Pathways to Sustainable Land-Use and Food Systems - 2020 Report of the FABLE Consortium
←
→
Page content transcription
If your browser does not render page correctly, please read the page content below
2020 Report of the FABLE Consortium

 Pathways to
  Sustainable
Land-Use and
Food Systems
Published by International Institute for Applied Systems Analysis (IIASA) and the Sustainable Development
Solutions Network (SDSN) 2020

The full report is available at www.foodandlandusecoalition.org/fable.
For questions please write to info.fable@unsdsn.org

Copyright © IIASA & SDSN 2020

This work is licensed under a Creative Commons Attribution-NonCommercial-NoDerivatives 4.0
International License (CC-BY-NC-ND 4.0; https://creativecommons.org/licenses/by-nc-nd/4.0/).

Disclaimer
The 2020 FABLE Report was written by a group of independent experts acting in their personal capacities.
Any views expressed in this report do not necessarily reflect the views of any government or organization,
agency, or programme of the United Nations (UN). The country chapters use maps prepared solely by the
national teams. The boundaries, colors, denominations, and other information shown on any map in this
work do not imply any judgment on the part of SDSN or IIASA concerning the legal status of any territory or
the endorsement or acceptance of such boundaries.

Recommended citation: Gonzalez-Abraham C.E., McCord G., Olguin M., Rodríguez Ramírez S., Torres Rojo
J.M., Flores A., Alcantara Concepcion C., Pisanty I. and Bocco G. (2020), “Pathways to Sustainable Land-
Use and Food Systems in Mexico by 2050” In: FABLE 2020, Pathways to Sustainable Land-Use and Food
Systems, 2020 Report of the FABLE Consortium. Laxenburg and Paris: International Institute for Applied
Systems Analysis (IIASA) and Sustainable Development Solutions Network (SDSN), pp. 447-483.
https://doi.org/10.22022/ESM/12-2020.16896

Recommended Creative Commons (CC) License:
CC-BY-NC-ND 4.0 (Attribution-NonCommercial-NoDerivatives 4.0 International).

              Design, layout and production by Phoenix Design Aid A/S, a CO2 neutral company
              accredited in the fields of quality (ISO 9001), environment (ISO 14001) and CSR (DS 49001)
              and approved provider of FSC™ certified products. Printed on environmentally friendly
              paper without chlorine and with vegetable-based inks. The printed matter is recyclable.

                                                                                                              2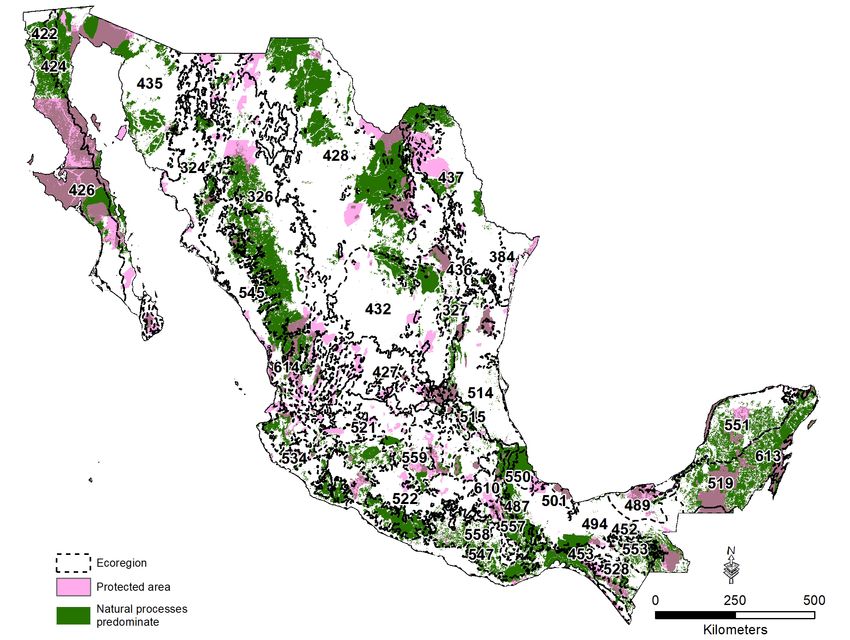
2020 Report of the FABLE Consortium

   Pathways to
    Sustainable
  Land-Use and
Food Systems in
 Mexico by 2050
Mexico

Charlotte E. Gonzalez-Abraham1*, Gordon McCord2, Marcela Olguin3, Sonia Rodríguez
Ramírez4, Juan Manuel Torres Rojo5, Arturo Flores6, Camilo Alcantara Concepcion7, Irene
Pisanty8, Gerardo Bocco8
Independent contractor, La Paz, Mexico; 2University of California, San Diego, USA; 3Independent contractor, Mexico,
1

Mexico; 4INSP, Cuernavaca, Mexico; 5CIDE, Toluca, Mexico; 6INP. Mexico, Mexico; 7UG, Guanajuato, Mexico; 8UNAM,
Mexico, Mexico.
*Corresponding authors: notoka.char@gmail.com, gmccord@ucsd.edu

This chapter of the 2020 Report of the FABLE Consortium Pathways to Sustainable Land-Use and Food Systems
outlines how sustainable food and land-use systems can contribute to raising climate ambition, aligning climate
mitigation and biodiversity protection policies, and achieving other sustainable development priorities in Mexico. It
presents two pathways for food and land-use systems for the period 2020-2050: Current Trends and Sustainable.
These pathways examine the trade-offs between achieving the FABLE Targets under limited land availability
and constraints to balance supply and demand at national and global levels. We developed these pathways in
consultation with national stakeholders and experts, including from the National Institute of Health (INSP) and the
Department of Agriculture and Rural Development (SADER), and modeled them with the FABLE Calculator (Mosnier,
Penescu, Thomson, and Perez-Guzman, 2019). See Annex 1 for more details on the adaptation of the model to the
national context.

                                                                                                                        4
Mexico
Climate and Biodiversity Strategies and Current Commitments
Countries are expected to renew and revise their climate and biodiversity commitments ahead of the 26th session of
the Conference of the Parties (COP) to the United Nations Framework Convention on Climate Change (UNFCCC) and the
15th COP to the United Nations Convention on Biological Diversity (CBD). Agriculture, land-use, and other dimensions
of the FABLE analysis are key drivers of both greenhouse gas (GHG) emissions and biodiversity loss and offer critical
adaptation opportunities. Similarly, nature-based solutions, such as reforestation and carbon sequestration, can
meet up to a third of the emission reduction needs for the Paris Agreement (Roe et al., 2019). Countries’ biodiversity
and climate strategies under the two Conventions should therefore develop integrated and coherent policies that cut
across these domains, in particular through land-use planning which accounts for spatial heterogeneity.
Table 1 summarizes how Mexico’s Nationally Determined Contribution (NDC) (Gobierno de México, 2015), Long-Term
Low Emissions and Development Strategy (LT-LEDS) (SEMARNAT 2016) treat the FABLE domains. According to the
LT-LEDS, Mexico has committed to reducing its GHG emissions by 50% by 2050 compared to 2013. This does include
emission reduction efforts from agriculture, forestry, and other land use (AFOLU). Envisaged mitigation measures
from agriculture and land-use change include encouraging agriculture practices that preserve and increase carbon
capture in soil and biomass (conservation cultivation and productive reconversion), changing livestock and forestry
production (silvo-pasture and agroforestry systems), and strengthening forest monitoring to avoid illegal logging
and forest fires (SEMARNAT, 2016). Under its current commitments to the UNFCCC, Mexico mentions biodiversity
conservation.
Table 1 | Summary of the mitigation target, sectoral coverage, and references to biodiversity and spatially-explicit
planning in current NDC and LT-LEDS
Total GHG Mitigation
Inclusion of Actionable
Mitigation Measures
Maps for Land-Use
Biodiversity (Y/N)
Related to AFOLU
Planning1 (Y/N)
Baseline Mitigation target
FABLE Targets
Links to Other
Mention of
(Y/N)
GHG emissions
Sectors
(Mt CO2e/yr)
included
Target
Year
Year
NDC 2013 665 2030 40% Energy, industrial Y Y N Water and
(2016) reduction processes, agriculture, deforestation,
land-use change and GHG emissions
forestry, and waste
LT-LEDS 2013 665 2050 50% Energy, industrial N/A N/A N/A Water and
(2016) reduction processes, agriculture, deforestation,
land-use change and GHG emissions
forestry, and waste
Note. “Total GHG Mitigation” and “Mitigation Measures Related to AFOLU” columns are adapted from IGES NDC Database (Hattori, 2019)
Source: Gobierno de Mexico (2015) for the NDC and SEMARNAT (2016) for the LT-LEDS
1 We follow the United Nations Development Programme definition, “maps that provide information that allowed planners to take action” (Cadena et al., 2019).
5Mexico Table 2 provides an overview of the targets included in the latest National Biodiversity Strategies and Action Plan (NBSAP) from 2016, as listed on the CBD website (CBD, 2020), which are related to at least nine of the FABLE Targets related to agriculture and climate change. In comparison with FABLE Targets, Mexico’s NBSAP targets have a more ambitious timetable. While they share the same principles, the NBSAPs intend to broaden the understanding and appreciation of biodiversity within and across sectors, and at all government levels, to ensure the continued provision of ecosystem services necessary for the well-being of the Mexican people (CONABIO, 2016). Table 2 | Overview of the NBSAP targets in relation to FABLE targets NBSAP Target FABLE Target (2.2) BIODIVERSITY: No net loss by 2030 and an Strategies are in place to integrate biodiversity in the following sectors: increase of at least 20% by 2050 in the area of agriculture, forestry, fisheries, and tourism. land where natural processes predominate (4.2) WATER: Blue water use for irrigation By 2030 Mexico counts with watersheds and aquifers in equilibrium, with an
Mexico

Brief Description of National Pathways
Among possible futures, we present two alternative pathways for reaching sustainable objectives, in line with the
FABLE Targets, for food and land-use systems in Mexico.

Our Current Trends Pathway corresponds to the lower boundary of feasible action. It is characterized by low population
growth (from 128 million in 2020 to 148 million in 2050) (CONAPO, 2018), significant constraints on agricultural
expansion, a low afforestation target, a 18% increase in the extent of protected areas, the same productivity growth
as over 2000 – 2010 for livestock (SIAP, 2020) and an evolution in diets similar to the trends between 2000 - 2010
(high in cereals and sugar, increased intake in oils and fats, roots, nuts and red meat) combined with low physical
activity, increased exports and imports compared to 2010 (see Annex 2). This corresponds to a future based on current
policy and historical trends that would also see considerable progress with regards to halting agricultural expansion
and a reconversion of cropland towards cultivation of high value exports (SAGARPA, 2017). Moreover, as with all FABLE
country teams, we embed this Current Trends Pathway in a global GHG concentration trajectory that would lead to a
radiative forcing level of 6 W/m2 (RCP 6.0), or a global mean warming increase likely between 2°C and 3°C above pre-
industrial temperatures, by 2100. Our model includes the corresponding climate change impacts on crop yields by 2050
for maize, rice, wheat, and soybeans (see Annex 2).

Our Sustainable Pathway represents a future in which significant efforts are made to adopt sustainable policies and
practices and corresponds to a high boundary of feasible action. Compared to the Current Trends Pathway, we assume
that this future would lead to improved diets that rely less on cereals and more on high intake of fruits, vegetables,
and pulses as well as animal protein in healthy quantities, a high afforestation target, 30% of the total land covered
by protected areas, and no expansion of agricultural area along with high productivity levels for crops and (a relative
increase of 48% for) livestock (see Annex 2). This corresponds to a future based mostly on the implementation of
current and ambitious public policies, and national and international commitments in areas of biodiversity use and
management, food production and land use. Mexico has a strong and ambitious General Law on Climate Change
and a multitude of public policies specifically designed to mitigate and reduce the negative effects generated on the
environment by its food and land use systems. It has also signed international agreements to protect its biodiversity
and reduce its GHG emissions. In the Sustainable Pathway we have incorporated some of the existing public policies
and international commitments to assess their impact on our model. With the other FABLE country teams, we embed
this Sustainable Pathway in a global GHG concentration trajectory that would lead to a lower radiative forcing level of
2.6 W/m2 by 2100 (RCP 2.6), in line with limiting warming to 2°C.

                                                                                                                      7
Mexico
Land and Biodiversity
Current State
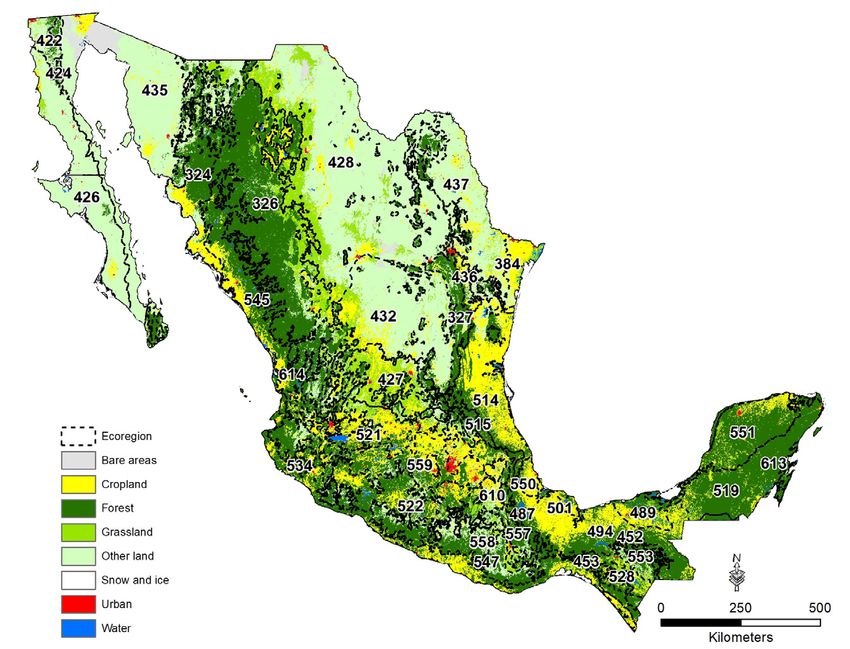
In 2010, Mexico was covered by 13% cropland, 41% pasture areas (mainly including induced pastures and semiarid
scrubland), 34% forest, 1% urban, and 12% other natural land. Most of agricultural areas are located in the center
of the country, the Gulf of Mexico coasts, and the central and southern part of the Pacific coast (Map 1). Temperate
forests can be found along the mountain ranges that run along the country from the northeast to the southeast
and from the northwest to the southwest, as well as the transversal mountain ranges in the south. Tropical
vegetation is distributed along the coasts either in the form of tropical dry forests or tropical humid forest. The
arid- to semiarid-lands climate zones are located in the north and represent more than 40% of the country. Other
natural land is distributed across the country. The main threat to biodiversity is severe and non-regulated land-use
change due to public policies that promote and incentivize agriculture expansion for the production of export crops
(berries, avocados, soy and sugar cane), agricultural incentives for smallholders to alleviate poverty, and free-range
cattle that roam across natural areas without restriction. Collateral effects of land-use change for agricultural
practices include pollution and degradation of agricultural lands and surrounding areas.
We estimate that land where natural processes predominate2 accounted for 28% of Mexico’s terrestrial land area
in 2010. In relative terms, the 453-Chimalapas montane forests holds the greatest share of land where natural
processes predominate, followed by 487-Oaxacan montane forests, and 424-California montane chaparral and
woodlands (Annex 4). Across the country, while 28 Mha (14%) of land is under formal protection, falling short of the
Map 1 | Land cover by aggregated land cover types in 2010 and ecoregions
Sources. countries - GADM v3.6; ecoregions
– Dinerstein et al. (2017); land cover – ESA
CCI land cover 2015 (ESA, 2017) Notes.
Correspondence between original ESA CCI
land cover classes and aggregated land cover
classes displayed on the map can be found
in Annex 3.
2 We follow Jacobson, Riggio, Tait, and Baillie (2019) definition: “Landscapes that currently have low human density and impacts and are not primarily
managed for human needs. These are areas where natural processes predominate, but are not necessarily places with intact natural vegetation, ecosystem
processes or faunal assemblages”.
8Mexico
30% zero-draft CBD post-2020 target, only 26% of land where natural processes predominate, including biodiversity
hot-spots, is formally protected. This indicates that only areas with abrupt topography and in Mexico’s arid north
(both important due to high levels of endemism) are likely to continue to experience low levels of transformation,
although water availability in specific dryland spots has been used for agriculture (e.g. cereals, tomatoes, and
alfalfa) causing their disappearance and the exhaustion of aquifers. On the other hand, tropical humid, dry, and
temperate forest are at risk without enough actions to better protect them.
Approximately 41% of Mexico’s cropland was in landscapes with at least 10% natural vegetation in 2020 (Map
2). These relatively biodiversity-friendly croplands are most widespread in 511-Yucatán dry forests followed by
519-Yucatán moist forests and 547-Southern Pacific dry forests. The regional differences in extent of biodiversity-
friendly cropland can be explained by regional long-term production practices that promote the regeneration of the
natural vegetation. The secondary vegetation in the Yucatan Peninsula is a result of these practices.
Map 2 | Land where natural processes predominated in 2010, protected areas and ecoregions
Note. Protected areas are set at 50% transparency, so on this map dark purple indicates where areas under protection and where natural processes
predominate overlap.
Sources. countries - GADM v3.6; ecoregions – Dinerstein et al. (2017); protected areas – UNEP-WCMC and IUCN (2020); natural processes predominate
comprises key biodiversity areas – BirdLife International (2019), intact forest landscapes in 2016 – Potapov et al. (2016), and low impact areas – Jacobson et al.
(2019)
9Mexico
Pathways and Results
Projected land use in the Current Trends Figure 1 | Evolution of area by land cover type and protected
Pathway is based on several assumptions, areas under each pathway
including constraints on the expansion
of agricultural land beyond its current 200
area by 2015, 2.3 Mha reforested by 2050,
and protected areas increase from 14 % 150
Current Trends
of total land in 2010 to 18% in 2050 (see
Annex 2).
100
By 2030, we estimate that the main
changes in land cover in the Current 50 Urban
Land Surface (Mha)
Trends Pathway will result from an Cropland
Pasture
increase in pasture and cropland area Other Land
0 New Forest
and a decrease in forest area. This trend
200 Forest
evolves over the period 2030-2050: forest
and new forest area increases, pasture 30% Protected
and cropland decreases (Figure 1). Initial 150 Area
Computed
Sustainable
pasture expansion is mainly driven by the
Protected Area
increase in internal demand for beef due 100
to its increasing role in the dietary mix,
while livestock productivity per head and
ruminant density per hectare of pasture 50
remains stable over the period 2010-
2050. Between 2030-2050, the decrease 0
in cropland and pasture area is explained 2000 2010 2020 2030 2040 2050
by the constraints in the expansion
of agricultural land and the slow but
Source. Authors’ computation based on FAOSTAT (FAO, 2020) for the area by land
steady increase of livestock productivity, cover type for 2000, and the World Database on Protected Areas (UNEP-WCMC &
increase in milk and beef imports, as well IUCN, 2020) for protected areas for years 2000, 2005 and 2010.
as a small rise in the population. This
results in a stabilization of land where
natural processes predominate at 27% by
2030, which remains the same by 2050
compared to 2010.
In the Sustainable Pathway, assumptions
on agricultural land expansion,
reforestation, and protected areas have
been changed to reflect public policies
aiming to improve crop productivity
instead of increasing agricultural area,
changes in livestock production systems
to include silvo-pastoral systems with
higher livestock productivity and as
10Mexico
well as international commitments for Figure 2 | Evolution of the area where natural processes
reforestation (Guevara Sanginés, Lara predominate
Pulido, Torres Rojo, & Betancourt Lopez,
2020; CIMMYT & SADER, 2018; SIAP, 2020). 40
The main assumptions include constraints
on the expansion of agricultural land
beyond its 2016 area, 8.4 Mha reforested by
2050, and protected areas increase from 14 70
% of total land in 2010 to 30 % in 2050 (see 35
% of Total Land
Surface (Mha)
Annex 2).
Compared to the Current Trends Pathway,
we observe the following changes regarding 60
the evolution of land cover in Mexico in the 30
Sustainable Pathway: (i) a slight reduction
in deforestation, (ii) the recovery of natural
land in the form of other lands (all other
types of vegetation in Mexico that are not 50
forest types), (iii) a reduction in pasture, 25
and (iv) an increase of reforested land. In
2010 2015 2020 2025 2030 2035 2040 2045 2050
addition to the changes in assumptions
regarding land-use planning, these changes Current Trends Sustainable
compared to the Current Trends Pathway
are explained by a change in diets in which
the consumption of fruit, vegetables, and
pulses increases combined with a reduction
in cereals and an implementation of
strategies to increase crop and livestock
productivity. This leads to an increase in the
area where natural processes predominate:
the area stops declining by 2025 and
increases to 40% between 2010 and 2050
(Figure 2).
11Mexico
GHG emissions from AFOLU
Current State
GHG emissions from Agriculture, Figure 3 | Historical share of GHG emissions from Agriculture, Forestry, and
Forestry, and Other Land Use Other Land Use (AFOLU) to total AFOLU emissions and removals by source
(AFOLU) accounted for 11.6% of in 2013
total emissions in 2013 (Figure 3).
Enteric fermentation and manure 103MtCO2e
management are the main sources 16MtCO2e Source of AFOLU
of AFOLU emissions, followed by IPPU Emissions
agricultural soils and field burning 6.8%
38MtCO2e Agricultural Soils
of agricultural residues. This can AFOLU Enteric Fermentation
Energy 638MtCO2e Manure Management
be explained by an increase in beef 73.3%
16.1%
15MtCO2e
Other (Agriculture)
consumption over the last 10 years Waste
Land−Use Change and
3.8%
due to dietary changes (Ibarrola- 32MtCO2e Forestry
Rivas & Granados-Ramírez, 2017;
Rivera, Barquera, González-
Cossío, Olaiz, & Sepúlveda, 2004;
Tello, Garcillán, & Ezcurra, 2020), Note. IPPU = Industrial Processes and Product Use
Source. Adapted from GHG National Inventory (UNFCCC, 2020)
consequently increasing the
amount of cattle responsible for
enteric fermentation, producing
methane. Methane production
is a serious problem linked to Figure 4 | Projected AFOLU emissions and removals between 2010 and
inefficiencies in bovine diets 2050 by main sources and sinks for the Current Trends Pathway
associated with traditional livestock
production systems in temperate 150
and tropical regions (Morante López
GHG Emissions (MtCO2e)
et al., 2016). Additional important
factors are the slash-and-burn Difference in Net Emissions compared
100
cultivation practices used in the with Current Trends in 2050
southeastern region of the country,
the burning of grassland to induce
Sustainable
revegetation and the increase 50
− 76MtCO2e
in dry matter production for
livestock breeding, and of course,
the traditional practice of burning 0
rather than harvesting residues 2010 2015 2020 2025 2030 2035 2040 2045 2050
(SEMARNAT, 2010). In the other
Land Use Crops Livestock Biofuels
extreme, high intensity agricultural
Net AFOLU Emissions: Current Trends Sustainable
practices involve the application of
large quantities of fertilizers and
pesticides for prolonged periods of
12Mexico
time, which are often applied incorrectly thus producing Figure 5 | Cumulated GHG emissions reduction
important volumes of GHG (Flores Lopez et al., 2012). computed over 2020-2050 by AFOLU GHG emissions
and sequestration source compared to the Current
Trends Pathway
Pathways and Results
Sustainable
Under the Current Trends Pathway, annual GHG −240
Absolute Change in CO2 Removals and Emissions (MtCO2e)
emissions from AFOLU increase to 81 Mt CO2e/yr −220
in 2030, before reaching 86 Mt CO2e/yr in 2045 and
−200
dropping to 85.2 Mt CO2e/yr in 2050 (Figure 4). In 2050,
livestock production is the largest source of emissions −180
(48 Mt CO2e/yr) while new forest act as a sink (-10.5 Mt −160 AFOLU GHG
CO2e/yr). Over the period 2020-2050, the strongest Sources and
−140
relative increase in GHG emissions is computed for Sinks
−120 Crops
deforestation (164%) while a slight reduction is Deforestation
computed for crop production (-7.1%). −100 Livestock
Other Land Use
−80 Sequestration (Sink)
In comparison, the Sustainable Pathway leads to a GHG Biofuels (Sink)
−60
reduction in AFOLU GHG emissions by 89% by 2050
compared to the Current Trends Pathway (Figure 4). The −40
potential emissions reductions under the Sustainable −20
Pathway is dominated by a reduction in GHG emissions
0
from land use change and livestock production
(Figure 5). Change in diets, adoption of strategies to
increase productivity in crops and livestock are the most
important drivers of this reduction. Furthermore, carbon sequestration can be enhanced
by implementing programs that promote vegetation
Compared to Mexico’s commitments under UNFCCC restoration and reforestation programs linked to agro-
(Table 1), our results show that AFOLU could contribute silvicultural practices such as the “Sembrando Vida
to as much as 23% of its total GHG emissions reduction Program” (DOF - Diario Oficial de la Federación 2020),
objective by 2050. Such reductions could be enhanced the National Restoration program and a multitude of
through the implementation of policy measures private and civil society initiatives (e.g. Reforestamos
nationwide that would increase agricultural productivity. Mexico, Reforestación Extrema, among others) which
This can be done by improving the genetic base and add up to the reforestation commitments of the
updating agricultural practices for the production of corn country (DC 2014). In addition, initiatives aimed to
and other grains. The MASAGRO program led by CIMMYT reduce pressure on land use change such as: a) the
has been shown to be efficient in reaching this goal, by restoration of traditional systems of cattle ranching
introducing a strong capacity building program based through the introduction of silvopastoral systems, b)
on productivity gains and the adoption of genetically the introduction of high productivity agrosilvicultural
improved seeds and cultural practices adapted to each systems with the use of high value crops in the
municipality (CIMMYT and SADER 2018). For cattle agriculture-forest interface, and c) support to
ranching systems, increases in productivity could be different demand-driven mechanisms to increase
achieved through the adoption of silvopastoral practices, demand for products with a deforestation-free supply
which improve the menu of feeding components of chain, contributing to the recovery of low agricultural
traditional cattle diets, increasing weight gains and productivity areas into natural vegetation lands.
the herd carrying capacity per unit of area (Alejandro These measures could be particularly important when
Guevara Sanginés et al. 2020). considering options for NDC enhancement.
13Mexico
Food Security
Current State
The “Triple Burden” of Malnutrition
Micronutrient Overweight/
Undernutrition Deficiency Obesity
10% of children under 5 years 12.6% of women, 26.9% of preschoolers and In 2016, 41.7% of men and 37% of
were stunted and 1.9% were 12.5% of school children suffer from anemia women were overweight; 32.4%
wasted in 2016 (Cuevas-Nasu in 2016, which can lead to maternal death of men and 37.5% of women were
et al., 2018). (Cruz-Góngora, Martínez-Tapia, Cuevas-Nasu, obese (Instituto Nacional de Salud
Flores-Aldana, & Shamah-Levy, 2017). Pública & Secretaría de Salud,
2020).
The share of stunted
children has decreased 54.8% of women had a dietary intake less
from 13.6% in 2012; while than the requirement of vitamin A in 2012 In preschool children, 5.8% of girls
the share of wasted (Pedroza-Tobías et al., 2016). By biochemical and 6.5% of boys were overweight
children has increased from indicator, 15.7% of preschool children (12 to or obese in 2016. In scholar children
1.6% in 2012 (Cuevas-Nasu 59 months) were deficient in vitamin A in (5-11 years old) the prevalence of
et al. 2018). 2012 (Villalpando, De la Cruz, Shamah-Levy, overweight and obesity in girls was
Rebollar, & Contreras-Manzano, 2015), which 20.6% and 12.2% respectively, while
can notably lead to blindness and child in boys, it was 15.4% and 18.3%
mortality. in 2016 (Hernández-Cordero et al.,
2017).
For adolescents, the prevalence of
overweight was 26.4% in girls and
18.5% in boys; and obesity 12.8%
in girls and 15% in boys in 2016
(Hernández-Cordero et al. 2017).
These shares were similar between
the age groups, except in female
adolescents and adults, whose
prevalence increased compared to
2012 (Instituto Nacional de Salud
Pública & Secretaría de Salud,
2020; Shamah-Levy et al., 2018).
14Mexico
Disease Burden due to Dietary Risks
189 toMexico
Pathways and Results
Under the Current Trends Pathway, compared to the average Minimum Dietary Energy Requirement (MDER) at the
national level, our computed average calorie intake is 25% higher in 2030 and 21% higher in 2050 (Table 3). The current
average intake is mostly satisfied by eggs, red meat, roots and sugars, with cereals representing 60% of the total
calorie intake. We assume that the consumption of roots, dairy and red meat, will increase by 173%, 25%, and 42%,
respectively, between 2020 and 2050. The consumption of nuts, fruits and vegetables, and eggs will also increase while
the consumption of cereals, poultry, and sugar will slightly decrease. Compared to the EAT-LANCET recommendations,
cereals, roots, sugar, red meat and eggs are over-consumed while nuts and pulses are close to the minimum
recommended levels (Figure 6). Moreover, fat and protein intake does not follow the same trend, while fat intake is on
the upper boundary of the DRI, protein intake falls on the lower boundary in 2030. In 2050, fat intake follows the same
trend and exceeds the DRI while protein intake remains on the lower boundary of the recommended dietary intake. This
can be explained by an increase in consumption of oil and fat, milk products, and eggs (Figure 6).
Current Trends Current Trends
2050 Figure 6 | Comparison of the computed daily average 2050intake per capita per food category across pathways
kilocalories
in 2050 with the EAT-Lancet recommendations
Current Trends 2050 Sustainable 2050
Current Trends
Sustainable Sustainable
2050 2050
FAO 2015
Max. Recommended Min. Recommended
Cereals Poultry
Pulses
Sustainable
FAO FAOEggs
Fruits and Veg Red Meat
2050
2015 2015
Milk Roots
Nuts Sugar
Veg. Oils and Oilseeds
Notes. These figures are computed using the relative distances to the minimum and maximum recommended levels (i.e. the rings) i.e. different kilocalorie
Max. Recommended
consumption levels correspondMin. circle depending on the food group. TheMax.
to each Recommended Recommended
EAT-Lancet Min. Recommended
Commission does not provide minimum and maximum recommended
values for cereals: when the kcal intake is smaller than the average recommendation it is displayed on the minimum ring and if it is higher it is displayed on the
maximum ring. The discontinuous lines that appear at the outer edge of sugar, eggs, and fruits and vegetables indicate that the average kilocalorie consumption
Cereals
of these food categories is significantly higher than the maximum recommended.
Poultry � Cereals � Poultry
�FAO �
Eggs Pulses � Eggs � Pulses
�2015 �
Red Meat � Fruits and Veg � Red Meat
� Fruits and Veg �
Roots � Milk � Roots
� Milk �
Sugar � Nuts � Sugar
� Nuts �
� Veg. Oils and Oilseeds
� Veg. Oils and Oilseeds
Max. Recommended Min. Recommended 16
� Cereals � PoultryMexico
Under the Sustainable Pathway, we assume that diets will transition towards a healthier consumption of fats and oils,
with a lower reliance on cereals, and with a substantial increase in the intake of fruits and vegetables, pulses, and nuts.
The ratio of the computed average intake over the MDER increases to 25% in 2030 and 14% in 2050. Compared to the
EAT-LANCET recommendations, the consumption of eggs and red meat remains outside of the recommended range with
the consumption of sugar and roots within the recommended range in 2050 (Figure 6). Moreover, the fat intake per capita
is still on the upper boundary of the dietary reference intake (DRI) but the protein intake increases in 2030, showing some
improvement compared to the Current Trends Pathway.
To promote a necessary shift in diets it is necessary to implement measures that encourage consumers to make healthier
food choices. Placing nutrition labels in front of the food packages (Jáuregui et al. 2020), including a purchase tax to
reduce sales of sugar-sweetened beverages and increase consumption of untaxed beverages (Colchero, Molina, and
Guerrero-López 2017) are some of the general strategies that have been proposed. However, the most important policies
need to address the obesity epidemic for school-age children, such as the development of dedicated school curricula
where one of the components is the access and availability of food and beverages that facilitate a healthy diet. This policy
already was created in 2010 but it has not been fully implemented. It includes the development of general guidelines for
the sale and distribution of food and beverages in elementary schools. These guidelines have the objective of facilitating
an adequate diet for children in schools and have a structured and unified regulation among states (Secretaría de Salud
2010; Secretaría de Salud and Secretaría de Educación 2014).
17Mexico
Water
Current State
Mexico is characterized by its diverse climatic conditions, Figure 7 | Water withdrawals by sector in 2017
high climate and rainfall variability. The climate ranges
from dry regions with mean temperatures above 32°C Municipal
16%
and precipitation that varies between 60 to 400mm
per year, to tropical regions with mean temperatures
above 20°C and 800 to 4500mm of precipitation. Industrial
8%
Between these two extremes are temperate regions
with mean temperatures below 10°C, 700 to 1,000mm
87844 Mm3/yr
of precipitation, and that are 1,600 meters above sea
level. Precipitation mostly occurs over the period June
– October with a limited region of winter rain in the
northwestern part of the country.
Agriculture
76%
The agricultural sector represented 76% of total water
withdrawals in 2017 (Figure 7; FAO 2020). Moreover in
2016, 32% of agricultural land was equipped for irrigation,
Source. Adapted from AQUASTAT Database (FAO, 2017)
representing 33% of estimated-irrigation potential. The
three most important irrigated crops, maize, wheat,
and sorghum, account for 28%, 12%, and 12% of total
harvested irrigated area. Mexico exported 3.1% of corn,
0.81% of wheat, and 0.02% of sorghum in 2016. Figure 8 | Evolution of blue water footprint in the
Current Trends and Sustainable Pathways
Pathways and Results 35000
Blue Water Footprint (Mm3)
Under the Current Trends Pathway, annual blue water 30000
use increases between 2000-2015 (12,605 Mm3/yr and
17,494 Mm3/yr), before reaching 20,149 Mm3/yr and
25000
24,796 Mm3/yr in 2030 and 2050, respectively (Figure
8), with wheat, rice, and corn accounting for 41%, 32%,
20000
and 12% of computed blue water use for agriculture by
20503. In contrast, under the Sustainable Pathway, the
blue water footprint in agriculture reaches 23,415 Mm3/ 15000
yr in 2030 and 35,669 Mm3/yr in 2050. This increase
in demand for blue water is explained mainly by an 2000 2005 2010 2015 2020 2025 2030 2035 2040 2045 2050
increase in production of fruits and vegetables due Current Trends Sustainable
to dietary shifts and increased exports (see Annex 2)
leading to a 1.8% increase in water use for irrigation by
2050 despite increases in imports for milk and beef that
would reduce water use dedicated to feed production.
3 We compute the blue water footprint as the average blue fraction per tonne of product times the total production of this product. The blue water fraction
per tonne comes from Mekonnen and Hoekstra (2010a, 2010b, 2011). In this study, it can only change over time because of climate change. Constraints on
water availability are not taken into account.
18Mexico
Resilience of the Food and Land-Use System
The COVID-19 crisis exposes the fragility of food and land-use systems by bringing to the fore vulnerabilities in
international supply chains and national production systems. Here we examine two indicators to gauge Mexico’s
resilience to agricultural-trade and supply disruptions across pathways: the rate of self-sufficiency and diversity of
production and trade. Together they highlight the gaps between national production and demand and the degree to
which we rely on a narrow range of goods for our crop production system and trade.
Self-Sufficiency
Currently, the self-sufficiency for some basic products, such as pulses and industrial crops, is at high risk. These crops
began losing importance with the introduction of programs to promote the cropping of corn and other basic products
(Riedemann 2007). However, the current production of cereals does not guarantee self-sufficiency for products such
as wheat, yellow corn, and sorghum, the demand for which has increased markedly due to demand in balanced food
products in the poultry, pig, and cattle meat industries (Martínez Damián, Téllez Delgado, and Mora Flores 2018; Nuñez
Melgoza and Sempere Campello 2016). Dairy products and most meats are also not trending towards self-sufficiency.
High costs of labor, poor technology, and inefficient diets for the production of milk generate an inefficient milk sector
that is unable to compete at the international level (Rebollar et al. 2016). Meanwhile, the poultry and pig industries are
constrained by the domestic market structure of inputs, despite showing high growth (Martinez-Gomez 2013).
Under the Current Trends Pathway, we project that Mexico would be self-sufficient in eggs, sugar and sugar crops,
nuts, fruits and vegetables, and spices, beverages and tobacco in 2050, with self-sufficiency by product group
remaining stable for the majority of products from 2010 – 2050 (Figure 9). The product groups on which the country
depends the most on imports are milk and dairy, pulses, oil and vegetable seeds, and cereals, a dependency that will
remain stable until 2050. Under the Sustainable Pathway, Mexico’s self-sufficiency does not change compared to
the Current Trend Pathways, it is still self-sufficient in the same product groups as in 2010 and a trend that does not
change by 2050. Imports of beef, milk, and corn in 2050 to reduce Mexico’s environmental costs does not promote self-
sufficiency for those important product groups (Martinez-Melendez and Bennett 2016).
19Mexico
Figure 9 | Self-sufficiency per product group in 2010 and 2050
Beverages, 2010
Current Trends
Spices & Tobacco Sustainable
2010
Cereals Current Trends
Sustainable
2010
Eggs Current Trends
Sustainable
Fruits 2010
Current Trends
& Veg. Sustainable
2010
Milk & Dairy Current Trends
Sustainable
2010
Nuts Current Trends
Sustainable
Oilseeds 2010
Current Trends
& Veg. Oils Sustainable
2010
Poultry Current Trends
Sustainable
2010
Pulses Current Trends
Sustainable
Beef, Goat 2010
Current Trends
& Lamb Sustainable
Roots & 2010
Current Trends
Tubers Sustainable
Sugar & 2010
Current Trends
Sugar Crops Sustainable
0.0 0.2 0.4 0.6 0.8 1.0 1.2 1.4
Self−Sufficiency Ratio
Note. In this figure, self-sufficiency is expressed as the ratio of total internal production over total internal demand. A country is self-sufficient in a product
when the ratio is equal to 1, a net exporter when higher than 1, and a net importer when lower than 1.
Diversity
The Herfindahl-Hirschman Index (HHI) measures the degree of market competition using the number of firms and the
market shares of each firm in a given market. We apply this index to measure the diversity/concentration of:
Cultivated area: where concentration refers to cultivated area that is dominated by a few crops covering large
shares of the total cultivated area, and diversity refers to cultivated area that is characterized by many crops
with equivalent shares of the total cultivated area.
E
xports and imports: where concentration refers to a situation in which a few commodities represent a large
share of total exported and imported quantities, and diversity refers to a situation in which many commodities
account for significant shares of total exported and imported quantities.
We use the same thresholds as defined by the U.S. Department of Justice and Federal Trade Commission (2010, section
5.3): diverse under 1,500, moderate concentration between 1,500 and 2,500, and high concentration above 2,500.
Despite a trend of increasing diversification of crops driven by the commercial openness with the US and Canadian
markets, the primary sector is still concentrated in very few crops. Cereals, mainly corn, cover more than 70% of the
cropping area in the country. However, there is clear scope for greater diversification, which will improve the use of
productive land and irrigation water, increase the returns to and wellbeing of producers, and increase the availability of
more products.
20Mexico
Current exports are concentrated in very few products (avocado, tequila, fruits, berries, and vegetables) and this
concentration remains even under the Sustainable Pathway. This concentration of products is related to market
opportunities, investment and capacities needed to maintain supply chain with high standards. Thus, such a trend will
remain as long as the programs aimed at promoting new markets do not take off.
Under the Current Trends Pathway, we project high concentration of crop exports, relatively low concentration of
imports and a trend towards decreased concentration in crops planted in 2050, trends which are consistent over the
period 2010 – 2050. This indicates high levels of diversity across the national production system and imports, but low
diversity among exports. Under the Sustainable Pathway, the evolution of the diversification is similar to the Current
Trends Pathway with a lower concentration of exports (albeit still high) and even lower concentration of crops planted
in 2050, indicating high levels of diversity across the national production system (Figure 10).
Figure 10 | Evolution of the diversification of the cropland area, crop imports and crop exports of the country using the
Herfindahl-Hirschman Index (HHI)
Cultivated Area Exports Imports
10000
7500
HHI
5000
2500
0
2000 2010 2020 2030 2040 2050 2000 2010 2020 2030 2040 2050 2000 2010 2020 2030 2040 2050
Concentrated Moderately Concentrated Unconcentrated
Current Trends Sustainable
21Mexico
Discussion and Recommendations
Mexico needs to promote highly productive and milk, and corn for animal feed, the reduction in pasture
sustainable food systems that will increase its self- would not be possible, even with better practices and
sufficiency in key products groups (animal protein, more productive livestock systems.
pulses, and cereals). Mexico also needs to enact
policies to ensure that pressure for land conversion is An important limitation of this analysis that can
reduced and that the Mexican population has access be improved in future work relates to the scenario
to the food it needs. The FABLE project provides an assumptions. In 2019, the Mexican government
integrated pathway for sustainable land use that can published its National Development Plan for 2019-2024,
inform Mexico’s long-term strategy and the land-use with the goal of improving the well-being of Mexicans
component of the country’s NDC. Results suggest that through sustainable development. While the 2020
Mexico can adopt a feasible land-use pathway that FABLE Report was being prepared, we did not have
ensures adequate nutrition for the population, sets a complete information on the programs and operating
limit to further agricultural expansion, and expands rules that key federal agencies were considering (e.g.,
natural habitats. The results also suggest that, over Sustainable Forest Development programs from
the coming decades, food security is possible without CONAFOR), or updates on Mexico’s international
sacrificing Mexico’s natural capital. commitments (e.g., INECC will submit Mexico’s
second NDC in late 2020). Moreover, the federal
The results highlight that the key national trade-offs government has recently created an intersectoral
in food and land-use systems involve the promotion of group called “Health, Agriculture, Environment and
national self-sufficiency through a reduction in imports, Competitiveness” (GISAMAC in Spanish). GISAMAC
at the expense of pastureland. Food production in aims to support new forms of agricultural and forestry
Mexico has enormous potential for sustainability. It production to reduce the negative effects on human
has policies that, if correctly and fully applied, would health and wildlife (SEMARNAT 2020). Under the
promote production systems that are highly productive coordination of the Ministry of Environment, and in
and are also environmentally sustainable in terms of collaboration with 18 working groups from more than 10
improved water use and GHG reduction. Nevertheless, a government agencies and research institutes, GISAMAC
large proportion of food would have to be imported. On focuses on harmonization of public policies to promote
a 2050 horizon, Mexico is unlikely to be self-sufficient sufficient and sustainable production of healthy foods,
in important food groups (meat from cattle and poultry, prioritizing production from family farm producers and
milk and dairy, cereals and pulses). Even if the country medium-sized producers as well as the protection and
transitions towards a healthier diet, much of the restoration of ecosystem services.
required protein intake will need to be imported.
During the coming months, the Mexican FABLE team
The results also highlight the important role that diet will continue to reach out to key Mexican government
plays in reducing land-use change and GHG emissions. stakeholders to promote integrated modeling
A change towards a healthier diet implies a reduction in frameworks. Together with other members of the
the intake of cereals and sugar but also an increase in Mexican academic community, this integrated modeling
fruits, vegetables, and nuts, and a healthy consumption can help ensure policy coherence between the land
of animal protein, which includes a higher intake of red sector of the country’s NDC, the NBSAP, and strategic
meat and dairy products (Villalpando et al., 2015). These plans for agricultural self-sufficiency, each authored
changes would affect what is produced in Mexico and by different government agencies. Importantly, the
what needs to be imported. Without importing beef, results of this exercise highlight the transformative
22Mexico
impact that diets have on land-use systems. As such, and civil society organizations that consolidated sound
diet transformation should be included in all climate management practices and forest conservation, while
mitigation plans. In addition, the FABLE team plans potentially increasing timber imports and opening
to extend the FABLE Calculator with new scenarios to the way for the expansion of the agricultural frontier
model policies that Mexico might adopt in the coming (Mongabay Latam, 2020).
years. Finally, the team has begun engaging state-level
governments to inform their long-term planning to
meet the SDGs, and plans to adapt the FABLE Calculator
so that Mexican states can model their own sustainable
land use pathways at the state level.
The COVID-19 crisis has generated new challenges for
Mexico’s food systems. In rural areas where health care
systems are scarce or nonexistent, local populations
have implemented strict controls on accessing their
localities as a means of preventing the spread of
COVID-19 (Jimenez-Ferrer 2020). These controls
have disrupted supply chains for basic foods and
commodities, resulting in an increase in prices of crucial
goods (e.g., meat, eggs, sugar, medicines, gasoline,
etc.), adversely affecting already fragile local economies.
Moreover, reduced mobility to larger cities and the
return of the migrant population from the US may lead
to an increase in the extent of agricultural lands (e.g. for
the production of beans and corn) or forest products.
At the same time, the shortage in beef supply in the
US is resulting in an increase in Mexico’s beef exports
to the US (Alire and Huffstutter 2020), potentially
increasing the pressure for land conversion to cultivated
grasslands but taking advantage of the Mexico’s small
scale operations where the disease is easier to keep at
bay.
Finally, the COVID-19 crisis is decreasing demand for
forests products and services. Out of the almost 55
million hectares of tropical and temperate forests in
Mexico, only 5.5 million hectares are managed with
approved plans for timber extraction. With the current
sanitary crisis, the demand for products and services
in Mexico’s forest sector is drastically decreasing (50-
70% reduction) (Mongabay Latam, 2020). National
associations of community forestry already estimate
a 60% loss in the 160,000 jobs generated by the
industry, putting at risk more than three decades of
collective work among local communities, foresters,
23Mexico
Annex 1. List of changes made to the model to adapt it to the national context
• Crop
productivity for four most important crops (maize, beans, wheat, and sorghum) were adapted to reflect
Mexican trends under two pathways: Current Trends where the productivity followed the same increase trend
as 2006 – 2016 and in the Sustainable Pathway we followed the MASAGRO (CIMMYT & SADER, 2018) program’s
expected productivity in maize, beans, wheats and sorghum (SAGARPA, 2017).
• Livestock
productivity, two scenarios were generated: for the Current Trends Pathway, where livestock
productivity followed the same trend of improvement as the period 2000 – 2010 and the Sustainable Pathway,
where high-productivity livestock systems based on modern silvopastoral systems were calculated for cattle
(Guevara Sanginés et al., 2020; SIAP, 2020)
• Reforestation,
scenario for the Current Trends Pathway contemplates the reforestation that occurred from 2010
to 2020 and the intention of reforestation of two programs “Sembrando Vida” and “Programa de restauración
forestal”. For the Sustainable Pathway, the reforestation occurred from 2010 to 2020 and the BonnChallenge
(2019; DOF, 2020; SEMARNAT, 2020)
• Diets,
two scenarios were generated, a current diet that mimics the average diet in Mexico and a healthy diet
that follows national and international recommendations for sustainability and health (Barquera, Campos, &
Rivera, 2013; Behrens et al., 2017; Cruz-Góngora et al., 2017; Fernández-Gaxiola et al., 2015; Willett et al., 2019)
• Protected
areas, for the Current Trends Pathway a goal of 17% of total terrestrial area was included, for the
Sustainable Pathway the goal of 30% was set.
24Mexico
Annex 2. Underlying assumptions and justification for each pathway
POPULATION Population projection (million inhabitants)
Current Trends Pathway Sustainable Pathway
The population is expected to reach 146 million by 2050 (name of scenario Same as Current Trends
selected). (CONAPO 2018) (UN_Low scenario selected)
LAND Constraints on agricultural expansion
Current Trends Pathway Sustainable pathway
We assume no expansion of agricultural land beyond 2016 agricultural area Same as Current Trends
levels. This is a national policy since 2017 and it is being included as is by the
new federal Government. (SAGARPA 2017)
(For Scenario: No productive land expansion beyond 2010 value)
LAND Afforestation or reforestation target (Mha)
We assume total afforested/reforested area to reach 2.2 Mha by We assume total afforested/reforested area to reach 8.4 Mha by 2050. (DC
2020/2030/2050. (DOF - Diario Oficial de la Federación 2020; SEMARNAT 2014; SEMARNAT 2020)
2020)
Mexico has signed the BonnChallenge which we used to add to the efforts of
The reforestation efforts from 2010 to 2020 were included, a 30 % of the area reforestation from 2010 to 2018.
intended for the Federal program Sembrando Vida (2019-2024) and finally 30 % (BonnChallenge scenario selected)
of the area for the program “Restauración Forestal”.
(ReforestationMexBAU scenario selected)
BIODIVERSITY Protected areas (1000 ha or % of total land)
Current Trends Pathway Sustainable Pathway
Protected areas increase by 2050 they represent 17.8% of total land. Mexico has Protected areas increase: by 2050 they represent 25% of total land. Use
signed the Convention on Biological Diversity and agree to include in Protected of several conservation instruments to reach 30% of total land area under
areas 17% of its territory. (CONABIO 2016) protection (CONABIO 2016)
25Mexico
PRODUCTION Crop productivity for the key crops in the country (in t/ha)
Current Trends Pathway Sustainable Pathway
By 2050, crop productivity reaches: By 2050, crop productivity reaches:
• 6.2 tons per ha for corn • 10 tons per ha for corn
• 1.5 tons per ha for beans • 2.2 tons per ha for beans
• 5.9 tons per ha for wheat • 6.3 tons per ha for wheat
Crop productivity for 4 most important crops (maize, beans, wheat and Based on (Masagro, Siap).
sorghum) were adapted to reflect Mexican of crop productivity following the Crop productivity increase if the MASAGRO program was implemented for the
same increase trend than 2006 – 2016. (SIAP 2017) principal crop (Maize). For the rest other two crops we used the projections
generated by the “Planeación Nacional Agrícola” for a sustainable increment on
crop productivity (CIMMYT and SADER 2018; SAGARPA 2017).
PRODUCTION Livestock productivity for the key livestock products in the country (in kg/head of animal unit)
By 2050, livestock productivity reaches: By 2050, livestock productivity reaches:
• 80.7 kg per head for cattle • 105.5 kg per head for cattle
• 86 kg per head for pork • 126.4 kg per head for pork
Following the trend of increase productivity from 2000 – 2010. (SIAP 2020) Mexico has programs to promote silvopastoral systems for cattle. (Alejandro
Guevara Sanginés et al. 2020)
PRODUCTION Pasture stocking rate (in number of animal heads or animal units/ha pasture)
By 2050, the average ruminant livestock stocking density is 12 animals/ha By 2050, the average ruminant livestock stocking density is 24 animals/ha per
per ha. National pasture stocking rate without implementing any program to ha. Silvopastoral systems have the capacity to double the density of animals
increase productivity in a sustainable way. (COTECOCA - SEMARNAT 2014) per hectare. (Alejandro Guevara Sanginés et al. 2020; SEMARNAT 2010)
PRODUCTION Post-harvest losses
By 2050, the share of production and imports lost during storage and By 2050, the share of production and imports lost during storage and
transportation is 10%. However, Mexico does not have data on food loss at transportation is 5%. Mexico does not have data on food loss at national or
national or regional level. (Gustavsson, Cederberg, and Sonesson 2011). regional level. (Gustavsson et al. 2011)
TRADE Share of consumption which is imported for key imported products (%)
Current Trends Pathway Sustainable Pathway
By 2050, the share of total consumption which is imported is: Same as Current Trends
• 54% for corn for animal feed
• 40% by 2050 for milk
• 18% by 2050 for beef
Products with a high agricultural and water footprint were selected to be imported
as other countries are more environmentally efficient in their production.
TRADE Evolution of exports for key exported products (1000 tons)
By 2050, the volume of exports is: By 2050, the volume of exports is:
• 12,600 mil tons by 2050 for veggies • 7,200 tons by 2050 for veggies
• 5,300 mil tons by 2050 for tomatoes • 3,600 mil tons by 2050 for fruits
• 3,600 mil tons by 2050 for fruits • 3,200 mil tons by 2050 for tomatoes
The selected crops are the same that Mexico mainly export taking advantage of According to Mexico’s agricultural planning, the country has the capacity
its environment conditions that allows it to grow these crops most of the year to reconvert part of its crops land towards high value crop exports taking
(SAGARPA 2017). advantage of its environmental conditions. (Martinez-Melendez and Bennett
2016; SAGARPA 2017).
26Mexico
FOOD Average dietary composition (daily kcal per commodity group)
Current Trends Pathway Sustainable Pathway
By 2030, the average daily calorie consumption per capita is 2683 kcal and is: By 2030, the average daily calorie consumption per capita is 2633 kcal and is:
• 1012 kcal for cereals • 992 kcal for cereals
• 323 kcal for Oils and fats • 276 kcal for sugar
• 352 kcal for sugar • 262 kcal for fruits and vegetables
Current diet that mimics the average diet in Mexico. Healthy diet that follows national and international recommendations for
sustainability.
FOOD Share of food consumption which is wasted at household level (%).
Mexico does not have data. Same as Current Trends
We used FAO data for Latin American Countries.
By 2030, the share of final household consumption which is wasted at the
household level is:
• Cereals 9%
• Fish 3%
• Fruit and Veg 8%
• Milk 4%
• Fats and oils 2%
• Pulses 2%
• Red meat 5%
• Roots 4%
• Poultry 6%
(Gustavsson et al. 2011)
BIOFUELS Targets on biofuel and/or other bioenergy use
Current Trends Pathway Sustainable Pathway
Mexico does not participate on biofuels production. Mexico does not participate on biofuels production.
CLIMATE CHANGE Crop model and climate change scenario
Current Trends Pathway Sustainable Pathway
By 2100, global GHG concentration leads to a radiative forcing level of 6 W/m2 By 2100, global GHG concentration leads to a radiative forcing level of 2.6 W/m2
(RCP 6.0). Impacts of climate change on crop yields are computed by the crop (RCP 2.6). Impacts of climate change on crop yields are computed by the crop
model GEPIC using climate projections from the climate model Ha HadGEM2-E model GEPIC using climate projections from the climate model Ha HadGEM2-E
without CO2 fertilization effect without CO2 fertilization effect.
27You can also read