Hydrometeorological, glaciological and geospatial research data from the Peyto Glacier Research Basin in the Canadian Rockies
←
→
Page content transcription
If your browser does not render page correctly, please read the page content below
Earth Syst. Sci. Data, 13, 2875–2894, 2021
https://doi.org/10.5194/essd-13-2875-2021
© Author(s) 2021. This work is distributed under
the Creative Commons Attribution 4.0 License.

             Hydrometeorological, glaciological and geospatial
              research data from the Peyto Glacier Research
                     Basin in the Canadian Rockies
       Dhiraj Pradhananga1,2,3 , John W. Pomeroy1 , Caroline Aubry-Wake1 , D. Scott Munro1,4 , Joseph Shea1,5 ,
              Michael N. Demuth1,6,7 , Nammy Hang Kirat3 , Brian Menounos5,8 , and Kriti Mukherjee5
                        1 Centre  for Hydrology, University of Saskatchewan, 116A 1151 Sidney St,
                                               Canmore, AB, T1W 3G1, Canada
          2 Department of Meteorology, Tri-Chandra Multiple Campus, Tribhuvan University, Kathmandu, Nepal
                                3 The Small Earth Nepal, P.O. Box 20533, Kathmandu, Nepal
                  4 Department of Geography, University of Toronto Mississauga, 3359 Mississauga Road,

                                             Mississauga, ON, L5L 1C6, Canada
                    5 Geography Program, University of Northern British Columbia, 3333 University Way,

                                            Prince George, BC, V2N 4Z9, Canada
                          6 Geological Survey of Canada, Natural Resources Canada, 601 Booth St,

                                                Ottawa, ON, K1A 0E8, Canada
                        7 University of Victoria, 3800 Finnerty Road, Victoria, BC, V8P 5C2, Canada
             8 Natural Resources and Environmental Studies Institute, University of Northern British Columbia,

                                 3333 University Way, Prince George, BC V2N 4Z9, Canada
                         Correspondence: Dhiraj Pradhananga (dhiraj.pradhananga@usask.ca)

                                  Received: 30 July 2020 – Discussion started: 19 October 2020
                          Revised: 11 March 2021 – Accepted: 16 March 2021 – Published: 16 June 2021

      Abstract. This paper presents hydrometeorological, glaciological and geospatial data from the Peyto Glacier
      Research Basin (PGRB) in the Canadian Rockies. Peyto Glacier has been of interest to glaciological and hydro-
      logical researchers since the 1960s, when it was chosen as one of five glacier basins in Canada for the study of
      mass and water balance during the International Hydrological Decade (IHD, 1965–1974). Intensive studies of
      the glacier and observations of the glacier mass balance continued after the IHD, when the initial seasonal mete-
      orological stations were discontinued, then restarted as continuous stations in the late 1980s. The corresponding
      hydrometric observations were discontinued in 1977 and restarted in 2013. Datasets presented in this paper in-
      clude high-resolution, co-registered digital elevation models (DEMs) derived from original air photos and lidar
      surveys; hourly off-glacier meteorological data recorded from 1987 to the present; precipitation data from the
      nearby Bow Summit weather station; and long-term hydrological and glaciological model forcing datasets de-
      rived from bias-corrected reanalysis products. These data are crucial for studying climate change and variability
      in the basin and understanding the hydrological responses of the basin to both glacier and climate change. The
      comprehensive dataset for the PGRB is a valuable and exceptionally long-standing testament to the impacts
      of climate change on the cryosphere in the high-mountain environment. The dataset is publicly available from
      Federated Research Data Repository at https://doi.org/10.20383/101.0259 (Pradhananga et al., 2020).

Published by Copernicus Publications.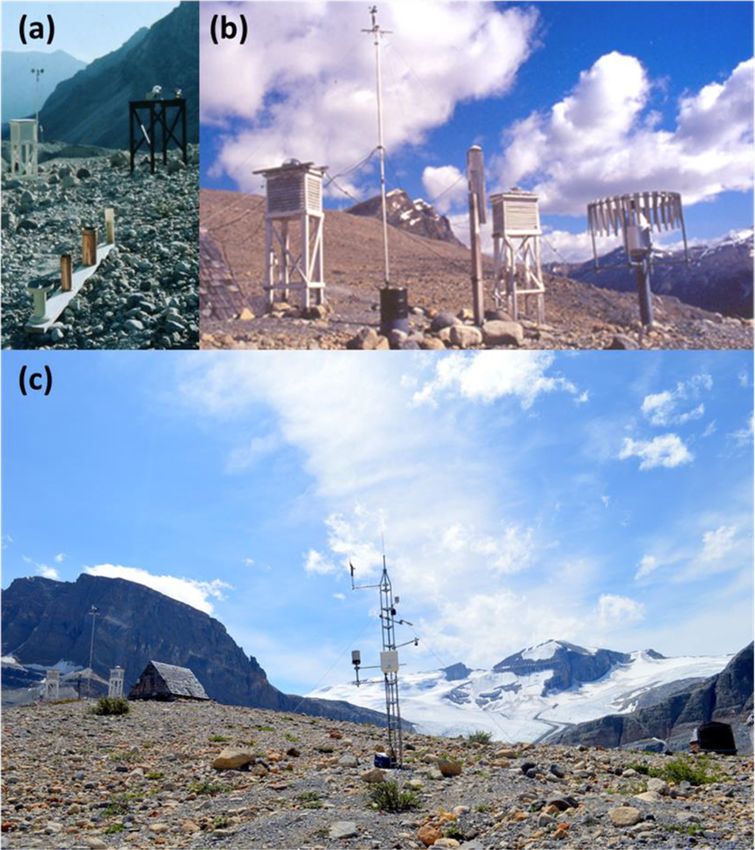
2876                               D. Pradhananga et al.: Hydrometeorological, glaciological and geospatial research data

1   Introduction                                                  operated by the Geological Survey of Canada’s Glacier-
                                                                  Climate Observing Program (Demuth and Ednie, 2016).
Peyto Glacier (Fig. 1) is located in Banff National Park,         Therefore, the PGRB can be considered an outdoor lab-
Alberta, Canada. It forms part of the Wapta Icefield in the       oratory for conducting hydrological research, as proposed
Waputik Range. The Wapta Icefield is one of the south-            by Seyfried (2003); however, a single document that de-
ernmost icefield complexes of the Canadian Rocky Moun-            scribes the relevant hydrometeorological datasets is needed.
tains and is a high-mountain headwater for the Columbia           This paper details the meteorological forcing data that were
and Saskatchewan–Nelson river systems in western Canada.          created for driving hydrological models of Peyto Glacier,
Peyto Glacier contributes runoff to the Mistaya River basin,      along with related hydrological and geospatial datasets used
a headwater of the North Saskatchewan River, which eventu-        for model evaluation, mainly for three time periods: 1965–
ally reaches Hudson Bay via the Nelson River. Glaciers and        1974, 1987–2012 and 2013–2018. These datasets include
snowpacks in these headwater systems are important sources        historical archived data from the IHD period and recent data
of water that support industry, agriculture, hydropower gen-      from both on-ice and off-ice stations. Glaciological mass
eration, drinking water and the environment. The meltwater        balance measurements, using ablation stakes and snow pits,
from this glacier and others in the region is a crucial compo-    have been carried out continuously since the beginning of
nent of streamflow during dry late-summer periods (Comeau         the IHD period, and a comprehensive account of the first
et al., 2009; Demuth et al., 2008; Hopkinson and Young,           14 years of mass balance results appeared in Young (1981).
1998).                                                            Mass balance data reported from Peyto Glacier have been
   The first geophysical record of Peyto Glacier goes back        used by many researchers (Bitz and Battisti, 1999; Demuth
to a photograph taken by Walter D. Wilcox in 1896, fol-           et al., 2008; Demuth and Keller, 2006; Letréguilly, 1988;
lowed by subsequent photographs and a map from the                Letréguilly and Reynaud, 1989; Marshall et al., 2011; Mat-
Alberta-British Columbia Interprovincial Boundary Com-            ulla et al., 2009; Menounos et al., 2019; Østrem, 1973;
mission Survey (Tennant and Menounos, 2013). Significant          Schiefer et al., 2007; Shea and Marshall, 2007; Watson et
research on the glacier began in 1965, when it was selected       al., 2006; Watson and Luckman, 2004; Zemp et al., 2015) as
as one of the research sites for the International Hydrological   reference data for the region, but the collection of data that
Decade (IHD). The scope and observational resources have          could be used for modeling purposes has never been assem-
varied since then, with more recent advances and restoration      bled in a single description until now.
of observations (Munro, 2013). Mass balance observations
continued after the IHD, but discharge observations ended in      2     Peyto Glacier Research Basin
1977. The stream gauge site was washed away by a flood
in July 1983. Discharge measurements resumed in 2013,             The PGRB is in the Canadian Rockies, on the eastern side
recorded by the Centre for Hydrology at the University of         of the Continental Divide, at latitude 51.67◦ N and longi-
Saskatchewan (USask) at a new gauging site located 1.5 km         tude 116.55◦ W. This heavily glacierized basin is 23.6 km2
upstream from the previous location. A year-round automatic       in area, ranging in elevation from 1907 to 3152 m. It is lo-
weather station, operating since 1987 (Munro, 2013), was          cated in a predominantly sedimentary geological region, with
upgraded in 2013 as part of the Canadian Rockies Hydro-           surrounding mountains formed from hard, resistant dolomite
logical Observatory observation system and is now operated        (Young and Stanley, 1976). The basin has been well moni-
by USask.                                                         tored over a 55-year observational period (Shea et al., 2009).
   Collecting continuous, high-quality data from remote and       During the 1960s, the area of the glacier was 13.4 km2 , but
difficult-to-access alpine glacier basins can be a challenge.     it has been continuously losing mass and area since at least
Lafrenière and Sharp (2003) and Rasouli et al. (2019), for        the 1920s (Tennant et al., 2012), shrinking to an area of
example, noted the impact of power source failures on auto-       9.87 km2 as of 2018 (Fig. 1). Repeat ground-based photog-
matic weather station (AWS) records, such as to cause sig-        raphy (Fig. 2) from 1902 and 2002 shows the glacier retreat
nificant data gaps. High snow accumulation during winter          that has occurred over the 20th century. A new proglacial
can bury an AWS installed on the glacier surface, and rim-        lake has since formed at the tongue of the glacier that in-
ing can compromise instrument performance; in turn, high          creases in size every year and has been informally named
summer melt can cause stations to tilt or fall over. Climate      “Lake Munro” by USask to honor D. Scott Munro’s research
data availability and accuracy in the Peyto Glacier Research      contribution to the glacier basin. Peyto Creek flows out of
Basin (PGRB) suffer from many such irregularities. There-         Lake Munro, draining the PGRB into Peyto Lake, thus sup-
fore, affected data must be infilled or corrected before they     plying water to the Mistaya River.
can be used for medium- and long-term studies.
   The World Glacier Monitoring Service (WGMS) has listed
                                                                  2.1    Hydrometeorological sites
Peyto Glacier as a “reference glacier” for mass balance,
in consideration of its mass balance data record of over          Meteorological observations were taken over the summer
50 years. Peyto Glacier is also one of the observing sites        months (June–September) during the UNESCO IHD at the

Earth Syst. Sci. Data, 13, 2875–2894, 2021                                        https://doi.org/10.5194/essd-13-2875-2021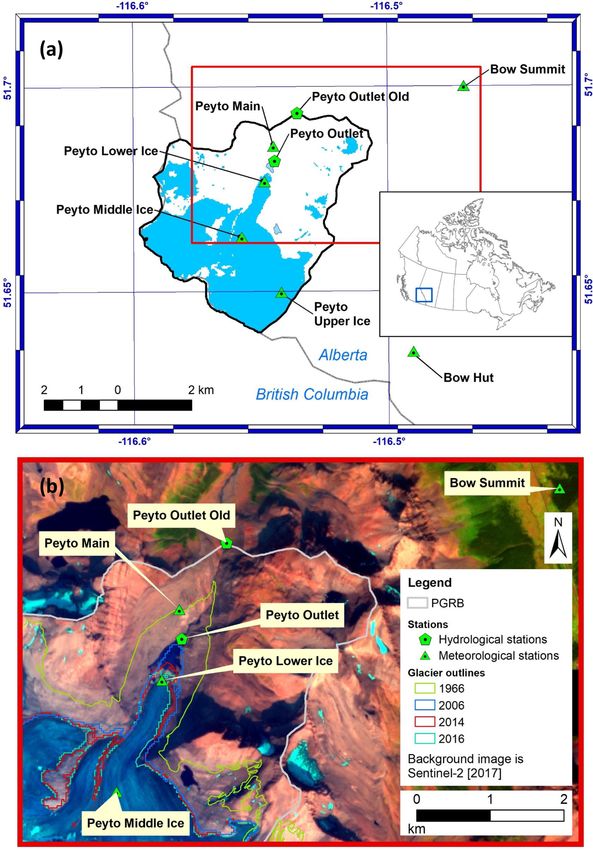
D. Pradhananga et al.: Hydrometeorological, glaciological and geospatial research data                                            2877

Figure 1. Peyto Glacier Research Basin (PGRB). (a) Locations of PGRB and the hydrometeorological stations; blue areas are glacier within
PGRB. (b) Past and present glacier extents.

Peyto Creek Base Station adjacent to the glacier terminus,            tions. These were originally positioned to represent differ-
herein referred to as Peyto Main (Fig. 1). After becoming             ent glacier net mass balance zones – ablation zone, equilib-
dormant in 1974, the station was re-established at the same           rium line zone and accumulation zone. Since 2012, USask
location in September 1987. Tables 2 and 3 detail the me-             has continued these stations with new instruments, but they
teorological variables and instruments used to record them            have been relocated to accommodate changing glacier ge-
during the IHD and the post-IHD period. Three meteorolog-             ometry and rising elevation of the equilibrium line. These
ical stations were also established on the glacier surface for        data, however, are not continuous because only the lower
post-IHD micrometeorological studies by D. Scott Munro in             ice station was maintained after 2013 due to rapid ice melt
different elevation zones: lower, middle and upper ice sta-           causing tower collapse and subsequent station burial at the

https://doi.org/10.5194/essd-13-2875-2021                                             Earth Syst. Sci. Data, 13, 2875–2894, 2021
2878 D. Pradhananga et al.: Hydrometeorological, glaciological and geospatial research data
3 Data
Young and Stanley (1976) documented the glaciological and
hydrometeorological data collected within the glacier basin
during the IHD. Past studies over the glacier are also well
documented in Peyto Glacier: One Century of Science (De-
muth et al., 2006), which provides details on the mass bal-
ance data until 1995, along with the hypsometry of the
glacier.
3.1 Meteorological data – historical and present
Young and Stanley (1976) describe meteorological and mass
balance data for the period 1965–1974. Air temperature, rel-
ative humidity, global radiation, hours of bright sunshine,
cloud cover, wind speed and precipitation were recorded dur-
ing the summer months at a meteorological station located in
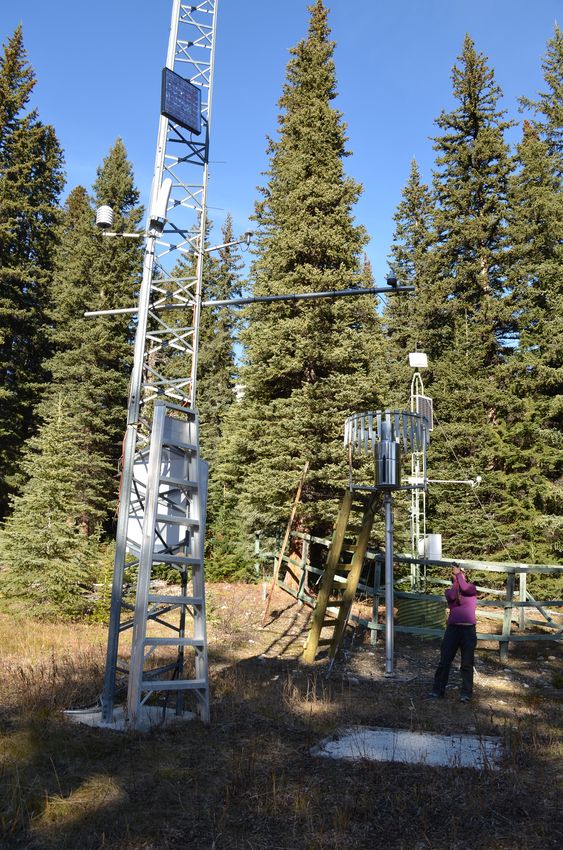
the base camp (Fig. 4a) and documented as “Peyto Creek
Base Station” observations. The data collection details and
instruments used are described in publications of the Inland
Waters Directorate of Environment Canada (Goodison, 1972;
Young and Stanley, 1976).
Automatic weather stations were subsequently installed
at on- and off-glacier sites for micrometeorological studies
and retained for long-term data collection. The data from
Peyto Main Old (Fig. 4b) are hourly prior to September 2008
and half-hourly thereafter to 2018. The Peyto Main station
(latitude: 51.51◦ N, longitude: 123.44◦ W; elevation: 2237 m)
Figure 2. Peyto Glacier in (a) 1902 (V653/NA-1127, Vaux Family, was installed near Peyto Main Old in 2013, with new instru-
Whyte Museum of the Canadian Rockies, https://Whyte.org, last ments and settings (Table 4). Peyto Main data were recorded
access: 7 September 2018) and (b) 2002 (courtesy Henry Vaux Jr.). at 15 min intervals from 2013 to the present day. Some data
(2002–2007) for Peyto Main Old were published (Munro,
2011b) in support of the IP3 Network initiative: Improving
higher-elevation sites. Peyto Outlet is a hydrometric station Processes & Parameterization for Prediction in Cold Re-
that measures glacier meltwater runoff at the outlet of Lake gions Hydrology (IP3, 2010). The details of the IP3 Net-
Munro. work and AWS data from the Peyto Main Old site (Table 2)
The AWS sites in the PGRB are now a part of are available at http://www.usask.ca/ip3/data.php (last ac-
the Canadian Rockies Hydrological Observatory cess: 26 March 2021).
(https://research-groups.usask.ca/hydrology/science/ USask established the Peyto Main station, equipped with
research-facilities/crho.php#Overview, last access: new instruments (Table 3) and a new setting as a refer-
26 March 2021), a USask network of 35 hydrometeo- ence station for the PGRB, in July 2013 within 20 m from
rological and hydrometric stations in the Canadian Rockies. Peyto Main Old (Fig. 4c). It measures incoming and outgo-
They are also part of the cryospheric surface observa- ing shortwave and longwave radiation, air temperature, hu-
tion network (CryoNet) of the World Meteorological midity, wind speed, precipitation and snow depth. Figure 5
Organization Global Cryosphere Watch (WMO-GCW) presents daily averages of these variables for the period from
– http://globalcryospherewatch.org/cryonet (last access: July 2013 to September 2019.
26 March 2021). Peyto Main and Peyto Lower Ice are The nearest AWS outside the basin boundary is oper-
listed as reference CryoNet stations, whereas the others are ated by USask at the Alpine Club of Canada’s Bow Hut
contributing CryoNet stations of the GCW. Figure 1 and (Fig. 1), established in October 2012 and continuously mon-
Table 1 contain the locational information, data collection itored since then. Air temperature, humidity, wind speed and
periods and data elements recorded at the stations, with snow depth data are available from the station. The Peyto
selected stations shown in Fig. 3. The stations are still Main AWS and that at Bow Hut were connected to teleme-
collecting observations, and our datasets will be periodically try in 2015, thus enabling them to be monitored remotely.
updated from what can be described in this paper. Near-real-time data by telemetry, extending back 1 week,
Earth Syst. Sci. Data, 13, 2875–2894, 2021 https://doi.org/10.5194/essd-13-2875-2021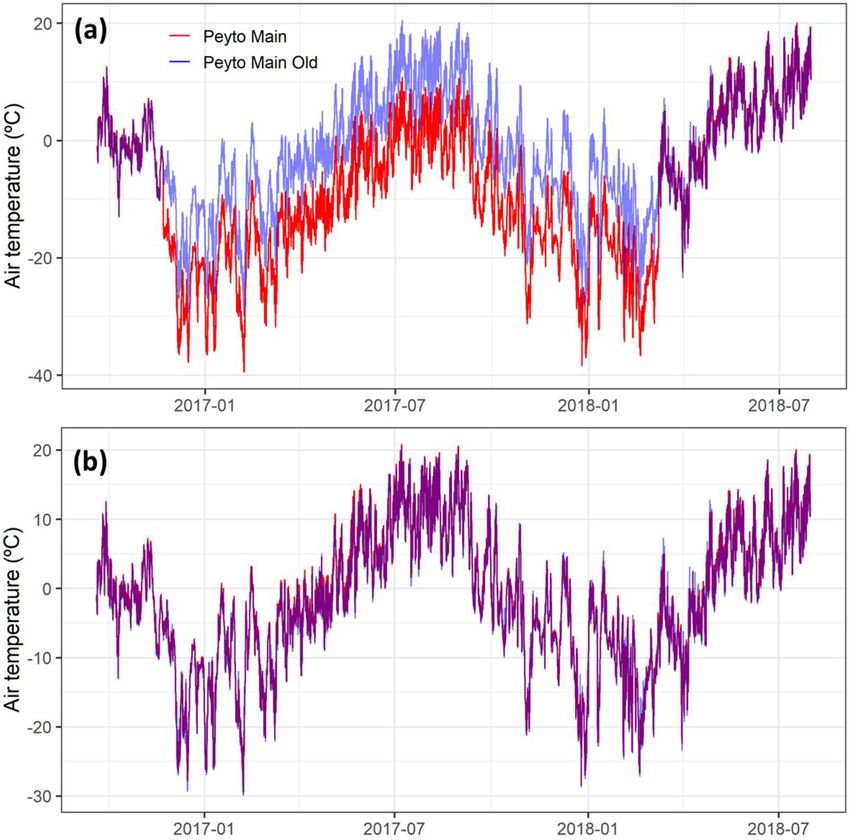
D. Pradhananga et al.: Hydrometeorological, glaciological and geospatial research data 2879
Table 1. CryoNet station data.
Station name Station type1 Geographical coordinates Variables Data period
Elevation above sea level
Peyto Maina Reference 51.68549◦ N, Ta, RH, Ws, Wd, Ts, Qsi, Jul 2013–present2
116.54495◦ W; Qso, Qli, Qlo, Ppt, P , Sd
2240 m
Peyto Main Olda Reference 51.68541◦ N, Ta, RH, Ws, Wd, Ts, Qsi, Qli, Ppt, P Sep 1987–
116.54467◦ W; Jul 20183,5
2240 m
Peyto Main IHDb Reference 51.68549◦ N, Ta, RH, Ws, Qsi, Ppt, sunshine hours 1965–19744
116.54467◦ W;
2240 m
Peyto Lower Ice7,c Reference 51.67669◦ N, Ta, RH, Ws, Ts, Qsi, Qso, Sd Aug 1995–present6
116.53399◦ W;
2173–2183 m
Peyto Middle Ice7,d Contributing 51.66293◦ N, Ta, RH, Ws, Ts, Sd Sep 2000–Sep 20133
116.55754◦ W;
2454–2461 m
Peyto Upper Ice7,d Contributing 51.64930◦ N, Ta, RH, Ws, Ts, Sd Jul 2000–Sep 20133
116.53651◦ W;
2709 m
Bow Hutd Primary 51.63517◦ N, Ta, RH, Ws, Wd, Sd Oct 2012–present2
116.49031◦ W;
2421 m
Peyto Outlete Primary 51.68111◦ N, Ta, runoff Jun 2013–present2
116.54472◦ W;
2150 m
Ta indicates air temperature, RH indicates relative humidity, Ws indicates wind speed, Wd indicates wind direction, Ts indicates soil/snow/firn/ice temperature, Qsi, Qso indicates incoming
and outgoing shortwave radiation, Qli, Qlo incoming and outgoing longwave radiation, Ppt indicates precipitation, P indicates air pressure, and Sd indicates snow depth (SR50).
1 Station type according to CryoNet. 2 Recorded at 15 min intervals; 3 Recorded hourly until September 2008, at 30 min intervals then after. 4 Daily data for the summer months. 5 Qli
measurements began in September 1998. 6 Hourly until September 2008, then at 30 min intervals to 2015 and 15 min intervals since 2015. Qsi and Qso measurements from 1999 to 2010; Qsi
measurements reinstated in 2015. 7 Snowpack glacier accumulation and ablation data are also available. Ice stations have several data gaps, mainly in middle and upper ice station records.
a Ta, RH, Ws, Qsi and Qli are included (with Wd, Ts, Ppt and P from Peyto Main Old) in the data repository. b Ta, RH, Ws, Qsi and Ppt are included in the data repository. c Ta, RH, Ws
and Qsi are included in the data repository. d Ta, RH and Ws are included in the data repository. e Runoff is included in the data repository.
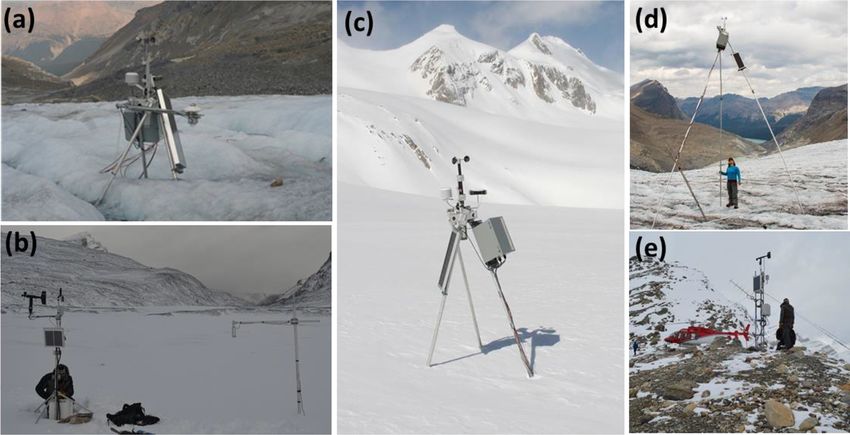
Figure 3. Photographs of selected CryoNet stations in the PGRB. (a) Peyto Lower Ice (2009), (b) Peyto Lower Ice (October 2016), (c) Peyto
Middle Ice (April 2006), (d) Peyto Middle Ice (September 2015) and (e) Bow Hut (October 2016). Photographs by Dhiraj Pradhananga (b,
e), D. Scott Munro (a, c) and Angus Duncan (d).
https://doi.org/10.5194/essd-13-2875-2021 Earth Syst. Sci. Data, 13, 2875–2894, 2021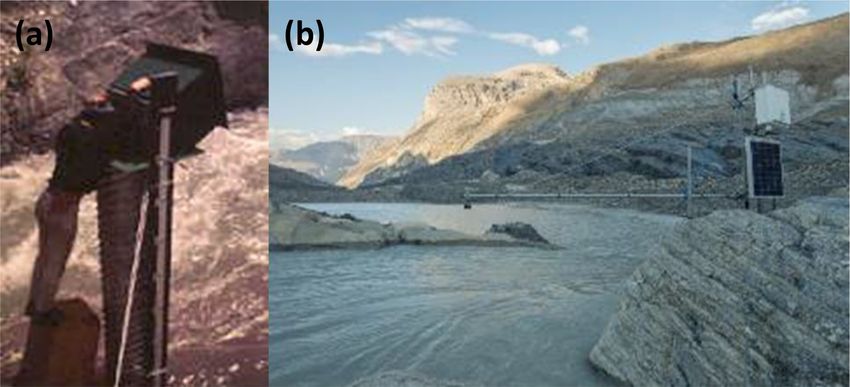
2880                                        D. Pradhananga et al.: Hydrometeorological, glaciological and geospatial research data

Table 2. Details of hourly PGRB meteorological data referred to in Goodison (1972) and Munro (2011b). N/A indicates “not available”.

           Variables                                                                              Instruments
                                                      Peyto Main Old                                       Peyto Main IHD (June–August)
           Air temperature and relative               Campbell Model 207/Vaisala HMP35,                    Lambrecht 252 thermohygrograph,
           humidity                                   YSI1 thermistor                                      CMS2 max. and min. thermometers
           Ground/snow temperatures                   YSI thermistor                                       N/A
           Wind speed and direction                   RM Young anemometer & vane                           MK II totalizing anemometer
           Precipitation                              Recording gauge3 , CMS tipping bucket                Pluvius/CMS 3 in rain gauge
           Sunshine hours                                                                                  Campbell–Stokes sunshine recorder
           Incoming longwave radiation                Epply PIR pyrgeometer
           Incoming shortwave radiation               Kipp & Zonen CMP 6/11 pyranometer                    Belfort 5-3850 pyranograph
         1 YSI stands for Yellow Springs Instruments. 2 CMS stands for Canadian Meteorological Service (now MSC, the Meteorological Service of Canada).
         3 Geonor T-200B weighing gauge with Alter shield after April 2002. Before April 2002, an adapted Fischer–Porter weighing gauge with Alter shield was
         used.

Table 3. Meteorological measurements and instruments installed at Peyto Main.

        Measurements                         Units        Instruments                                                        Placements
        Air temperature, Ta                  ◦C
                                                          Rotronic HC2-S3 temperature and humidity probe                     4.37 m above ground
        Relative humidity, RH                %
        Wind speed, Ws                       m s−1
                                                          RM Young 05103AP-10                                                5.23 m above ground
        Wind direction, Wd                   degrees
        Snow temperature, Ts                 ◦C           Omega type-E thermocouple                                          0.2 and 1.5 m above ground
        Net radiation components,            W m−2
                                                          Kipp & Zonen CNR4 net radiometer                                   3.79 m above ground
        Qsi, Qso, Qli, Qlo
        Precipitation, Ppt                   mm           TB4 tipping bucket rain gauge                                      3.15 m above ground
        Barometric pressure, P               hPa          Vaisala CS106                                                      3 m above ground
        Snow depth, Sd                       m            SR50A sonic ranger                                                 2.95 m above ground
        Volumetric water content             %
        Electroconductivity                  ds m−1       Campbell Scientific CS650                                          0.01–0.11 m below ground
        Soil temperature                     ◦C

        Soil heat flux                       W m−2        HFP01                                                              0.02 m below ground

can be viewed at https://research-groups.usask.ca/hydrology/                           Peyto Main Old and Peyto Main are currently operational.
data.php (last access: 26 March 2021).                                                 Peyto Lower Ice was updated with new instruments in Octo-
   Meteorological data from the Peyto Ice stations (upper,                             ber 2015. Station data availability details are listed in Table 1.
middle and lower) are not continuous because of difficulties
in operating the stations on rapidly ablating glacier ice, but
                                                                                       3.2     Precipitation
periods of synchronous observational data are available. The
three stations were operational at the same time for brief pe-                         Precipitation at the Peyto Main Old station was measured by
riods between 2007 and 2013 (Table 1). Peyto Lower Ice has                             a Geonor T-200B, a weighing precipitation gauge with an Al-
been maintained for a longer period than Peyto Middle Ice                              ter wind shield, beginning in April 2002, with a CMS tipping
and Peyto Upper Ice, collecting both incoming and outgoing                             bucket rain gauge (TBRG) operating nearby (Fig. 4b and Ta-
shortwave radiation data until August 2010. Peyto Lower Ice,                           ble 2). However, there is reason to doubt the reliability of

Earth Syst. Sci. Data, 13, 2875–2894, 2021                                                                  https://doi.org/10.5194/essd-13-2875-2021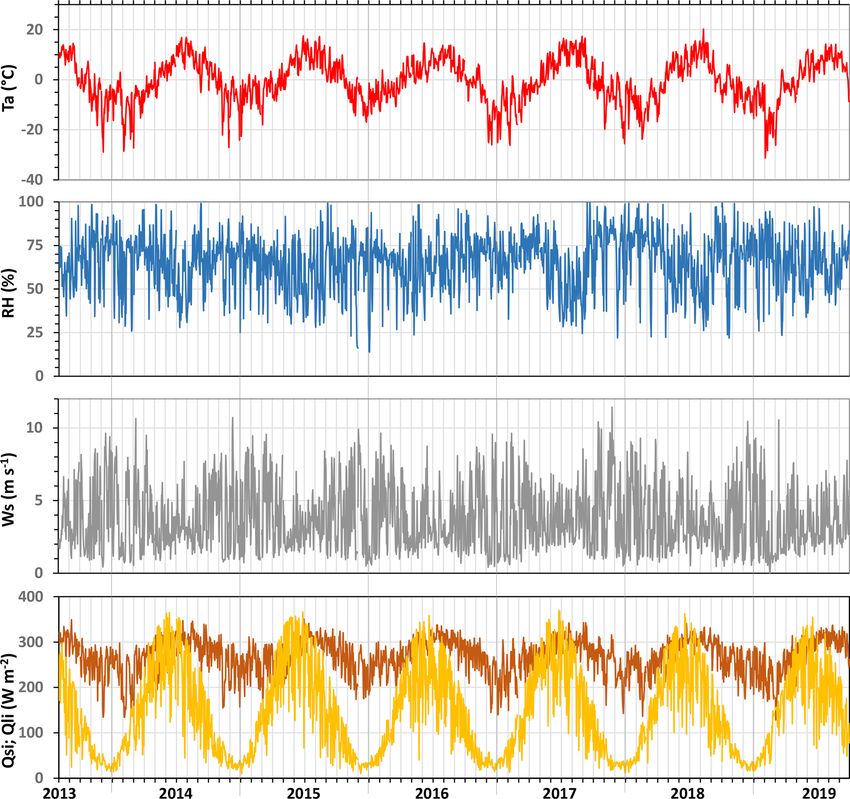
D. Pradhananga et al.: Hydrometeorological, glaciological and geospatial research data                                          2881

                                                                     Figure 6. Cumulative rainfall comparisons at the Peyto Main sta-
                                                                     tion and Bow Summit over the summer months.

Figure 4. The base camp stations: (a) Peyto Main IHD, July 1970;     these records because comparisons with the new TBRG at
(b) Peyto Main Old (July 2009); (c) Peyto Main (Septem-              the Peyto Main station, 20 m west of the old station (Fig. 4c),
ber 2015) (Peyto Main Old in left background). Photographs by        show that both the Geonor and the old TBRG recorded sig-
D. Scott Munro (a, b) and May Guan (c).                              nificantly less precipitation between June and September
                                                                     (Fig. 6), the Geonor catch being approximately 70 % of the
                                                                     new TB catch and that of the old TB much smaller. Also, de-
                                                                     spite good comparisons with June–September Bow Summit
                                                                     precipitation for 2014 to 2016, at a distance of just 5.5 km
                                                                     (Fig. 1), the Geonor persistently underestimates annual pre-
                                                                     cipitation during the 6 years following 2010 (Fig. 7), even
                                                                     though it is 160 m above Bow Summit.
                                                                        Problems with the old TB date from 2007, when a rapid
                                                                     decline in gauge response was noted (Munro, 2021), but the
                                                                     Geonor gauge response invited further investigation. There-
                                                                     fore, its records were first segregated according to rainfall
                                                                     and snowfall by applying the precipitation phase determi-
                                                                     nation algorithm developed by Harder and Pomeroy (2013).
                                                                     Snowfall was bias corrected for wind-induced catch reduc-
                                                                     tion (Smith, 2007), and rainfall was corrected with a catch
                                                                     efficiency of 0.95 (Pan et al., 2016). Bow Summit data were
                                                                     accepted as recorded because the surrounding tall trees pro-
                                                                     vide sheltering but do not unload intercepted snow to the sin-
                                                                     gle Alter-shielded weighing precipitation gauge in the clear-
                                                                     ing centre at the site (Fig. 8), thus making it ideal for precip-
                                                                     itation measurements.
Figure 5. Peyto Main plots of 24 h mean air temperature (Ta), rel-
                                                                        Daily precipitation sequences were averaged over 7 years
ative humidity (RH), wind speed (Ws), incoming shortwave radi-
ation (Qsi) and incoming longwave radiation (Qli) – August 2013      (2010–2016 inclusive) and seasonally accumulated to com-
to September 2019. Yellow and dark orange in the bottom panel,       pare Peyto Main Geonor and Bow Summit measurements
respectively, are incoming shortwave and longwave radiation.         (Fig. 9). Observed precipitation accumulation is similar dur-
                                                                     ing the summer months between May and October, with
                                                                     mostly liquid precipitation occurring from June to Septem-
                                                                     ber. Large differences, however, are found for the adja-

https://doi.org/10.5194/essd-13-2875-2021                                           Earth Syst. Sci. Data, 13, 2875–2894, 2021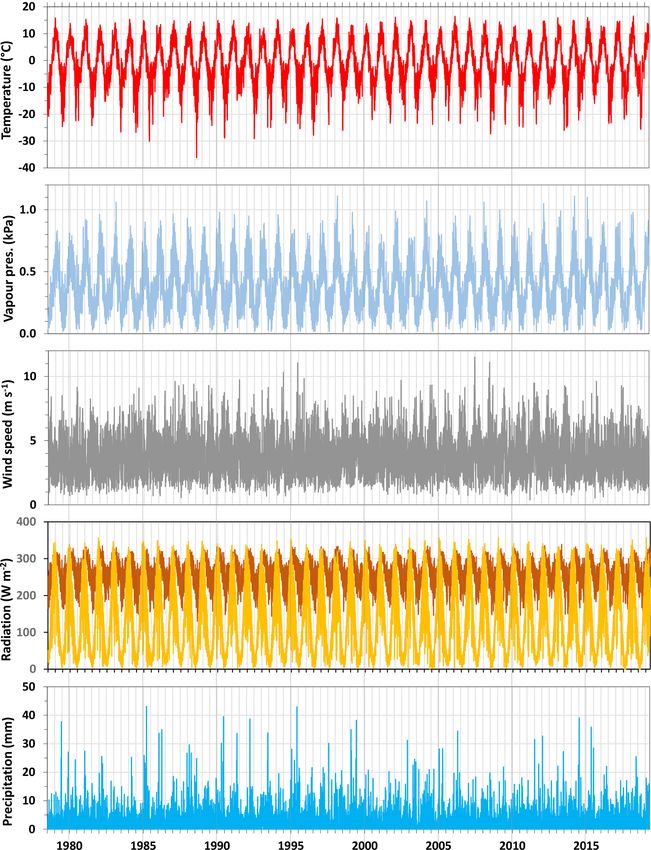
2882                              D. Pradhananga et al.: Hydrometeorological, glaciological and geospatial research data

Figure 7. Annual cumulative precipitation at Bow Summit and Peyto Main, 2011 to September 2016, with highlighting of main summer
rainfall months.

                                                                  cent winter snowfall months of January–May and October–
                                                                  December, cumulative winter precipitation recorded at Peyto
                                                                  being significantly less than that at Bow Summit. Therefore,
                                                                  the Peyto precipitation gauge may not have been catching
                                                                  a large portion of the solid precipitation. It is also possible
                                                                  that the gauge undercatch correction procedure, originally
                                                                  developed to offset wind-induced catch reduction of Cana-
                                                                  dian Prairie snowfall (Smith, 2007), may require modifica-
                                                                  tion for use in a high-mountain environment with complex
                                                                  terrain wind flow. While the summer precipitation compar-
                                                                  isons with the new TB are much closer (Fig. 6), the Peyto
                                                                  Main Station is 160 m higher and 5.5 km closer to the conti-
                                                                  nental divide and so would be expected to receive somewhat
                                                                  higher precipitation than Bow Summit.
                                                                     Despite reservations noted above, the precipitation data
                                                                  recorded at Bow Summit (51.70◦ N, 116.47◦ W; elevation
                                                                  2080 m, climate ID: 3050PPF) are considered the most suit-
                                                                  able to represent precipitation over the PGRB. Bow Sum-
                                                                  mit data can be downloaded from the Alberta Climate Infor-
                                                                  mation Service (ACIS, http://agriculture.alberta.ca/acis/, last
                                                                  access: 26 March 2021). Quality-controlled hourly temper-
                                                                  ature and precipitation data are available continuously from
                                                                  1 November 2008 to the present; continuous daily data are
                                                                  available from 23 March 2006 to the present. The hourly
                                                                  temperature and precipitation data from 1 January 2009 to
                                                                  31 December 2019 are plotted in Fig. 10; earlier data are not
                                                                  sufficiently continuous to be included.

                                                                  3.3   Data cleaning and gap infilling
                                                                  Meteorological data recording frequency was changed from
                                                                  hourly to half hourly in September 2008 and to 15 min inter-
                                                                  vals in 2013 with the new USask stations (Table 1). However,
Figure 8. Bow Summit station, 15 October 2015. Photograph by
                                                                  quarter- and half-hourly data were aggregated to hourly in-
Dhiraj Pradhananga.                                               tervals for archiving, thus corresponding to the AWS record-
                                                                  ing interval used prior to September 2008. Raw data were
                                                                  thoroughly checked for errors and obviously erroneous data
                                                                  removed. Missing data were filled in by either linear inter-

Earth Syst. Sci. Data, 13, 2875–2894, 2021                                        https://doi.org/10.5194/essd-13-2875-2021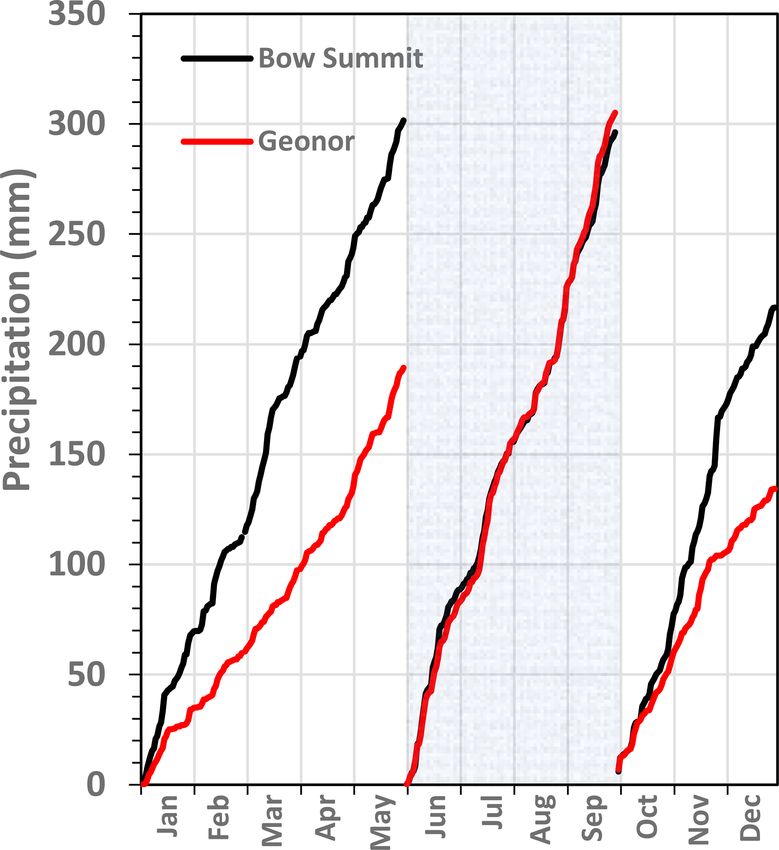
D. Pradhananga et al.: Hydrometeorological, glaciological and geospatial research data                                           2883

Figure 9. Seasonal Bow Summit and Peyto Main cumulative pre-
cipitation from 7-year averages of daily values, 2010 to 2016 inclu-
sive, with main summer rainfall months shaded.

                                                                       Figure 11. Meteorological data cleaning process with correspond-
                                                                       ing R functions of the CRHMr package stated within brackets
Figure 10. Hourly temperature and daily precipitation recorded at
Bow Summit.
                                                                          Despite two data gaps 6–8 months long and five more
                                                                       that span periods of 15–45 d, the Peyto Main Old record
                                                                       is over 94 % complete between 1987 and 2018. Gap fill-
polation or linear regression to data from stations within the         ins and corrections to key elements, such as air tempera-
basin. Linear interpolation was chosen when a data gap was             ture and solar radiation, were done using expert judgment
less than or equal to 4 h, and a regression method was ap-             by D. Scott Munro, with flags inserted to aid judgment
plied to gaps longer than 4 h. These data cleaning processes           on data suitability (Munro, 2021). Recent data from Peyto
were followed in sequence by applying various R functions,             Main Old (4 October 2010 to 31 July 2018) and Peyto
along with the Cold Regions Hydrological Model R pack-                 Main (17 July 2013 to 1 October 2019) are almost contin-
age (CRHMr) (Shook, 2016a) for which guidance and in-                  uous, except for two short gaps in 2013 for Peyto Main Old
stallation details are available on GitHub https://github.com/         (13 h total) and five brief gaps in 2013, 2015 and 2016 for
CentreForHydrology/CRHMr (last access: 26 March 2021).                 Peyto Main (5.5 h total) – each a gap of less than 4 h. The
The data processing steps for quality assurance and control            wind speed data from Peyto Main Old are in error from
are shown in Fig. 11.                                                  17 July 2017 to 8 March 2018. Also, the temperature and

https://doi.org/10.5194/essd-13-2875-2021                                             Earth Syst. Sci. Data, 13, 2875–2894, 2021
2884                                   D. Pradhananga et al.: Hydrometeorological, glaciological and geospatial research data

                                                                          3. NARR, the North American Regional Reanalysis prod-
                                                                             uct (Mesinger et al., 2006); and
                                                                          4. WFDEI, the Water and Global Change (WATCH) Forc-
                                                                             ing Data ERA-Interim reanalysis product (Weedon et
                                                                             al., 2011).
                                                                         These products are available at different spatial and temporal
                                                                         resolutions for different time periods. CFSR, ERA-Interim
                                                                         and WFDEI are global datasets, whereas NARR covers only
                                                                         North America. ERA-Interim is available from January 1979
                                                                         to 2018, with original resolution of 0.7◦ at the Equator (Dee
                                                                         et al., 2011). WFDEI (Weedon et al., 2011) is available at a
                                                                         spatial resolution of 0.5◦ × 0.5◦ from 1979 to 2016. NARR
                                                                         (Mesinger et al., 2006) is available at 3-hourly temporal and
                                                                         32 km spatial resolution from January 1979 to January 2017.
                                                                         CFSR, developed by the National Centers for Environmen-
                                                                         tal Prediction and the National Center for Atmospheric Re-
                                                                         search (NCEP-NCAR), is available hourly, at a horizontal
                                                                         resolution of 0.5◦ × 0.5◦ from 1979 to 2009 (Saha et al.,
                                                                         2010). A comparison of three reanalysis products showed
Figure 12. Air temperature recorded at the Peyto Main and Main           ERA-Interim to be better than NARR and WFDEI for air
Old stations: (a) before bias correction to Peyto Main, (b) after bias   temperature, vapor pressure, shortwave irradiance, longwave
correction. Overlapping values appear in purple.                         irradiance and precipitation, while WFDEI was best for wind
                                                                         speed (Pradhananga, 2020).
                                                                            All gridded reanalysis data were first extracted for the
humidity probes at Peyto Main were not functioning prop-                 Peyto Main station coordinates. ERA-Interim, WFDEI and
erly for longer periods during 2016–2018. The temperature                NARR data were interpolated to hourly time periods. The
probe at Peyto Main recorded 10 ◦ C less than that of Peyto              R package “Reanalysis” (Shook, 2016b) was used for ex-
Main Old from 22 November 2016 to 8 March 2018 due                       tracting and interpolating ERA-Interim, WFDEI and NARR
to a coding error in the datalogger program; the humidity                datasets. Air temperature, vapor pressure, wind speed, pre-
probe was not functioning well from 20 September 2016 to                 cipitation, incoming longwave and incoming shortwave radi-
20 March 2017. These differences were detected by plotting               ation data were interpolated linearly from 3 or 6 h to hourly
the data and comparing them with data from Peyto Main Old.               time intervals. Total precipitation (3 or 6 h) was distributed
   Table 4 shows the regression results and Fig. 12 shows the            evenly to hourly time intervals. MATLAB (MATrix LABo-
systematic bias in Peyto Main air temperature data before                ratory) codes (Krogh et al., 2015) were used to extract CFSR
and after a 10 ◦ C correction. The erroneous humidity data               values, which were already at hourly time intervals.
were corrected from the Peyto Main Old station data using                   The hourly data were bias corrected to the in situ obser-
monthly regressions (Table 5). In addition, Peyto Main sta-              vations at the Peyto Main station for air temperature, vapor
tion data for all the variables were extended back to 2010 us-           pressure, wind speed, incoming shortwave and longwave ra-
ing monthly regressions with data from the Peyto Main Old                diation and those at Bow Summit for precipitation. Peyto
station.                                                                 Main precipitation data were not considered because they
                                                                         were unreliable, as detailed in Sect. 3.2. Precipitation data
                                                                         from Bow Summit were considered instead. A quantile map-
3.4    Reanalysis forcing data
                                                                         ping technique was used for bias correction with parame-
Bias-corrected reanalysis data are also included as model                ters calibrated for each month from corresponding data pe-
forcing data for running glaciohydrological models over long             riods using the qmap package in R (Gudmundsson, 2016).
periods. Four gridded reanalysis products were bias corrected            Bias-corrected ERA-Interim data from January 1979 to Au-
using in situ observations at the PGRB:                                  gust 2019 are presented in Fig. 13.

  1. CFSR, the Climate Forecast System Reanalysis product                3.5   Hydrological data – historical and present
     (Saha et al., 2010).
                                                                         Historical observed daily outflows from the glacier at Peyto
  2. ERA-Interim, the European Centre for Medium-Range                   Creek are available for 1967 to 1977 from the Water Sur-
     Weather Forecasts Interim reanalysis product (Dee et                vey of Canada (WSC, https://wateroffice.ec.gc.ca/search/
     al., 2011);                                                         real_time_e.html, last access: 26 March 2021). They are also

Earth Syst. Sci. Data, 13, 2875–2894, 2021                                              https://doi.org/10.5194/essd-13-2875-2021
D. Pradhananga et al.: Hydrometeorological, glaciological and geospatial research data 2885
Table 4. Regression results for Peyto Main and Peyto Main Old hourly data.
Variables From (yyyy-mm-dd) To (yyyy-mm-dd) Slope Intercept R2
Air temperature 2013-07-17 2018-07-31 1.00 −0.23 1.00
Vapor pressure 2013-07-17 2018-07-31 1.09 −0.02 0.99
Wind speed 2013-07-17 2018-07-31 1.12 0.38 0.94
Incoming shortwave 2013-07-17 2018-07-31 0.96 3.39 0.97
Incoming longwave 2013-07-17 2018-07-31 1.01 −9.52 0.96
Table 5. Monthly regression results for Peyto Main and Peyto Main Old hourly data.
Month Air temperature Vapor Wind Incoming Incoming longwave
pressure speed shortwave
Slope Intercept Slope Slope Slope Slope Intercept
Jan 1.00 −0.26 0.99 1.19 0.91 1.00 −6.12
Feb 0.99 −0.24 1.00 1.18 0.94 1.00 −6.92
Mar 0.99 −0.29 1.01 1.17 0.95 1.01 −8.97
Apr 1.00 −0.24 1.03 1.17 0.97 0.99 −6.48
May 1.00 −0.32 1.06 1.15 0.98 1.04 −20.52
Jun 1.01 −0.28 1.07 1.18 0.98 1.04 −19.02
Jul 1.00 −0.14 1.08 1.17 0.96 1.04 −19.69
Aug 1.00 −0.24 1.07 1.21 0.95 1.03 −16.51
Sep 1.01 −0.34 1.05 1.22 0.96 1.04 −17.11
Oct 1.01 −0.23 1.04 1.22 0.95 1.05 −18.75
Nov 1.00 −0.24 0.98 1.20 0.94 1.05 −18.17
Dec 1.00 −0.22 0.99 1.20 0.91 1.01 −9.58
available at 15 min intervals from 1970 to 1977 by accessing The new station is equipped with a Campbell Scientific
the Peyto Glacier runoff archive housed at the University of sonic ranger (SR50A) to monitor the water stage. This gauge
Waterloo (Munro, 2011a). The gauge station (ID 05DA008) record is temperature corrected using air temperature mea-
was established in 1966 for the IHD program and maintained sured below the SR50A.
by the WSC. It consisted of a float-activated continuous stage In the summer of 2018, an automated salt dilution sys-
recorder (Table 6) mounted on a standpipe ∼ 500 m from the tem (AutoSalt by Fathom Scientific) and a stage level log-
glacier tongue at that time (Fig. 14). ger were installed approximately 100 m downstream of the
Historical discharge measurements at Peyto Creek are SR50A. Between 14 May 2018 and 10 September 2018,
problematic due to unstable cross sections, occasional flash 43 streamflow discharge measurements were performed with
floods and lack of direct discharge measurements during high automated and manual salt dilution. One manual streamflow
flows. Goodison (1972) reported that the discharge records measurement was conducted with an FT2 handheld acoustic
from 1967 are not reliable, and the stage gauge was washed Doppler velocimeter (ADV) on 1 August 2018. These mea-
out during a flood in August 1967. As reported by Omman- surements were used to develop a rating curve and calcu-
ney (1987), heavy precipitation and a resulting landslide in late discharge for the 2018 season (Fig. 15, Sentlinger et al.,
July 1983 triggered two floods. The instantaneous discharge 2019). The salt dilution measurements’ error analysis pro-
during the first flood was estimated to be in the range of vides an error estimate of 24.5 % for the measured discharge.
200 to 300 m3 s−1 (Johnson and Power, 1985), and an esti- The rating curve shows an inflection point at stage h = 65
mated 6000 m3 of debris, approximately 3 m thick, were de- due to the shape of the bedrock notch. Sudden drops in the
posited in the valley near the gauging site. A similar event stage were observed during the early season discharge, likely
in September 2010 deposited a thick debris cover over the due to temporary ice jamming as the stream channel was still
original gauge area, thus changing the trail into the glacier. partly snow covered.
A new hydrometric station to resume flow measurements Using the strong correlation between the SR50A water
for Peyto Creek was installed at the outflow of Lake Munro level and the level logger for the 2018 period (r = 0.998,
on the bedrock near the glacier snout in 2013 by USask RMSE = 0.08 m), the SR50A water level is used to extend
(Fig. 14b). It is 1.5 km upstream from the old gauging site water level for the 2013–2018 melt seasons using the lin-
and so redefines the gauged basin to a smaller area (Fig. 1). ear regression f (x) = 0.6518x + 0.2576 and then calculate
https://doi.org/10.5194/essd-13-2875-2021 Earth Syst. Sci. Data, 13, 2875–2894, 20212886 D. Pradhananga et al.: Hydrometeorological, glaciological and geospatial research data
Table 6. Hydrometric station information.
Hydrometric Geographical Drainage Elevation Stage recording instrument and rating Discharge data
station coordinates area above sea level curve method period of record
Old gauge: 51.69361◦ N, 23.6 km2 1951 m Stevens A-35 water-level recorder; rat- 1967–1977
Peyto Creek at 116.53556◦ W ing curve data from current meter for (Jun–Sep)
Peyto Glacier low flows, salt dilution or Rhodamine
(05DA008) dye injection for high flows (Goodison,
1972)
New gauge: 51.68111◦ N, 18.3 km2 2150 m Campbell Scientific SR50 ranger; rat- 2013–2018
Lake Munro 116.54472◦ W ing curve data from salt dilution method (Jun–Sep)
outlet
Figure 14. Gauge sites: (a) old IHD hydrometric gauge on Peyto
Creek, August 1970, and (b) new hydrometric station at the Lake
Munro outlet. Photographs by D. Scott Munro (a) and Angus Dun-
can (b).
3.6 Glaciological data
Glaciological mass balance measurements, using ablation
stakes and snow pits, have been taken semi-annually by
Canadian government agencies since 1965, when the IHD
program began. The scheme for Peyto Glacier was first de-
scribed by Østrem (1966). Mass balance data for 11 elevation
bands, 100 m in width, are reported in several publications
(Demuth et al., 2009; Demuth and Keller, 2006; Dyurgerov,
2002; Ommanney, 1987; Young, 1981; Young and Stanley,
1976). Recent mass balance data are reported by the national
Figure 13. Bias-corrected meteorological forcing data from ERA- glaciological program of the Geological Survey of Canada to
Interim. Daily precipitation is the 24 h total, and the other data are and are available from the WGMS (http://www.wgms.ch, last
plotted as 24 h means. Yellow and dark orange in the radiation access: 26 March 2021). The WGMS (2020) has also com-
panel, respectively, are incoming shortwave and longwave radia- piled datasets from 1966 to 2018 that are plotted in Fig. 17
tion. (1991–1992 mass balance year missing). Specific winter and
summer mass balance data for 11 elevation bands covering
an elevation range from 2100 to 2703 m are also available
streamflow based on the rating curve in Fig. 15a. The daily
for the period 2003–2018 that are not included in this study.
mean basin runoff (streamflow discharge per unit area of the
The winter, summer and annual point balances have been cal-
basin) averaged over the historical 11-year period (1967–
culated for the middle of each elevation band, from 2150 to
1977) and the present 5-year period (2013–2018) are pre-
2650 m above sea level, using a local polynomial regression
sented in Fig. 16.
technique.
The dataset does not include frontal variation, equilibrium
line altitude (ELA), accumulation area ratio (AAR), glacier
Earth Syst. Sci. Data, 13, 2875–2894, 2021 https://doi.org/10.5194/essd-13-2875-2021D. Pradhananga et al.: Hydrometeorological, glaciological and geospatial research data 2887
Figure 15. (a) Rating curve and (b) calculated 2018 discharge for the Peyto Creek.
Figure 16. Runoff data: (a) daily basin streamflow, expressed as a depth of runoff per day, averaged over the historical (1967–1977) and
recent (2013–2018) periods; (b) cumulative annual depth of runoff averaged over the same periods.
is the WGMS record which, for a portion of the record, uti-
lizes data from the Dyurgerov (2002) synthesis rather than
Environment Canada National Hydrology Research Institute
observations compiled by Ommanney (1987). Moreover, all
datasets present a mix of reference-surface mass balance
data, with hypsometry held constant, and conventional mass
balance data, where hypsometric changes are reflected in
mass balance accounting (Cogley et al., 2011).
3.7 Geospatial data
Figure 17. Net annual mass balance data for Peyto Glacier. Data 3.7.1 Digital elevation models
source: WGMS (2020). Repeat digital elevation models (DEMs) can be used to quan-
tify surface height changes through time, which are then
converted to mass change. Photogrammetric techniques have
mass balance (winter, summer, annual) and repeat pho- been used to construct a high-quality DEM from 1966, and
tographs, which were published by WGMS (2020) and are airborne light detection and ranging (lidar) surveys were
available at https://wgms.ch/ (last access: 26 March 2021). used to collect DEMs for 2006 (Demuth and Hopkinson,
Radio detection and ranging (radar) measurements of ice 2013) and 2017 (Pelto et al., 2019; Table 8). The 2006 DEM
thickness for Peyto Glacier in the 1980s were reported by was obtained from the Geological Survey of Canada and
Holdsworth et al. (2006). Ground-penetrating radar surveys the Canadian Consortium for LiDAR Environmental Ap-
of ice thickness across the glacier tongue in 2008–2010 were plications Research. DEMs from 1966 and 2006 were co-
reported by Kehrl et al. (2014) in their study of volume loss registered to the 2017 DEM based on the algorithm pro-
from the lower Peyto Glacier area between 1966 and 2010. posed by Nuth and Kääb (2011) using an automated, open-
The dataset does not include these published ice thickness source tool developed by Amaury Dehecq (https://github.
data. com/GeoUtils, last access: 26 March 2021). DEM sources,
It should be noted that in several instances the datasets fea- preparation and co-registration are described below and pre-
ture variations in temporal subsets of the data. An example sented in Table 8.
https://doi.org/10.5194/essd-13-2875-2021 Earth Syst. Sci. Data, 13, 2875–2894, 20212888 D. Pradhananga et al.: Hydrometeorological, glaciological and geospatial research data
Generation of photogrammetric DEMs
Digital copies of diapositives from the year 1966, pho-
togrammetrically scanned at a resolution of 14 µm, were ob-
tained from the Canadian National Air Photo Library. The
photographs were taken near the end of the ablation season
(Table 7). However, there was extensive fresh snow cover in
the images that resulted in poor contrast in the accumulation
region of the glacier.
The DEM was generated using the Agisoft Metashape Pro-
fessional (AMP) edition, version 1.5. All photos were as-
signed to the same camera group based on the focal length,
pixel size and fiducial coordinates available from the cam-
era calibration report. Then the photos were aligned by AMP
and a sparse point cloud model was produced in which cam-
era positions and orientations are indicated. To optimize the
camera positions and orientation data, some reference points
(GCPs) were identified from the stable terrain surrounding
the glacier, over a range of elevations. The GCP file was
imported to AMP, and corresponding locations were marked
on each of the photos. Finally, based on the estimated cam-
era positions, AMP calculated depth information and a dense
point cloud was generated. A DEM and an ortho image were Figure 18. Elevation change over Peyto Glacier, 1966–2017, inside
produced from the dense point cloud. the IHD glacier boundary.
Most of the accumulation zone of the glacier is missing
from the dense point cloud because fresh snow cover resulted
in poor contrast in this region. The interpolation feature avail- Kääb (2011) method. The 1966 ortho image was used to
able in AMP was not enabled whilst generating the DEMs, mask out all the unstable areas such as glaciers, fresh snow
as it does not generate very accurate elevations. The spatial or waterbodies. All the pixels outside this mask were clas-
resolution of the DEM was chosen to be 10 m. sified as stable terrain, which was primarily bedrock and so
excluded trees, lakes and/or waterbodies, glaciers and snow
Generation of lidar DEM cover, and thus used for co-registration. The co-registration
script available in the GitHub repository at https://github.
Lidar uses a laser pulse to calculate the distance of the target
com/GeoUtils (last access: 26 March 2021) was used to per-
from the sensor. An airborne laser survey was conducted us-
form the task. The statistics of the elevation difference for
ing a Riegl Q-780 full waveform scanner and Applanix POS
stable terrain after the co-registration are listed in Table 9.
AV Global Navigation Satellite System (GNSS) inertial mea-
surement unit (IMU). The laser survey trajectory data were
processed using PosPac Mobile Mapping Suite (Applanix),
resulting in horizontal and vertical positional accuracy typ- 3.7.2 Land-cover data
ically better than ±15 cm. RiPROCESS was used to post-
process the point clouds and export to a LAS (lidar data ex- Land-cover data of PGRB were compiled from remotely
change file) format, a binary file to store lidar data. LAS- sensed imagery and a topographic map. Land cover for 1966
Tools, available from https://rapidlasso.com/lastools/ (last was prepared from a georeferenced scanned topographic map
access: 26 March 2021), was used to process the point cloud of Peyto Glacier, produced from the aerial photographs of
and generate the DEM (Pelto et al., 2019). August 1966 (Sedgwick and Henoch, 1975) and land cover
from 1984 to 2018 was obtained from Landsat imagery.
Google Earth Engine (GEE), ESRI ArcMap and R software
DEM co-registration
were used at various stages of the data preparation. GEE was
It is important to align the multi-temporal DEMs relative to also used for the initial spatial and temporal analysis of an-
one another so that the same point on the ground is rep- nual land-cover mapping from Landsat images, and ArcMap
resented at the same location in each DEM, thus enabling and R were used in refinement of the database preparation.
glacier elevation change to be measured as accurately as Land-cover maps from the satellite images were prepared
possible (e.g. Fig. 18). The 2017 lidar DEM was taken as by classification in accordance with albedo, the normalized-
the master DEM and all other DEMs (Table 8) were co- difference snow index (NDSI) and the normalized-difference
registered with respect to this DEM following the Nuth and water index (NDWI). As datasets extracted from different
Earth Syst. Sci. Data, 13, 2875–2894, 2021 https://doi.org/10.5194/essd-13-2875-2021D. Pradhananga et al.: Hydrometeorological, glaciological and geospatial research data 2889
Table 7. Aerial photographs used.
Year Date Data source ID No. of Scale Accumulation No. of
photos area contrast GCPs
1966 20 Aug Federal AP A18434 5 1 : 40 000 Poor 18
Table 8. DEMs used for co-registration.
Year Resolution Source and method
1966 10 m This DEM was prepared from digital copies of diapositives, photogrammetrically
scanned at 14 µm resolution, obtained from the Canadian National Air Photo Library. A
10 m resolution DEM was generated using AMP edition, version 1.5.
2006 10 m This DEM was prepared from lidar surveys taken in August 2006 (Demuth and Hop-
kinson, 2013). The DEM did not cover the whole area of the PGRB, so the northeast
corner of the basin was mosaicked with a 2014 DEM data to fill in the missing part.
2017 1m This DEM was prepared from lidar surveys taken on 17 September 2017 and is available
in the archive of the University of Northern British Columbia (UNBC).
Table 9. Stable terrain statistics after co-registration. 2007; Liang, 2000; Smith, 2010), as the fact that atmospheric
backscatter will inflate surface reflectance values, ice albedo
Co-registered Master DEM Median Normalized median values measured on Peyto Glacier as well as those obtained
DEM (year) (m) absolute deviation from atmosphere-corrected satellite images of Peyto Glacier
(year) (m) range from 0.17 to 0.3 (Cutler, 2006), so backscatter inflation
1966 −0.25 8.91 of albedo is unlikely to reach 0.4.
2017
2006 −0.07 1.00 Four land-cover classes were identified: (1) firn/snow (ac-
cumulation area), (2) ice (ablation area), (3) bare (non-
glacierized area) and (4) waterbody. Snow- and non-snow-
sources have different projection systems, they were re- covered areas of bare land cover were differentiated by the
projected to WGS 84/UTM zone 11N (EPSG:32611). NDSI (Hall et al., 2002) and NDWI (Gao, 1996; McFeeters,
1996). Distinct snow and firn areas within firn/snow land
cover were classified by their albedo (Liang, 2000; Smith,
Basin delineation and land-cover classification
2010), as snow possesses higher albedo than the ice counter-
The PGRB drainage basin was delineated from the 1966 part. The NDSI, NDWI and albedo for the images were ob-
DEM. GEE was used for the land-cover classification of tained from the calculation on the GEE platform. The thresh-
Landsat images of each year, from the 1980s to the present. old of NDSI for snow cover was kept at ≥ 0.4 (Hall et al.,
Land-cover information was extracted from Landsat 5 and 2002; Hall and Riggs, 2007). NDWI tends to possess dy-
Landsat 8 top-of-atmosphere (TOA) reflectance images. namic threshold value (Ji et al., 2009). In our case, keeping
Landsat 5 images were used for the years 1984 to 2011, and the threshold at 0.4 showed the best classification for a water-
Landsat 8 images from 2013 to 2018. The Landsat satellite body, as a lower value tends to misclassify ice pixels as wa-
images are freely available and accessible through GEE at terbodies. Similarly, albedo with the threshold of ≥ 0.4 was
30 m spatial resolution and 16 d temporal resolution. Two cri- considered to classify firn and that of less than 0.4 to clas-
teria governed image acquisition: (a) an image date between sify ice within already-classified NDSI-based glacier area.
15 July and 15 September; (b) minimal or no cloud cover in- Accordingly, land-cover classification proceeded as follows:
side the PGRB boundary. Landsat images used to create land-
cover classification of the PGRB appear in Table 10. Landsat 1. “Bare” indicates all snow-free non-glacierized areas
5 images were from the Thematic Mapper (TM) sensor, and identified by the NDSI lower than 0.4.
Landsat 8 images from the Operational Land Imager (OLI).
Images for the years 1992, 1995, 1999 and 2012 are missing 2. “Firn/snow” indicates glacierized areas with albedo
due to failure to meet the criteria. greater than 0.4 and NDWI lower than 0.4.
The use of TOA values was followed as a standard op-
erating procedure in this work, with appropriate narrow to 3. “Ice” indicates glacierized areas with albedo lower than
broadband conversion (Hall et al., 2002; Hall and Riggs, 0.4 and NDWI lower than 0.4.
https://doi.org/10.5194/essd-13-2875-2021 Earth Syst. Sci. Data, 13, 2875–2894, 20212890 D. Pradhananga et al.: Hydrometeorological, glaciological and geospatial research data
Table 10. Landsat images for generating land-cover maps of the PGRB.
Landsat Year Month/day Landsat scene identifier
Landsat 5 1984 August 15 LT50430241984228PAC00
1985 August 2 LT50430241985214PAC02
1986 August 28 LT50440241986240XXX01
1987 August 8 LT50430241987220XXX02
1988 September 2 LT50440241988246XXX01
1989 August 13 LT50430241989225XXX02
1990 August 7 LT50440241990219PAC00
1991 September 4 LT50430241991247XXX02
1993 August 15 LT50440241993227PAC03
1994 August 11 LT50430241994223PAC02
1996 August 23 LT50440241996236PAC00
1997 August 3 LT50430241997215PAC03
1998 August 29 LT50440241998241PAC03
2000 August 18 LT50440242000231XXX01
2001 August 14 LT50430242001226LGS02
2002 August 24 LT50440242002236LGS01
2003 August 20 LT50430242003232PAC02
2004 August 13 LT50440242004226EDC00
2005 August 9 LT50430242005221PAC01
2006 August 28 LT50430242006240PAC01
2007 August 15 LT50430242007227PAC01
2008 August 17 LT50430242008230PAC02
2009 August 27 LT50440242009239PAC01
2010 August 14 LT50440242010226PAC01
2011 August 26 LT50430242011238PAC01
Landsat 8 2013 August 22 LC80440242013234LGN00
2014 August 18 LC80430242014230LGN00
2015 August 12 LC80440242015224LGN00
2016 August 30 LC80440242016243LGN00
2017 September 11 LC80430242017254LGN00
2018 August 20 LC80440242018232LGN00
4. “Waterbody” indicates areas with NDWI greater than readable directly by CRHMr functions (https://github.com/
0.4. CentreForHydrology/CRHMr, last access: 8 January 2019)
(Shook, 2016a) and any Cold Region Hydrological Model,
After GEE export to Google Drive, the images were down- CRHM project (https://research-groups.usask.ca/hydrology/
loaded from the drive and converted to a shape file using the modelling/crhm.php, last access: 26 March 2021) (Centre
“raster to polygon” tool in ArcMap. The noise in the land- for Hydrology, 2021). Glacier mass balance and streamflow
cover classification was cleaned with an elimination function datasets are in .csv files. Geospatial data, co-registered DEM
on ArcMap, visual inspection and correction of few misclas- and land-cover shapefiles are provided in WGS 84/UTM
sified areas done manually, and finally, the files were clipped zone 11N (EPSG:32611).
by the boundary of the PGRB.
5 Summary
4 Code and data availability
This paper describes the hydrometeorological, glaciological
All datasets described and presented in this paper can be and geospatial data collected at the Peyto Glacier Research
openly accessed from the Federated Research Data Repos- Basin over the past five decades from its foundation by the
itory at https://doi.org/10.20383/101.0259 (Pradhananga et Government of Canada as part of its contribution to the
al., 2020). Meteorological and hydrological data are re- UNESCO International Hydrological Decade. The research
ported in Mountain Standard Time (MST). Meteorological basin now forms part of the University of Saskatchewan
data, both in situ and bias-corrected reanalysis products, Centre for Hydrology’s Canadian Rockies Hydrological
are time series in tab-delimited .obs text files. They are Observatory and so has been extensively re-instrumented
Earth Syst. Sci. Data, 13, 2875–2894, 2021 https://doi.org/10.5194/essd-13-2875-2021D. Pradhananga et al.: Hydrometeorological, glaciological and geospatial research data 2891
and subject to intensive scientific study in the last decade. Author contributions. DP cleaned, organized and corrected the
The meteorological data are from six AWS sites: three on data and wrote the first draft of the manuscript. JWP and DSM re-
the glacier and three near the glacier. These stations are instrumented the basin and designed the data correction procedures.
listed as CryoNet stations of the WMO GCW and now All authors collected and assembled data records and contributed
contribute as part of the 60 water observatories in Canada to to writing the paper. CAW contributed to hydrometric rating curve
(Sect. 3.5); MND contributed to glaciological mass balance data
the Global Water Futures program. Near-real-time data from
(Sect. 3.6); NHK, JS, BM and KM contributed to geospatial data
Peyto Main and Bow Hut are publicly accessible through (Sect. 3.7).
telemetry at https://research-groups.usask.ca/hydrology/
data.php#CanadianRockiesHydrologicalObservatory (last
access: 26 March 2021). Competing interests. The authors declare that they have no con-
Several examples of data cleaning approaches are pre- flict of interest.
sented. The Peyto Main station was operational during the
summer months of the IHD and re-established as an AWS
in 1987. New instruments and dataloggers were added in Disclaimer. Any reference to specific equipment types or man-
2012–2013 by the Centre for Hydrology. The meteorological ufacturers is for informational purposes and does not represent a
data include hourly air temperature, humidity, wind speed, product endorsement.
incoming shortwave and longwave radiation and precipita-
tion. These data are available for a period longer than three
decades from the Peyto Main station and for longer than Special issue statement. This article is part of the special is-
one decade from the Peyto Lower Ice station. Bias-corrected sues “Hydrometeorological data from mountain and alpine research
ERA-Interim (European Centre for Medium-Range Weather catchments” and “Water, ecosystem, cryosphere, and climate data
Forecasts Interim reanalysis), WFDEI (Water and Global from the interior of Western Canada and other cold regions”. It is
not associated with a conference.
Change Forcing Data ERA-Interim), NARR (North Ameri-
can Regional Reanalysis) and CFSR (Climate Forecast Sys-
tem Reanalysis) data are also included for running hydrolog-
Acknowledgements. More than a half century of intense field
ical models over longer periods.
observations on a remote high-mountain glacier in the Canadian
Glaciological mass balance data are collected semi- Rockies involve extraordinary dedication, perseverance, foresight
annually by the Natural Resources Canada’s Geological Sur- and bloody-mindedness, along with the physical fortitude to take
vey of Canada, published by the WGMS and updated an- scientific measurements in inclement weather. This paper is dedi-
nually. Details of these data have been described in several cated to the many brave scientists who have taken observations on
publications. Specific mass balance data at different eleva- Peyto Glacier and to Gordon Young, who has not only done all of
tion zones, available from 2007 to 2019, are included in this that but continues to encourage scientific examination of the glacier
paper. On-ice station data include glacier surface elevation and of the dynamic interface of the cryosphere and the hydrosphere.
change due to ablation and accumulation, as measured by
sonic rangers at three ice stations. The three ice stations, each
in a different elevation zone, have been operational for vari- Financial support. This research has been funded by the Canada
ous time periods, the first starting in 1995, with long gaps in First Research Excellent Fund’s Global Water Futures Programme,
the National Sciences and Engineering Research Council of
the records becoming less frequent over time, especially after
Canada’s Changing Cold Regions Network and Discovery Grants
2007. Geospatial data include information on basin bound-
programme, the Canada Foundation for Innovation’s Canadian
ary, drainage area, land cover (including snow, firn and ice Rockies Hydrological Observatory, the Canada Research Chairs
on the glacier) and locations of hydrometric sites. Both his- and Canada Excellence Research Chairs programmes, the Cana-
torical and contemporary discharge data are included. The dian Foundation for Climate and Atmospheric Sciences IP3 and
flow data and hourly surface elevation change data in dif- WC2N networks, Natural Resources Canada, Environment Canada,
ferent elevation zones are useful for model validation. The Columbia Basin Trust and BC Hydro.
long-term mass balance data are a valuable research asset for
model development, analysis of climate change and study of
climate impacts on glacier mass balance and hydrology. This Review statement. This paper was edited by J. Ignacio López-
comprehensive, exceptionally long database is a testament to Moreno and reviewed by two anonymous referees.
the dogged perseverance of scientists, working for various
entities with support from various research funding schemes,
who kept their eyes on the science and so have produced a References
rare half-century detailed documentation of the impacts of
climate change on the cryosphere in a high-mountain envi- Bitz, C. M. and Battisti, D. S.: Interannual to decadal
ronment. variability in climate and the glacier mass balance
in Washington, Western Canada, and Alaska, J. Cli-
https://doi.org/10.5194/essd-13-2875-2021 Earth Syst. Sci. Data, 13, 2875–2894, 2021You can also read