Multimodal Data as a means to understand the Learning Experience
←
→
Page content transcription
If your browser does not render page correctly, please read the page content below
International Journal of Information Management
                                               Volume 48, October 2019, Pages 108-119

                                              https://doi.org/10.1016/j.ijinfomgt.2019.02.003

              Multimodal Data as a means to understand the Learning Experience
                                                  Multimodal
               Michail N. Giannakos a,* , Kshitij Sharma             Dataa,c , Vassilis Kostakosb , Eduardo Vellosob
                                                        a , Ilias O. Pappas

                          as a means to Understand the Learning Experience
         aDepartment of Computer and Information Science, Norwegian University of Science and, Technology (NTNU), Trondheim, Norway
                               b School of Computing & Information Systems, University of Melbourne, Australia
                            c Department of Information Systems, University of Agder (UiA), Kristiansand, Norway

                                                                   Abstract
                                    Most work in the design of learning technology uses click-streams as their
                                primary data source for modelling & predicting learning behaviour. In this
                                paper we set out to quantify what, if any, advantages do physiological sensing
                                techniques provide for the design of learning technologies. We conducted a lab
                                study with 251 game sessions and 17 users focusing on skill development (i.e.,
                                user’s ability to master complex tasks). We collected click-stream data, as well
                                as eye-tracking, electroencephalography (EEG), video, and wristband data
                                during the experiment. Our analysis shows that traditional click-stream models
                                achieve 39% error rate in predicting learning performance (and 18% when we
                                perform feature selection), while for fused multimodal the error drops up to 6%.
                                Our work highlights the limitations of standalone click-stream models, and
                                quantifies the expected benefits of using a variety of multimodal data coming
                                from physiological sensing. Our findings help shape the future of learning tech-
                                nology research by pointing out the substantial benefits of physiological sensing.
                             Human Learning, Multimodal Learning Analytics, User-Generated Data, Skill
                          Acquisition, Multimodal Data, Machine Learning

                          1     Introduction
                          We present a study that measures how well traditional click-stream models are associ-
                          ated with human learning, and contrast those against multimodal data-stream models
                          based on from physiological responses. We consider physiological data captured
                          during user interaction with technologies that support learning (i.e., learner-computer
                          interaction - LCI), and we focus on skill acquisition. Our work seeks to provide
                          insights on how multimodal data captured via physiological sensing can help us
                          improve user interfaces for learning, and is a first step towards critically designing
                          to amplify human learning.
                              The evidence for understanding and supporting users’ learning experience is still
                          very limited, considering the wide range of multimodal data produced when the
                          learner interacts with a system (M. Giannakos et al., 2018). Cameras, wearable
                          sensors, biosensors, infrared imaging, eye-tracking and more, offer the opportunity to
                          enhance the way we collect and analyze user-data to achieve a deeper understanding
                          of the interaction between humans and learning technologies (Ochoa & Worsley, 2016;
                          Blikstein & Worsley, 2016). Despite the great potential of multimodal data – and in

                                                                        1
* Corresponding author.

E-mail addresses: michailg@ntnu.no (M.N. Giannakos), kshitijs@ntnu.no (K. Sharma), ilpappas@ntnu.no; ilias.pappas@uia.no (I.O. Pappas),
vassilis.kostakos@unimelb.edu.au (V. Kostakos), eduardo.velloso@unimelb.edu.au (E. Velloso).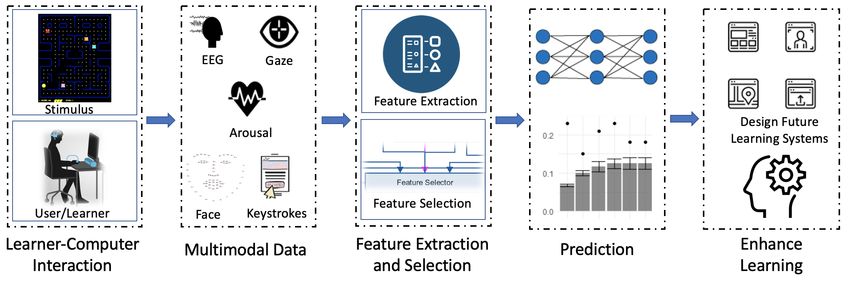
International Journal of Information Management
Giannakos et al.,
                                                                                     Volume 48, October 2019, Pages 108-119

                    particular physiological data – for understanding users’ cognition, emotion, attention,
                    information acquisition and more (Zheng et al., 2018; Kanjo et al., 2015; Hassib et al.,
                    2016; Scheidt & Chung, 2018; Abdelrahman et al., 2017), research in this direction
                    remains scarce. Today, we do not make full use of potential analytics, since we only
                    utilize part of the available user-data (e.g., click-streams, surveys, preferences) in
                    learning technology (based on a recent literature review in learning analytics for
                    learning design (Mangaroska & Giannakos, 2018)). At the same time, the advances in
                    learning technologies (Chang, 2016; Yousafzai et al., 2016; Rana et al., 2016; Rana &
                    Dwivedi, 2018; Panigrahi et al., 2018) create an increasingly more challenging context
                    for learning, by consuming significant cognitive resources (e.g., attention), by frequent
                    task changes (i.e., lack of focus), by an ever-increasing information overload, by gen-
                    erating unwanted distractions (i.e., various notifications), and often including subpar
                    user interfaces, dashboards and communication modalities (Niforatos et al., 2017).
                        Learning with technology is a complex process that is associated with many
                    aspects of interaction (Di Mitri et al., 2017) (e.g., hard mental operations, cognitive
                    friction etc.). The complexity of this process means that it is likeley that no single
                    data modality can paint a complete picture of the learning experience, requiring
                    multiple data streams to complement each other (Zheng et al., 2018). Integrating this
                    information with fusion technologies is attractive for building robust user and learner
                    models (Di Mitri et al., 2017) as well as for developing a holistic understanding of
                    learner-computer interaction (D’mello & Kory, 2015). However, most studies have
                    focused on using one data-stream (mainly user actions/clicks) or combining limited
                    data-streams (e.g., user actions/clicks with self-reported data) for measuring learning
                    experience. In contrast, the combination of physiological data coming from the central
                    nervous system (i.e. electroencephalography - EEG) and external behaviors (i.e. eye-
                    movements) has been reported as a promising approach (Zheng et al., 2018). Recent
                    studies have shown that combining multimodal data-streams significantly increases
                    the accuracy and generates more insights about the user experience (Zheng et al.,
                    2018). For example, brain and eye movement signals convey important information
                    about users’ social and emotional information for context-aware environments (Lee
                    & Anderson, 2017). Thus, a research challenge is to harness multimodal user-data
                    and utilize data-driven insights to design technologies that support human learning.
                        In this paper, we present a lab study in which we capture data produced during
                    interaction with a game that focuses on simple skill development (i.e., intuitive
                    learning/mastery through play (Lai et al., 2018)). We collected data coming from
                    multiple sources (i.e. click-stream, eye-tracking, EEG, video, and wristband). We
                    applied machine learning techniques to extract and select the features associated
                    with skill acquisition. By identifying those features, we provide a path towards the
                    design of systems that better support learning.
                        The paper provides new insights on the role of multimodal data in technology
                    enhanced learning. In particular, we make the following contributions:
                       • We present insights from a controlled experiment that collected five different
                         data-streams during a basic user/learner- computer interaction task.
                       • We show that multimodal data-streams have the capacity to give more accu-
                         rate prediction of users’ skills acquisition compared to traditional click-stream

                                                               2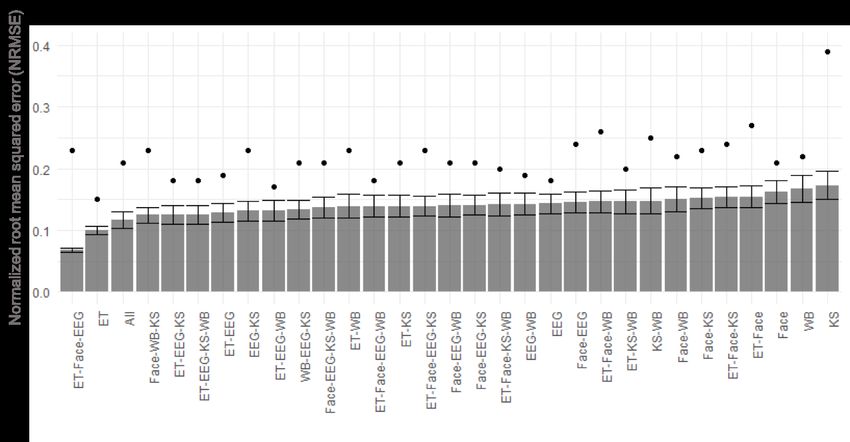
International Journal of Information Management
Giannakos et al.,
                                                                                    Volume 48, October 2019, Pages 108-119

                          models.
                        • We identify the physiological features that best predict skill development.
                        • We discuss how our findings can be used to design future learning technologies,
                          as well as to advance research in the area of learning technologies.

                        The paper is structured as follows. The next section outlines the background and
                    related work for this study. The third section outlines the employed methodology.
                    The forth section presents the results of the study. The fifth section of the paper,
                    discuss the results, the limitations, and the implications of the study, and the last
                    section provides the conclusions and the future work.

                    2     Background and Related work
                    2.1    Click-streams capacity to predict learning performance
                    Earlier studies have utilized various performance-prediction techniques in different
                    types of click-stream and keystroke data (Ashenafi et al., 2016; Watson et al., 2013).
                    Early works focused on predicting the overall completion and outcome such as
                    dropping out or completing, or passing or failing a course (Manhães et al., 2014),
                    while more recent fine-grained and sophisticated approaches involved predicting
                    actual scores for different tasks like tests and assignments (Elbadrawy et al., 2016;
                    Moreno-Marcos et al., 2018).
                         Due to the diversity of the tasks in which such experiments have been conducted,
                    the different interactions and global data collected, as well as the various advanced
                    machine learning techniques that were applied (Ashenafi et al., 2016), it is difficult
                    to compare results across these studies. Previous works have collected large amounts
                    of global data about learners’ activity with the learning system, demographics, self-
                    reports and previous performance of the learner (Moreno-Marcos et al., 2018). Ex-
                    amples of studies that utilize information from students’ activities in various learning
                    technologies (e.g., LMSs, MOOCs, assessment platforms) in predicting performance
                    have demonstrated the predictive power of these data-streams (Maldonado-Mahauad
                    et al., 2018), as well as the importance of fusing those data-streams to increase their
                    predictive power (Katerina Mangaroska & Giannakos, 2019).
                         So far we have seen several studies utilizing click-stream and keystroke data to
                    predict learners’ success (Moreno-Marcos et al., 2019). Ashenafi et al. (2016) used
                    interaction data from a peer-assessment environment and combined them with the
                    difficulty, interestingness and relevance of the tasks as indicated from the students,
                    to build learner progress prediction models with an error rate of 12%. In the context
                    of an online course about Java programming, Moreno-Marcos et al., (Moreno-Marcos
                    et al., 2018) utilized the interaction data collected by the EdX platform (EdX, 2018)
                    and found that forum-related variables do not add power to predict grades, but
                    information about the previous performance does. Furthermore, the type of task can
                    vary the results. In their study, with combined EdX interaction data (EdX, 2018)
                    and information about the previous performance their prediction models indicated

                                                               3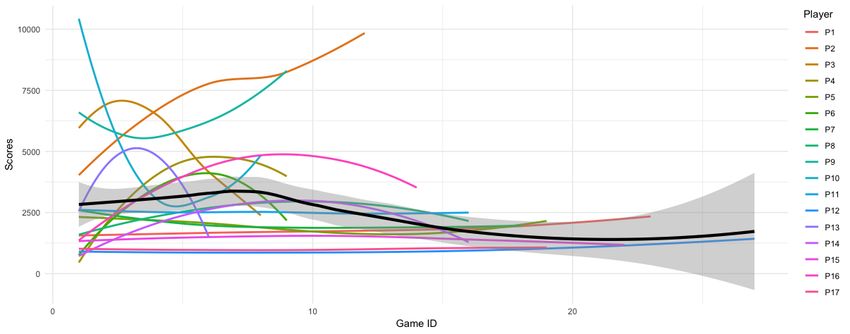
International Journal of Information Management
Giannakos et al.,
                                                                                       Volume 48, October 2019, Pages 108-119

                    an error rate of 14% (Moreno-Marcos et al., 2018). Maldonado-Mahauad et al. (2018)
                    utilized interaction data with the learning materials and the digital assessment as well
                    as self-reported data (i.e., learning strategies), to develop prediction models of learners’
                    grade. Their results indicate an average of 15% error rate and the best cases with
                    11.3% error rate. In another study (Elbadrawy et al., 2016), the authors used again
                    activity data, course information and LMS data-features and obtained predictions
                    with 13.5% error rate. In the same vein, Ren et al. (2016) developed a model to
                    predict the grade for a student, prior to attempting the digital assessment. They
                    developed a real-time model that was tracking the participation of a student within an
                    online course (via click-stream server logs) and predicting his/her performance on the
                    next assessment (within the course offering). The optimal performance of their model
                    had an error rate of 11%. Overall we see that there is a wide variety in the choice of
                    prediction features, but clickstream data use stands out (Moreno-Marcos et al., 2019).
                    Clickstream and keystroke data demonstrate an error rate of around 20% (Moreno-
                    Marcos et al., 2018), and the majority of the studies utilize other available data (e.g.,
                    self-reported, previous performance, demographics etc.) leading to better performance
                    (error rate around 15%, with exceptional cases having an error rate of 11-12%).
                         Despite the demonstrated predictive power of the models based on the aforemen-
                    tioned data, they have some limitations. For example, frequency counts of events from
                    clickstream data and other clickstream traces that are obtained directly from low-level
                    data are limited for detecting learners more complex behaviour (Maldonado-Mahauad
                    et al., 2018). Moreover, as previous studies already demonstrated, clickstreams in
                    isolation do not necessarily build very accurate predictive models (Zhao et al., 2016).
                    Therefore, predictive models could be improved by adding variables that encapsulate
                    complimentary information or are build on longer activity sequences resulting from
                    learners’ interaction with the technology (Maldonado-Mahauad et al., 2018). Thus,
                    this paper builds on prior work on MultiModal Learning Analytics (MMLA) and
                    attempts to shed light on the capacity of learner-generated data, beyond clickstreams,
                    to explain learning.

                    2.2     Multimodal data and learning experience
                    Interaction between learners and technologies is complex and offers an opportunity
                    for collecting rich and multimodal data (M. Giannakos et al., 2018). Overcoming the
                    difficulties in gathering and making sense of such data holds the potential to offer
                    novel principles to support learning experiences (Ochoa & Worsley, 2016). Typical
                    examples of such multimodal data (or MultiModal Learning Analytics - MMLA,
                    as literature refers to them) include audio, video, electrodermal activity data, eye-
                    tracking, user logs and click-stream data to name a few (Blikstein & Worsley, 2016;
                    Prieto et al., 2018).
                        Several approaches exist to collect and analyze multimodal data during LCI,
                    but they are not yet widespread and are largely limited to mainstream data (e.g.,
                    keystrokes, click-streams). In the context of university lectures, researchers have used
                    computer vision (Raca et al., 2015) to measure student attention based on their body
                    language. Ochoa et al. (2013) gathered user data from video, audio and pen strokes
                    to extract simple features that can help identify students with certain expertise in

                                                                 4
International Journal of Information Management
Giannakos et al.,
Volume 48, October 2019, Pages 108-119
the area of study. More recently, a low cost system called RAP was proposed for
collecting data from students’ posture, gaze, volume of their voice and the content
used, in order to generate a feedback report with multimodal recordings of students’
performance (Ochoa et al., 2018). Another recent study (Prieto et al., 2018) collected
eye-tracking, audiovisual and accelerometer data of the teacher in order to extract
orchestration graphs (i.e., teaching activities and their social plane over time). We
have also seen examples of multimodal data in the area of professional development,
as Martinez et al. (Martinez-Maldonado et al., 2017; Echeverria et al., 2018) used
sensor data (coming from patient manikins used for healthcare training) to capture
students’ interaction traces and identify the key aspects (e.g., instructor-student
dynamics and movements) of the learning process. Existing studies utilize various
user-generated data, including click-streams (M. N. Giannakos et al., 2015; Wang et
al., 2016), log data (Pardo et al., 2017) and sensor data (Prieto et al., 2018) to inform
visual representations (e.g., dashboards) and provide explicit, easy to understand,
and concise ways of presenting information for improved LCI and informed decision
making. However, there are limited insights on how such data can portray learning
experience and what are the features that are associated with learning.
Evidence for understanding how human learning occurs during the interaction
with the a learning technology is still very limited, considering the abundance of
user-generated data. The seamless integration and combination of different appa-
ratuses, as well as the harmonization and sense-making of multimodal data-streams
to support the learning experience, is an extremely challenging process (Lahat et
al., 2015). However, with the recent technological developments in high-frequency
data collection there is an unparalleled opportunity to understand how humans learn
with technology and to use these insights to design systems that amplify human
learning (Blikstein & Worsley, 2016). Cameras, wearable sensors, biosensors, gesture
sensing, eye-tracking, among others, can help us to enhance the way we collect and
make-sense of user-data to provide a deeper understanding of the interaction between
humans and technologies (Ochoa & Worsley, 2016).
2.3 Physiological data
In recent years, action-based analytics have been found to be very promising in
portraying the user experience during learning (Mangaroska & Giannakos, 2018;
Blikstein & Worsley, 2016; Pardo et al., 2017; Rana & Dwivedi, 2016). When a user
performs an action, regardless of whether it is completed or not, they produce rich
information that is often not considered in designing technologies to support learning
(e.g., brain-activity, eye-activity, facial gesture). These physiological-analytics can
provide meaningful insights (e.g., users attention and cognitive state) to advance
learning experience research (Pantazos & Vatrapu, 2016). For example, the main EEG
frequencies of humans are categorized into four wave patterns: Delta (0.5-4Hz), Theta
(4-8Hz), Alpha (8-13Hz) and Beta (13-30Hz) (Teplan et al., 2002). Research has
shown that these patterns are strongly correlated to human emotions and cognitive
states (Szafir & Mutlu, 2013; Hassib, Schneegass, et al., 2017), and are widely used to
accurately estimate task engagement and cognitive load based on the amplitudes of
Alpha, Beta and Theta waves. Wristband data, like electrodermal activity, have also
5International Journal of Information Management
Giannakos et al.,
Volume 48, October 2019, Pages 108-119
been proved very valuable in monitoring continuously biophysical functions that have
the capacity to accurately infer arousal levels (Exler et al., 2016; Niforatos et al., 2017).
Recent technological developments and data science advancements (Gandomi &
Haider, 2015; Tursunbayeva et al., 2018) have boosted the growth of non-invasive
high-frequency physiological-data collections (e.g., rapid development of wearable
devices, dry electrode techniques etc.), acquired through devices such as cameras,
wearable sensors, biosensors (measuring skin conductivity, heartbeat, and brain
activity), infrared imaging, and eye-tracking. However, to fully utilize these multi-
faceted user-generated data, research needs to rigorously collect and harmonize them.
Despite the great potential of physiological analytics in understanding users’ senses,
emotions, attention, information acquisition and more (Blikstein & Worsley, 2016;
Ochoa & Worsley, 2016; Maior et al., 2018) and early results to inform designs and
intuitive experiences (Feit et al., 2017; Bosch et al., 2015), their potential remains
underexplored and underutilized. Thus, we propose that Human-Computer Inter-
action (HCI) research should pursue multi-pronged approaches and the collection /
combination of complex and multimodal data, as well as the identification of the most
important features of those data-streams and their respective design implications.
2.4 Multimodal data collection and analysis
Utilizing representative, objective, diverse and accurate data allows us to better
understand users and design meaningful experiences for them (M. Giannakos et al.,
2018). Gaze has long been studied as an approach for understanding users’ behaviors
and cognitive states in HCI (Duchowski, 2007). For instance, pupil response has
been successfully used to infer cognitive and emotional processes (Bradley et al.,
2008), and pupil size has been used to infer cognitive listening load, user information
processing and understanding (Zekveld et al., 2014). Other gaze measurements,
such as fixations, saccades, and blinks, provide important cues for context-aware
environments which reveal how a user interacts with their surroundings and what
attracts a user’s attention (Bulling et al., 2011). Brain data using EEG signals have
also been used in HCI to detect shifts in engagement and workload. Properties of
EEG signals such as the different frequency bands provide cognitive information
with a high temporal resolution that can be linked to real-world stimuli (Hassib,
Khamis, et al., 2017). Despite the relatively expensive devices and specialized data
analysis techniques, HCI research recently showed the feasibility of using consumer
EEG sensors for sensing users’ engagement and providing useful design insights in
several domains (Huang et al., 2014; Hassib, Schneegass, et al., 2017; Mills et al.,
2017). Thus, regardless of the difficulty in collecting and analyzing multimodal data
generated during users’ interaction with a computer, it is arguable in HCI community
that such data have the capacity to provide rich information to inform design (what
we call in this paper, design capacities of multimodal data).
Despite the promising and successful applications of multimodal data collections
and the existence of the required statistical techniques, the capacities of multimodal
data as a means to understand and improve LCI remain largely unexplored, since
to the best of our knowledge there are no initiatives combining high variety of
different multimodal data collections (i.e., EEG, eye-movements, video, keystrokes
6International Journal of Information Management
Giannakos et al.,
Volume 48, October 2019, Pages 108-119
and wristband data). To capitalise on the design capabilities of multimodal data,
research needs to simultaneously study them, such that their respective usefulness
can be reliably assessed. This is the objective of our study, which we describe next.
3 METHODS
3.1 Context
To collect a fine-grained multimodal dataset during LCI, and to be able to extract
the features associated with learning, we designed a controlled experiment focusing
on skill acquisition. Skill acquisition (commonly termed also as movement-motor
learning (Ericsson et al., 2018)) is a loosely defined term that encompasses motor
adaptation and decision-making (Wolpert et al., 2011; Krakauer & Mazzoni, 2011).
Based on the cognitive approach, developing a skill leads to the acquisition and
memorization of an internal representation of a movement (conceptualized as a
motor schema) (Thon, 2015). Furthermore, learning such a skill allows to develop a
motor program while defining at the same time a sensory reference of the movement
before it is performed. To increase the efficiency of the sensory-motor loops that
take part in movement control, we can process sensory feedback and knowledge of
results. Sensory feedback refers to movement-related information and knowledge of
results to movement outcomes. Finally, when learners receive guidance verbally or
they rehearse mentally the skill to be learned, thus requiring cognitive effort, higher
cognitive processes occur during learning (Thon, 2015).
Because we wanted to maintain a simple learning curve for the LCI task, we devel-
oped a time-tested game that has been used to measure specific skills (motor skills) in
the past (Nicolson & Fawcett, 2000). Thus, we developed a Pac-Man game following
all the game play elements and giving 3 lives for each session (see Figure 1). The game
was controlled by the 4 arrow buttons of the keyboard and was developed to log every
keystroke of the user. The difficulty of the game increased from one session to another.
7International Journal of Information Management
Giannakos et al.,
Volume 48, October 2019, Pages 108-119
Figure 1: Screenshot of the home made Pac-Man game, basic concept for the game,
minimalistic design to achieve non-distracting environment.
3.2 Participants
We recruited a total of 17 healthy participants (7 females) aged between 17 and 49
years (mean = 32.05, SD = 8.84). Participants were recruited from the participant
pool of a major European university. Participants were familiar with the game, but
none of them had played the game in the previous 2 years. Prior to completing the
tasks, participants were informed of the purpose and procedure of the experiment
and of the harmlessness of the equipment. Participants were given a movie theater
ticket upon completion of the study.
3.3 Procedure
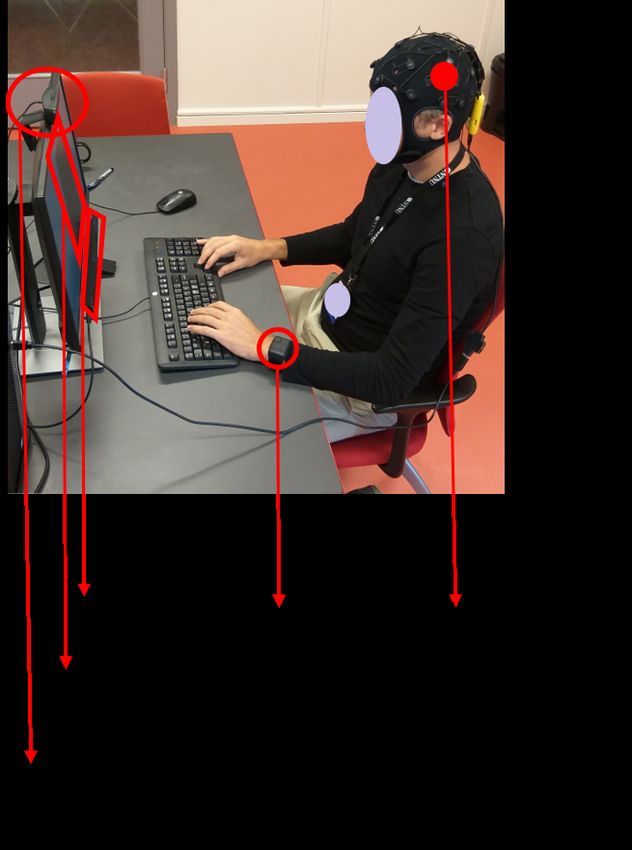
Upon obtaining consent, the researcher escorted the participant to the User Experience
(UX) room, which contained a chair facing a large computer monitor (see Figure 2).
The participant wore the wristband and EEG cap, and connected and then calibrated
all the data collection devices (i.e., eye-tracker, wristband, EEG, cameras). The
eye-tracking, EEG and the wristband data streams were calibrated using the standard
practices. The eye-tracker was calibrated using a 5-point calibration process; the EEG
data was calibrated using the ENOBIO EOG correction mechanism. The researcher
explained the mechanisms of the game and the respective keystrokes, double checked
the data collection devices, and exited the room. The participant had approx. 40
minutes to master the game and achieve a score that was as high as possible.
8International Journal of Information Management
Giannakos et al.,
Volume 48, October 2019, Pages 108-119
Figure 2: Setup of the experiment, participants wear the wristband and EEG cap, cal-
ibrated to eye-tracking recording device and initiate the video and keystroke recording
3.4 Experimental Design
The research design of our study is a single-group time series design (Ross & Morrison,
2004) with continuous (repeated) measurement of a group with the experimental
treatment induced. Each participant played on average 16 game-sessions (SD=7),
until their allocated time ran out. Each game-session started with 3 lives and ended
when the participant lost all the three lives. For each level in a game-session, the
speed of the ghosts increased. Figure 3 presents the protocol of our experiment.
Each participant was shown a 5-seconds break before starting each session, then
completed 2-3 minutes of game-play, and then had a 2-3 second reflection period
while looking at their game score (Figure 4).
Figure 3: Protocol of the experiment
9International Journal of Information Management
Giannakos et al.,
Volume 48, October 2019, Pages 108-119
Figure 4: Score evolution or each user over-time.
3.5 Multimodal Data Collection Setup
During the study we captured participants’ achieved score for each game session. In
addition, we collected sensor data from five different sources: keystrokes (represent-
ing click-stream data), eye-tracking, EEG, video, and wristband (with sensors for
heart-rate, blood-pressure, temperature and electrodermal activity levels).
KeyStrokes – Participants’ keystrokes were captured using Tobii’s software. We
used a full-size standard HP QWERTY keyboard (US English layout). The keys used
were ”N” to initiate a new game, and the arrow keys to move the pac-man. The raw
keystroke data consist of key press and a time-stamp of when the key event occurred.
EEG – We recorded 20-channel EEG data organized in a standard 20 chan-
nel actiCAP layout following the international 10-20 system, as shown in figure 5.
We built upon previous studies that utilize EEG headsets in detecting cognitive
engagement in the learning domain (Hassib, Schneegass, et al., 2017; Huang et al.,
2014; Szafir & Mutlu, 2013). The raw EEG data was recorded at a 500 Hz using
a head-mounted portable EEG cap by ENOBIO (ENOBIO 20 EEG device), Fz was
used as reference electrode, 2 channels were used for EOG correction, 1 channel for
reference and 3 Channel Accelerometer sampling rate at 100 Hz. We also applied
an EOG filter to remove noise from blinks.
Eye-tracking – To record users’ gaze we used the Tobii X3-120 eye-tracking de-
vice at 120 Hz sampling rate and using 5-point calibration. The device is non-invasive
and mounted at the bottom of the screen. The screen resolution was 1920x1080
and the participants were 50–70 cm away from screen. Tobii’s default algorithm was
used to identify fixations and saccades (for details please see (Olsen, 2012)).
Video – Given the fact that we expected participants to exhibit minimal body
and gesture information during the study, video recording focused on their face. We
use a Logitech Web cam capturing video at 30 FPS. The webcam focus was zoomed
150% onto the faces of participants. The video resolution was 640x480.
Wristband – To record arousal data we use the Empatica E4 wristband. Par-
10International Journal of Information Management
Giannakos et al.,
Volume 48, October 2019, Pages 108-119
Figure 5: EEG electrode layout of 20 channels (EEG Layout for the experiment.
The coloured ones are the electrodes being used . The white ones are those that the
ENOBIO cap provides option for. This is the Standard electrode layout provided
by the EEG capturing software. It is also known as the A-P (anterior-posterior)
Bipolar montage. This is also considered as Good “all-around” montage (Oostenveld
& Praamstra, 2001).
ticipants wore the wristband on the non-dominant/non-playing hand. Four different
measurements were recorded: 1) heart rate at 1 Hz, 2) electrodermal activity (EDA)
at 64 Hz, 3) body temperature at 4 Hz, and 4) blood volume pulse at 4 Hz.
4 Results
From our collected data we want to identify how well these data associate with skill
acquisition/development, and compare that to multimodal physiological models. We
use game scores as a proxy for the level of skill acquired by the participants in each
game session. In our analysis we explore relatively simple measurements such as
face detection in the video, fixation/saccade measurements and simple frequency
and auto correlation based features. We do not consider high-level features that
require analysis of the stimulus itself, such as through object recognition, or using
wavelet-transforms, or the definition of areas of interest.
Given the disparity of sampling rates of the different devices, we extract the fea-
tures from each data stream separately. For the facial landmark detection we use the
method described in (Kazemi & Sullivan, 2014) using Dlib and Python. The EEG and
Keystroke features are computed using custom-written scripts in Matlab using the
Signal Processing tool box and the eye-tracking features are computed using custom-
written scripts in R. Then, the data from all the measurements is combined and
11International Journal of Information Management
Giannakos et al.,
Volume 48, October 2019, Pages 108-119
analyzed using R. All the features are combined in two different ways. First, all the fea-
tures from all the data streams were passed through LASSO for feature selection, the
prediction results are marked by ”All” in the figure 7. Second, the features are selected
for each data stream separately, and then passed through the prediction algorithm us-
ing different combinations of the data streams, which are explicitly marked in figure 7.
4.1 Feature extraction
Given the limited sample in our study (17 participants, 251 game-sessions), the
models are trained over the data of the sessions. We then extract features that have
been used in literature to describe the respective data in previous studies. All the
features were normalized with the average of the first 5 seconds of the data to remove
the subjective bias from the data streams.
EEG - per channel: After obtaining data from the electrodes we normalize it
between 0-1 and compute the first 10 Auto-correlation Coefficients1 as proposed by
(Box et al., 2015) and further utilized in classification tasks by later work (Rahman et
al., 2018; Wairagkar et al., 2015; Buscema et al., 2015). Auto-correlation coefficients
describe the correlation between values of the same signal at different times, as a
function of the time lags (time domain). To identify which frequency bands are more
important, we compute the Fourier transform of the electrode signals and take the
first 10 Coefficients (first 10 dominant frequencies) (Sitnikova et al., 2009; Polat &
Güneş, 2007; Guo et al., 2010).
Table 1: EEG features
Feature domain Features extracted
Auto correlation coefficients for
Time domain
the 10 previous lags
Discrete Fourier Transform,
Frequency domain
first 10 coefficients
Key Strokes: We initially collect raw keystroke data, consisting of key press
and a time-stamp of when the key event occurred. We then derive our keystroke
features from the timing information describing key press timing (i.e., keystroke
dynamics). The only meaningful interaction through the keyboard was the arrow
keys (up, down, left, right) to maneuver the Pacman and “N” to restart the game
after loosing all the three lives. We create a time series based on all the key presses
(considered in the same series) to perform feature extraction. Similarly to mouse
behavior, keystroke dynamics seem promising for modeling user behavior (Epp et
al., 2011; Vizer & Sears, 2017). To extract the features, we take the first 5 auto
correlation coefficients, 6 linear predictive coefficients, energy of the signal, shape
1 Auto-correlation coefficients depend on the sampling frequency, however, we used the same
sampling frequency EEG for all our participant Therefore, the dependency remains consistent for all
the participants. Further, if someone uses the different sampling rate for the different participants, one
way to have the minimal error in auto-correlation estimation is to sample the different EEG devices
at the Nyquist frequency and then use the new samples to estimate the auto-correlation coefficients.
12International Journal of Information Management
Giannakos et al.,
Volume 48, October 2019, Pages 108-119
measures of the envelope of the signal (mean, variance, skew, kurtosis) and the
first 10 Fourier transform coefficients. Table 2 provides the specific key strokes
features.
Table 2: Key stroke features – all the arrow keys combined into one signal
Feature domain Features extracted
Auto correlation coefficients for the 5 previous lags, envelope
Time domain
of the signal (mean, SD, skew, Kurtosis)
Discrete Fourier Transform,
Frequency domain first 10 coefficients linear predictive coefficients (6),
energy of the signal
Video-Face: Following the literature (Kazemi & Sullivan, 2014), to extract
features from the videos we use as a guideline Figure 6. This allows us to extract
the facial landmarks and then take the pair-wise distances between the points from
the regions: right eye (15), left eye (15), right eyebrow (10), left eyebrow (10), nose
(36), mouth (66) and jawline (136).
Figure 6: Face’s landmark positions based on Kazemi & Sullivan (2014)
Gaze: Eye movement data provide the mean, variance, minimum, maximum
and median of several parameters, such as pupil diameters, fixation details, saccade
details, blink details, and event statistics. Table 3, provides an overview of the
extracted features as well as the respective reference from the literature.
Wrist band: From the Empatica E4 wristband we extract the following features:
mean, median, variance, skewness, maximum, minimum of (1) Blood volume pressure,
(2) EDA, (3) heart rate and (4) Temperature. These are all the measures available
from the recording device.
13International Journal of Information Management
Giannakos et al.,
Volume 48, October 2019, Pages 108-119
Table 3: Eye-tracking features
Eye
movement Features extracted
parameters
Diameter Pupil (Prieto et al., 2018) (mean, median, min, max, SD)
Fixation duration (Reichle et al., 2009) (mean, median, min, max, SD)
Fixation Fixation dispersion (Jaarsma et al., 2014) (mean, median, min, max, SD)
Skewness of fixation duration histogram (Abernethy & Russell, 1987)
Ratio of forward saccades to total saccades
(Krischer & Zangemeister, 2007) (scanpath velocity)
Ratio of global and local saccades
(Zangemeister & Liman, 2007) (threshold on sac. vel.)
Skewness of saccade velocity histogram (Liao et al., 2005)
Saccade
Saccade velocity (Russo et al., 2003) (mean, median, min, max, SD)
Saccade length (mean, median, min, max, SD)
Saccade amplitude (Phillips & Edelman, 2008)
(mean, median, min, max, SD)
Saccade duration (Vuori et al., 2004) (mean, median, min, max, SD)
Events Num. Fixations, Num Saccades, Fixation to saccade ratio
4.2 Feature Selection
To select the most important features we employ the Least Absolute Shrinkage and
Selection Operator (LASSO) (Tibshirani, 1996). LASSO is an extension of Ordinary
Least Square (OLS) regression techniques fit for the cases where the number of
examples are less than the length of the feature vector (Tibshirani, 1996). To find the
best fitting curve for a set of data points, OLS tries to minimize the Residual Sum
of Squares (RSS) which is the difference between the actual values of the dependent
variable (y) and the fitted values (ŷ). The formulation of the OLS is given as follows:
ŷ =↵0 + 1 X1 + 2 X2 +...+ n Xn
P The 2objective of the OLS regression
P 2 is to minimize the difference between
(ŷ y) with the constraint that i s. Where s is called the shrinkage factor.
LASSO on the other hand performs
P similar optimization with the slight difference
in the constraint, which is now abs( i)s. While using LASSO, some of the i
will be zero. Choosing s is like choosing the number of predictors in a regression
model. Cross-validation can be used to estimate the best suited value for s.
14International Journal of Information Management
Giannakos et al.,
Volume 48, October 2019, Pages 108-119
Table 4: Features selected by LASSO
Data Number of
Top Features Selected by LASSO
Stream selected features
Saccade velocity (median, mean, max),
Eye-tracking 9 (out of 42) Saccade length(sd, min), Saccade amplitude (max),
Saccade duration (min, max, sd)
First dominant frequency of all the channels
✓ band (4–7 Hz) P3, Fz , C3
EEG 17 (out of 357) ↵ band (8–13 Hz) P7, Cz , Pz , O1, O2, F3
band (lower frequencies 13–20 Hz) P4, P8, T8,
F8, C4, F4, T7, F7
Jawline measures, left and right eye opening,
Face video 18 (out of 290)
mouth opening
Auto correlation coefficient (effect of
past values),
linear predictive coefficient (coding shape of
Keystrokes 13 (out of 33) the signal),
linear frequency spectral coefficient (similar to
LPC but immune to random peaks)
Dominant Frequencies (2,5,6,7,10)
Heart rate (mean, std. dev.),
Electrodermal Activity (mean, std. dev.),
Wristband 8 (out of 24)
Body Temperature (mean, std. dev.),
Blood Pressure (Mean, std dev.)
Here, we use 5-fold cross validation to select the value of s. Our analysis seeks
to identify how each of the 744 extracted features from the 5 different data-streams
predicts motor-learning based on participants’ game scores. We group our results
along the five distinct categories of keystrokes, gaze, EEG, video, and wristband, and
then apply the LASSO regression2. There are 65 selected features that are found
to predict skill acquisition in our dataset (see Table 4).
4.3 Prediction Results
To identify how the different data-streams can predict skill acquisition (measured
from the game-score of the participants), we divide the whole data-set into training
and testing sets, with data from one participant retained for testing. We perform
a 17-fold cross validation (retaining one participant for testing each time) to remove
the sampling bias from the training set. The Normalized Root Mean Squared
Error (NRMSE) values shown in Figure 7 are the average values across all the cross
validation folds for the testing sets.
To identify the contribution of each of the five data-streams in the prediction,
we calculate and visualize the different NRMSEs obtained for every combination of
2 We also execute a non-linear feature selection using Generalized Additive models (allowing
for splines), this analysis produced similar results with LASSO.
15International Journal of Information Management
Giannakos et al.,
Volume 48, October 2019, Pages 108-119
data-streams (utilizing the respective features). To identify the impact of feature
selection made by LASSO we calculate and visualize the different NRMSEs obtained
when: 1) all the features are used (indicated by dots) and when 2) only selected
by LASSO features are used (indicated by bars). Thus, we first use the Random
Forest algorithm to predict the final score for every session, using all the 689 features
(depicted with dots in Figure 7), and then combine the different important features
selected by LASSO (see Table 4). In addition, we use the Random Forest algorithm
to predict the final score for every session (depicted with dots in Figure 7. To
summarize, Figure 7 depicts the NRMSE prediction Random Forest: 1) by using
only the selected features (the features selected by LASSO as presented in Table 4) -
shown by bars and 2) by using all the extracted features (the 689 features extracted
from the five data-streams) - shown by dots.
The results in Figure 7 indicate that the combination of the selected features
coming from eye-tracking, EEG and video data-streams provide the most accurate
prediction of skill acquisition, while keystrokes alone provide the least accurate
prediction. In addition, in every case the selected features (i.e., bars) provide more
accurate prediction when compared with the prediction coming from the all the 689
features (i.e., the whole dataset) and represented in Figure 7 with dots.
Figure 7: Normalized Root Mean Squared Error (NRMSE) prediction from LASSO
and Random Forest shown by bars (only with the selected features by LASSO as
presented in Table 4), while the dots represent the prediction error when all the
689 features (i.e., the whole dataset) was used, the error-bars represent the 95%
confidence interval.
The performance with modality fusion from Eye-Tracking, EEG and Video gives
the optimal prediction with an error of 6% (i.e., NRMSE 0.06). To identify if the
optimal prediction is significantly greater than any other combination, we used
Analysis of Variances (ANOVA) to test it against the second best (i.e., eye-tracking)
and found a significant difference (F[1,32] = 9.26, p < 0.05). Thus our our proposition
16International Journal of Information Management
Giannakos et al.,
Volume 48, October 2019, Pages 108-119
that multimodal data-streams have the capacity to give more accurate prediction
of users’ skills acquisition compared to traditional click-stream models has been
confirmed. To go one step further we test if multimodal data that are relatively easy-
to-collect (i.e., video, wrist-data, clickstreams) have the capacity to give more accurate
prediction compared to traditional click-stream models. Thus, we used an ANOVA to
test the keystroke prediction against the one that combines keystrokes, video and wrist-
data. Our results indicate a significant difference (F[1,32] = 5.01, p < 0.05), confirming
our proposition that even relatively easy-to-collect multimodal data have the capacity
to obtain significantly greater predictions from traditional click-stream models.
5 DISCUSSION
Our results suggest that although different modalities can be a good proxy for skill
acquisition (especially eye-tracking), fusing data from different modalities has the
potential to further increase the accuracy of the prediction.
Our findings indicate that the modality that is used in the majority of studies (i.e.,
keystrokes) has the least accuracy (39% error, using all the features). For example,
a recent literature review (Mangaroska & Giannakos, 2018) explains how only a few
studies go beyond clickstreams/keystrokes to inform learning design features, while
another literature review on prediction in online courses found that only features
related with user actions/preferences are used to build prediction models (Moreno-
Marcos et al., 2019). Our results show that keystroke performance can be improved if
the researchers perform feature selection (17 % error), something that is in accordance
with the literature (e.g., (Moreno-Marcos et al., 2019, 2018; Maldonado-Mahauad et
al., 2018)). Yet, we find that fusing eye-tracking, EEG and video data-streams is the
most accurate combination with an error of 6% (i.e., NRMSE 0.06). In other words,
our results suggest that there is a substantial difference between what most studies
in learning technology currently utilize (keystrokes), versus the expected potential
of using multimodal data.
Taking into consideration both the technical difficulty and the high cost for the
EEG and eye-tracking data collection, it is understandable why many studies in
learning technology shy away from them. Nevertheless, researchers do not need to
invest in expensive equipment and procedures to improve their models. Our results
show that by simply combining data from the web camera and keystrokes can lead
to an improved error rate (i.e., 15% error). Additionally, if a physiological wristband
is available, then combining the web-camera with a wristband device like Empatica
can reduce the error to 12%. While these approaches we recommend here may
not achieve the optimal error rate of 6%, they are significantly convenient from a
technical standpoint and do improve performance.
5.1 Contributions to knowledge
Understanding and supporting users’ learning experience is still very limited, consid-
ering the wide range of multimodal data produced when a learner interacts with a
system (M. Giannakos et al., 2018). Most of the work in the literature utlilizes data
17International Journal of Information Management
Giannakos et al.,
Volume 48, October 2019, Pages 108-119
coming from click-streams, keystrokes and self-reports (Moreno-Marcos et al., 2019;
Maldonado-Mahauad et al., 2018). Predictive models are being used for anticipating
learners’ behavior and performance (Moreno-Marcos et al., 2018). Accurate predic-
tion of behavior or achievements is very important in learning technology research
(Gray & Perkins, 2019). Considering multimodal data in learning technologies (i.e.,
MMLA), from a predictive standpoint, this study clarifies that brain activity, facial
reactions, arousal levels and gaze, can help us to better predict learner’s behavior
and achievements than the typical log data produced during the learner-system
interaction. Since brain, gaze, facial features and arousal data are objective and do
not suffer from measurement biases (Dimoka et al., 2012), our verified proposition in
this paper is that they can be more reliable and accurate predictors (Bernheim, 2008).
Since accuracy as well as early prediction are vital for contemporary learning systems
(e.g., learner modeling, adaptive environments etc.), confirming and quantifying the
benefits of multimodal data provides an evidence that learning technology research
can rely on multimodal data to advance design systems that facilitate favorable
behaviors and effectively enhance learning.
As noted in many of the examples offered in this paper, the value of multimodal
data largely lies in combining physiological data with other sources of data. The bene-
fit of any new multimodal data-stream lies in how it complements and works together
with existing data-streams. It needs to be stated that multimodal data (including
physiological) should not be seen as an attempt to replace, but rather to complement
and supplement existing data-streams (e.g., clickstreams, self-reports). Our contri-
bution is in accordance with similar works in other disciplines like ergonomics (Neu-
roergonomics) (Kramer & Parasuraman, 2007) and Information Systems (NeuroIS)
(Dimoka et al., 2012, 2011), but introduces, for first time, five different data-streams
and quantifies the predictive power compared to commonly used click-stream models.
In addition, it investigates a very interesting area, that of learning systems, and
exemplifies the great potential of multimodal- and physio- adaptive learning systems.
The value of multimodal data also comes from the fact that several latent vari-
ables cannot be measured objectively due to measurement biases, such as utility, and
cognitive overload. Such variables can be measured reliably with multimodal data
(Dimoka et al., 2012), enabling a new wave of research in the fields of systems’ design
(e.g., HCI and learning technologies). Nonetheless, differences between the various
forms of multimodal data (e.g., physiological and computer logs or self-reports) should
not necessarily imply that either approach is better. Instead it shows that there is a
need for cross-validation when measuring complex constructs that are hard to capture
accurately with a single data source. Differences between multimodal data may imply
that either respondents are not willing or not able to self-report certain conditions
(Dimoka et al., 2012), or simply that the human body simply cannot represent the
richness of psychometric measures (Logothetis, 2008), or psychometric measures are
not complex enough to capture the richness of the interaction with the system (e.g.,
cognitive load). Thus, besides increasing prediction accuracy, multimodal data also
allows cross-validation and measurement of complex constructs that are hard (or
even impossible) to capture with high accuracy using only a single data source.
Extending our work, the various multimodal data (e.g., brain data, gaze) might
be able to better predict the success of most of the computer-based systems compared
18International Journal of Information Management
Giannakos et al.,
Volume 48, October 2019, Pages 108-119
to self-reports. In addition, their high frequency and accuracy make them more
appropriate for smaller sample sizes and short interventions (Dimoka et al., 2012).
Another promising role of multimodal data is to inform debates that cannot be
fully resolved with existing, most of the times single-source, data-sets. Many of
the examples offered in this paper involve complex constructs that are still in their
infancy or not fully democratized in the HCI and learning technology literature
(e.g., cognitive states, cognitive load, mental state). In addition, the complexity
that we can capture from multimodal data can be further examined through the
configurational analysis prism. Recent works employ configurational analysis (e.g.,
fuzzy-set Qualitative and Comparative Analysis - fsQCA) and combine self-reported
data and data streams, leading to a deeper understanding of the user (Papamitsiou
et al., 2018; Pappas et al., 2019). Extending this work by fusing various multimodal
data can have a significant impact in the way we currently view and understand
the theories we use as well as the phenomena we study. Finally, multimodal data
may also uncover new constructs (e.g., capturing temporary experience within a
task) that have been ignored in the literature (e.g., they could not be adequately
measured), thus furthering our understanding as well as the current theories.
5.2 Implications for practice
To gain further insight into the design of learning technologies, we consider the
specific features that we find to be strongly associated with learning. Discussing
these features from a technical standpoint can give rise to practical implications for
the design of learning technologies.
First, our analysis of the eye-tracking data-stream revealed a number of feature
categories as important learning predictors (skill acquisition). The first category
includes features related to users’ fatigue, anticipation and task difficulty (i.e., median,
mean, max of saccade velocity) (McGregor & Stern, 1996; Bocca & Denise, 2006).
This provides evidence that it is critical when we design learning technologies to
monitor users’ fatigue and relatively task difficulty and adapt the content accordingly.
This is an unsurprising finding, as it is in accordance to the vast literature that
proposes to keep the learner in a ”flow experience” (Csikszentmihalyi, 2014), allowing
them to engage with challenging, but not overwhelming experiences. Our results
confirm this assertion, and show that using eye-tracking data it is possible to account
for a large portion in the variation of learning.
The second important eye-tracking feature set relates to user’s ability to see
specific information (i.e., s.d. and min of saccade length). The implication of this
finding is that designing environments that allow users to easily identify the details
and avoid long saccades (e.g., big dashboards) can improve learning (Russo et al.,
2003; Phillips & Edelman, 2008). Another important feature set relates to user’s high
cognitive load (i.e., max saccade amplitude (May et al., 1990; Goldberg et al., 2002))
and high task difficulty (i.e., min, max, s.d. saccade duration (Vuori et al., 2004;
Bestelmeyer et al., 2006)). Given that cognitive load and task difficulty indicate
how much “space” in working memory is currently being used (Sweller, 2011), the
observed strong association with learning was expected. This verifies previous studies,
but also indicates the potential of integrating the germane cognitive load principles
19International Journal of Information Management
Giannakos et al.,
Volume 48, October 2019, Pages 108-119
into HCI (Hollender et al., 2010).
In the EEG data-stream we identify the Fourier coefficient of the most dominant
frequency in each channel to be the most predictive. We further analyze the signal
from every EEG channel to find the most dominant frequency band present, resulting
to the identification of the theta band (4–7 Hz, 3 channels), alpha band (8–18 Hz,
6 channels) and lower beta band (13–20 Hz, 8 channels). These frequency bands
are strongly associated with depicting attention, emotion, load on the memory, and
cognitive load respectively. For example, the presence of theta band reflects load on
working and/or episodic memory (Kiiski et al., 2017; Dai et al., 2017; Klimesch et al.,
1994), the alpha band indicates attention (Klimesch et al., 1998; Shaw, 1996) and
arousal (alertness, (Gazzaniga, 2012)), both alpha and theta bands reflect cognitive
load while solving problems (Kiiski et al., 2017; Dai et al., 2017; Klimesch et al.,
1994), and finally, the beta band has been shown to reflect emotional process (Ray
& Cole, 1985) and inattention (Roh et al., 2016; Loo et al., 2018). Since our findings
show that these bands are strongly associated with learning, we argue that these
processes should be considered when designing the User Interface or the overall User
Experience, to improve learning outcomes.
In the face-video data-stream we identified important features that relate to
jawline measures, mouth opening, and eyes opening. These features relate to affec-
tive states. In affective computing, and in particular affective learning technologies
(Kapoor & Picard, 2005; Whitehill et al., 2014), these states have been used to
create affective instructional strategies (Bosch et al., 2015). Such strategies can offer
valuable information in advancing learning technologies (Bosch et al., 2015; Wiggins
et al., 2015; Rana & Dwivedi, 2017), such as providing information that a user is
engaged or delighted with the current task.
In the wristband data-stream, the important features are mean and SD for heart
rate, electrodermal activity, body temperature and blood pressure. These are features
associated with users’ affective states (Slovák et al., 2014; Hassib et al., 2016). Given
that the core idea is to utilize multimodal data to enhance the learning experience,
one promising strategy is to identify and minimize negative affective states (e.g.
frustration, confusion, boredom) through a learning technology that has the capacity
to utilize learner’s affective state. Our findings quantify how much benefit we can
expect to gain by incorporating such measures in the design of learning systems.
Finally, in the more traditional keystroke data-stream, the important features
relate to stability/predictability of a user’s input (i.e., auto correlation coefficient),
input behavior/pattern (i.e., linear predictive coefficient), duration of the patterns (i.e.,
mean of envelope shape) and the highest point of activity (i.e., the most Dominant
Frequency). Such keystroke dynamics are associated with users’ cognitive and affective
states, like mood and emotions (Epp et al., 2011), and cognitive and physical stress
(Vizer & Sears, 2017; Vizer, 2013). As a baseline performance improvement, our
work shows that if only keystroke data is available, then it is prudent to perform
feature selection on the data, rather than using all available features, since that can
almost half the achieved error rate without incorporating additional modalities.
Overall, our results point to the triangulation of insights coming from different
modalities as a means to achieve better (but also faster) identification of learners’
cognitive-affective states. If an LCI scenario has the capability to collect multimodal
20You can also read