Measurement report: Balloon-borne in situ profiling of Saharan dust over Cyprus with the UCASS optical particle counter - Recent
←
→
Page content transcription
If your browser does not render page correctly, please read the page content below
Atmos. Chem. Phys., 21, 6781–6797, 2021
https://doi.org/10.5194/acp-21-6781-2021
© Author(s) 2021. This work is distributed under
the Creative Commons Attribution 4.0 License.

Measurement report: Balloon-borne in situ profiling of Saharan
dust over Cyprus with the UCASS optical particle counter
Maria Kezoudi1,2 , Matthias Tesche2,a , Helen Smith2,b , Alexandra Tsekeri3 , Holger Baars4 , Maximilian Dollner5 ,
Víctor Estellés6,7 , Johannes Bühl4 , Bernadett Weinzierl5 , Zbigniew Ulanowski2,8,9 , Detlef Müller2 , and
Vassilis Amiridis3
1 Climate  and Atmosphere Research Center (CARE-C), The Cyprus Institute, Nicosia, Cyprus
2 Centre  for Atmospheric and Climate Physics Research (CACP), University of Hertfordshire, Hatfield, United Kingdom
3 National Observatory of Athens, Athens, Greece
4 Leibniz Institute for Tropospheric Research, Leipzig, Germany
5 Faculty of Physics, Aerosol Physics and Environmental Physics, University of Vienna, Vienna, Austria
6 Earth Physics and Thermodynamics Department, University of Valencia, Valencia, Spain
7 ISAC-CNR, Rome, Italy
8 School of Earth and Environmental Sciences, University of Manchester, Manchester, United Kingdom
9 British Antarctic Survey, NERC, Cambridge, United Kingdom
a now at: Leipzig Institute for Meteorology (LIM), Leipzig University, Leipzig, Germany
b now at: TruLife Optics Ltd, London, United Kingdom

Correspondence: Maria Kezoudi (m.kezoudi@cyi.ac.cy)

Received: 18 September 2020 – Discussion started: 6 November 2020
Revised: 12 March 2021 – Accepted: 29 March 2021 – Published: 5 May 2021

Abstract. This paper presents measurements of mineral dust       balloon-borne measurements agrees with those derived from
concentration in the diameter range from 0.4 to 14.0 µm with     coinciding Raman lidar observations at height levels with
a novel balloon-borne optical particle counter, the Universal    particle number concentrations smaller than 10 cm−3 for the
Cloud and Aerosol Sounding System (UCASS). The balloon           diameter range from 0.8 to 13.9 µm. An overestimation of the
launches were coordinated with ground-based active and pas-      UCASS-derived extinction coefficient of a factor of 2 com-
sive remote-sensing observations and airborne in situ mea-       pared to the lidar measurement was found for layers with par-
surements with a research aircraft during a Saharan dust out-    ticle number concentrations that exceed 25 cm−3 , i.e. in the
break over Cyprus from 20 to 23 April 2017. The aerosol          centre of the dust plume where particle concentrations were
optical depth at 500 nm reached values up to 0.5 during that     highest. This is likely the result of a variation in the refractive
event over Cyprus, and particle number concentrations were       index and the shape and size dependency of the extinction
as high as 50 cm−3 for the diameter range between 0.8 and        efficiency of dust particles along the UCASS measurements.
13.9 µm. Comparisons of the total particle number concen-        In the future, profile measurements of the particle number
tration and the particle size distribution from two cases of     concentration and particle size distribution with the UCASS
balloon-borne measurements with aircraft observations show       could provide a valuable addition to the measurement capa-
reasonable agreement in magnitude and shape despite slight       bilities generally used in field experiments that are focussed
mismatches in time and space. While column-integrated size       on the observation of coarse aerosols and clouds.
distributions from balloon-borne measurements and ground-
based remote sensing show similar coarse-mode peak con-
centrations and diameters, they illustrate the ambiguity re-
lated to the missing vertical information in passive sun pho-
tometer observations. Extinction coefficient inferred from the

Published by Copernicus Publications on behalf of the European Geosciences Union.
6782                                                                M. Kezoudi et al.: Balloon-borne in situ dust profiling

1   Introduction                                                 importance for identifying and evaluating the physical pro-
                                                                 cesses governing aerosol–cloud interactions and their climate
Atmospheric aerosols are of significant importance for the       effects which currently contribute considerable uncertainty
Earth’s radiative budget. They have a direct impact on cli-      to our understanding of current and future climate change
mate by scattering and absorbing solar radiation. They can       (Stocker et al., 2013) as well as to the performance of numeri-
also act as ice-nucleating particles and cloud condensation      cal weather prediction models (Baldauf et al., 2011). The ma-
nuclei and thus influence not only the formation and evo-        jority of the data assimilated into models and used for model
lution of clouds but also the hydrological cycle (Stocker        verification comes from remote-sensing observations (Lahoz
et al., 2013). Aerosols and their precursors originate from      and Schneider, 2014). Meteorological soundings in combina-
natural and anthropogenic sources. Natural sources include       tion with an optical particle counter (OPC) can provide time
emissions from the ocean, soils, volcanoes, and vegetation,      series of aerosol size distribution profiles that have the poten-
whereas anthropogenic sources include emissions from the         tial to complement the data for assimilation in and verifica-
combustion of fossil fuels or the result of changes in land      tion of atmospheric models. The purpose of this paper is to
use (Boucher, 2015). For instance, sulfates and soot can be      present results of in situ measurements of mineral dust parti-
of both natural and anthropogenic origin, while mineral dust     cles over the eastern Mediterranean with a novel disposable
and marine aerosols originate predominantly from natural         balloon-borne OPC and to assess the quality of the collected
sources (Rodriguez et al., 2002; Kaufman et al., 2005; Quaas,    data based on independent observations.
2011). The latter two aerosol types are abundant in the atmo-       OPCs are well-established optical instruments for the mea-
sphere, and particularly mineral dust can be transported over    surement of particle size distributions in the size range be-
intercontinental distances from its source regions (Prospero,    tween 0.060 and 100 µm. However, only few current OPCs
1999; Weinzierl et al., 2017).                                   have been specifically developed for balloon-borne measure-
   Over the past 15 years, several measurement campaigns         ments, which can only be performed with lightweight in-
have focused on gaining deeper insight into the role of min-     struments. The light optical aerosol counter (LOAC) is a
eral dust in the Earth’s system. An overview of several          balloon-borne OPC that was designed for the detection of
mineral dust field campaigns is given in Weinzierl et al.        irregularly shaped aerosols in the diameter range from 0.2 to
(2017). These experiments generally featured comprehen-          100.0 µm (Renard et al., 2016). It was deployed for aerosol
sive remote-sensing instrumentation; detailed monitoring of      profiling during a dust event in the framework of CHArMEx
chemical, microphysical, and optical properties of aerosols      in 2013 (Renard et al., 2018). The non-disposable LOAC
at the surface; and airborne in situ observations with re-       weighs about 1 kg, and the sampled air is drawn through an
search aircraft. Such observations have been performed, for      inlet into the measurement chamber. Hence, the LOAC is not
instance, during the two Saharan Mineral Dust Experiments        suitable for cloud sampling as cloud droplets might not be
(SAMUM; Weinzierl et al., 2009; Ansmann et al., 2011),           able to pass through the inlet without shattering or evapora-
Fennec (Ryder et al., 2013), the Saharan Aerosol Long-           tion losses. The cloud particle sensor (CPS; Fujiwara et al.,
Range Transport and Aerosol–Cloud-Interaction Experiment         2016) is a balloon-borne instrument for measuring cloud par-
(SALTRACE; Weinzierl et al., 2017), and the CHemistry and        ticle number concentrations in the diameter range from 2 to
AeRosols Mediterranean EXperiment (CHArMEx; Renard               80 µm. It measures the state of polarization of the scattered
et al., 2018). Recently, the focus of such activities has ex-    laser light and provides information on cloud phase. The CPS
tended towards the eastern Mediterranean as this region is       also employs an inlet sampling system. The CPS was devel-
on the crossroad of aerosol transport of mineral dust from       oped specifically for cloud measurements, and the lower de-
Sahara and Middle East, continental outflow from Europe,         tection limit allows us to sample only coarse aerosol parti-
and biomass-burning smoke from eastern Europe and central        cles. In contrast to conventional OPCs (with the exception of
Asia (Georgoulias et al., 2016). The majority of dust storms     airborne wing-mounted probes) that draw air through a nar-
over the eastern Mediterranean basin occur between Decem-        row channel behind an inlet, the Universal Cloud and Aerosol
ber and April with maximum dust load during April (Israele-      Sounding System (UCASS) OPC was developed with an
vich et al., 2002). The main zones of cyclogenesis in the        open sampling path (Smith et al., 2019). This open-path de-
Mediterranean Sea determine dust uplift and transport in the     sign reduces cut-off and shattering effects that can lead to
region (Alpert et al., 1990; Bou Karam et al., 2010). Heavy      counting and sizing uncertainties and makes the instrument
dust periods over the eastern Mediterranean are frequently       suitable for measurements of both aerosols and clouds.
associated with the so-called Cyprus Low (Katsnelson, 1970;         Measurements presented here have been performed in the
Dayan et al., 2008) as well as the Sharav cyclone (Alpert and    framework of the European Research Council (ERC) project
Ziv, 1989), which transport dust from the Arabian deserts and    entitled “Absorbing aerosol layers in a changing climate:
northern Sahara into the eastern Mediterranean basin where       ageing, lifetime and dynamics” (A-LIFE, https://www.a-life.
they are frequently observed over Cyprus.                        at/, last access: 2 February 2021) that was based on Cyprus.
   Statistical information on the size distributions of atmo-    The aim of A-LIFE was to investigate the properties of ab-
spheric aerosols, cloud droplets, and ice crystals is of vital   sorbing aerosols, particularly of mixtures of mineral dust and

Atmos. Chem. Phys., 21, 6781–6797, 2021                                            https://doi.org/10.5194/acp-21-6781-2021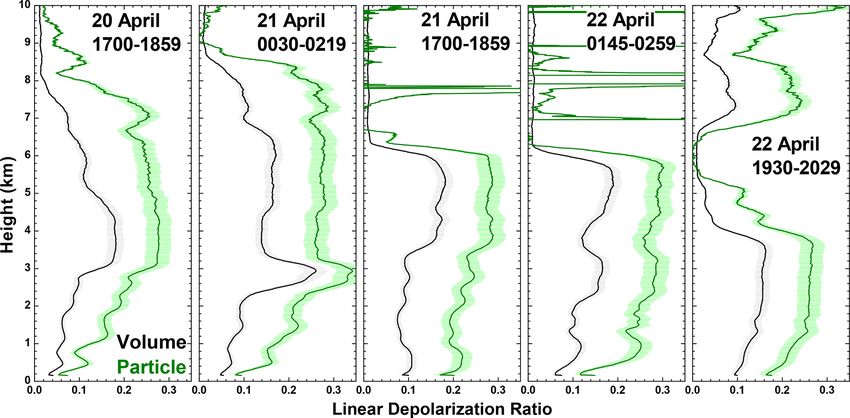
M. Kezoudi et al.: Balloon-borne in situ dust profiling                                                                       6783

black carbon. The activities incorporated measurements with         through the UCASS’ open detection path is determined by
a research aircraft, advanced aerosol lidars, sun photometers,      the ascent rate u of the meteorological balloon. Effects of a
and ground-based in situ instrumentation. An intense dust           tilt of the instrument on the flow rate are discussed in Smith
outbreak from 20 to 23 April 2017 provided ideal conditions         et al. (2019). During the launch preparation, the balloon is
for deploying the UCASS OPC for balloon-borne in situ dust          filled to a size that translates into an ascent rate of about
profiling. This is the first paper that is focussed on present-     5 m s−1 to guarantee optimum measurement performance of
ing results of UCASS measurements from field deployment.            the UCASS. In the data analysis, the ascent rate is calculated
It is organized as follows. Section 2 presents the instrumen-       from the change in height h with time t by u = 1h/1t. The
tation and methods. Findings are described and discussed in         ascent rate is used to calculate the volume v of sampled air by
Sect. 3. Conclusions and a summary are given in Sect. 4.            v = Aut with the UCASS sample area of A = 5.0×10⁻⁷ m2 ,
                                                                    which is specified as a section of the laser beam (Smith et al.,
                                                                    2019). The device electronics can measure up to 104 particles
2     Instruments and methods                                       per second and can operate in air flow speeds between 2 and
                                                                    15 m s−1 , with the standard firmware. For a standard operat-
2.1    UCASS                                                        ing velocity of 5 m s−1 , the corresponding particle concen-
                                                                    tration is 3.5 × 103 cm−3 (Smith et al., 2019).
The Universal Cloud and Aerosol Sounding System                         The raw particle counts C per size bin i are used to calcu-
(UCASS) is a lightweight, disposable OPC that was devel-            late the particle number concentration per size bin ni = Ci /v
oped at the University of Hertfordshire (Smith et al., 2019).       as number of particles per unit volume over the covered size
The UCASS unit weighs 280 g and was designed for use as             range. Summation of ni over all size bins leads to the total
a balloon-borne instrument, as a dropsonde, or on an un-            number concentration N. The particle number size distribu-
manned aerial vehicle (UAV; Girdwood et al., 2020). The             tion is determined by
UCASS OPC features an open-path geometry that prevents
                                                                                          ni
particle losses and droplet shattering by the inlet that would      dni /dlogDi =                                               (1)
need to be corrected for during data analysis (Smith et al.,                        logDi+1 − logDi
2019). The instrument operates a 658 nm laser diode and
                                                                    with the assumption of spherical particles. While mineral
collects light scattered by individual particles in an angular
                                                                    dust particles are non-spherical, the shape effect on the scat-
range between 16 and 104◦ . Depending on the configuration
                                                                    tering phase function with respect to spherical particles is
mode and the laboratory calibration, UCASS can measure
                                                                    less pronounced within the angular range exploited in the
either aerosols in the diameter (optical) range between 0.4
                                                                    UCASS setup (forward to sideward scattering) compared to
and 17.0 µm or cloud droplets in the detection range from
                                                                    scattering in the backward direction. Hence, the use of Mie
1.0 to 40.0 µm. The uncertainty of the number concentration
                                                                    scattering has a small effect on the calculated size distribu-
measured when UCASS is launched with a radiosonde was
                                                                    tions even in the presence of non-spherical particles (John-
found to be about 8 % using computational fluid dynamics
                                                                    son and Osborne, 2011; Lacis and Mishchenko, 1995). More
modelling as presented in Smith et al. (2019). This value re-
                                                                    specifically, Johnson and Osborne (2011) estimate a maxi-
sults from varying airflow related to the tilt of the instrument.
                                                                    mum error of 21 % related to the assumption of spherical
Comparisons to reference instruments during laboratory ex-
                                                                    dust particles which they assess as moderate compared to the
periments with a fixated UCASS showed a smaller uncer-
                                                                    other errors inherent in the derivation of the total optical pa-
tainty of the measured number concentrations. A detailed de-
                                                                    rameters.
scription of the instrument and its calibration can be found in
                                                                       The column-integrated volume–size distribution for com-
Smith et al. (2019).
                                                                    parison to the normalized volume–size distributions provided
   The UCASS OPC is typically deployed in combination
                                                                    from remote-sensing retrievals is calculated using the sum
with a Graw DFM-09 radiosonde (https://graw.de/products/
                                                                    of the number concentration for each bin over the entire as-
radiosondes/dfm-09, last access: 6 March 2021), which is
                                                                    cent together with the bin centre (Di+1 + Di )/2 and width
used to measure relative humidity, temperature, and pressure.
                                                                    Di+1 − Di by
At every 1 s interval, the dataset is either saved to an on-board
micro SD card or transmitted via a serial link (XDATA proto-
                                                                                         Di+1 +Di 3

col) to a radiosonde device for radio frequency transmission                      π ni      2
of the data (Smith et al., 2019). The DFM-09’s XDATA in-            dVi /dlogDi =                    .                          (2)
                                                                                   6 logDi+1 − logDi
terface is used for transmitting the UCASS data in 10 size
bins together with time of flight data for quality assurance.       The effective diameter is defined by Hansen (1971) as the
Other sondes employing the XDATA protocol can be used               ratio of the volume to the surface-area concentration by
as well. The UCASS-radiosonde payload can be used to ob-                   R∞
tain aerosol and cloud profiles from the surface up to the                      n(Di )Di3 dDi
                                                                    deff = R0∞          2
                                                                                              .                              (3)
tropopause within about 60 min from launch. The flow speed                   0 n(Di )Di dDi

https://doi.org/10.5194/acp-21-6781-2021                                             Atmos. Chem. Phys., 21, 6781–6797, 2021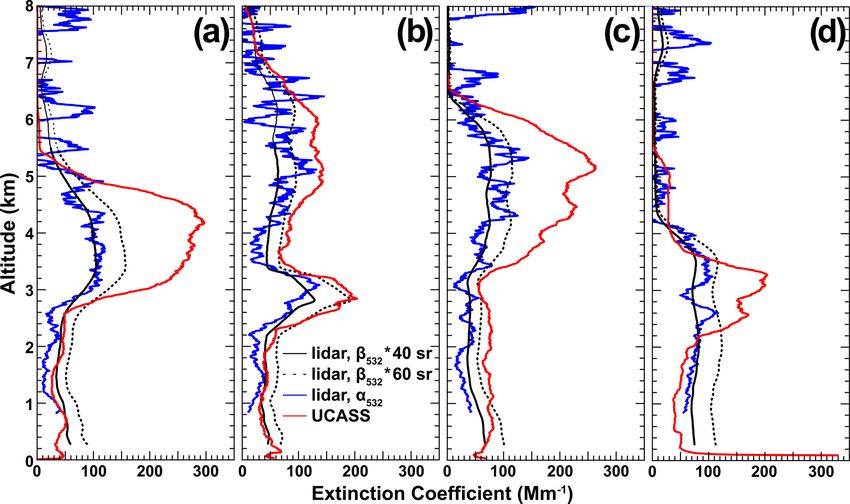
6784                                                                     M. Kezoudi et al.: Balloon-borne in situ dust profiling

The effective diameter is calculated over the entire UCASS         gles at 440, 675, 870, and 1020 nm (Holben et al., 1998). In
measured size range.                                               this work, only AERONET version 3 level 2.0 data are con-
   UCASS measurements can be used to calculate the aerosol         sidered.
extinction coefficient. This can then be compared to the ex-          The DLR Falcon research aircraft was equipped with an
tinction coefficient profile derived from collocated lidar mea-    extensive in situ aerosol payload including total aerosol con-
surements. For a particle with diameter D and known refrac-        centration measurements (0.005–930 µm), highly resolved
tive index, the size-dependent extinction efficiency Qext (D)      size distribution measurements in the range between 0.25 and
(unitless) can be derived from Mie-scattering calculations.        930 µm particle diameter, a wind lidar, and meteorological
Here, we use a refractive index of 1.52 + 0.002i. Then, the        sensors. Furthermore, aerosol optical properties were deter-
extinction cross section of the particle (in square metres) is     mined, and particles were collected for offline chemical anal-
calculated by Cext = (π D 2 /4)Qext (D). Using the measured        yses. The setup was similar to earlier campaigns that also fo-
number concentration for each UCASS bin (10 bins in total),        cused on mineral dust (Weinzierl et al., 2009, 2011, 2017).
the extinction coefficient (in reciprocal metres) is derived by    Local column closure flights were performed at the sites of
                                                                   Paphos airport and the Limassol lidar station. In this paper,
      10
      X                                                            UCASS measurements are compared to data collected with
α=          ni Cext,i .                                     (4)    a second-generation Cloud, Aerosol, and Precipitation Spec-
      i=1
                                                                   trometer (CAPS; Spanu et al., 2020) that was mounted at the
2.2    A-LIFE instrumentation                                      aircraft wing. The CAPS instrument consists of a cloud and
                                                                   aerosol spectrometer with depolarization detection (CAS)
In order to demonstrate the UCASS’ capability of profil-           and a cloud imaging probe (CIP). Furthermore, it contains
ing aerosol number concentrations and size distributions, the      a few minor sensors including a liquid water content (LWC)
quality of its observations needs to be evaluated with the help    sensor, a pitot tube measuring the airspeed, and sensors for
of independent data. To meet optimum conditions for com-           pressure, temperature, and relative humidity. The CAS uses
parison, UCASS launches during A-LIFE were coordinated             a 658 nm laser to observe the size distribution of particles be-
with ground-based remote sensing (also ensuring the tem-           tween approximately 0.5 and 50.0 µm (optical diameter). The
poral collocation of active and passive instruments) and the       CIP uses a linear array of 64 photodiodes to detect shadow
flight schedule of the DLR Falcon research aircraft.               images of particles in the size range between 15 and 930 µm
   A PollyXT multiwavelength aerosol Raman lidar (Engel-           in diameter. For the comparison to UCASS observations,
mann et al., 2016) from the Institute for Tropospheric Re-         CAPS measurements were opted to fit within the UCASS
search (TROPOS), Leipzig, Germany, was operated at Li-             sampling range spanning from 0.79 to 13.90 µm in diameter.
massol from October 2016 to March 2018 in the framework            During A-LIFE, a total of 17 research flights were performed
of the Cyprus Clouds Aerosols and Rain Experiment (Cy-             over the eastern Mediterranean, i.e. from or to Paphos. Two
CARE). PollyXT measures profiles of aerosol backscatter co-        of those flights could be matched to UCASS measurements
efficients at 355, 532, and 1064 nm; aerosol extinction co-        in both time and space.
efficients at 355 and 532 nm; and aerosol linear depolariza-
tion ratios at 355 and 532 nm. The latter parameter is highly      2.3     Remote-sensing retrievals
sensitive to particle shape, and the corresponding measure-
ments are calibrated following the methodology outlined in         UCASS in situ measurements of the particle size distri-
Freudenthaler (2016). Lidar-derived values of aerosol optical      bution and the subsequently derived extinction coefficient
depth are inferred by extending the profiles down to the sur-      are also evaluated with the findings from remote-sensing
face using the lowermost trustworthy value above the over-         observations. For this purpose, lidar and sun photometer
lap range. These measurements provide insight into the ver-        data are used as input to the Generalized Aerosol Re-
tical distribution of aerosol concentration, size, and type (En-   trieval from Radiometer and Lidar Combined data algo-
gelmann et al., 2016). Near-real-time data from the PollyXT        rithm (GARRLiC; Lopatin et al., 2013) and the AERONET
website (http://polly.tropos.de, last access: 4 March 2021)        (Dubovik et al., 2006) and ERS/SKYNET-SKYRAD (Cam-
were consulted to schedule UCASS launches for dust obser-          panelli et al., 2007) inversions. The use of in situ data from
vations.                                                           OPC measurements as a benchmark allows for an assess-
   Aerosol Robotic Network (AERONET) sun photometer                ment of the reliability of the different methods (Tsekeri et al.,
measurements (Holben et al., 1998) during A-LIFE were per-         2017) in the presence of coarse-mode-dominated aerosols.
formed at Paphos and Limassol. These measurements pro-
vide information on the optical and microphysical properties       2.3.1    AERONET
of the bulk aerosol in the atmospheric column. AERONET
sun photometers perform spectrally resolved measurements           The AERONET inversion employs measurements of direct
of aerosol optical depth (AOD) at 340, 440, 675, 870, 1020,        and diffuse radiation with sun and sky radiometers to retrieve
and 1640 nm and of sky radiances at several almucantar an-         aerosol optical and microphysical particle properties that

Atmos. Chem. Phys., 21, 6781–6797, 2021                                               https://doi.org/10.5194/acp-21-6781-2021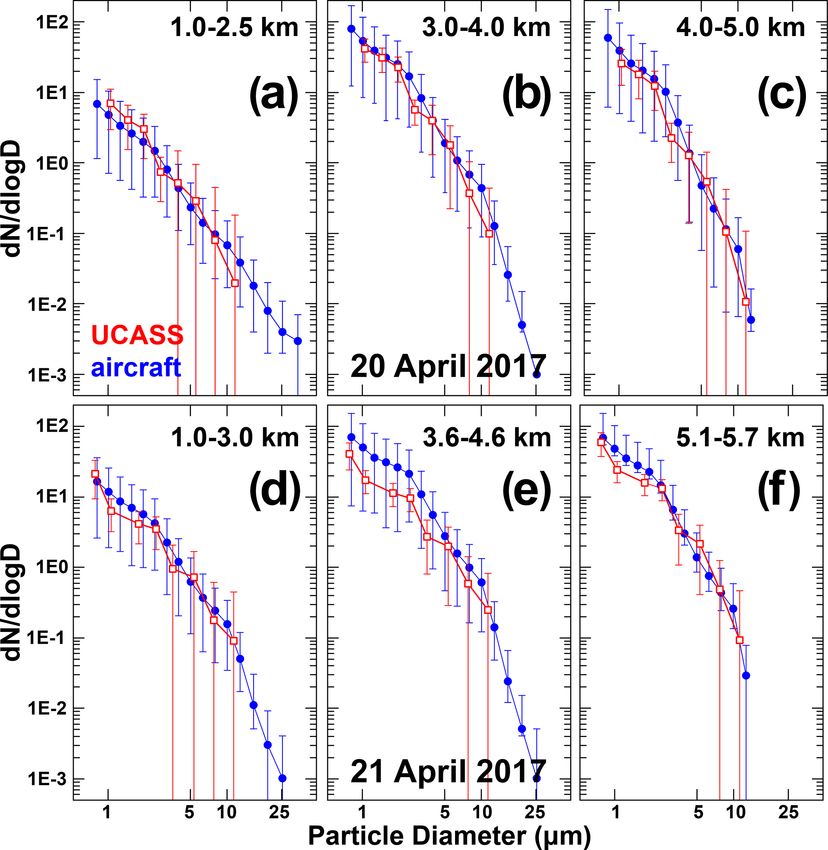
M. Kezoudi et al.: Balloon-borne in situ dust profiling                                                                      6785

are representative of the total atmospheric column (Dubovik       tions includes the total AOD and radiances at 440, 670, 870,
et al., 2000, 2006). The AERONET algorithm assumes a              and 1020 nm. Concurrently, lidar measurements of the elas-
vertically homogeneous atmosphere and a mono-component            tic backscatter signals at 355, 532, and 1064 nm are used as
aerosol with a single complex refractive index. AERONET           input for GARRLiC (Lopatin et al., 2013). The output of
inversion products include the particle size distribution, the    the retrieval provides columnar aerosol volume concentration
complex refractive index, the scattering phase function, the      together with a column-mean aerosol volume–size distribu-
single-scattering albedo, and spectral and broadband fluxes.      tion, spectral refractive index, and spherical particle fraction.
Size distributions obtained from AERONET measurements             GARRLiC also retrieves aerosol optical properties such as
of mineral dust, have shown a dominant mode at around 4 to        the single-scattering albedo, backscatter and extinction coef-
5 µm in diameter (Müller et al., 2012; Marenco et al., 2018).     ficients, and aerosol lidar ratio.
The AERONET retrieval forces the particle size distribution          The lidar input enables GARRLiC to account for varia-
to zero at 30 µm in diameter. This constraint may therefore       tions in aerosol stratification. Due to the wider set of input
lead to an underestimation of the concentration of large par-     parameters, the GARRLiC retrieval requires fewer assump-
ticles by AERONET (Ryder et al., 2019). The reported un-          tions than other algorithms (Bovchaliuk et al., 2016). Estima-
certainties for the AERONET size distribution retrievals in       tion of the different uncertainties of the GARRLiC-derived
the range from 0.1 to 7.0 µm in radius are given as 10 % to       products is provided in previous works (e.g. Torres et al.,
35 %, while for larger sizes, uncertainties rise up to 80 % to    2017), and it has lately been tested for integration in the al-
100 % (Dubovik et al., 2000, 2002).                               gorithm (Herrera et al., 2019). In case of a bi-modal aerosol
                                                                  distribution, GARRLiC provides the flexibility to use a bi-
2.3.2   ESR/SKYNET                                                component aerosol model that may have different refractive
                                                                  indices in the fine and coarse modes. In the presence of mix-
SKYNET is an international research network of users of           tures of aerosol types with multiple contributions to the fine
the PREDE Co. Ltd POM sky radiometer with a growing               and coarse modes (e.g. mixture of marine and dust particles;
number of instruments now exceeding 100 units. Currently,         Tsekeri et al., 2017), the algorithm provides an average es-
SKYNET uses two versions (4.2 and 5) of the inversion al-         timation similar to the AERONET retrieval. We constrain
gorithm SKYRAD to analyse the radiance measurements of            the investigation in this study to one dust mode because the
the PREDE POM sky radiometers, although other versions            UCASS observations at Cyprus show a dominance of coarse-
are being developed and currently tested. In order to benefit     mode dust particles throughout the atmospheric column.
the international community of users, a re-organization of the
network structure has been initiated (Nakajima et al., 2020).     2.4    HYSPLIT backward trajectories
   Although the International SKYNET Data Center (ISDC)
has already started data collection and analysis, different re-   The Hybrid Single-Particle Lagrangian Integrated Trajectory
gional sub-networks are well established and develop new          model (HYSPLIT; Stein et al., 2015; Rolph et al., 2017) run
research products and test new methodologies (Nakajima            with Global Data Assimilation System (GDAS) meteorolog-
et al., 2020). In Europe, the regional sub-network is called      ical reanalysis fields (∼ 50 km resolution) was used to in-
the European SKYNET Radiometers network (ESR). In                 vestigate the origin of the observed air masses over Cyprus.
ESR, versions of SKYRAD software have been adapted to             The 5 d backward trajectories starting at the locations of the
analyse data from CIMEL sun–sky photometers (Estellés             remote-sensing sites were calculated for arrival heights be-
et al., 2012). In this analysis the current SKYRAD version        tween 1.0 and 7.0 km.
4.2 is used and the corresponding inversions will be called
SKYRAD retrievals.                                                3     Results and discussion
   As for the AERONET inversion, the SKYRAD algorithm
estimates the size distribution, phase function, and surface      3.1    Overview of measurements
albedo of aerosols from measurements of diffuse sky ra-
diance (Campanelli et al., 2007). A notable difference to         The A-LIFE field experiment took place between 3 and
AERONET is, however, that the SKYRAD retrieval does not           29 April 2017 when the DLR Falcon research aircraft
prescribe an upper boundary for particle size (Estellés et al.,   was deployed at Paphos airport. The period between 20
2012).                                                            and 22 April 2017 was dominated by southwesterly air-
                                                                  flow with favourable conditions for the transport of Saha-
2.3.3   GARRLiC                                                   ran dust to Cyprus. Persistent periods of clear sky made
                                                                  for ideal conditions for remote-sensing observations. Five
The GARRLiC retrieval is a synergistic algorithm that             UCASS OPCs were launched during an intense dust out-
combines quasi-simultaneous passive sky-radiance measure-         break that lasted from 20 to 22 April 2017. Figure 1 pro-
ments with active lidar measurements during cloud-free con-       vides an overview of the temporal evolution of the dust
ditions. The required input from sun photometer observa-          plume over Limassol between 19 and 23 of April 2017 in

https://doi.org/10.5194/acp-21-6781-2021                                           Atmos. Chem. Phys., 21, 6781–6797, 2021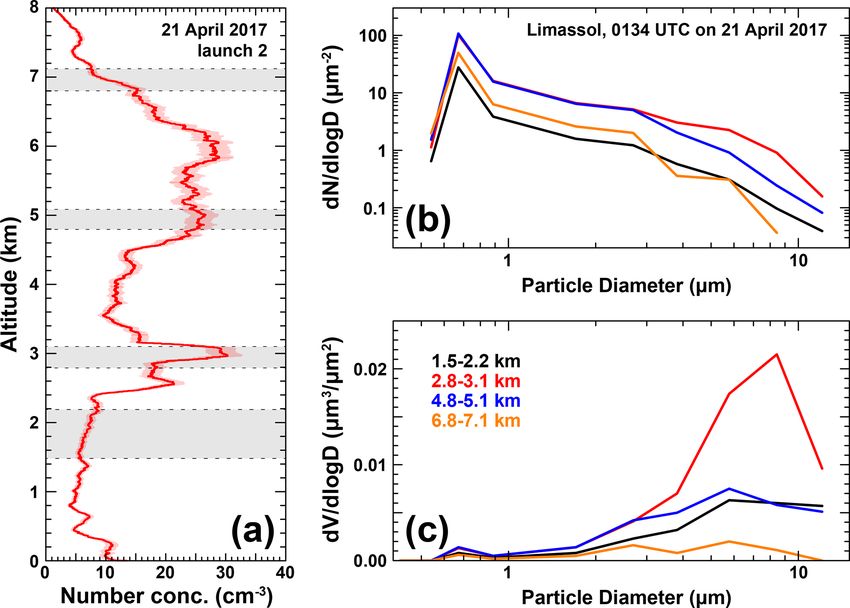
6786 M. Kezoudi et al.: Balloon-borne in situ dust profiling
the form of column-integrated parameters measured with two and second UCASS launched from Paphos and Limassol,
AERONET sun photometers and height-resolved observa- respectively, headed eastwards. The first unit reached clos-
tions with the PollyXT aerosol lidar. The figure also shows the est to the lidar site, which makes this case ideal for a com-
times and locations of the UCASS launches. Four launches parison of UCASS measurements with the findings of the
were performed from Paphos airport (34.71◦ N, 32.48◦ E), remote-sensing retrievals that include the lidar data. UCASS
while one UCASS sonde (01:34 UTC on 21 April 2017) was units from later launches headed to the northeast and show
launched from the lidar site in Limassol (34.7◦ N, 33.0◦ E) that the main wind direction changed during the passage of
(Ansmann et al., 2019). Table 1 provides an overview of the dust plume. The left panel in Fig. 3 shows the tracks of
the UCASS launch times together with the time periods and the DLR Falcon aircraft during research flights on 20 and
locations of the remote-sensing and airborne measurements 21 April 2017. The close proximity makes these cases most
used for comparison. The first airborne mission over this suitable for a comparison of the measurements during the
period was performed on 19 April; the leading edge of the first and third UCASS launches to those of airborne in situ
dust plume was found to be over Malta and moved eastwards instruments. Details on the distance between the respective
across the Mediterranean in the following days. observations are provided below.
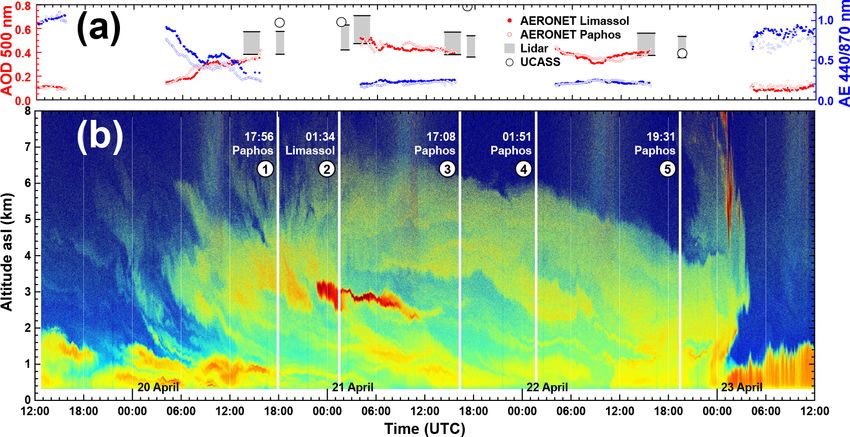
The AERONET measurements in Fig. 1a show the arrival Figure 4 shows 120 h backward trajectories of air masses
of the dust plume over Limassol in the morning of 20 April arriving at 2, 3, 5, and 7 km height over Limassol at
2017 in the form of an increase in AOD that is accompanied 01:00 UTC on 21 April 2017, i.e. at the time of the sec-
by a decrease in the Ångström exponent. The former refers ond UCASS launch. Trajectories are shown for this UCASS
to an increase in aerosol loading while the latter indicates launch as it coincides with the presence of the unusual fil-
that large particles are present in the atmosphere. The highest ament structure over Limassol in Fig. 1b. The trajectories
AOD of around 0.5 at 500 nm was observed in the morning follow similar pathways for the other launches. They reveal
of 21 April 2017. The AOD stayed fairly constant at around that these air parcels were lifted from dust source regions
0.4 for the rest of the day and decreased slightly to 0.35 on in North Africa, crossed the Mediterranean, and reached
22 April 2017. During this period, the Ångström exponent Cyprus within 3 d. The air parcels arriving at 2 and 3 km
stayed very constant at 0.3. The sudden shift in AOD to 0.1 height originated from northern Libya while those arriv-
and in Ångström exponent to 0.9 in the morning of 23 April ing at 5 and 7 km height originated from Algeria, Morocco,
2017 indicates the departure of the dust event from Limassol and Mauritania. The difference in source region and trans-
and the return to background conditions. port time for air arriving at different altitudes might lead
This narrative is corroborated and complemented by the to differences in the observed particle size distributions at
height-resolved lidar observations in Figs. 1b and 2. The first those heights (Weinzierl et al., 2009, 2011; Ryder et al.,
faint traces of the dust plume were detected between 4 and 2013, 2018). The inspection of dust composites derived from
5 km height in the afternoon of 19 April 2017. The main measurements with the Spinning Enhanced Visible and In-
plume arrived at a height of 3 km at 04:00 UTC on 20 April frared Imager (SEVIRI) on the Meteosat Second Generation
2017. The top of the dust plume reached as high as 7 km at satellite (Schepanski et al., 2007, not shown) shows that dust
06:00 UTC on 21 April and slowly descended to 4 km un- was mobilized in the northern part of Cyrenaica (i.e. north-
til the dust plume departed at 04:00 UTC on 23 April 2017. eastern Libya) about 24 h before the observations of the sec-
The lidar signal reveals the structure of the dust plume, most ond UCASS launch and transported directly to Cyprus.
notably a thin filament of strong backscatter signal between
2 and 3 km height from 22:00 UTC on 20 April 2017 to 3.2 Number concentration profiles
12:00 UTC on 21 April 2017. The lidar plot shows a homo-
geneous dust layer in the upper part of the plume and features Figure 5 shows the particle number concentration from the
that correspond to the settling of dust particles over time, first and third UCASS launches and the DLR Falcon mea-
i.e. structures that appear at lower heights as the dust plume surements together with the distance between the locations
passed over the lidar station. The profiles of the particle lin- of the respective measurements. The distance between the
ear depolarization ratio at 532 nm in Fig. 2 provide evidence observations is below 40 km up to a height of 2.4 km and
that mineral dust was present over the measurement site and around 80 km above. The first UCASS launch in the evening
occurred in well-mixed layers. Values larger than 0.20 and of 20 April 2017 from Paphos shows the highest particle con-
as high as 0.33 are generally observed for this particle type centrations of more than 35 cm−3 between 3.5 and 4.5 km
(Freudenthaler et al., 2009) and are detected throughout the height. The meteorological profiles (not shown) reveal tem-
better part of the aerosol layer while the influence of local perature inversions at the bottom and top of the dust layer.
aerosols leads to the lower values close to the surface. They also show a dry lower and a much more humid upper
The trajectories of the five UCASS launches up to 10 km part of the dust plume with 30 % RH between 1 and 3 km
height are shown in the right panel of Fig. 3. It generally and 80 % RH between 3 and 5 km, respectively. Despite the
takes about 40 min for the balloon to reach such an altitude, rather large spatial distance of the observations, there is close
though it depends on the individual ascent rate. The first resemblance of the number concentrations measured with the
Atmos. Chem. Phys., 21, 6781–6797, 2021 https://doi.org/10.5194/acp-21-6781-2021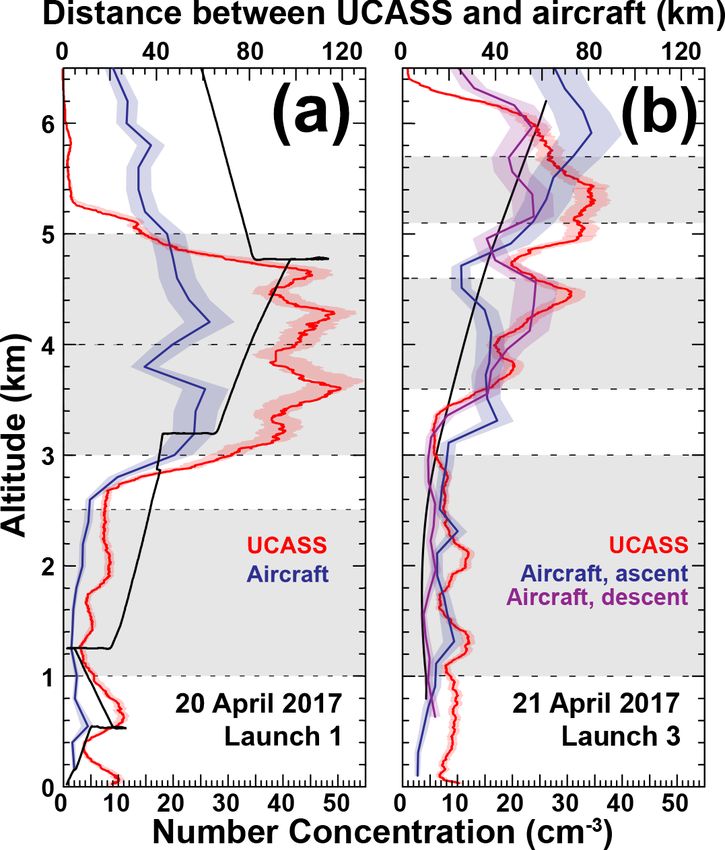
M. Kezoudi et al.: Balloon-borne in situ dust profiling                                                                                6787

Table 1. Dates and times (UTC) of UCASS launches, aircraft profiles (together with location of observation), and measurements with lidar
and sun photometer (SPM) used in this study. UCASS units were launched from Paphos except for the launch at 01:34 UTC on 21 April
2017 which was performed next to the lidar site at Limassol. Lidar 1 refers to the time period used for the comparison of AOD and extinction
coefficients in Figs. 1 and 8, respectively. Lidar 2 marks the time period used for the combined lidar–SPM retrievals with GARRLiC in Fig. 6.

                                     UCASS            Lidar 1               Aircraft                    Lidar 2    SPM
                    20 April 2017      17:56     18:30–19:30    17:38–18:33 W of Cyprus            13:30–15:30     15:11
                    21 April 2017      01:34     01:30–02:30    11:48–12:48 W of Cyprus            03:05–05:05     04:27
                    21 April 2017      17:08     17:00–18:00    14:08–15:07 SW of Cyprus           14:15–16:15     14:49
                    22 April 2017                               UCASS launch unsuccessful
                    22 April 2017      19:31     19:00–20:00    08:15–09:15 S of Cyprus            14:10–16:10     15:12

Figure 1. Overview of the aerosol conditions at Limassol (34.7◦ N, 33.0◦ E) during the 4 d period from 20 to 23 April 2017 in terms of (a)
the aerosol optical depth (AOD) at 500 nm (red) and the Ångström exponent (AE) for the wavelength pair 440/870 nm (blue) as obtained
from AERONET sun photometer observations at Limassol (filled dots) and Paphos (open dots), UCASS (532 nm, black circles), and PollyXT
lidar measurements (grey bar spanning the range of values obtained from multiplying the 532 nm backscatter coefficient with 40 and 60 sr).
(b) The range-corrected signal at 1064 nm as measured with the Polly lidar. Lines and numbers mark the times and locations of UCASS
launches. Low backscatter signal (low aerosol concentrations) is shown in blue while very high backscatter signal (dense aerosol layers) is
shown in red.

UCASS and aboard the aircraft in the lower and upper part of             the first launch were now found only at around 4.5 km and
the dust plume with an average ratio of 0.77. The discrepancy            between 5.0 and 5.5 km height. The humidity profile (not
increases as the horizontal distance between the observations            shown) reveals drier air throughout the extent of the dust
increases, i.e. beyond 70 km above 2.5 km height. The dis-               plume compared to the first launch with RH spanning from
crepancy could be attributed to the large number of smaller              20 % to 65 %. The aircraft observations during that day (Ta-
particles, as the lowest size bin for the UCASS number con-              ble 1 and Fig. 3) took place in close proximity to the UCASS
centration is 0.6 µm, whereas for the CAPS it is 0.79 µm.                track with a horizontal distance of less than 15 km below
Nevertheless, the close resemblance of both profiles is in-              3 km height and 20 to 50 km in the upper layer of higher
dicative of the spatial and temporal homogeneity of the dust             particle concentrations. Consequently, the number concen-
plume and suggests that differences in time and location of              trations of the measurements with the UCASS and aboard
the observations do not necessarily inhibit a comparison of              the DLR Falcon (ascent and descent profiles) agree even on
the measurements.                                                        the fine structures of the dust plume during that time. Be-
   Figure 5b shows the UCASS measurements during the                     low 3.2 km height, observations with UCASS and aboard
third launch on 21 April 2017 from Paphos. The highest par-              the aircraft show number concentrations in the range from
ticle concentrations are still found in the upper part of the            5 to 10 cm−3 , and both profiles resolve a layer of increased
dust plume which now extends from about 4 to 6 km. While                 particle concentration at around 2.0 km height. In the upper
the number concentration exceeds 20 cm−3 in this layer, the              part of the dust plume above 3.2 km height, the lower and
higher concentrations above 30 cm−3 as measured during                   upper boundaries of the layer with number concentrations

https://doi.org/10.5194/acp-21-6781-2021                                                   Atmos. Chem. Phys., 21, 6781–6797, 2021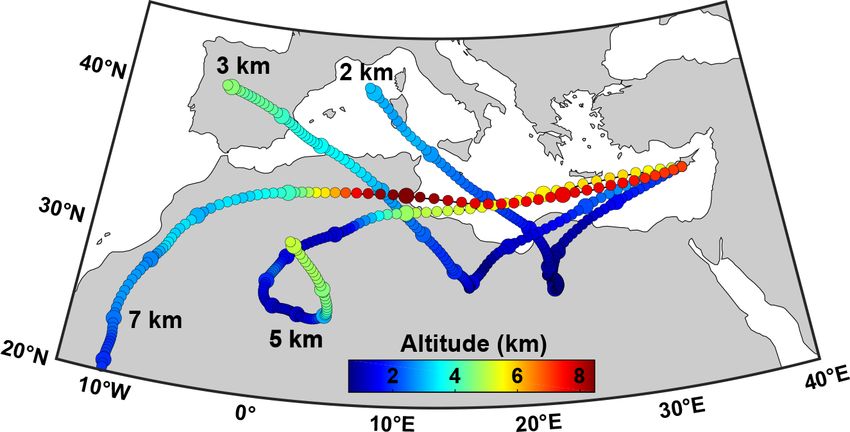
6788                                                                           M. Kezoudi et al.: Balloon-borne in situ dust profiling

Figure 2. Profiles of the linear volume depolarization ratio (black line with grey error range) and the particle linear depolarization ratio (dark
green line with light green error range) measured by the PollyXT lidar around the times (see Table 1) of the UCASS launches marked in
Fig. 1.

Figure 3. Flight tracks of (a) the DLR Falcon aircraft and (b) the
UCASS sondes launched from Paphos and Limassol. The Falcon
tracks marked a (black border) and b (no border) refer to the re-
search flights on 20 and 21 April 2017, respectively.

                                                                           Figure 5. Total number of particles in the diameter range from 0.6 to
                                                                           13.9 µm counted by UCASS (red) and with the CAPS (CAS) instru-
                                                                           ment aboard the Falcon aircraft (blue and purple, size range from
                                                                           0.79 to 14.0 µm; shading marks the standard deviation obtained as
                                                                           median minus 25th percentile and 75th percentile minus median)
                                                                           measured (a) during the first UCASS launch on 20 April 2017 and
Figure 4. The 120 h HYSPLIT backward trajectories starting over
                                                                           (b) during the third UCASS launch on 21 April 2017. Red shaded
Limassol at 01:00 UTC on 21 April 2017. Colour coding refers to
                                                                           areas refer to the effect of a counting uncertainty of 8 % (y error) as
the height of the trajectories. Intervals of 12 h are marked by in-
                                                                           stated in Smith et al. (2019). The black lines mark the horizontal dis-
creased circle size. The numbers in the plot refer to the arrival height
                                                                           tance between the location of the observations from the UCASS and
over Limassol.
                                                                           aircraft. Grey areas refer to the height layers considered in Fig. 6.

Atmos. Chem. Phys., 21, 6781–6797, 2021                                                        https://doi.org/10.5194/acp-21-6781-2021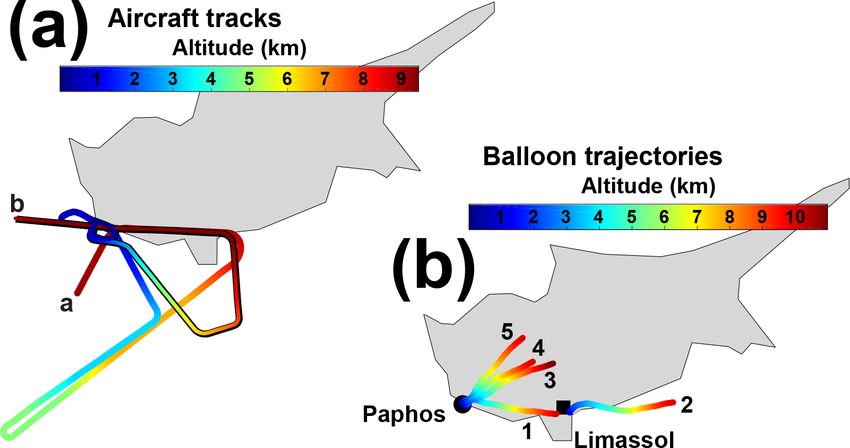
M. Kezoudi et al.: Balloon-borne in situ dust profiling 6789
above 10 cm−3 at 3.4 and 6.4 km, respectively, are resolved
by UCASS and airborne measurements within 200 m height,
despite the increase in the spatial distance of the observa-
tions to 60 km. Within this layer, the UCASS and the air-
borne instruments detect peak concentrations of 35 cm−3 at
4.5 km height and in the range from 5.0 to 5.4 km height.
Both also resolve the decrease to number concentrations of
around 20 cm−3 at 4.8 km height.
Overall, the particle number concentration and size dis-
tributions observed with UCASS over Cyprus are similar
in magnitude and shape, respectively, to what has been re-
ported from aircraft measurements in previous studies. Ob-
servations during the ICE-D and AER-D (Ryder et al., 2018;
Liu et al., 2018) over the west African coast showed parti-
cle number concentrations of up to 45 cm−3 in the size range
between 1 and 20 µm in diameter. Particle number concen-
trations within the dust layers observed during SAMUM in
Morocco (Weinzierl et al., 2009, 2011) and SALTRACE over
the tropical Atlantic (Weinzierl et al., 2017) decrease from
nearly 1000 to 0.001 cm−3 in the diameter range from about
0.1 to nearly 40.0 µm. In situ observations of central Saharan
dust size distributions during Fennec (Marsham et al., 2013; Figure 6. Particle number size distribution observed by UCASS
Ryder et al., 2013) with wing-mounted instruments that mea- (red) and with the CAPS instrument aboard the Falcon aircraft
sured particle diameters between 0.1 and 100 µm gave num- (blue) on 20 (a–c, launch 1) and 21 April 2017 (d–f, launch 3) for
ber concentrations of up to 1000 cm−3 (Ryder et al., 2018). the height layers marked in Fig. 4. Error bars refer to the standard
Looking at the size distribution of SALTRACE, the highest deviation of the measurements.
particle number concentrations are found between 0.5 and
1 µm. The particle number concentration decreases towards
the larger sizes. A closer look at the size range between 0.4 tribution at the lowermost (1.0 to 3.0 km height) and upper-
and 20.0 µm, which is closer to the measurement capabil- most (5.1 to 5.7 km height) layers on 21 April 2017. Despite
ity of UCASS, reveals number concentrations spanning from the offset between the observations in the height layer from
0.01 to 100 cm−3 . Note that most of the observations listed 3.6 to 4.6 km, they still agree within the error bars of the air-
above have been conducted much closer to dust sources com- craft. Figure 6e shows that there is a consistent difference
pared to the measurements at Cyprus presented here. Hence, in the particle number concentration of about 10 cm−3 for
it can be concluded that the UCASS observations give values the measurements of the two instruments within that layer.
that are in line with data from airborne campaigns. This is probably due to a spatial mismatch of the layer at the
two locations as indicated by the similar structure of the pro-
3.3 Layer-averaged number size distributions files. Overall, the aircraft and UCASS observations give very
similar magnitudes and shapes of the size distributions in all
A closer look at layer-mean particle size distributions from layers on both 20 and 21 April 2017. Please note that small
the measurements with the UCASS and the research aircraft differences in dN/dlogD can translate to very large differ-
on 20 and 21 April 2017 is provided in Fig. 6. The extent of ences in volume–size distribution.
the considered height layers is marked in Fig. 5. The particle A mean effective diameter of 2.4 ± 0.3 µm was found
number concentrations observed by the UCASS and aircraft from the UCASS measurements in the size range from 0.4
are similar for both observation days, particularly at sizes be- to 14 µm. Observations during AER-D and ICE-D at Cabo
low 5 µm, with maximum values between 10 and 100 cm−3 . Verde gave a mean effective diameter of 4.0 µm (Ryder et al.,
Although the two largest UCASS size bins with bin centres 2018) and 5.0 to 6.0 µm (Liu et al., 2018) for the size ranges
at 8.4 and 12.1 µm tend to detect fewer particles than the in- from 0.1 to 100.0 µm and from 1.0 to 20.0 µm, respectively.
struments aboard the research aircraft, the numbers of around Measurements during SAMUM (Weinzierl et al., 2009) gave
0.1 cm−3 are well within the respective error bars. The size effective diameters of about 6.5 µm for measurements that
distributions resemble each other very well in terms of their covered particle sizes up to 100 µm in diameter. The values
shape at all height layers on 20 April 2017. The particle num- obtained from our UCASS measurements are slightly lower
ber concentrations agree within their error bars for the entire than those reported in the literature. This is likely due to the
size range. The observations on 21 April 2017 also resemble fact that the UCASS as deployed during A-LIFE measured
each other very well in terms of the shape of the size dis- only up to particle diameters of 14 µm and also due to the
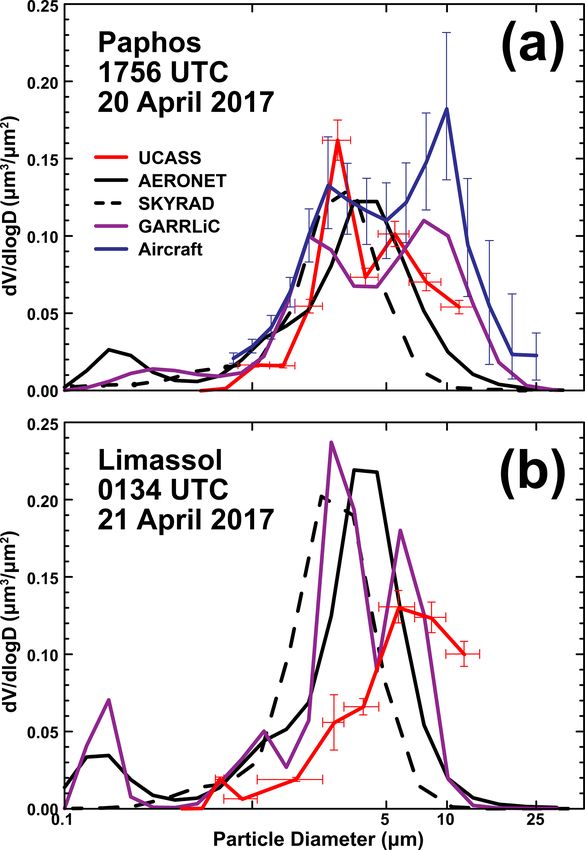
https://doi.org/10.5194/acp-21-6781-2021 Atmos. Chem. Phys., 21, 6781–6797, 20216790 M. Kezoudi et al.: Balloon-borne in situ dust profiling different particle size ranges used to calculate effective di- ameter in some cases. In any case, a comparison of the effec- tive diameters from different measurements may not be com- prehensive due to the different source regions and travelled distances of the observed dust particles from the different ob- servations. 3.4 Columnar size distributions A comparison of the columnar aerosol volume–size dis- tribution from the GARRLiC, AERONET, and SKYRAD retrievals and the first and third UCASS launches is pre- sented in Fig. 7. Figure 7a also includes the airborne in situ observations with the Falcon aircraft. All distributions in Fig. 7a and b show a predominance of coarse-mode par- ticles with comparable volume concentrations of the dif- ferent coarse-mode peaks. During launch 1, the UCASS, aircraft, and GARRLiC retrievals show a different shape of the volume–size distribution compared to the ones re- trieved by the sun photometer inversions. Both AERONET and SKYRAD show a single coarse mode that peaks between 3 and 5 µm, while GARRLiC and UCASS give a coarse mode with two peaks. AERONET observed the highest concen- tration of 0.12 µm3 /µm2 between 3.4 and 4.5 µm diameter, Figure 7. Total-column volume–size distribution from the UCASS whereas SKYRAD’s size distribution peaks at 3.4 µm with (red), AERONET (black solid), SKYRAD (black dashed), GAR- a concentration of 0.13 µm3 /µm2 . The UCASS observed its RLiC (purple), and aircraft (blue, only in a) obtained during (a) the highest concentration of about 0.1 µm3 /µm2 at 5.5 µm in di- first launch on 20 April 2017 and (b) the second launch on 21 April ameter and a second mode at 2.8 µm. The two coarse modes 2017. For clarity, only error bars of the UCASS and CAPS measure- retrieved by GARRLiC are at 2.0 and 7.7 µm in diameter. ments are shown. Details on the locations and measurement times It is noteworthy to mention that the first UCASS unit was are provided in Table 1. launched about 2 h 40 min after the considered sun photome- ter measurement as outlined in Table 1. The first UCASS launch shown in Fig. 7a is also the only case for which a observed air masses. The observed bi-modal peak may be column-integrated volume–size distribution is available from caused by the following reasons: (i) the diversity of sources both remote-sensing retrievals and observations aboard the across the African basin whose mineralogy can lead to in- research aircraft. These independent airborne in situ mea- trinsic differences in the properties of the emitted particles surements also find a bi-modal coarse mode which supports (e.g. size distributions, chemical composition) (Engelstaedter the results of the UCASS measurements and suggests that the et al., 2006; Coz et al., 2009); (ii) contributions from different findings of the GARRLiC retrieval are closer to reality than aerosol types; (iii) cloud processing during transport which those from AERONET and SKYRAD. The large differences could cause aggregation of particles that were collected by in the volume concentration observed by the aircraft in the droplets that evaporated at a later stage or wash-out of larger size range from 5 to 10 µm compared to the UCASS can be particles (Matsuki et al., 2010); (iv) gravitational settling of attributed to the higher number concentration of coarse-mode particles for longer transport times compared to freshly emit- particles observed by CAPS and shown in Fig. 6b. ted dust after about 1 d of transport that might lead to the sys- Post-processing was applied to the UCASS data. In addi- tematic removal of large particles, particularly in the upper tion, further laboratory measurements with a set-up compa- part of dust plumes (Ellis and Merrill, 1995; Maring et al., rable to the conditions encountered during the launches on 2003); or (v) dust electrification that could counteract grav- Cyprus were performed to examine whether the observed itational settling by creating an electric field within the dust bi-modal size distributions in Fig. 7 could be the result of layer (Nicoll, 2012). A similar bi-modal coarse-size distri- an instrumental artefact. Mono-modal sample materials were bution was also observed during the Puerto Rico Dust Ex- used in these laboratory tests (Smith et al., 2019). The cor- periment (PRIDE; Reid et al., 2003) and Fennec SAL (Song responding UCASS measurements also showed only mono- et al., 2018). However, neither study provides further discus- modal size distributions. This led us to reject the idea of a sion of these observations. systematic instrumental error. Hence, the bi-modal coarse The second UCASS launch on 21 April 2017 was per- mode might be a special characteristic of the origin of the formed about 3.0 and 1.5 h before the first sun photome- Atmos. Chem. Phys., 21, 6781–6797, 2021 https://doi.org/10.5194/acp-21-6781-2021
M. Kezoudi et al.: Balloon-borne in situ dust profiling                                                                          6791

ter and lidar measurements, respectively (Table 1). This is
likely to have an effect on the UCASS comparison in Fig. 7b
as the aerosol conditions varied strongly during that pe-
riod (Fig. 1). The UCASS size distribution peaks at 5.8 µm
with a concentration of 0.13 µm3 /µm2 . This peak is also re-
solved by the GARRLiC-derived size distribution, though
it is located at 2.6 and 5.9 µm with concentrations of 0.24
and 0.18 µm3 /µm2 , respectively. The AERONET-derived size
distribution shows a peak concentration of 0.22 µm3 /µm2
between 3.4 and 4.5 µm particle diameter. The SKYRAD
retrieval gives a peak concentration of 0.21 µm3 /µm2 at a
coarse-mode diameter of 3.4 µm, which is the smallest com-
pared to the other observations. Although the sun photometer
inversions rely on the same input datasets, it is found that the
SKYRAD size distribution is shifted to smaller sizes com-
pared to AERONET. This is surprising as SKYRAD does                 Figure 8. UCASS measurements during the second launch at
not force the size distribution to zero at larger particle di-      01:34 UTC on 21 April 2017 from Limassol: (a) height profile of
ameters (Campanelli et al., 2007) and, in principle, would          the total particle number concentration as in Fig. 4 and (b) parti-
enable the retrieval of size distributions with larger coarse-      cle number and (c) volume–size distributions averaged over four
mode diameters than AERONET. This particular property of            selected height levels as indicated in (a).
the AERONET retrieval is likely to produce the artificial fine-
mode peak at around 0.15 µm that is absent in the SKYRAD
size distributions (Dubovik et al., 2006).                          eraged over four height layers. Figure 8c shows that the alti-
   The peaks of volume–size distribution from the sun pho-          tude range between 2.8 and 3.1 km is dominated by particles
tometer inversions are found to be systematically at smaller        with a mode diameter of 8.4 µm. In contrast, all other layers
particle sizes than the observations from GARRLiC and the           show a concentration of particles with such large diameters
UCASS. A similar shift towards larger particle size was also        up to an order of magnitude smaller. Hence, the thin filament
observed from in situ measurements aboard the Falcon com-           of dust particles observed in the morning of 21 April 2017
pared to AERONET-derived size distributions during SA-              is the major contributor to the coarse mode in the colum-
MUM (Müller et al., 2012). A similar tendency between               nar size distribution in Fig. 7b. This structure was confined
AERONET size distributions and in situ measurements was             to a very small height range and only lasted for about 12 h.
observed during DABEX in the Sahelian west Africa basin             It had already disappeared from the ground-based remote-
(Osborne et al., 2008). During the SAVEX-D/AER-D cam-               sensing sites during the time of the DLR Falcon research
paign at Cabo Verde, the AERONET retrievals also showed             flight that day. Longer transport times translate to a longer
a similar single coarse mode shifted towards a smaller ra-          time period during which large particles are exposed to grav-
dius compared to in situ measurements from aircraft (Estellés       itational settling. This effect is most pronounced at higher
et al., 2018; Kudo et al., 2020). Simultaneous retrievals from      altitudes where no particles can settle into the layer from
SKYRAD (performed on Prede POM radiometers) also de-                above. Figure 4 indicates that the aerosols observed at 5 and
termined a slight shift of the coarse mode to a smaller radius,     7 km height have been transported over longer distances than
although in this case the coarse mode was broader or even           those at lower altitudes. As stated before, MSG-SEVIRI im-
bimodal, depending on the SKYRAD version used (Naka-                agery shows active dust sources in northeastern Libya about
jima et al., 2020). The coarse mode retrieved by GARRLiC            24 h before the observations at Limassol. Backward trajec-
shows a consistent shift towards larger sizes when com-             tories corroborate that dust emitted from these sources was
pared to the AERONET output (Benavent-Oltra et al., 2017;           transported directly to Cyprus. It is likely that this is the ori-
Lopatin et al., 2013; Bovchaliuk et al., 2016). This feature        gin of the thin filament observed in the morning of 21 April
is generally attributed to the additional information from the      2017. It is noteworthy to state that the first sun photome-
backscatter lidar profiles that provides GARRLiC with extra         ter observations (used for AERONET, SKYRAD, and GAR-
information on the particle size. In addition, the restriction of   RLiC retrievals) took place after sunrise (04:27 UTC), when
the AERONET (and hence also the GARRLiC) data inver-                the dense aerosol filament over Limassol had changed its ap-
sion scheme to a particle diameter smaller than 30 µm may           pearance and extended in depth.
lead to an underestimation of the concentration of coarse-             The overarching message of Figs. 7 and 8 is twofold.
mode particles (Müller et al., 2012).                               Firstly, reasonable agreement can be found between the
   A closer look at the UCASS measurements during the sec-          UCASS measurements and data from remote-sensing obser-
ond launch is provided in Fig. 8 in terms of the profile of to-     vations in case of homogeneous dust properties and optimum
tal number concentration and volume–size distributions av-          temporal matching of the observations (Fig. 7a). Under such

https://doi.org/10.5194/acp-21-6781-2021                                              Atmos. Chem. Phys., 21, 6781–6797, 2021
6792                                                                   M. Kezoudi et al.: Balloon-borne in situ dust profiling

conditions, the more complex GARRLiC retrieval which is            Table 2. Column AOD derived from the integration of the extinction
based on a larger set of input data is capable of better resolv-   coefficient profiles in Fig. 8 for the times of the UCASS launches
ing the features of the UCASS in situ measurements, i.e. the       (see Table 1). AODs are also shown in Fig. 1a. UCASS and lidar
double peak in the coarse mode. Secondly, the requirement          AODs are at 532 nm. AERONET AOD is at 500 nm. Lidar Raman
for homogeneous aerosol conditions is vital, if observations       refers to the Raman solution of the lidar equation while the other
                                                                   two lidar values refer to an analysis following Klett’s method with
at different times are compared or used as combined input
                                                                   lidar ratios of 40 and 60 sr.
to a retrieval. In that context, Fig. 7b provides some insight
into the actual spread of findings that can result from extreme                                      UCASS launch number
variations in the aerosol situation such as changes in total
aerosol load or the vertical distribution of the particles. This                                      1      2       3       5
is particularly important when using passive remote-sensing               UCASS                    0.65   0.65    0.79    0.39
data for the validation of vertically resolved measurements               Lidar Raman              0.32   0.42    0.32    0.31
as they provide no information on aerosol stratification.                 Lidar, S = 40 sr         0.38   0.42    0.36    0.36
                                                                          Lidar, S = 60 sr         0.58   0.63    0.56    0.53
3.5    Extinction coefficient profiles                                    AERONET Limassol         0.35   0.52    0.39    0.43
                                                                          AERONET Paphos           0.42   0.46    0.40    0.44
Figure 9 shows the aerosol extinction coefficient profiles as
calculated using the UCASS observations during the four
launches listed in Table 1. Lidar profiles of the extinction       150 Mm−1 are found from the different analyses of the lidar
coefficient measured by the PollyXT at Limassol were de-           measurements (Klett, Raman). As these layers are character-
rived using two methods. Firstly, the extinction coefficient       ized by an increased concentration of larger particles, there
was obtained without assumptions using the Raman method            is reason to believe that the current UCASS extinction con-
(Ansmann and Müller, 2005). Secondly, the likely range of          version is not universally applicable to different aerosol con-
extinction coefficients was estimated by multiplying the par-      ditions. The refractive index and the size-dependent extinc-
ticle backscatter coefficient obtained using Klett’s method        tion efficiency are the main factors in the retrieval of extinc-
with the lower and upper limits of reasonable dust lidar ra-       tion coefficients from the UCASS measurements. The large
tios for Cyprus of 40 and 60 sr, respectively (Nisantzi et al.,    particles in the elevated layers might therefore be of differ-
2015). Generally, the profiles of the extinction coefficients      ent chemical composition compared to those at lower layers.
from the UCASS and lidar at the lowermost layers are in            This is supported by the backward trajectories in Fig. 4 which
a reasonable agreement with values below 100 Mm−1 . Dis-           indicate different source regions for air arriving at different
crepancies are more pronounced for the observations within         height levels. Alternatively, the extinction efficiency used in
the elevated layers.                                               the current conversion might be representative only for situ-
   The extinction coefficient profiles were integrated with        ations dominated by smaller particles for which the effect of
height to obtain an estimate of aerosol optical thickness          particle non-sphericity is less pronounced. Comparisons with
(AOT) that can be compared to the sun photometer mea-              the extinction coefficient, which is a secondary-order param-
surements. This comparison is shown in Fig. 1a and in              eter derived from UCASS data, are therefore questionable
Table 2. The lower lidar estimate of AOT derived using             and require further investigation that is beyond the scope of
Klett’s method and a lidar ratio of 40 sr show the best agree-     this study.
ment with the independent sun photometer observations at
both Paphos and Limassol with differences (lidar minus
AERONET) ranging from −0.07 to 0.03 for absolute AOT               4   Summary and conclusions
values between 0.35 and 0.52. The UCASS-derived AOTs
show no consistent behaviour when compared to the lidar            We have presented findings from balloon-borne UCASS op-
and sun photometer values. The value of 0.39 obtained from         tical particle counter measurements of mineral dust con-
launch 5 agrees best with both the lidar (0.36, LR = 40 sr)        ducted over Cyprus in April 2017 during the A-LIFE exper-
and sun photometer (0.43 at Limassol and 0.44 at Paphos).          iment. The UCASS launches were embedded in research ac-
Launch 2 with an AOT of 0.65 is at the upper end of the li-        tivities that included airborne in situ measurements with the
dar estimate, which is 0.63 when using Klett’s method with         DLR Falcon research aircraft as well as ground-based remote
a lidar ratio of 60 sr. However, launch 1 and launch 3 give        sensing with advanced aerosol lidars and sun photometers.
AOTs of 0.65 and 0.79, respectively, that are well above the       This setup allows for a comprehensive evaluation of the qual-
remote-sensing estimates that range from 0.32 to 0.58. Fig-        ity of the UCASS measurements as well as an assessment of
ure 9 confirms that this is due to the elevated layers charac-     a variety of remote-sensing retrievals.
terized by peak particle concentrations. In particular, this oc-      The highest particle number concentration observed by the
curs when UCASS-derived extinction coefficients are as high        UCASS was found during the first launch, with values of up
as 300 Mm−1 . Much lower extinction coefficients of 70 to          to 50 cm−3 within a layer from 3 to 5 km height. Aircraft

Atmos. Chem. Phys., 21, 6781–6797, 2021                                              https://doi.org/10.5194/acp-21-6781-2021
You can also read