The Contemporary Economic Costs of Spatial Chaos: Evidence from Poland - MDPI
←
→
Page content transcription
If your browser does not render page correctly, please read the page content below
land
Article
The Contemporary Economic Costs of Spatial Chaos:
Evidence from Poland
Przemysław Śleszyński 1, * , Adam Kowalewski 2 , Tadeusz Markowski 3 ,
Paulina Legutko-Kobus 4 and Maciej Nowak 5
 1   Institute of Geography and Spatial Organization, Polish Academy of Sciences, 00-818 Warsaw, Poland
 2   The Foundation in Support of Local Democracy (FSLD), 00-680 Warsaw, Poland;
     adam.kowalewski@windowslive.com
 3   Department of City and Regional Management, University of Łódź, 90-237 Lodz, Poland;
     tadeusz.markowski@uni.lodz.pl
 4   Department of Regional and Spatial Development, Warsaw School of Economics, 02-520 Warsaw, Poland;
     plegut@sgh.waw.pl
 5   Departament of Real Estate, West Pomeranian University of Technology, 70-310 Szczecin, Poland;
     Maciej.Nowak@zut.edu.pl
 *   Correspondence: psleszyn@twarda.pan.pl

 Received: 8 June 2020; Accepted: 29 June 2020; Published: 1 July 2020

 Abstract: This paper is based on the results of an extensive (840-page) report of the Committee on
 National Spatial Development of the Polish Academy of Sciences, entitled Studies on Spatial Chaos
 (edited by A. Kowalewski, T, Markowski and P. Śleszyński—Studia KPZK PAN, vol. 182, Warsaw
 2018—in Polish). Its aim was to conduct a comprehensive and detailed study on the problem of
 spatial chaos (spatial disorder), including an estimate of economic costs in Poland. For this purpose,
 literature was queried (articles and reports, etc.) and special analyses were prepared for this purpose.
 The total annual costs of spatial chaos were estimated at not less than 20 billion euros per year.
 The conclusions also proposed solutions and suggestions (for the government and local governments),
 which may reduce the acute costs of spatial chaos in society and economy.

 Keywords: spatial chaos; spatial disorder; costs of spatial chaos; quality of life; Poland

1. Introduction
     The entirety of economic and non-economic human activity takes place in a space that, as a key
development factor, enables long-term quantitative and qualitative changes to meet human needs in
the form of various types of benefits [1]. At the same time, human activities in spaces also generate
costs (losses), and space itself is a non-constitutional resource (recognized in economic theory as a
non-reproducible good). Space also has its value, on the one hand, given by its owners and/or users,
while on the other, through market processes occurring in it. The measure of success (or failure) in the
social, economic and environmental dimensions is the balance of costs and benefits associated with the
use of space (as well as the preservation of its desired characteristics). In the case of spatial chaos as a
negative effect of human activity, we can practically talk about losses (costs). Even if at some point
in the wrongly planned location of investment it seems to be beneficial for the investor, in the long
run it will bring disadvantages. Recent comparative studies in Europe show that the problem is not
homogeneous in different countries [2].
     Research on the phenomenon of sprawl corresponding to the approach taken in this paper was
determined, among others, in work by Galster et al. [3], in which it was emphasized that chaos can be
studied in the context of the causes or effects of adverse phenomena. It is also believed [4,5] that urban

Land 2020, 9, 214; doi:10.3390/land9070214                                        www.mdpi.com/journal/land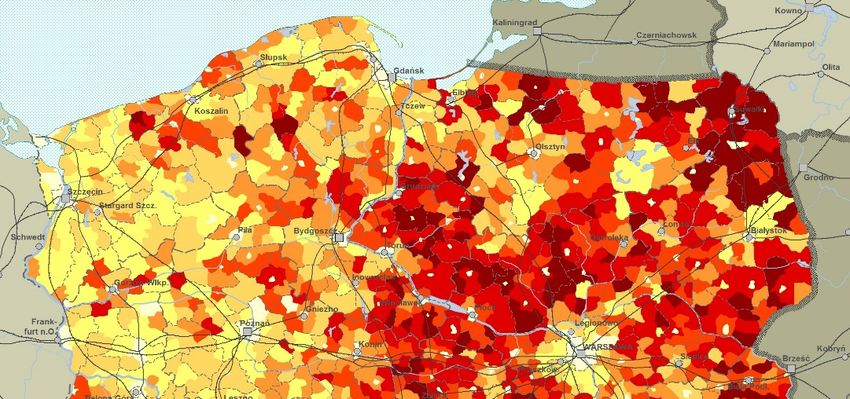
Land 2020, 9, 214                                                                                       2 of 26

sprawl is primarily a chaotic change in the spatial structure of suburban municipalities, resulting from
the intensification of suburbanization processes, with low control and insufficient planning regulation
of these processes as part of spatial policy. Disorder can be treated both statically, i.e., as a development
of space at a given moment, as well as a process, i.e., a change in the spatial structure of the area in
time. In Poland, research on the suburbanization process was conducted, among others, by Beim [6],
Czarnecki [7], Parysek [8], Parysek and Stryjakiwiecz [9] and Staszewska [10].
      Although we can indicate many unfavorable phenomena accompanying the processes of sprawl
(e.g., ghettoization, exclusion, lack of local identity, emergence of external effects and increase in
environmental impact and loss of its values), we can consider it as a model objectifying in reality [3],
which is most often a consequence of poor planning (or lack of it at the local level), and which leads
to chaotic and thus low population and housing density, generating higher costs of providing public
services, and thus increasing local expenditure [11]. Despite the research on the phenomenon of
sprawl that has been carried out for many years, it is difficult to indicate one binding definition, and a
large number of researchers quote the work carried out in the team of E.H. Wilson [12], in which
it was pointed out that the phenomenon itself is described by both quantitative and qualitative
indicators (regarding subjective assessment of the quality of life and aesthetic feelings associated with
the assessment of the landscape, etc.).
      Since the beginning of the research on the phenomena of sprawl, an assessment of the costs and
consequences of managing dispersed areas has been also carried out [13,14]. Costs and losses are
calculated in the literature in various ways regarding various components of geographical space and
measures. A relatively good indicator of efficiency is, for example, ‘absorption’ of land: quantifying the
amount (area) of land for development purposes (and not sprawl, because a positive or negative assessment
of a phenomenon depends on a subjective interpretation) [15]. Such an approach, especially in areas far
away from densely populated urban cores, seems to be useful for making decisions related to conducting
spatial policy at the local, regional and national level. In their research, the authors cited analyzed in this
way the metropolitan area of Barcelona, where in 1995–2003 there was an increase in occupied areas by
about 50% (formerly rural, mainly on the outskirts of the metropolitan area), while decrease in all green
areas and agricultural land (soil) occurred. A similar method using time-spatial analysis was used in the
study of the ten-million agglomeration of Bangalore [16]. The land use analyses carried out showed a 584%
increase in built-up areas in 1973–2010, with a 66% decrease in agricultural areas and 74% water areas.
Similar analyses for 1976–2016 were carried out for Islamabad [17], where an indicator was proposed
based on differences in the growth rate of built-up areas and population, and demonstrating on this basis
that population growth was slower than the land loss.
      This type of analysis allows the determination of the dynamics of processes, including the
creation of maps and analysis of changes for individual time series (intervals) [4]. In the cited
study by E.H. Wilson [12], an example of a method developed in the NASA Regional Earth Science
Applications Centers (RESAC) program at the University of Connecticut, providing information for
space management processes, including its planning. It is worth emphasizing that these types of losses
related to spatial chaos strongly affect the loss of areas used for agriculture and performing natural
functions. For example, in Pennsylvania in the years 1992–1997, there was a loss of 1 million acres
of agricultural land, forests and open areas and about 17% of grassland; the area of sensitive areas
such as wetlands, slopes (of valleys), area aquifers decreased by 12%–27%, and the estimated cost of
maintaining open areas in the 1990s ranged from USD 22–89 per household [18]. In turn, research
conducted on Penang Island in Malaysia indicated not only changes in the land use, but also changes
in the island’s landscape: forest cover decreased by almost 17%, grassland by about 13%, and water
areas increased by less than 1% [19].
      Chaos costs also mean increased morbidity (incidence) for specific diseases and higher healthcare
costs. Research conducted in the United States indicates that the effect of sprawl is a decrease in
quality of life, and chronic physical diseases approximately similar to the aging of the population
by 4 years (however, there was no increase in mental health disorders) [20]. This is superimposed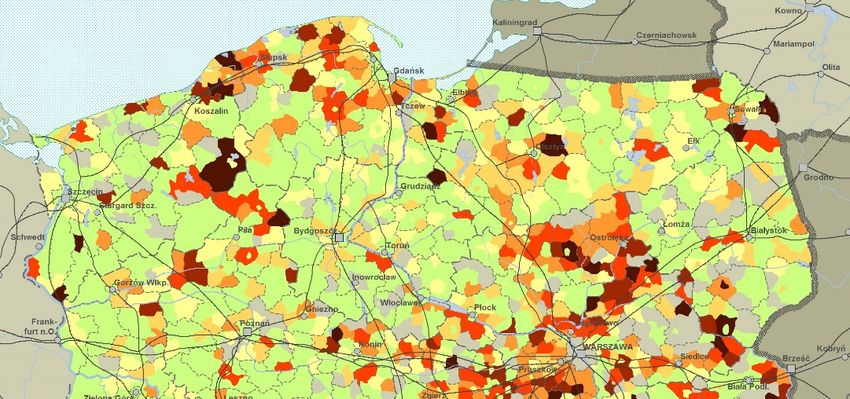
Land 2020, 9, 214                                                                                   3 of 26

on social segregation processes, i.e., frequent grouping in the less attractive suburban areas of the
elderly (who may additionally experience the phenomenon of communication exclusion and closing
down) and probably the poor. Sprawl also leads to greater air pollution, which can translate into
upper respiratory tract disease and premature death. According to the latest report from the European
Environment Agency [21] in 2016, the following number of people died due to dust pollution in the
EU-28: PM2.5 —370,000, NO2 —68,000, and O3 —14,000 people. As some studies indicate [22], it is also
possible to indicate the relationship between sprawl and BMI (obesity index): creating dispersed areas
reduces the possibility of walking and, as a consequence, generates higher medical costs associated
with higher BMIs.
      Higher public service costs are another category of chaos-related losses. One of the largest studies
on the subject conducted in the USA for 283 metropolitan counties over the period of 1982–1992
showed that the population density and type of buildings have a key impact on the final cost of
providing public services [23]. This concerned, in particular, services related to road construction and
maintenance and waste collection, but also education and public safety. In a later publication, the same
authors emphasized [24] that it is not only the cost that counts, but also the quality of public services
that are offered.
      In one of the largest studies to date in the area of Spain on this subject [25], carried out in over
3000 communes with over one thousand residents, have shown that the higher the population density,
the lower the investment and current expenditure per capita related to the provision of public services.
This was confirmed by studies from Germany [26], in which the explanatory variables were population
density and infrastructure concentration. In these methodologically similar surveys related to two
countries, the savings potential, which was calculated as the difference in monetary costs between
the most efficient infrastructures and the most inefficient municipalities, averaged 85% for Munich
and 57% for the Nagoya region for the following public services: wastewaters, primary schools and
local roads.
      Similarly, the example of Spanish Valencia has shown [27] that city sprawl results in increased
spending on public services, such as safety, transport, quality of life (selection, collection and
management of waste, sewage and water supply), road maintenance and public lighting. Research for
1085 Japanese municipalities [28] clearly confirms this regularity: even a 1% decrease in urban sprawl
may reduce the marginal cost of public services by 0.05–0.11%. In turn, empirical research conducted in
the suburban area of Miskolc (Hungary) shows that it is possible to provide high quality public services
(at least part of them), e.g., health care and public transport services [29]. From the perspective of
territorial development, suburbanization puts pressure on public facilities and technical infrastructure
of individual suburban municipalities, due to which municipalities offer local public services to their
residents, significantly increasing budget expenditure [30]. Although one can sometimes see the reverse
tendency described in the literature, i.e., the use of public services in typical urban spinal areas [31].
      Another very often indicated category of sprawl costs is related to excessive commutes to work
and services. These are primarily net location costs and time lost [32]. Studies conducted for the Milan
region have shown that the dispersion of the city’s structure and thus lower population density entails
increased costs and inefficiency (especially public transport), which leads to a new lifestyle and other
(based on individual transport) mobility models [33,34]. In addition, environmental costs through
increased energy consumption (up to 20% when living 15 km from the center-core of the urban system)
and increased CO2 emissions [35] also affect transport costs related to spatial chaos.
      Practical application of chaos cost calculation methods can also be indicated. For example,
in Flanders, when discussing a land use plan, it was calculated that in the perspective of 2050, it is
possible to save EUR 1.7 to 2.8 billion per year depending on the three scenarios adopted, including
in terms of mobility alone from 1.2 to 2 billion EUR. While preparing the calculations, costs for
households were indicated based on international research and indicators recommended by the
European Environment Agency depending on the type of buildings [36]. For extreme types of
buildings (compact city and suburbs), the difference in the overall cost is significant. In this type of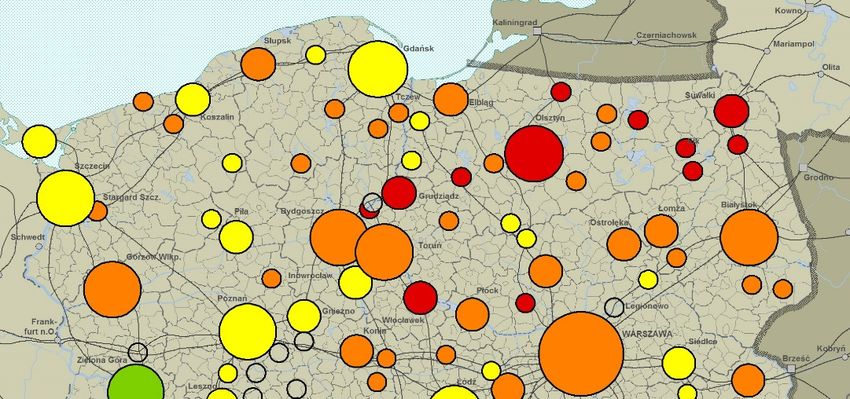
Land 2020, 9, 214                                                                                    4 of 26

research for the Halifax region in Canada, it was shown [37] that in the first case, it was USD 1.416 and
in the second, USD 3.462: i.e., the difference was almost 2.5-fold.
      The above review of sample studies indicates that the sprawl problem is basically global and
applies to all continents. Nevertheless, in individual countries, these problems have more or less clear
specificity related in particular to the current approach to spatial planning and the settlement history
of a given area.
      To date, no more in-depth, comprehensive research has been carried out for Poland, but also
for most of the world, which would inform about aggregate (i.e., occurring in various spheres of the
broadly understood geographical environment: natural and anthropogenic) costs due to spatial chaos.
The first such attempt was the “Report on social costs and economic losses of uncontrolled urbanization
in Poland” prepared by a team of experts from The Foundation in Support of Local Democracy and
Institute of Geography and Spatial Organization of the Polish Academy of Sciences, which consisted of
about 50 pages: its abbreviation published in Polish [38]. A few years later, an initiative was created to
prepare its most professional version possible, thus creating probably one of the most comprehensive
studies of the conditions, causes and effects (including costs) of spatial chaos in the world, with a total
of 841 pages in three volumes [39]. It was attended by nearly 30 experts from around the country
operating within the Committee for Spatial Economy and Regional Planning of the Polish Academy
of Sciences.
      This study attempts to summarize the main results of this multi-themed and multi-threaded—and
thus methodologically complex—report. In this way, the authors want to make a cognitive contribution
to the current study of spatial chaos in the world. The case of Poland seems to be particularly important
here, because as shown by recent comparative studies, this country is characterized by a particularly
imperfect space management system [40], as well as an unfavorable settlement structure, conducive
to sprawl.
      Against this background, the main purpose of the study is to identify phenomena and processes
leading to spatial chaos that cause various types of excessive costs in the economic, social, environmental
and public expenditure (public utilities). The second but no less important and complementary goal is
an attempt to estimate these costs in terms of their value according to various quantitative (money,
time and surface losses, etc.) and qualitative measures. The third goal is to try to explain the sources
and causes of the crisis, especially in the context of defective urban law.
      Chaos contributes to many problems related to the economic side of human activity, including
the emergence of various types of costs, classically referred to as external costs [41–43]. This study
adopts their generic classification in four strategic groups regarding the economic, social, natural
and public utilities. Costs caused by spatial chaos can be included in a given group many times
depending on the type effect in a given category. Due to the possibilities and method of measurement,
we are dealing with measurable and immeasurable effects. Measurable effects can be determined in
quantitative categories, including financial (time, money, area or other indicators, e.g., effectiveness
and efficiency), and immeasurable, in qualitative and descriptive categories (phenomenon occurs, lack,
strong and weak, etc.). In addition, costs can be described in terms of direct/indirect and associated
effects. The following categories of costs are accepted:

•     Economic costs: concerning real value in money, possible losses and costs of lost benefits
      (alternative), significant especially from the point of view of conducting business activity.
      The economic dimension of spatial disorder means negative effects in the economic sphere,
      by reducing income or the need to incur higher costs than in the case of a condition that can be
      considered as spatial order.
•     Strictly social costs (these are not external costs in the classic microeconomic understanding,
      because their source is not producers, but often the residents themselves): public and private
      burden borne by residents, usually difficult to measure, related to the features of social structure
      and processes, possible to calculate as, e.g., time losses, increased number of deaths, level of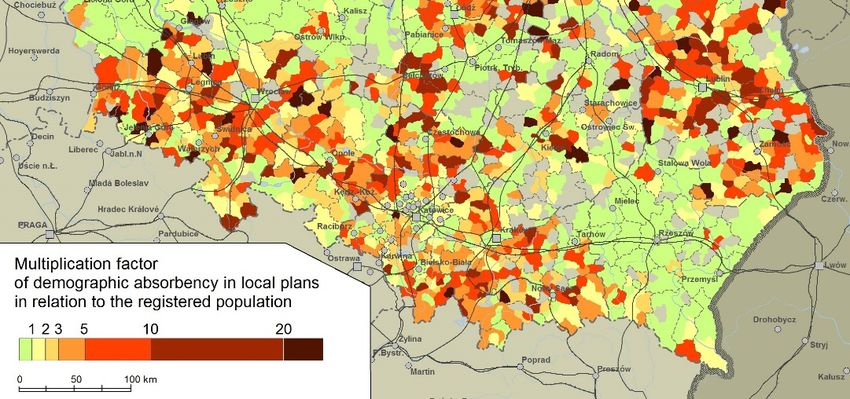
Land 2020, 9, 214                                                                                                          5 of 26

       satisfaction and healthiness, as well as some monetary costs related to non-professional individual
       costs (to be demarcated from economic costs allocated to the public sector and enterprises).
•      Environmental costs: related to disturbances and negative impact on the natural environment
       (condition, quality and naturalness of processes), as well as resulting from the limited space.
•      Public utility costs: related to increased costs (expenses) of public finances, especially in the
       local system (municipal government). External costs cause above-average expenditure from
       public service maintenance budgets or cause underfunding of services, deterioration of their
       quality, abandonment of expenditure on restoration of assets and indebtedness of the economy at
       the expense of future generations. These costs have their financial, material, cultural, political,
       temporal and spatial dimensions.

2. Materials and Methods
     The starting point for the research analysis was the assumption that spatial chaos causes various
costs that can be analyzed in various aspects and cross-sections characteristic of development (mainly
local ones: Table 1). First, several major thematic areas were adopted, in which the most uniform
effects of spatial disorder were identified. The following categories were proposed: settlement, real
estate market, economy and development (general), agriculture, transport, municipal infrastructure,
natural environment (or natural resources), conditions and quality of life and public security. Then,
each of them was subjected to a detailed and in-depth analysis in terms of causes, conditions and
generated costs (Table S1). Efforts were made to exhaust the subject matter as completely as possible.
Each topic has been prepared by authors’ teams representing various research specialties.

        Table 1. General identification of phenomena, conditions, causes and related costs of spatial chaos.

                                                                                        Main Causes and
                                                   Cost Size       Phenomenon                                     Cost Size
                        Main Causes and                                                   Conditions
     Phenomenon
                          Conditions             in Economic                                                    in Economic
                                                    Sector                                                         Sector
                                                Low
                                                productivity
    Diffusion of                                and                                    Environmental           Higher costs of
    single-family      Possibility of           competitiveness                        pollution with higher   building and
                                                                  Lower standard
    housing in         building without a       of economies at                        emissions (higher       operating
                                                                  of living.
    agricultural       local plan (wz).         various                                energy consumption,     settlement
    areas.                                      geographical                           automotive, etc.).      systems.
                                                and territorial
                                                levels.
                                                Higher costs of   High economic
    Expansion of                                                                                               Lower
                                                functioning of    costs (e.g.,
    construction to                                                                                            efficiency of
                       Bad structure and        socio-economic    individual
    areas threatened                                                                   Landscape               technical
                       fragmentation of         systems,          motorization,
    by floods,                                                                         devastation.            infrastructure,
                       local plans.             including         costs of
    landslides, raw                                                                                            e.g., sewage
                                                transport of      establishing
    materials, etc.                                                                                            system.
                                                goods.            relationships).
                       No regulation of
                       areas for housing in
                                                                  Waste of time
                       the national
                                                Losses due to     (commuting,                                  Higher
    Devastation of     regulation system
                                                lowering the      services,            Ecological imbalance    investment in
    the natural and    (including the lack of
                                                value of space    education, etc.)     and stability of        restoration and
    cultural           dependence of
                                                (tourism, real    at the expense       natural systems.        environmental
    landscape.         investment land
                                                estate market).   of family and                                protection.
                       supply on
                                                                  socio-social life.
                       demographic
                       forecasts).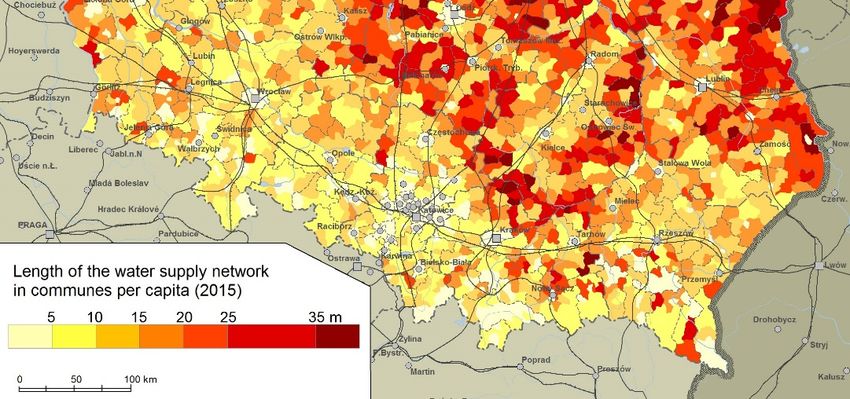
Land 2020, 9, 214                                                                                                      6 of 26

                                                         Table 1. Cont.

                                                                                     Main Causes and
                                                   Cost Size        Phenomenon                                Cost Size
                        Main Causes and                                                Conditions
    Phenomenon
                          Conditions             in Economic                                                in Economic
                                                    Sector                                                     Sector
                                                                                                           Higher social
                                                                                                           service costs
                                                                                                           (location of the
                                                                                                           network of
                                                Losses in the
  Excessive            No economic                                                                         health care and
                                                economy of                          Negative feedback in
  de-farming of        connection between                                                                  educational
                                                raw materials,      Accidents and   terms of
  land for             private and social                                                                  facilities,
                                                irrational use of   collisions.     environmental
  construction         costs (including no                                                                 commuting,
                                                natural                             degradation.
  purposes.            property tax).                                                                      e.g.,
                                                resources.
                                                                                                           transporting
                                                                                                           children
                                                                                                           through local
                                                                                                           governments).
                                                                                                           Lower
  Land and real
                       Faulty technical                                                                    efficiency of
  estate speculation                                                Civilization
                       infrastructure                                                                      public
  related to                                                        diseases.
                       financing system.                                                                   transport (high
  corruption.
                                                                                                           subsidies).
  Chaotic              No obligation to
                                                                                                           Compensation
  development          parcel land for
                                                                                                           and medical
  (housing) of         construction
                                                                                                           expenses.
  roads.               purposes.
                       Competing for the
                       development of
                       housing and
  The development
                       taxpayers by the
  of motorization
                       municipalities
  and terrain
                       surrounding large
  consumption
                       cities by excessive
  during
                       “agricultural
  devastation of
                       removal” of land for
  public roads.
                       construction
                       purposes beyond
                       needs.
  Low service
  standards in
  social               Primacy of property
  infrastructure in    rights over the
  new                  common good
  development          (constitutional right
  areas, especially    to build).
  in suburban
  areas.
  Appropriation of
  public areas for     Low public
  private purposes     education in the field
  (green areas,        of spatial order.
  squares).
  Degradation of       Institutional
  urban, rural and     weaknesses, shortage
  agricultural         and poor education
  infrastructure.      of staff.
                       Historical conditions
                       (policy of
                       partitioning powers,
  Waste of space.
                       the legacy of the
                       People’s Republic of
                       Poland).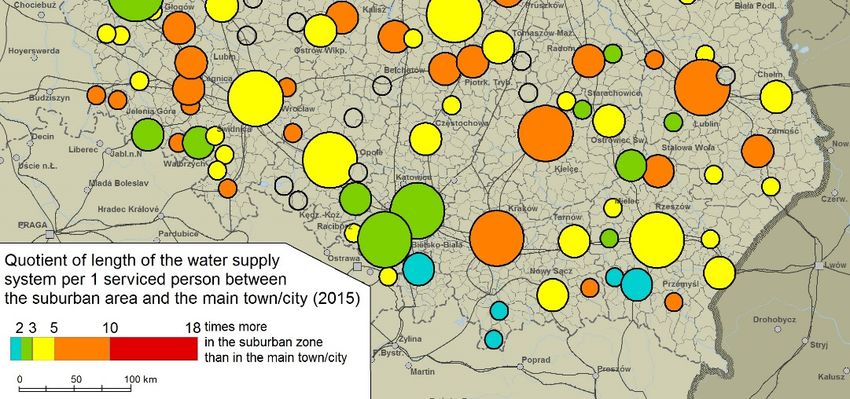
Land 2020, 9, 214                                                                                                         7 of 26

                                                        Table 1. Cont.

                                                                                       Main Causes and
      Land 2020, 9, x FOR PEER REVIEW              Cost Size        Phenomenon                                   Cost Size
                                                                                                                   7 of 27
                         Main Causes and                                                 Conditions
    Phenomenon
                           Conditions            in Economic                                                    in Economic
                           legacy of the
                                                    Sector                                                         Sector
                             People’s
  Landscape                 Republic of
  ugliness.                  Poland).
  Ecological
       Landscape
  structure  and
       ugliness.
  systems upset.
           Ecological
         structure and                                Source: own study.
        systems upset.
     The paper presents results of such specific                  costs
                                                        Source: own        (in selected categories), and their analysis
                                                                      study.
was associated with the conditions of spatial management and spatial planning in Poland, both
historicalThe     paper presents
             (shaping     a faultyresults    of suchstructure
                                      settlement       specific costs
                                                                  as a(inresult
                                                                           selected
                                                                                  of categories),
                                                                                      partitions,and  warstheir analysis
                                                                                                              and        was of
                                                                                                                   the period
      associated    with the conditions     of spatial management      and   spatial planning     in Poland,
centrally controlled economy until 1989) as well as contemporary ones (economic liberalism, low social        both  historical
      (shapingalso
awareness:         a faulty
                      among settlement
                               state and   structure   as a defective,
                                             local elites,   result of partitions,
                                                                          includingwars       and the period
                                                                                         excessively             of centrally
                                                                                                         complicated     planning
      controlled economy until 1989) as well as contemporary ones (economic liberalism, low social
laws) (Figure 1). In the Polish legal order at the local level, there are the following legal documents
      awareness: also among state and local elites, defective, including excessively complicated planning
(instruments) regarding spatial planning: (i) studies of conditions and directions of the spatial
      laws) (Figure 1). In the Polish legal order at the local level, there are the following legal documents
development
      (instruments)of communes        (including,
                        regarding spatial             among
                                               planning:        others,ofdefining
                                                           (i) studies       conditions local
                                                                                            anddevelopment        principles
                                                                                                  directions of the    spatial and
directdevelopment
        binding guidelines
                       of communes (including, among others, defining local development principles andplans
                                  for   local  spatial   development        plans);  (ii)  local   spatial  development
(binding   local
      direct       legalguidelines
              binding    acts of a generally      regulatory
                                     for local spatial          nature: plans);
                                                          development      binding,(ii)i.e., inspatial
                                                                                         local   a legally  guaranteed
                                                                                                        development        manner,
                                                                                                                        plans
land (binding
      use and local
                  principles   of of
                       legal acts itsadevelopment.        However,
                                        generally regulatory    nature:these    are i.e.,
                                                                          binding,   optional     acts,guaranteed
                                                                                          in a legally  binding only     on about
                                                                                                                     manner,
30% ofland
         theuse   and principles
               country’s    area; of  itsdecisions
                                   (iii)  development.     However, and
                                                       on building      theseland
                                                                               are optional
                                                                                    developmentacts, binding   only onindividual
                                                                                                        conditions:     about
      30%   of  the  country’s area;   (iii) decisions  on  building   and   land  development
administrative acts most often concerning individual infrastructure investments, issued for areas    conditions:  individual
      administrative
without   local plansacts     mostThis
                          [2,44].    often    concerning
                                           study   has alsoindividual    infrastructure
                                                               been significantly           investments,
                                                                                        updated             issuedtofor
                                                                                                     compared           areas
                                                                                                                      the original
      without local plans [2,44]. This study has also been significantly updated compared to the original
report. This applies to both a review of world literature and Polish items on the conditions, causes and
      report. This applies to both a review of world literature and Polish items on the conditions, causes
effects (including costs) of spatial chaos.
      and effects (including costs) of spatial chaos.

                      Figure 1. 1.Classification
                         Figure    Classification of
                                                  of the causesofofspatial
                                                     the causes     spatial  chaos.
                                                                           chaos.   Source:
                                                                                  Source:   own
                                                                                          own    study.
                                                                                              study.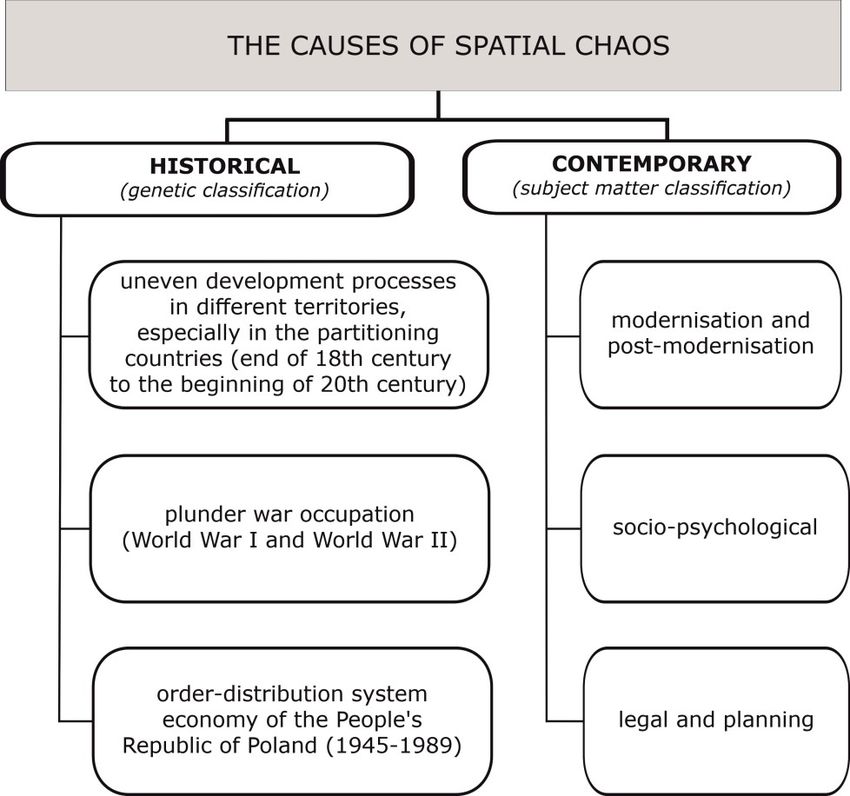
Land 2020, 9, 214                                                                                     8 of 26

3. Results

3.1. Settlement
    Settlement, along with the transport network, is the main element of spatial development.
Therefore, recognition of mechanisms and cause–effect relationships in these elements is crucial for the
possibility of estimating losses resulting from faulty spatial management. The following challenges
and problems can be identified [45,46]:

(a)   Unsatisfactory condition of public infrastructure service: This is due to a defective, extensive and
      irrational structure of land use and development. The commune is not able to lead and maintain
      roads, water supply, sewage system and energy networks to dispersed and chaotic buildings
      and housing estates. At the same time, ensuring an appropriate standard of communication
      and service support is impossible due to the high costs. In economic terms, this means higher
      expenses and lower investment attractiveness; in social terms, a low standard of living; and in
      environmental terms, environmental pollution. The problem of service mismatching always
      means higher costs for public finances.
(b)   Lack of utilities: In extreme cases, local governments are unable to provide access to buildings,
      especially housing, to basic utilities. In the case of public finances, the most serious threat is the
      high cost of buying a land for infrastructure construction, estimated at tens of billions of euros
      and threatening to bankrupt some municipal governments.
(c)   Morphological and functional chaos of chaotic buildings and urban and spatial disfunctions:
      Spatial disorder has also its sources in jurisprudence of law, official culture and everyday life.
      Communities are condemned to a low standard of living and have local identity issues. In natural
      systems, decomposition, defragmentation and disruption of the traditional rhythm of matter and
      energy circulation occur, and strong anthropopressure destroys the environment.
(d)   Excessive building placement in areas with agricultural functions: The so-called “urban” urban
      planning causes the loss of agricultural and nutritional areas (the so-called host zone). In newly
      built-up, functionally unrelated areas, too rapid social changes take place, preventing the
      formation of proper relationships, interpersonal relationships, local identity, etc.
(e)   Oversupply of investment plots with low location potential: This problem concerns the faulty
      structure of settlement areas: too small plot areas, disordered ownership and lack of consolidation
      and access to infrastructure. This gives rise to social conflicts, and for public finances it means
      enormous transformation costs (land purchase, plant and agricultural economy, including
      mergers, etc.).
(f)   Low economic efficiency of settlement: This results directly from the dispersion of buildings
      and the lack of harmony of settlement and functional systems: the distance between places of
      residence, work and services, as well as unnecessary intersections of relations, disorder and lack
      of hierarchy, etc. Higher market and public costs result here, in particular, from poor spatial
      accessibility in including transport costs and time needed for effective “binding” of various
      complementary functions that determine the proper functioning of territorial and social systems.
      Living costs are rising, operating costs are high, etc.

     It is worth pointing out here important information regarding the financial forecasts of the effects
of local plans. These data have been collected by the Central Statistical Office of Poland since 2012.
These materials show that the planned spatial management is unbalanced and the balance of income
and costs is negative, closing at the level of minus EUR 1.09 billion). At the same time, expenses
related to the adoption of local plans amount to EUR 20.86 billion, including the purchase of land
for investment construction: EUR 2.88 billion; construction of municipal roads: EUR 9.64 billion;
construction of other infrastructure: EUR 5.88 billion; other expenses: EUR 2.43 billion). It can be
expected that this is a financial perspective of over a dozen to a maximum twenty years.
Land 2020, 9, 214 9 of 26
So far, only part of this expenditure has been incurred. According to the latest available data, by
2015, municipalities spent EUR 3.36 billion (with revenues of EUR 2.27 billion), so the balance, as in the
forecasts, is also negative. Importantly, these amounts are growing: forecast expenditure in 2013–2015
(increased by EUR 5.08 billion), i.e., by almost one third. However, this is not due to a drastic change of
situation, but to more realistic forecasts, also in terms of statistics (not all local plans in Poland have a
forecast of effects).
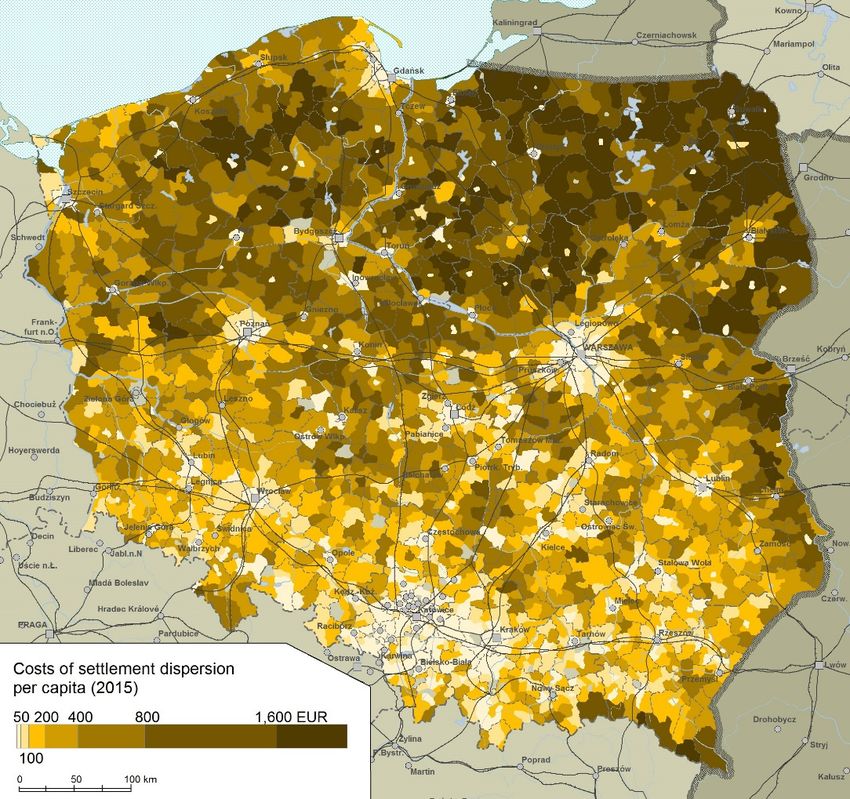
Among the presented calculations, data presented by P. Gibas and K. Heffner [45] are particularly
quantifiable and convincing, according to which the cost of building and operating additional
infrastructure may amount to EUR 15.36 billion per year. The authors conducted very detailed analyses
of the layout of buildings according to the address point database, pointing to addresses located a
large distance (over 280 m) from compact buildings and other buildings, and then calculated the
costs of building and maintaining roads and making electrical connections (Figure 2). The cited study
is currently the most comprehensive and documented, referring to the issues of the costs of spatial
chaos and the problem of dispersal of buildings. Each additional 1 m above 280 m from the nearest
neighboring building was estimated at EUR 360.9. The analyses show that sparsely populated areas of
the Lakeland, Podlasie and Bieszczady are particularly ineffective and that the differences are several
dozen times.
Among other analyses that indirectly illustrate the problem of spatial chaos, it is worth pointing
out the high costs of water supply and sewage systems, related to dispersion and spatial chaos, not only
in peripheral rural communes, where settlement is naturally poorly developed, but also in urbanized
suburban areas. Across the country, in 152 zones of the largest cities (20,000 inhabitants and more),
52 communes (out of a total of 466) can be identified in which the population density was more than
150 apartments per 1 km2 , and at the same time the length of the water supply network per capita was
>10 m. At the same time, in as many as 68 suburban zones, the indicator of the length of the active
water supply network per capita was five times higher than in core cities (Figure 3).
The above-mentioned problems are mostly not resolved by spatial policy. Quite the
opposite–individual tools of this policy even deepen individual dilemmas [47–49], including Poland’s
situation becoming problematic in comparison with other countries [50]. Both on the basis of the
decision on building and land development conditions, as well as local spatial development plans,
land is earmarked in such a way that its “planning” absorption exceeds both the current and the
forecasted number of inhabitants many times. The authorities responsible for implementing spatial
policy too often succumb to grassroots urban pressure (sometimes they even support it themselves),
which results in the problems of settlement mentioned above. The main factors generating this state of
affairs include:
• No binding features of the study of conditions and directions of spatial development in
the perspective of the entire spatial management system; at the same time, there are no
mechanisms that allow even under such defective documents to declare sufficient protection
against uncontrolled buildings.
• Too broad criteria when issuing decisions on building conditions, enabling, in the absence of
local plans, actual “forcing” investors by buildings detached from the functional features of the
environment [51].
• Weaknesses of local plans, which on the one hand boils down to the lack of sufficient protection
against urban pressure (which results in frequent adoption of plans expanding building options
in isolation from actual conditions), and even disputable morphometric features of plans
(associated with bypassing key areas from the perspective of providing, e.g., high public
infrastructure standards).
In conclusion, the above-mentioned problems generate the current shape of spatial policy tools,
the use of which is associated with too broadly understood freedom of development and a lack of
factors that effectively protect and shape spatial order.Land 2020, 9, 214 10 of 26
Land 2020, 9, x FOR PEER REVIEW 10 of 27
Land 2020, 9, x FOR PEER REVIEW 10 of 27
FigureFigure 2. Costs of excessive dispersion of buildings per capita in Poland in 2015 by communes. Source: [45].
2. Costs of excessive dispersion of buildings per capita in Poland in 2015 by communes.
Source: [45].2. Costs of excessive dispersion of buildings per capita in Poland in 2015 by communes. Source: [45].
Figure
Figure 3. Indicator comparing the effectiveness of the water supply network in cities and their suburban
areas. The higher the multiplicity, the efficiency of suburban areas is correspondingly lower than in the
main city. Source: [46].Land 2020, 9, 214 11 of 26
3.2. Technical Infrastructure
Technical infrastructure and its costs and losses are closely correlated with settlement (therefore,
they have been jointly included in Table S2). Potential problems include broad social, economic,
engineering and organizational issues. They also result, to a significant extent, from the conducted
spatial policy. Appropriate distribution of technical infrastructure determines the socio-economic
development, and also directly affects financial efficiency and meeting the needs of local development,
especially the quality of life and business conditions. This applies to suitably diversified areas, both
subject to the process of sprawl [52–54], as well as other typically agricultural ones, e.g., in connection
with the location of wind farms [55].
Necessity of incurring the excessive expenditure on infrastructure undoubtedly hinders
(and sometimes prevents) the obtaining of positive effects in this respect. This is reflected in, among
others, the above-average expenditure of communes for purposes related to transport, municipal
services, water and sewage management, public roads and real estate management, as well as the
maintenance of infrastructure. In this context, the costs of technical facilities for the needs of households
and enterprises, etc., are particularly high. In the case of detached houses, the cost of infrastructure
construction is EUR 26.267 per house; for terraced houses, EUR 18.826 per house; and in the case of
multi-family housing, EUR 14.409 per apartment [56].
Insufficient investment can be estimated on the basis of water, sewage and rainfall, etc. service
indicators. According to the Central Statistical Office of Poland, at the end of 2018, 92.1% of residents
were connected to the water supply system, and only 70.8% to the sewage system. There is therefore
a very large inconsistency in both types of networks. As a result of the dispersion and chaotic
arrangement of buildings, the infrastructure network is longer and inefficient. In some communes, this
indicator exceeds even 35 m per person, including the length of the network per capita in the east of
the country is even five times higher than in the west (Figure 4). To a large extent, this is due to the
features of Poland’s historical development, including variation in urbanization rates [57].
Land 2020, 9, x FOR PEER REVIEW 12 of 27
FigureFigure 4. Length
4. Length of water
of water supply
supply networkper
network per capita
capita as
asaameasure
measure of of
socio-economic efficiency
socio-economic and and
efficiency
costs of spatial chaos. Source: based on Central Statistical of Poland
costs of spatial chaos. Source: based on Central Statistical of Poland data. data.
Excessive investment needs to be associated with the dispersion of buildings which cause
numerous local spatial conflicts related to the design and routing of line and point facilities, in
particular road networks, in the field of water and sewage management (sewage treatment plants)
and landfills [58,59]. Chaos is also the reason for the increase in mobility and transport intensity,
because it increases the demand for transport. This is due to the fact that a poorly organized, randomLand 2020, 9, 214 12 of 26
Excessive investment needs to be associated with the dispersion of buildings which cause numerous
local spatial conflicts related to the design and routing of line and point facilities, in particular road
networks, in the field of water and sewage management (sewage treatment plants) and landfills [58,59].
Chaos is also the reason for the increase in mobility and transport intensity, because it increases the
demand for transport. This is due to the fact that a poorly organized, random location of homes,
workplaces and services, etc., extends the route. Disorder is not only the reason for the increase in
transport intensity, but also generates the need to provide a larger area for transport needs [60]. In turn,
the increase in traffic and the construction of new infrastructure is further contributing to this chaos.
From the perspective of spatial policy tools, there is no stronger link between planning documents
and the consequences associated with the need to erect technical infrastructure devices. For some
tools (municipal study), there is no such requirement; for others, they are formulated excessively in
general or in a way referring to the individual perspective. There are also possibilities of omitting the
indicated issues in spatial policy. In the analyzed context, the problem of implementing other types of
buildings is also noticeable, which can be exemplified by wind energy and dilemmas related to its
effective planning implementation in individual areas [55]. In such a state of affairs, it is not possible to
ensure responsible verification of key technical infrastructure standards, such as accessibility (including
spatial), performance, throughput, efficiency and security.
3.3. Transport and Mobility
Spatial chaos—in this case, the lack of good spatial organization—is the main reason for the
increase in transport intensity in Poland [61]. In turn, the increase in traffic and the construction of
new infrastructure contribute significantly to this chaos. This is therefore a very dangerous negative
feedback. At the same time, there is an increase in daily mobility in Poland, which directly translates
into transport needs. The size and structure of daily mobility depends on the place of residence,
location of travel destinations (especially jobs) and the frequency of shipments of various purposes.
Urban residents are more mobile.
Jobs and housing mismatches result from a strong imbalance in the supply and demand of the
labor market [62,63]. The most attractive labor markets concern the most developed agglomerations,
with Warsaw at the forefront. At the opposite end are backward peripheral areas, where there are
no jobs, and residents follow employment either moving permanently or undertake long-distance
commuting. Commuting to Warsaw reaches distances even over 100 km. Given the time it takes to
move and the mass nature of this phenomenon, this causes very high external costs, including social
costs, degrading family and social life, interpersonal relationships and civic activity, etc. Excessive
commuting costs in 18 Polish agglomerations (around provincial capitals) were estimated at an
average of EUR 75,000 per household in 2015–2030 [64]. The costs of excessive travel to Warsaw were
estimated in the case of the 13 nearest poviats (Grodzisk, Grójec, Kozienice, Legionowo, Mińsk, Nowy
Dwór, Otwock, Piaseczno, Pruszków, Sochaczew, west Warsaw, Wołomin and Wyszków) at EUR
151.65 million per year [38].
There are several reasons for the increase in mobility in Poland. The most important of these are
relatively rapid development and structural changes in the economy, mismatching jobs and residence,
and strong dispersion for European countries [65]. This causes an increase in traffic and transport
performance, contributing to environmental problems [66]. In 2016, according to CSO data, 1.8 billion
tons of cargo was transported, which, compared to 2005, was an increase of 33%. Transport performance
increased even more strongly during this period—by 69%, of which as much as 254% was in road
transport. Spatial chaos directly increases the demand for transport. This is due to the fact that the
disordered locations of various functions and the lack of clear organizational and spatial structure
extends the route. Therefore, disorder is the reason for the increase in transport intensity, but also
generates the need to provide a larger area for transport needs.
The costs of spatial chaos in transport were calculated [61] based on the cost-benefit account,
including improper implementation of investment processes and the so-called redundant infrastructure.Land 2020, 9, 214 13 of 26
This applies to gigantomania (construction of infrastructure facilities far above the needs of actual
demand) and technical sublimation (using the latest, but unproven, usually expensive and often
unreliable technical innovations). On the other hand, too careful planning of the technical and functional
parameters of infrastructure causes traffic congestion. It is visible even on the highest-class roads, i.e.,
on some sections of the highway. A characteristic example is the Warsaw–Łódź section, on which
traffic is concentrated not only from the latitudinal direction, but also between the Warsaw and Tri-City
agglomeration, because this is the shortest route from the Polish capital to Gdańsk. For this reason,
the planned and implemented two lanes each way turned out to be insufficient. Higher demand for
transport due to spatial disorder results in correspondingly higher external costs. These are especially
the costs of road accidents [67] as well as losses and environmental pollution. Transport costs in Poland
are four times higher than the EU average. They amount to not less than EUR 4.96 billion a year.
There are also significant restrictions on spatial policies with this problem. Despite the application
of special regulations (the so-called road special acts), when determining the location of some public
roads, a serious barrier is the inability to plan the location of the road in advance and “reserve” the
area for this purpose [68]. As a consequence, rational planning of the road network is hampered by
bottom-up actions of individual stakeholders (sometimes boiling down to deliberate obtaining, in a
given area of location, decisions informally planned for a public road). This extends to the entire
investment process, which generates serious spatial conflicts and sometimes ultimately prevents a
specific road location.
3.4. Land Use and Agricultural Activities
Land use and agricultural activities are further areas of spatial chaos [69]. Its main causes are
fragmentation of lands and poor functional and spatial organization of rural areas, which are some
of the major sources of financial losses. Generating high labor costs and, consequently, low income
in agriculture is a key problem in this context in agriculture. The above is associated with spatial
fragmentation of lands, including their extensive cadastral divisions [70] associated with usually
successful attempts to change their purpose for non-forest ones. These are activities resulting from
specific spatial policies.
Legal and planning conditions contribute significantly to the spatial fragmentation of lands. In the
current formula, spatial policy tools—primarily local spatial development plans, instead of deliberately
and rationally shaping functional entities in the form of villages—may (in the regulatory dimension)
refer to very small areas. In 2015, as many as 216 rural communes were identified in which the average
size of the plan was less than 10 ha. For example, in the Inowłódz commune (Łódź Voivodeship),
10 local plans were in force, with a total area of 50 ha (5 ha on average), and in the commune of
Radzanowo (Mazowieckie Voivodeship), 44 plans with a total area of 397 ha (9 ha on average) were in
force, but there were in total 24 communes, in which the average size of the plan oscillated around
1 ha. In the “record” commune of Sanok, there were as many as 280 plans (total area 402 ha); in the
commune of Lubiewo, 153 plans (114 ha); and in the commune of Szaflary, 81 plans (54 ha). It has
also been shown that a significant proportion of plans—about 30%—occur more than in one piece,
and “record” documents in this respect have even 100 or more of these patches [71]. The value of such
plans from the point of view of shaping the spatial order of villages and agro-rural areas is negligible
or none [72].
The content of a significant part of local plans is also a problem, especially attempts to change the
use of agricultural land for non-agricultural and non-forest purposes. It is even possible to distinguish
(from the perspective of how to conduct spatial policy) a separate group of communes, for which the
only function of local plans is changing the land use to non-agricultural one [51]. The effect of changes
in the use of land from agricultural use for non-agricultural purposes, mainly residential, is a strong
oversupply of investment land, resulting not only in the dispersion of buildings, but also with excessive
exclusion of such land from agricultural use and failure, particularly disfiguring the landscape [73].
This reduces both the production potential and the efficiency of agricultural activity due to landLand 2020, 9, 214 14 of 26
parceling into smaller plots and increasing the service costs (mechanization and fertilization, etc.),
including in particular the internal costs of transport on a farm. There is also a practice of separating
arable land (for development) even before the plans are adopted. There is also a lack of mechanisms
guaranteeing more common land parceling.
Another problem is too large distances between agricultural plots belonging to one owner.
This results in significantly higher transport costs. The areas where this problem is particularly
significant include western and partly eastern Poland (including the Bieszczady Mountains). There was
a large-scale lease of real estate by individual farmers after 1989, very often living permanently far away
from cultivated fields and meadows. Based on the agricultural census in 2010, 109 rural communes and
rural areas were identified in urban-rural communes, in which arable land located at a distance of more
than 10 km from the headquarters of the agricultural holding accounted for over 35% [74]. A specific
problem of rural areas, which also contributes to the creation of spatial chaos, are the so-called second
homes, often built in agricultural areas, contributing to the uncontrolled urbanization of rural areas
and the change of use of previously agricultural areas [75].
3.5. Real Estate Market
The costs of spatial disorder that can be associated with the real estate market in the presented
approach result primarily from the local spatial policy [76]. It is determined by legal and supra-local
conditions, etc.; however, in the context of the characteristics of the indicated costs, reference has been
made to the consequences of using specific spatial policy tools.
First of all, attention should be paid to the consequences of excessive use of individual areas
for housing in local plans. The “hardest” data belongs to the category of “indirect” costs and relate
to a strong oversupply of construction land, of which only in local plans (not including studies of
conditions and directions of spatial development) there is 1.2 million ha, in over 90% of cases for
single-family housing. Although we do not know exactly what part of this land is already invested, we
can estimate the global demographic absorbency (capacity), which shows that 57–89 million people
can live in these areas [38], with the latest and the most accurate estimates indicating a number of
59.6 million people [77] However, it should be noted that only one third of the country’s area is covered
with local plans, and the remaining development is also possible based on location decisions in Poland
for housing purposes is very large. Only for a small part of the communes’ needs, the reserves of land
for investment purposes are balanced. There are regions of Poland in which the area of available land
is several times higher than the inhabited population (Figure 5).
The above data about a strong oversupply of land are a serious argument in favor of raising various
types of threats on the real estate market. The amounts of land that can be built up often exceed real
needs. This happens in the situation of depopulation processes, in which the problem of developing
abandoned infrastructure will be much more frequent than seeking new places for investment,
especially in peripheral areas [78,79]. The most characteristic risk is the risk of a “speculative bubble
bursting” on the land property market. It consists of the fact that if all owners of “free” construction
land wanted to sell them, supply would exceed demand many times. Profits of land investors in Poland
are therefore quite virtual. The problem of a “bursting bubble” on the real estate market would also
have long-term effects and would significantly extend the time of recovery from recession. Potential
panic would further deepen the expected losses.people can live in these areas [38], with the latest and the most accurate estimates indicating a number
of 59.6 million people [77] However, it should be noted that only one third of the country’s area is
covered with local plans, and the remaining development is also possible based on location decisions
in Poland for housing purposes is very large. Only for a small part of the communes’ needs, the
reserves
Land of214
2020, 9, land for investment purposes are balanced. There are regions of Poland in which the 15 area
of 26
of available land is several times higher than the inhabited population (Figure 5).
5. Multiplicity
Figure 5. Multiplicity of
of demographic
demographic absorbency
absorbency according
according to
to the
the local
local plans
plans in relation to the
registered number ofof inhabitants.
inhabitants. Source: [77].
In
ThePoland,
abovehowever,
data about there is no drastic
a strong reduction
oversupply in land
of land areprices due toargument
a serious the fact that the efforts
in favor made
of raising
and investments,
various types of e.g., in the
threats onretraining of landmarket.
the real estate in local plans, are a long-term
The amounts of landtypethatofcansecuring
be builtincome and
up often
families,
exceed real etc.needs.
in the This
future. If theseinlands
happens are not subject
the situation to a stronger
of depopulation exchange,
processes, in the riskthe
which of speculative
problem of
bubble
developingbursting appears to
abandoned be lower. However,
infrastructure will be ifmuch
we assume
more that aboutthan
frequent threeseeking
quartersnew of construction
places for
land in Poland
investment, is oversupplied,
especially in peripheral the difference between
areas [78,79]. Thethe mostvalue of agricultural
characteristic risk and construction
is the risk of a
land would be, depending on the detailed methodological assumptions,
“speculative bubble bursting” on the land property market. It consists of the fact that if all ownersEUR 39.9–64.7 billion [80].
of
However, accordingland
“free” construction to the capitalized
wanted to sellrent
them,method,
supplythe valueexceed
would of thisdemand
surplus manywas estimated at EUR
times. Profits of
63.5
land billion
investors for in
agricultural
Poland areland and EUR
therefore quite142.4 billion
virtual. Thefor construction
problem land [81].
of a “bursting These on
bubble” values are
the real
quite
estatedifferent,
market wouldbut they indicate
also that this problem
have long-term should
effects and be perceived
would in Poland
significantly extendinthe thetime
scopeof of tens of
recovery
billions of euros.Potential
from recession. Economic consequences
panic would furtherhere also
deepeninclude investment
the expected uncertainty or land speculation.
losses.
In theInsocial
Poland, dimension,
however, this deepens
there is no the consequences
drastic reductionin inthe
landform of growing
prices due to the conflicts andthe
fact that satisfying
efforts
social needs less and less.
made and investments, e.g., in the retraining of land in local plans, are a long-term type of securing
income Therefore, it can etc.
and families, be pointed out that,
in the future. in thelands
If these contextareofnot
thesubject
consequences related
to a stronger to the real
exchange, theestate
risk
market, deficiencies
of speculative bubble inbursting
the area of development
appears areasHowever,
to be lower. are particularly noticeable
if we assume that (this is not
about changed
three quartersby
the statutory requirement
of construction to prepare
land in Poland such a balance
is oversupplied, thebefore preparing
difference or changing
between the valuethe ofstudy), as well
agricultural as
and
detachment
constructionofland the real
wouldpossibilities
be, dependingof building
on theout individual
detailed development
methodological tools areas. A
assumptions, personalized
EUR 39.9–64.7
problem
billion [80].is theHowever,
lack of connections
accordingbetween the sphere of
to the capitalized spatial
rent planning
method, the andvalue theofsphere of real estate
this surplus was
valuation manifested, among others in legal discrepancies, as well as weaknesses in financial forecasts
prepared in connection with the adoption of plans [82]. The potential compensation costs of adopting
local plans are also a problem, which makes it difficult to change the current status quo, which is
also the case in the systemic sphere. In the Polish spatial management system, the adoption of local
spatial development plans in a given area, limiting previous land use options (even potential), leads toLand 2020, 9, 214 16 of 26
serious financial consequences for communes. Owners of such property may demand compensation
from the communes (equal reduction in the value of their property related to the adoption of these
plans). This deepens the reluctance of many communes to adopt local plans [83,84]. In the context
of the effects on the real estate market, the consequences of suburbanization for the budgets of local
government units [54,64] should also be included.
3.6. Environmental (Nature) Costs
Natural environment is the element of geographical space that reacts in a particularly complex
way to human activity. At the same time, negative effects of anthropopressure are very difficult to
neutralize, and often cause irreversible changes in ecological systems [85]. Therefore, environmental
costs resulting from spatial disorder are very high, often impossible to incur by even the richest
countries, and also have indelible technical and organizational restrictions.
The main factors degrading the structure and disturbing the functioning of the natural environment,
including the national network of ecological corridors [86,87], are:
• Transformation of river valleys (regulation of riverbeds, drainage of hydrogenic habitats, clearing
of alluvial forests and tree stands, development of floodplain terraces and location of sites harmful
to the environment, etc.).
• Road network density, combined with a significant increase in traffic intensity and the encapsulation
of busy routes with tunnels of noise barriers, causing strong landscape defragmentation on a local
and regional scale (including even a change in the topology of natural systems on a macro scale).
• Expansion of dispersed buildings into natural and agricultural areas, combined with the liquidation
of many local ecological corridors (the worst effect is the expansion of dispersed suburban
buildings).
• The spread of large-scale, monocultural agricultural crops, resulting in a decrease in biodiversity
and the elimination of many ecological corridors.
Against this background, the impact of spatial disorder on the natural environment can
be considered in three basic groups of issues: (i) decline in the biologically active surface of
ecosystems and fragmentation of ecological landscape systems; (ii) simplifying the internal structure,
decreasing biodiversity and weakening the stability and resilience of ecosystems and landscapes;
(iii) expansion of cities, development of urbanization processes and creation of various ecological
barriers. These processes are identified in Poland in particular through changes in land cover [65],
as well as indicator analyses, such as entropy measures and landscape metrics, etc. [88].
Against the background of the above complex conditions and cause–effect relationships in
human–environment relations, estimating the costs of spatial disorder is quite difficult. This is due
to the fact that it is not known exactly what part of the natural losses is the result of spatial chaos,
and which is of human action in an environment that does not cause this chaos, i.e., creating a kind of
“surplus”. There is no such human activity that would not be directly or at least indirectly related to
the functioning of ecosystems [89]. For example, the location of the settlement along the coast of the
water reservoir is associated not only with direct water pollution, but also with the evolution of use,
bringing successive stages of anthropopressure, related to the development of urbanization and the
size expansion of the settlement unit, etc. The final environmental cost is not always a simple sum of
activity throughout the entire development history of the coast of this basin; throughout the entire
period of urbanization, environmental protection activities are carried out on a smaller or larger scale.
Costs resulting from air pollution are recognized relatively well [90]. They are caused by human
activity and contribute to various diseases and, as a consequence, deaths. Higher emissions result
directly from dispersed buildings (increased transport needs and exhaust emissions and low emissions
from domestic coal and wood-fired furnaces, etc.). Research on this subject is becoming more frequent.
WHO estimates indicate that air pollution in Poland (one of the strongest in Europe) can cause losses
of up to about EUR 25 billion per year [91]. This is, among others, approximately 19 million businessYou can also read