Data Exchange Processes for the Definition of Climate-Proof Design Strategies for the Adaptation to Heatwaves in the Urban Open Spaces of Dense ...
←
→
Page content transcription
If your browser does not render page correctly, please read the page content below
sustainability

Article
Data Exchange Processes for the Definition of Climate-Proof
Design Strategies for the Adaptation to Heatwaves in the Urban
Open Spaces of Dense Italian Cities
Eduardo Bassolino * , Valeria D’Ambrosio and Alessandro Sgobbo

                                          Dipartimento di Architettura (DiARC), Università degli Studi di Napoli Federico II, Via Toledo 402,
                                          80134 Naples, Italy; vdambros@unina.it (V.D.); alessandro.sgobbo@unina.it (A.S.)
                                          * Correspondence: eduardo.bassolino@unina.it

                                          Abstract: The growing awareness of the danger of extreme weather phenomena highlights the inade-
                                          quacy of current cities and the increase in their level of vulnerability concerning the impacts resulting
                                          from climate change. The theme of design to combat climate impacts requires the development of
                                          knowledge and process models capable of managing the complexity of the information necessary to
                                          direct a climate-proof transformation of the urban systems. The research made it possible to develop
                                          a methodology based on the exchange of data between GIS-based ICT tools and for parametric
                                          design, to analyze the microclimatic and performance behavior of recurrent types of urban open
                                          spaces in Italian cities, characterized by different climatic conditions, through generic urban patterns,
                                          homogeneous in terms of building density and morphology. The goal achieved was to define the
                                          critical aspects of urban open spaces with the performance offered in response to the phenomenon

                                   of heatwaves, to verify and measure the performance effectiveness of climate-proof intervention
Citation: Bassolino, E.; D’Ambrosio,
                                          categories, to transfer these results in the form of database, hazard maps, and potential levels of
V.; Sgobbo, A. Data Exchange              adaptation, and to define guidelines for the climate-oriented project. The transfer of the project data
Processes for the Definition of           took place through a decision support webGIS platform (SDSS).
Climate-Proof Design Strategies for
the Adaptation to Heatwaves in the        Keywords: urban density; urban comfort parametric design; data exchange; data analysis; climate
Urban Open Spaces of Dense Italian        change; heatwaves
Cities. Sustainability 2021, 13, 5694.
https://doi.org/10.3390/su13105694

Academic Editor: Nyuk Hien Wong           1. Introduction
                                                The current climate emergency poses new major challenges for cities and large
Received: 28 March 2021
                                          metropolises, which require the development of strategies capable of reducing climate
Accepted: 14 May 2021
Published: 19 May 2021
                                          impacts and improving the adaptability of the urban system. The progressive increase
                                          in global warming causes extreme climatic events that have negative repercussions on
Publisher’s Note: MDPI stays neutral
                                          communities [1,2]. In recent decades, the increase of the frequency and intensity of climatic
with regard to jurisdictional claims in
                                          phenomena, which have serious repercussions in terms of impacts on the built environ-
published maps and institutional affil-
                                          ment, requires the tools to support decision-making processes for the urban project aimed
iations.                                  at climate adaptation were directed toward innovative and appropriate methodologies.
                                          Heatwaves have significant implications for humans and the environment. If we add to
                                          this the increase in their frequency, duration, and intensity, in the near future as foreseen by
                                          the IPCC—Intergovernmental Panel on Climate Change [3–5], it is clear that appropriate
                                          methodologies need to be developed to support the design of built urban space [6,7].
Copyright: © 2021 by the authors.
Licensee MDPI, Basel, Switzerland.
                                                In this context, a consideration of the relationship between urban density, extreme
This article is an open access article
                                          climatic impacts, and the environmental interaction of built urban systems is at least
distributed under the terms and
                                          necessary both downstream of what is occurring in terms of environmental alterations due
conditions of the Creative Commons        to climate impacts, and to introduce the reasons that led to the definition of this study.
Attribution (CC BY) license (https://
creativecommons.org/licenses/by/
4.0/).

Sustainability 2021, 13, 5694. https://doi.org/10.3390/su13105694                                       https://www.mdpi.com/journal/sustainability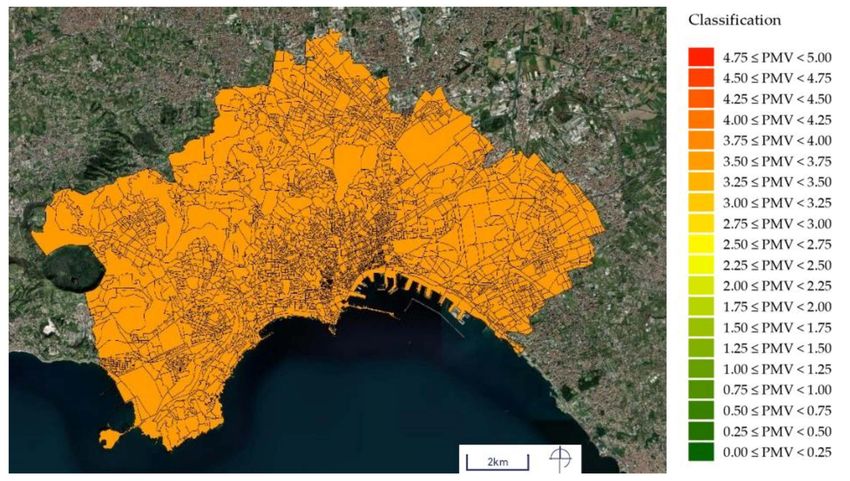
Sustainability 2021, 13, 5694                                                                                              2 of 31

                                1.1. Plan the Dense City
                                      The natural aptitude to densification of the areas already anthropized, which had
                                distinguished urban development over the centuries, in the industrial city has not only
                                confronted the health and hygiene problems, but also social problems that accompany the
                                high concentration of inhabitants. While an attempt is being made to remedy this by imple-
                                menting plant networks capable of improving the management of urban metabolism [8],
                                ideal models of return to a balanced, symbiotic relationship between anthropogenic space
                                and nature [9], are beginning to establish themselves. Criticism of high density, however,
                                finds a brake on the need for contiguity between production, services and housing, so
                                much so that the proposed alternative models of cities are accompanied by utopian social,
                                economic, and productive transformations [10]. In the post-war period, urban growth took
                                on the meaning of horizontal expansion. This significance is supported by the illusion of
                                the unlimited space available and by technological innovation, which, with the spread
                                of motorized vehicles, appears capable of reducing the need for centrality but also of
                                overcoming the limits imposed by nature on the settlement capacity of the territory [11].
                                However, this approach has begun to clash with the finiteness of the biosphere, so that
                                several scholars [12] have affirmed the concept of ecological economy and sustainable
                                growth as alternatives to unlimited growth.
                                      The recognition of the anthropogenic origin of climate change and the increased sensi-
                                tivity to land, urge the scientific community to reconsider urban density positively [13,14].
                                The shape and organization of cities are no strangers to the causes and intensities of the
                                harmful consequences of very energetic societies and wasteful of natural resources such as
                                that of the soil, to focus attention on an object of urban discipline. To correct these flaws, we
                                have long been oriented toward multifunctionality [15] and densification, both objectives
                                that reduce mobility and consumption of rare resources [16–18].
                                      Densification should be understood not only as a criterion for the design of urban
                                expansions but also as a reference point for the regeneration of urbanized areas or to be
                                converted into uses. Moreover, it cannot be followed as the only and absolute objective,
                                but rather it must be framed in the cognitive and normative heritage of models of cities
                                that are environmentally healthy and balanced as well as socially fair. This means that its
                                application must resolve dilemmas and provide balances such as that with public space,
                                standards, and housing quality.
                                      Density, although conjugated in different ways in different countries, is a fundamental
                                global parameter [19]. Studies and discussions are therefore available with different
                                emphasis, together with the need to reach shared conclusions to be able to reform the
                                existing parameters that take on normal value. To this end, it is essential to clarify and
                                verify all the criteria from which the proposed density thresholds derive with the relevant
                                ideas of cities that underlie them, as well as the indicators necessary to define their objective
                                value within the identified thresholds. From this point of view, the purely technical data of
                                the density index come into terms with all the complexity of factors that affect the urban
                                form and which are the mirror of the current phase of the evolution of human settlements.
                                      In the disciplinary debate, the topic attracts the attention of numerous scholars who
                                identify it as an opportunity to respond effectively to the need for environmental sus-
                                tainability by mixing the objectives of efficiency of services and economic and social
                                development [20–22]. The concentration of demand for services supports economies of
                                scale that ensure their accessibility to large portions of the population; compact urbaniza-
                                tion enhances the ecological effectiveness of remote climate control infrastructures which,
                                being able to count on the exploitation of parasitic resources (co-trigeneration, recovery of
                                production heat, balance of competing needs), significantly reduce climate-changing inputs;
                                the contiguity with local public transport nodes increases its operational efficiency and,
                                consequently, the quality of the service offered, encouraging collective mobility; intensive
                                land use supports the substantial investment needed for urban regeneration.
                                      Density, however, is also critical. In public opinion, the intensive exploitation of
                                the land for building purposes evokes speculation and concreting. The suggestion is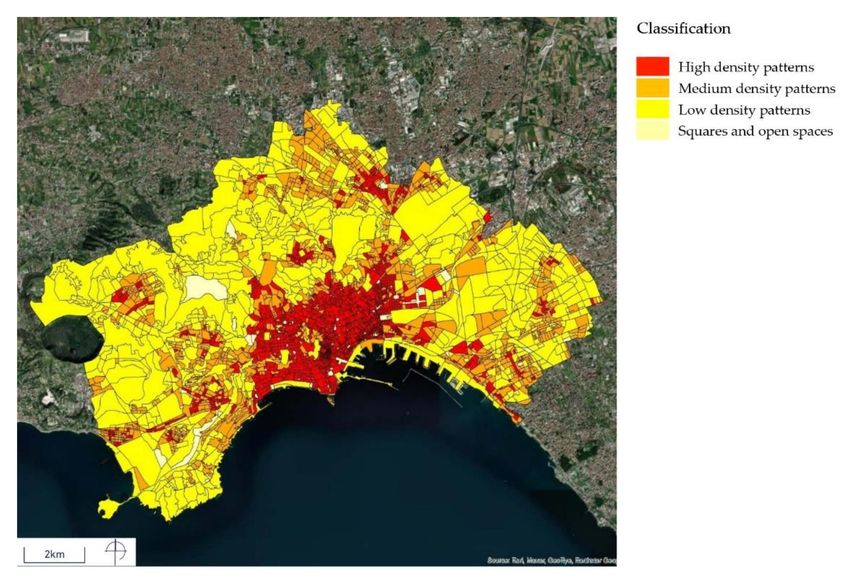
Sustainability 2021, 13, 5694                                                                                          3 of 31

                                reflected in the political attitude where, in terms of consensus, it is considered more
                                convenient to hinder the vertical growth of settlements. The dense city moves away
                                from the traditional planning of the territory; it is a model synthetically judged “not on a
                                human level” that suggests exclusion and social unrest. In the disciplinary field, the main
                                criticisms of density/densification concern the unsustainability of the ecological footprint
                                generated [23], the incompatibility of the vertically developed model with the needs of
                                identity and landscape protection, and the assumed inherent lack of resilience.

                                1.2. Environmental Design for the Control of Adaptation Processes in Dense Cities
                                     The theme of urban density must be framed by considering some areas of in-depth
                                study among which emerges that of the relationship between environmental design and
                                the density of the built-in context of new climate regimes. The control of the relationships
                                between building organisms, open spaces, and the environment, starting from the concepts
                                of compatibility and ecosystem integration of interventions, introduces qualitative and
                                cultural innovations in the design. The environmental issue linked to new climate regimes
                                becomes no longer amendable and finds in density a mode of approach in determining the
                                causes and possible solutions for the reduction of negative impacts due to climate change,
                                in an ecosystem view of the problem [24–27].
                                     Downstream of this, the relationship between urban density and the principles that
                                guide the environmental design emerges robustly, which can be recalled as a factor in
                                solving numerous urban problems related to the field of environmental and climatic
                                impacts, from the lack of efficiency in the management of resources within highly dense
                                urban contexts. Environmental design can make a specific contribution to regenerative
                                urban projects, defining design and meta-design scenarios in which environmental issues
                                are decisive in decision-making choices. The components of environmental design interact
                                starting from the conceptual approach phase of the urban project, helping to direct its
                                regenerative criteria and contributing to the definition of urban strategies, purposes and
                                configurations aimed at establishing clear principles of intervention, this also through the
                                systemization of scientific knowledge, policies and operational practices to inform the
                                design for its adequate development and implementation in a climate-proof perspective.
                                     Climate adaptation and ecological change are today the cross-cutting themes of many
                                of the objectives set out in the United Nations 2030 Agenda for Sustainable Development,
                                outline actions to define a key strategy for the fight to climate change and environmental
                                sustainability, as set out in Goal 13 [28]. Besides, it is one of the priority objectives of
                                the main European plans and programmes for the sustainable development of territories,
                                including the Green Deal [29] and the European Biodiversity Strategy [30], to promote
                                actions concerning the reduction of emissions of climate-altering agents, the fight against
                                the impacts of climate change, the reduction of degradation and environmental pollution
                                phenomena, the improvement of well-being and health conditions, social cohesion and
                                at the same time promoting the integration of adaptation criteria into local and sectoral
                                planning processes and instruments.
                                     In this context, the definition of design actions at the local scale becomes relevant,
                                which can lead to a significant update of technical policies, also through the search for
                                new models and methods of global sharing (web-platform) [31] for the development of
                                climate-proof oriented urban design projects, to bring together local authorities, the world
                                of research, designers, and industrial partners through an interdisciplinary approach that
                                can integrate knowledge, methods, and tools from different disciplinary fields.
                                     In the literature, some of the exemplary cases related to the definition of processes
                                and models for the evaluation of adaptation to climatic alteration phenomena on a local
                                scale, defined through GIS-based methodologies (Geographic information system), focus
                                on the description of vulnerability and impact models related to actual climatic conditions
                                and future scenarios, delegating the contribution of climate-adaptive design aspects to the
                                definition of frameworks of canonical solutions or guidelines for climate adaptation [32–34],
                                but also social involvement and gamification operations [35,36].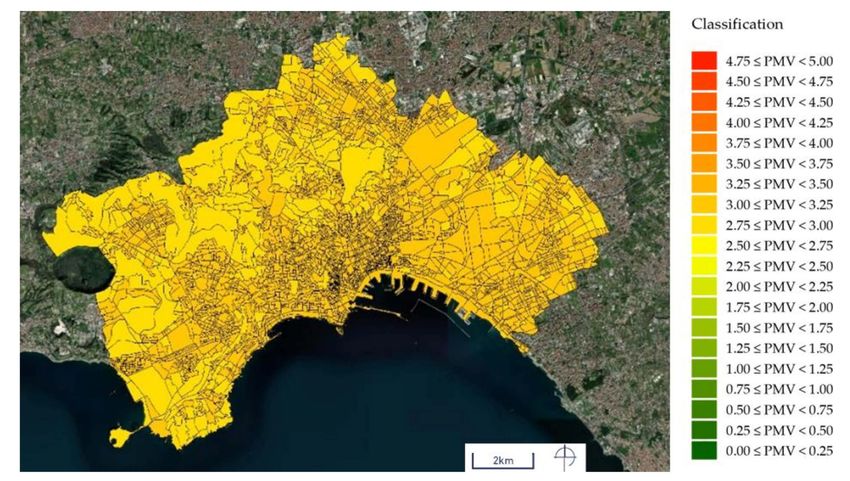
Sustainability 2021, 13, 5694                                                                                              4 of 31

                                      While there is a need to investigate the altering potential of local climate change action,
                                the requirement emerges to define actions and solutions able to counteract its effects. With
                                the introduction of simulation processes implemented with ICT (Information and Commu-
                                nication Technologies) environmental investigation tools [37,38], capable of operating on a
                                neighborhood and urban block scale, it is possible to define the potential of transformation
                                actions in response to phenomena related to climate change, transferring and verifying
                                ideal models of climate-adaptive urban transformation [39], also through recursive testing
                                operations. These data exchanges, now simplified by dedicated ICT tools, have introduced
                                approaches and methodologies able of integrating data with different levels of definition
                                and information and, at the same time, performing specialized simulation, obtainable only
                                through dedicated software and tools [40,41].
                                      The paper proposes the development of one of the results obtained from the research
                                project called “PLANNER-Piattaforma per LA GestioNe dei rischi Naturali in ambiEnti
                                uRbanizzati” which sees the participation of ETT spa (lead subject), Genegis GI, STRESS
                                S.c.a.r.l.-Sviluppo Tecnologie e Ricerca per l’Edilizia Sismicamente Sicura ed ecosostenibile.
                                The research project, which has been proposed to advance knowledge on climate adaptation
                                in the urban environment and digitization of processes and information for the urban
                                design, has been divided into four products of the research and has seen the realization of
                                the goal of creating a decision-support tool that allows to map the level of vulnerability
                                concerning environmental risks (seismic hazard and heatwaves) and provide a complete kit
                                of interoperable tools, technologies, and methodologies for evaluation, risk management,
                                and mitigation through measures to increase urban resilience.
                                      In this context, among the targets and outputs of PLANNER, the defined aim is to
                                be able to evaluate the climatic resilience of the physical system of urban aggregates, pro-
                                ducing results starting from certified and open access data to make available, accessible
                                and replicable the tools, analyses, and scenario assessments on the entire national territory.
                                The development of a model for assessing climate resilience scenarios started from the
                                implementation of a vulnerability and climate impact assessment model already present
                                in the literature [1] which involved the development of a database of technical and de-
                                sign solutions multiscalars of climate adaptation and mitigation of CO2 emissions. The
                                design of the model for assessing climate resilience scenarios concerned, in particular, the
                                physical subsystem of the urban system—consisting of residential buildings and open
                                spaces—intended as minimum units affected by the interventions in the processes of plan-
                                ning, regeneration, and urban redevelopment, oriented to provide effective responses to
                                climatic stress conditions. The model is designed with the aim of producing knowledge
                                frameworks and resilience scenarios starting from open data available throughout the
                                country. For this reason, the ISTAT (Istituto nazionale di statistica) census area [42] was
                                identified as the minimum atomic space element at the base of the process. This process,
                                which bases its development starting from the generation of vulnerability maps of urban
                                physical subsystems (building subsystem and open spaces subsystem), hazard and impact
                                scenario maps, has made it possible to obtain a process for assessing resilience levels by
                                classifying census areas by recurrent building types and urban patterns to select optimal
                                impact reduction actions and increase the adaptability and mitigation capacity chosen from
                                those prepared and codified in a database of climate-proof technical alternatives (Figure 1).
                                      The objective is the development of a recursive and replicable process at a national
                                level that will allow obtaining, starting from recalculation operations, both maps relating to
                                new impact scenarios outcome of the application of technical alternatives, and adaptation
                                cards capable of expressing levels of indoor and outdoor comfort achievable, as well as
                                maps on mitigation capacity expressed with CO2 emission levels and concentrations. The
                                process, which allows to automatically select, based on the building type and the recurring
                                urban pattern, the optimal climate-proof technical solutions to be applied to residential
                                buildings and open spaces included within the census section, is an effective tool of meta-
                                design capable of carrying out an initial assessment on the adequacy of adaptation and
                                climate mitigation interventions in the different climatic contexts within the Italian national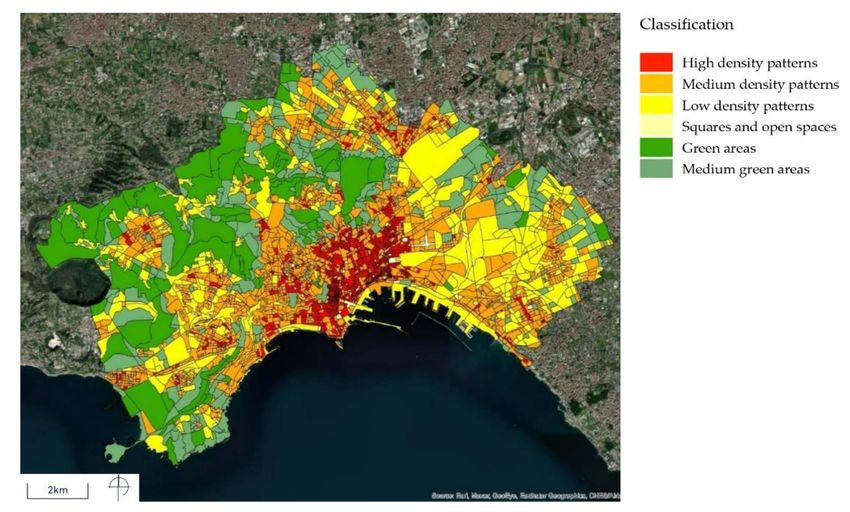
Sustainability 2021, 13, 5694                                                                                             5 of 31

                                territory. At the same time, the oriented meta-design process aims to develop processes for
                                the evaluation of the actual feasibility, replicability, and effectiveness in the application of
                                climate-proof intervention categories to the urban scale.

                                     Figure 1. Heatwave impact scenario assessment model.

                                2. Materials and Methods
                                     As already enlightened above, this article deals with the construction of the methodol-
                                ogy with which the evaluation model of the capacity of adaptation of urban open spaces to
                                the environmental and climatic stimuli due to the impact of the phenomenon of heatwaves
                                was developed, as a consequence of climate change on Italian cities, with an applied and
                                experimental focus on the test area represented by the city of Naples.

                                2.1. Summary of the Methodological Approach
                                     Through PLANNER, a workflow (Figure 2) was obtained through the digitization of
                                information and data processing based on the data exchange operations between ITC as
                                GIS-based tools and parametric design software in association with visual programming
                                languages (VPL), such as Rhinoceros and Grasshopper, as well as dedicated tools and plug-ins
                                capable of operating complex simulation processes (ENVI-met, Ladybug, Honeybee, and
                                Dragonfly) [43,44], to obtain simulations that could return performance verification data of
                                different types of open spaces and output data on process scenarios of urban resilience.
                                     The will to make replicable the simulation and analysis processes for the definition of
                                the microclimatic and performance behavior of open spaces to be able to identify critical
                                aspects and to verify the effectiveness of the application of climate-proof intervention
                                categories is based on the construction of models of recurrent urban patterns [45,46],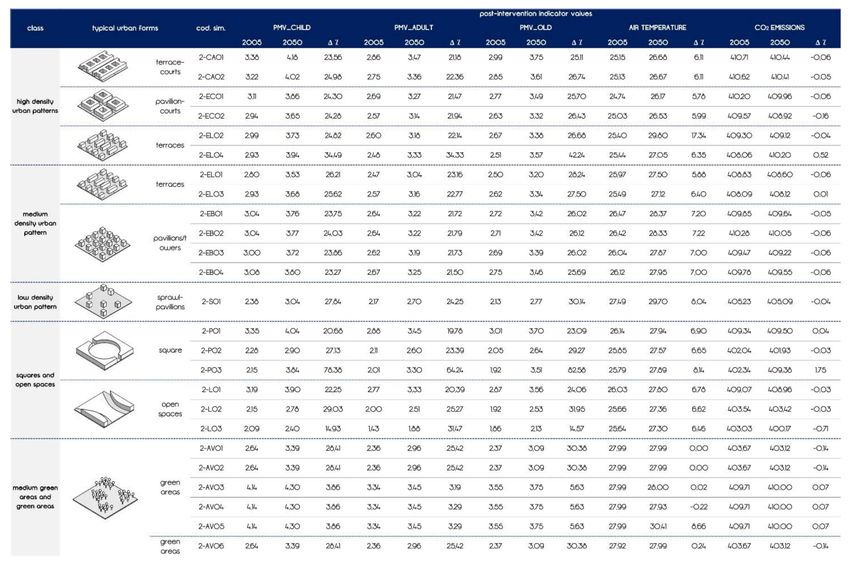
Sustainability 2021, 13, 5694                                                                                                    6 of 31

                                  obtained by dimensional parameters found within the urban morphology of Italian cities
                                  such as the ratio of built to the unbuilt area, the average height of buildings, the sky
                                  view factor [47–49], the hillshade [50,51]. This operation made it possible to identify
                                  different types of open spaces classified typologically with building aggregation such
                                  as terrace-courts, pavilion-courts, terraces, pavilion/towers, sprawl-pavilion, as well as
                                  squares, open spaces, and green areas. The further classification was carried out through
                                  the investigation of the built density (mc/sqm) and the territorial coverage ratio, which
                                  led to the classification of urban patterns by high, medium, and low density [52,53].
                                  Concerning the squares and the open spaces, the perimeter percentage of the building and
                                  the height of the surrounding buildings were considered as parameters of classification and
                                  identification. At last, the green areas were first classified according to the percentage of tree
                                  cover and the typology (agricultural green, uncultivated green, urban green, and wooded
                                  areas) [54,55], and then to be included in macro-categories according to the different types
                                  of green areas (medium green areas and green areas).

      Figure 2. Synthesis of the developed methodological approach to evaluate the climatic resilience of the open spaces physical
      subsystem due to rising urban temperatures.

                                  2.2. Measurement of Microclimatic and Performance Behavior of Typical Open Spaces
                                        The definition of generic morphologically homogeneous urban patterns allows in
                                  this context to make a simplified and expedited measurement of the microclimatic and
                                  performance behavior of different types of open spaces that make up cities, also with the
                                  different climatic and environmental stimuli characteristic of homogeneous climatic areas
                                  of Italy. For this purpose, it emerged the need to make the retrieval, selection, and use of
                                  climate information in different national climatic contexts, using as basic elements the data
                                  on the climatic conditions of Italian cities.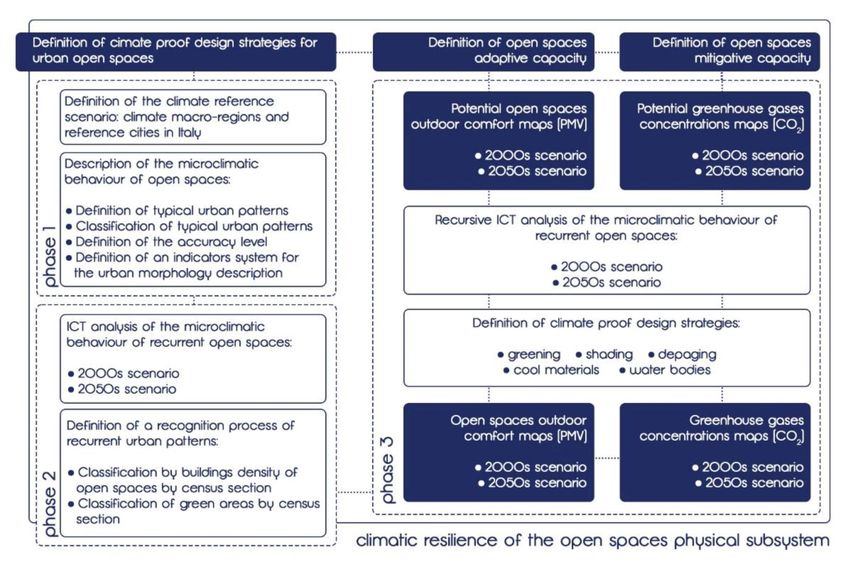
Sustainability 2021, 13, 5694                                                                                            7 of 31

                                      The National Climate Change Adaptation Plan (PNACC) provides a “Climate Zona-
                                tion over the 1981–2010 reference period,” which identifies six “homogeneous climate
                                macro-regions” for which the observed data report similar climatic conditions over the
                                last thirty years (1981–2010), and elaborated through the cluster analysis methodology
                                applied to a set of climate indicators [56,57]. In this sense, the classification of climatic
                                macro-regions has been adopted, to divide the geographical areas and Italian cities. Within
                                each climate macroregion, a reference city has been identified to set climate data to carry
                                out energy-environmental simulations. The reference cities identified are:
                                •    Turin for the Climate Macro-region 1 “PREALPS AND NORTHERN APENNINES;”
                                •    Naples, for the Climate Macro-region 2 “PADANA PLAIN, HIGH ADRIATIC SIDE
                                     AND COASTAL AREAS OF SOUTHERN CENTRAL OF ITALY;”
                                •    Potenza, for the Climate Macro-region 3 “SOUTHERN CENTER APENNINES;”
                                •    Bolzano, for the Climate Macro-region 4 “ALPINE AREA;”
                                •    Trieste for the Climate Macro-region 5 “CENTRAL-NORTHERN ITALY;”
                                •    Palermo for the Climate Macro-region 6 “INSULAR AREAS AND EXTREME SOUTH
                                     OF ITALY.”
                                     Processes of simulation of the microclimatic behavior of recurrent urban patterns, in
                                the absence and with the application of climate-proof intervention categories identified
                                as greening, de-paving, shading, water bodies, cool materials, have been conducted for
                                each of the six cities and the types of recurring identified open spaces. To simulate current
                                climatic conditions, reference has been made to EPW climate data [58], which refer to the
                                thirty years 1990–2019 (2000s), while to obtain the simulation of climatic conditions in a
                                medium-term climate scenario in the thirty years 2040–2069 (2050s), data obtained through
                                morphing operations of the same climate data [59–61].

                                2.3. Description of the Microclimatic Behaviour of Open Spaces
                                     The methodological approach developed for the definition of urban patterns of recur-
                                rent open spaces was based on a data exchange process between GIS-based tools (Figure 3),
                                parametric tools for the simulation of microclimatic behavior and the selection of indicators
                                useful for reading and classifying the heterogeneous urban morphologies within the differ-
                                ent urban patterns that characterize Italian cities. The articulation of the methodological
                                process has been structured according to a sequence of phases:
                                •    Identification of generic urban patterns from scientific literature;
                                •    Generation of an abacus of typical urban patterns capable of describing the morphol-
                                     ogy of urban patterns of Italian cities;
                                •    Development of a classification system based on the physical-dimensional, quantita-
                                     tive and qualitative characteristics of open spaces;
                                •    Selection of a system of indicators capable of describing and parameterizing the
                                     complexity of the urban morphology of the reference cities;
                                •    Comparison of environmental and microclimatic performance between real urban
                                     patterns of Italian cities and urban patterns typical through testing and verification
                                     operations through data exchange between GIS-based and parametric design tools;
                                •    Process of verifying the accuracy of extrapolated data according to the system of real
                                     and typical urban patterns.
                                     The aim of the process is both to obtain the analysis of the performance behavior of
                                recurrent and peculiar types of open spaces, whose output data can be associated with real
                                urban patterns and to define aspects of environmental criticality and the possibility to verify
                                afterwards the efficiency of the application of technical solutions and climate-adaptive
                                design actions categories.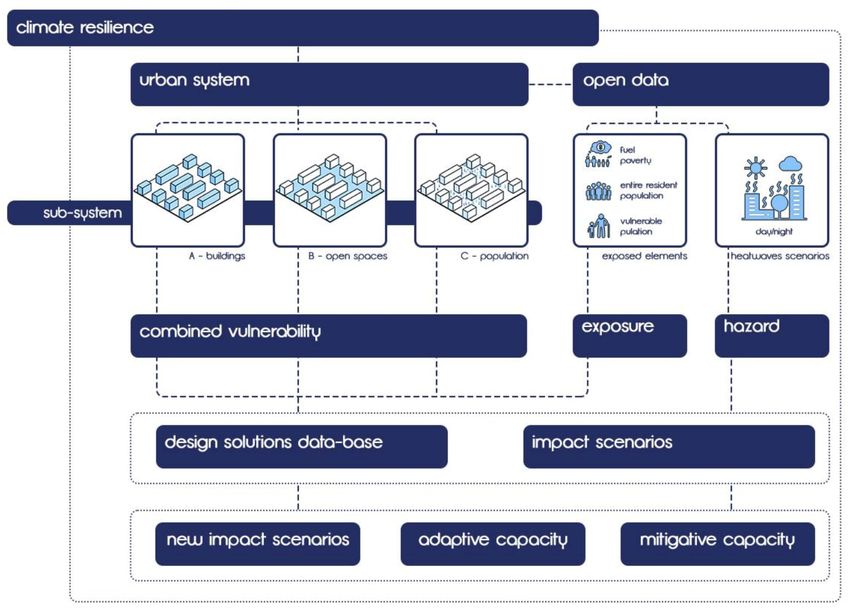
Sustainability 2021, 13, 5694                                                                                                8 of 31

      Figure 3. ICT simulation and analysis workflow for the definition of the microclimatic and performance behavior of urban
      open spaces.

                                 2.3.1. Typical Urban Patterns
                                       Based on the existing scientific literature on the abstraction of urban patterns, refer-
                                 ence was made to the studies carried out by Carlo Ratti [46], which follows the research
                                 conducted in the 1960s by Leslie Martin, Lionel March and other scholars [45], who had
                                 analyzed the question of urban pattern in relationship with land use. Martin and March
                                 had identified, analyzed, and compared different archetypes of urban patterns, and then
                                 were taken up by Ratti, who reassessed them in environmental terms, addressing their
                                 relationship with the climate, analyzing these generic urban patterns through raster image
                                 processing techniques and a series of indicators for the description of urban geometry,
                                 such as the sky view factor or shadow density [46], highlighting the relationship between
                                 different urban configurations and environmental behaviors.
                                       The choice to adopt models of recurrent urban patterns as descriptors of the urban
                                 morphology of the Italian cities considered is finalized to limit the complexity of urban
                                 patterns in the reality and to be able to analyze and subsequently compare the environmen-
                                 tal impacts on the different types of geometry and urban morphology among the increase
                                 in urban temperatures and the phenomenon of heatwaves. For this classification, it has
                                 been hypothesized to use urban patterns that consider the archetypes of urban patterns
                                 (Figure 4), to be able to construct geometric models representative of the different urban
                                 morphologies based on dimensional ratios [62,63] typically described and presented within
                                 the chosen representative cities.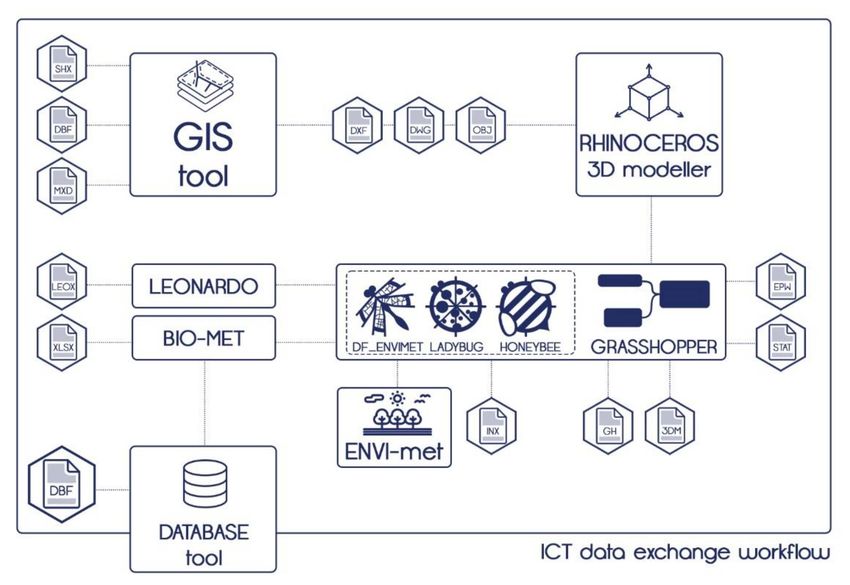
Sustainability 2021, 13, 5694                                                                                                 9 of 31

                                Figure 4. Generic urban patterns: (a) from right to left: pavilions, slabs, terraces, terrace-courts,
                                pavilion-courts and courts. [46]; (b) deduced generic urban patterns for Italian cities [45,46].

                                2.3.2. Classification of Typical Urban Patterns
                                     The definition of urban patterns took place by combining the information inferred
                                from the scientific literature [45,46] and an analysis of the typical dimensional ratios of the
                                urban morphology of Italian cities [64], as well as from phases of interpretative reading,
                                comparison, and testing of recurrent morphological characteristics (Figure 5).
                                     For the definition of urban patterns, a first typological classification of spaces has been
                                carried out:
                                •    Urban patterns;
                                •    Squares and open spaces;
                                •    Green areas.
                                     A subclassification has been defined for each category. Urban patterns are divided
                                according to the different types of aggregation of buildings such as:
                                •    Terrace-courts;
                                •    Pavilion-courts;
                                •    Terraces;
                                •    Pavilion/towers;
                                •    Sprawl-pavilion.
                                     As discriminants for their classification the following were considered:
                                •    The distance between buildings [62,63];
                                •    The buildings height [62,63].
                                     The further classification was carried out through:
                                •    The building density (cum/sqm) [52];
                                •    The territorial coverage ratio [53].
                                     This procedure leads to the definition of a sub-classification:
                                •    High-density patterns;
                                •    Medium-density patterns;
                                •    Low-density patterns.
                                     A different classification was made for the squares and the open spaces, for which the
                                following were taken into account as classification factors: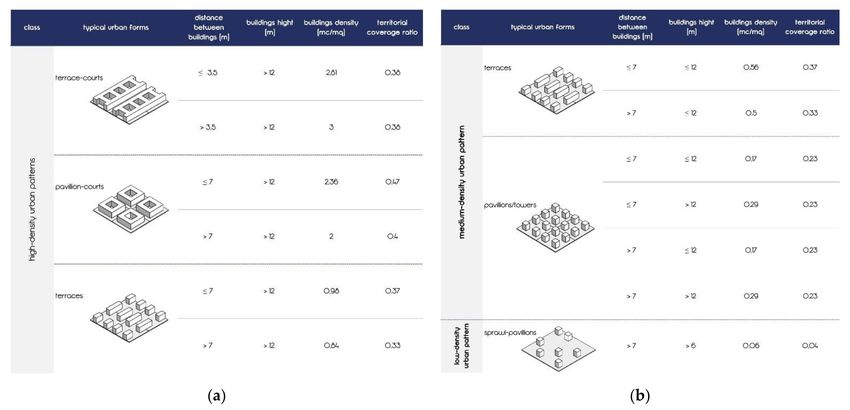
Sustainability 2021, 13, 5694                                                                                              10 of 31

                                 •    The buildings perimeter percentage (BPP);
                                 •    The buildings height (m).
                                      Finally, a classification for green areas was necessarily adopted to highlight the differ-
                                 ent characteristics as eco-systemic value [25,65], with a dual classification. First, these were
                                 classified according to the percentage of tree cover and the type:
                                 •    Agricultural green;
                                 •    Uncultivated green;
                                 •    Urban green;
                                 •    Wooded areas.

      Figure 5. Classification of urban patterns: (a) high-density urban patterns; (b) medium and low-density urban patterns;
      (c) squares and open spaces; (d) medium green areas and green areas.
Sustainability 2021, 13, 5694 11 of 31
Subsequently, a subdivision was made which classified the green areas according to
the tree cover percentage (TCP) into:
• Medium green areas (0 < TCP ≤ 25%; 25% < TCP ≤ 50%; TCP > 50);
• Green areas (TCP ≥ 90%).
The proposed classification considerations denote the importance of correct identifi-
cation of the recurrence characteristics of urban open spaces, suggesting how seemingly
similar areas can have a dissimilar influence on micro-climatic conditions, but also on
urban metabolism, certainly influenced by boundary conditions [66], just as the types of
available solutions in terms of mitigation and adaptation [67–70] may be different.
2.3.3. Definition of an Indicators System for the Urban Morphology Description
The need to verify the accuracy between the different simulation processes has guided
the study toward the definition of operations to compare environmental and microclimatic
performance between real urban patterns of Italian cities and typical urban patterns through
testing and verification operations of data exchange between GIS-based tools and tools for
parametric design. This operation led to the construction of a set of indicators capable of
describing and parameterizing the complexity of the urban morphology of the reference
cities. These indicators were chosen within the GIS processes already used in the earlier
phases of the project for the determination of the climate vulnerability model of the physical
system [1,71,72], such as:
• The relationship between the built-up area and empty spaces;
• The average height of the buildings;
• The sky view factor;
• The hillshade.
A process of comparison, simulation, and data exchange between GIS-based tools and
parametric tools in the Grasshopper environment to obtain homogeneous outputs between
the different ICT tools according to the system of indicators was conducted (Figure 6). In
this way, portions of real patterns of the city of Naples classified based on heterogeneous
characteristics and capable of describing the existing morphological variety (width of
the roadway, the distance between buildings, the average height of buildings, type of
aggregation, presence of open spaces or green areas, etc.,), were associated with generated
recurrent urban patterns, for which the corresponding values of the indicators of urban
morphology chosen were identified. Urban patterns, both real and recurrent, have been
enclosed within a dial sized 100 × 100 m, also to effectively size the models of typical
urban patterns and to easily carry out simulation operations.
Following the selection of morphologically heterogeneous areas, the verification of
accuracy among the outputs of the indicator system in the different ICT environments has
been divided into phases:
• Association of the corresponding generic urban pattern;
• Calculation of data on the classification parameters of urban morphology for real areas
identified through GIS processes;
• Elaboration of a 3D model in a parametric environment corresponding to the real one
starting from the dimensional information contained within the processed GIS model;
• Calculation of indicator values, comparison of indicator data between GIS model and
parametric model, and determination of accuracy;
• Elaboration of a 3D model in a parametric environment based on the model of the cor-
responding generic urban pattern and the parameters of the dimensional parameters
extracted from the GIS model;
• Calculation of indicator values, comparison of indicator data between the paramet-
ric model based on real dimensional characteristics and the parametric model, and
determination of accuracy.Sustainability 2021, 13, 5694 12 of 31
Figure 6. Comparison between the values of descriptive indicators of urban morphology accuracy between the different
input model of data and simulation tools. Test on the urban patterns of the city of Naples.
The 3D models in the parametric environment and the corresponding values of urban
morphology indicators were obtained through the use of LadyBug a Grasshopper’s plug-in,
replicating the calculation processes implemented in the GIS environment, through the
definition of generative algorithms.
In the different operations of comparing the outputs of the indicators obtained for
the different models of urban patterns generated in different software environments, and
with different purposes, a maximum margin of error of 35% was taken into account, which
made it possible to verify the correctness in the generation of generic urban patterns.
2.4. Analysis of the Microclimatic Behavior of Recurrent Open Spaces
For the determination of the ability to adapt to the phenomenon of heatwaves in the
urban environment of urban patterns of recurring open spaces, a process of simulation and
analysis of microclimatic behavior was conducted with ICT tools on the six sample cities
chosen to represent the climatic variation within the Italian territory.
To evaluate the performative response to the extreme summer climatic stresses of
cities open spaces due to climate change and therefore the degree of adaptation, it was
chosen to use both PMV (predicted mean vote) [73] and the air temperature (◦ C) as indexes
to evaluate the feeling of perceived outdoor thermal comfort [74] by users based on the
morphological, environmental, thermal, and physical characteristics of the materials that
make up the urban space.
The simulation process for determining the calculation of thermal comfort within
recurrent urban patterns was carried out both for the current climate scenario and a
forecast medium-term climate scenario (2050s) through EPW climate files [57,75] for the
six representative cities, and the morphing to 2050s of these [59,61], using 15th of July asSustainability 2021, 13, 5694 13 of 31
the simulation day (it is an expression of the average data collected for a heatwave event
on The Italian territory), and extracting the data relating to 12:00 p.m. The assessment of
the satisfaction degree within an open space under heatwave conditions was calculated
both for an individual considered standard (man, height 175 cm, 75 kg, 35 years, clothing
value: 0.70) and for individuals considered representative of the so-called weak bands, an
old person (man, height 165 cm, 65 kg, 75 years, clothing with clothing value: 0.70), and a
child (man, height 141 cm, 30 kg, 8 years, clothing with clothing value: 0.40).
Also, the simulation processes, in addition to the PMV and air temperature (◦ C),
allowed to extrapolate the relative values of greenhouse gas concentrations, expressed in
ppm (particles per million). The latter will allow returning a reading of the potential for
reducing CO2 concentrations that climate adaptation solutions will be able to guarantee in
absolute terms, considering that ENVI-met software is configured with a starting value of
400 ppm [76–79], maintaining this value also for medium-term simulations. In this sense,
the outputs of the potential levels of reduction of CO2 concentrations should be read as
an alteration related only to the increase in temperatures and will allow observing the
absolute increase and/or reduction about the default value of 400 ppm.
The simulation and analysis process was carried out using the ENVI-met 4.4.5 microcli-
matic simulation software, which combines the three-dimensional model of an urban area
with the simulation of the physical behavior of the present elements and determines their
interaction with environmental components. The construction of the three-dimensional
model was carried out through the use of Rhinoceros software and the Grasshopper’s
plug-in, df_envimet [80]. The use of these extension has reduced the time required for the
construction and simulation process of the three-dimensional models associated with the
generic identified urban patterns.
2.5. Definition of a Recognition Process of Recurrent Urban Patterns
A process for the recognition of recurrent urban patterns of urban open spaces was
developed in a GIS environment as a result of the definition of the morphological char-
acteristics of recurrent urban patterns and the analysis of environmental performance in
climatic conditions. The experimentation of this procedure was tested on the sample city
of Naples and represented the starting point for the next generation of maps related to
the adaptability of urban open spaces considering as a benchmark the perceived outdoor
comfort (PMV).
The first operation consisted of the recognition of urban morphology and the auto-
mated association of recurrent urban patterns. This operation was carried out by calculating
the density parameter of the built environment, calculated as a built volume (in cubic me-
ters) on the unbuilt area (in square meters), obtained from the thematic classifications of
the built and open space contained in the topographic database (DBT) and, subsequently,
associating the corresponding value obtained by the classification of recurring urban pat-
terns, calculated through the area and height values of the buildings present in the digital
surface model (DSM) and the digital terrain model (DTM) of the city of Naples.
To obtain the density parameter of the built, starting from the atomic unit of the
census section, the parameters of the building average height and the value of the covered
area enclosed within the different polygons of buildings were calculated, as well as the
percentage values of the surface treated to green were defined.
From the product of the area and height of the buildings was obtained the calculation
of the attribute “Volume” of the buildings.
Subsequently, through an operation of “intersect,” it was possible to intersect the
polygons of the buildings with the polygons of the census sections and, following a
summarize operation, it was possible to associate the average value of the volume with the
census sections. Finally, knowing the volume and surface area of the census section, the
density of the building (D) was calculated, expressed as the ratio of the building’s volume
(cum), to the extension (sqm) of the census section.Sustainability 2021, 13, 5694 14 of 31
The data on the density of built by census section have been sorted according to the
thematic classification given in Table 1.
Table 1. Classification by density of buildings by census section.
Classification Built Density
High-density patterns D ≥ 17 cum/sqm
Medium density patterns 7 ≤ D < 17 cum/mq
Low-density patterns D < 7 cum/mq
Square and open spaces D = 0 cum/sqm
The map (Figure 7) shows that the classification made only by density cannot be
exhaustive of the association of census sections with urban patterns, as it is not able
to consider the green areas. It was necessary to supply the classification with a sub-
classification taking into account the percentage of land use by the elements constituting
the census section.
Figure 7. Map of the building density by census section (cum/sqm).
The first sub-classification was carried out to identify the census sections with a
prevalence of green-treated areas. For this purpose, a “training set” operation was carried
out by a testing phase on a group of sections whose type of surface treatment and building
density are known, through which it was possible to define the classification of “green
areas” for those census sections that had an area occupied for at least 80% by vegetation
(trees, meadows, uncultivated greenery, etc.,), while those census sections whose area was
55% to 80% were classified as “medium green areas.”
A further sub-classification concerned areas with a density greater than 17 cum/sqm,
which had very tall buildings. Analyzing an area known with buildings of above-normal
height, those census sections were defined as census sections belonging to the “medium
dense fabric,” first classified as very dense fabric, the soil of which is however occupied
only up to 55% by the surfaces of buildings.
Besides, a sub-classification of the percentage value of green surface within the census
section obtained through the intersection with the green areas layer within the topographi-
cal database (Figures 8 and 9) has been integrated into this classification.Sustainability 2021, 13, 5694 15 of 31
Figure 8. Map of building density and green areas by census section (cum/sqm).
Figure 9. Percentages of building density and green areas for census sections of open spaces.
The data obtained show how, through the generation of classification processes fo-
cused on the building density that includes the presence and prevalence of areas treated
as green, it is possible to identify the type of urban patterns prevalent within clusters of
information represented by the census sections and, only later, to be able to associate with
it the data obtained from the processes of simulation of the environmental and microcli-
matic behavior of open spaces, to obtain maps on the adaptability and mitigation of urban
patterns in cities.
3. Environmental Performances of Urban Open Spaces
The process of recognizing and associating recurrent urban patterns within existing
urban patterns has made it possible to identify the type of morphologically homogeneous
characteristics of open spaces. This made it possible to identify, through subsequent work
of analysis of environmental performance, their performance behavior in warmer climatic
conditions. The development of microclimatic simulations for each of the types of recurrent
urban patterns identified for the six sample cities and in the two climate scenarios, 2000s
and 2050s, provided data on environmental performance both for the urban patterns
considered and for the types of open spaces they determine.
In particular, regarding the case study of the city of Naples, environmental analyses
have shown for each of the generic urban patterns identified an overall situation of discom-
fort, read through the outputs of the PMV and air temperature index (◦ C), both for an adult
and for vulnerable individuals (old people and children). The recorded values always fall
under the conditions of “hot” or “very hot” depending on the climatic scenario (Table 2).Sustainability 2021, 13, 5694 16 of 31
Table 2. Correspondence between the PMV index and thermal sensation.
PMV Index Thermal Sensation
0 Neutral
+1 Slightly warm
+2 Warm
+3 Hot
+4 Very Hot
>4 Extremely hot
Similar results have been recorded for all other climatic macro-regions, where the
discomfort condition stands on a widespread condition of “hot” or “very hot,” with more
favorable conditions in the Alpine Area, where there is a feeling of “moderate heat,” and
in Northern Central Italy, where the feeling is only “warm.” Values of “extremely hot”
were recorded for the Insular Area and Extreme South-Italy. In all climatic macro-regions,
there is an aggravation of the feeling of discomfort when reading the results obtained for
the forecast and medium-term scenario. Data comparison is shown for the case study of
Naples (Table 3).
Table 3. Averages of PMV values, air temperatures and CO2 concentrations (ppm) by urban patterns and category of user
groups and climate conditions, 2000s and 2050s of the city of Naples.
PMV PMV PMV PMV PMV PMV Air Air CO2 CO2
Classification Urban Patterns Child Child Adult Adult Old p. Old p. Temp. Temp. Conc. Conc.
2000s 2050s 2000s 2050s 2000s 2050s 2000s 2050s 2000s 2050s
Terrace-courts 3.49 4.43 2.93 3.66 3.09 3.98 25.41 ◦ C 27.18 ◦ C 410.86 411.74
High-density
Pavillion- ◦C ◦C
pattern 3.57 4.22 3.02 3.53 3.19 3.81 25.29 26.76 410.97 410.77
courts
Terraces 3.62 4.28 3.04 3.56 3.22 3.86 25.75 ◦C 27.34 ◦C 410.98 410.77
Medium Terraces 3.71 4.39 3.09 3.63 3.29 3.94 26.14 ◦C 27.72 ◦C 411.03 410.87
density Pavillion/ ◦C ◦C
pattern 3.82 4.48 3.18 3.72 3.40 4.06 26.53 28.33 410.86 410.91
towers
Low-density Sprawl-
3.55 4.26 3.02 3.60 3.19 3.90 27.87 ◦ C 30.13 ◦ C 409.99 409.93
pattern pavillions
Squares and Squares 3.59 4.20 3.07 3.55 3.25 3.83 26.24 ◦ C 28.01 ◦ C 410.75 410.61
open spaces Open spaces 3.69 4.33 3.13 3.64 3.33 3.94 26.23 ◦ C 27.97 ◦ C 410.97 410.83
Medium and Green areas 4.14 5.02 3.34 4.04 3.62 4.49 28.02 ◦ C 30.48 ◦ C 409.71 410.00
greenareas Green areas 2.64 3.39 2.36 2.96 2.37 3.09 27.99 ◦ C 27.99 ◦ C 403.67 403.12
Based on the results obtained, it can be seen that users of Italian cities are subjected to
high levels of vulnerability because, about heatwaves, microclimatic phenomena originate
with effects both on the people’s health and on the use of open spaces, whether they are
public or private since they are configured as spaces within the conditions that make them
livable are denied.
The simulation process carried out for recurrent urban patterns, which saw the pro-
cessing of more than 300 simulations, allowed to understand what was the corresponding
performance behavior in the current and the forecast medium-term scenario in the different
climatic conditions of the Italian territory, in response to the phenomenon of heatwaves.
Through a process of data exchange of the results obtained from the parametric simulation
processes, it was possible to generate, on the sample city of Naples, thematic maps related
to the ability to adapt the physical subsystem of urban open spaces considering as a refer-
ence parameter the perceived comfort index (PMV), to identify the possible climate-proof
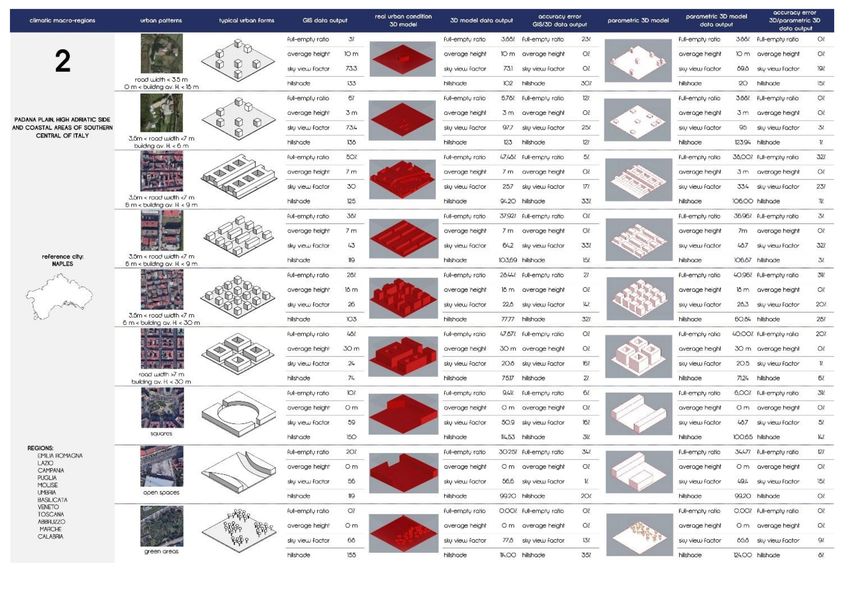
intervention actions for the increase of urban resilience (Figures 10 and 11).Sustainability 2021, 13, 5694 17 of 31
Figure 10. “Outdoor comfort” map of the city of Naples (2000s).
Figure 11. “Mid-term outdoor comfort” map of the city of Naples (2050s).
4. Climate Proof Design Strategies for Urban Open Spaces
Based on the obtained results from the simulation of environmental and microclimatic
behavior of recurrent urban patterns in heatwave conditions, which have focused on the
high levels of vulnerability to which users in the city are subjected by the extraction of the
corresponding data of PMV, air temperature (◦ C), and concentrations of CO2 (ppm), it can
be seen that within the open spaces of Italian cities, although traced back to a type, can be
created microclimatic conditions capable of influencing not only the use of open spaces but
also ensuring that negative effects may occur for the health of the population.
4.1. Climate-Proof Intervention Categories for Open Space
To counter the rise in temperatures and the phenomenon of urban heatwaves, and at
the same time to foreshadow possible scenarios of adaptation and climate mitigation for
Italian cities, five categories of climate-proof interventions have been identified, that collect
technical solutions deduced from similar experiences at the national and international
level. These include the Urban Adaptation Support Tool [81], developed as part of the
European Climate Adaptation Platform Climate-Adapt [82] as a support tool for the
Covenant of Mayors for Climate and Energy [83] and development and implementation of
local adaptation plans, which are found within consolidated international best practices.Sustainability 2021, 13, 5694 18 of 31
The action categories for the climate adaptation of open spaces are divided into:
• Greening. The inclusion of elements such as trees, rain gardens or small flower beds,
and green areas [84] helps to reduce greenhouse gases emissions (GHG) [85] and can
increase the livability of cities. Planting trees on roads, squares, and parking lots
creates shade and activates evapotranspiration phenomena [86], having a positive
effect on the reduction of urban temperatures, the impacts of the heatwave and
consequently the effect of the urban heat island [48,85,87–89].
• De-paving. The removal of waterproof layers of horizontal urban surfaces to introduce
permeable or semi-permeable flooring [90,91], with adequate thermal and physical
capacities (albedo, roughness, emissivity, and technical conductivity) [92,93], allows
urban surfaces to keep their temperatures lower, owing to the possibility of penetrating
water into the sub-paving layers [94,95] together with the physical properties of the
materials used for paving.
• Shading. To reduce the thermal impact of solar radiation and reduce the phenomena
of glare and immediate transmission of thermal energy from urban surfaces [83], the
use of tensile structures and pergolas with reflective technical textiles to increase
efficiency in response to the thermal load, but also natural elements such as tree-lined
and covering climbing essences, contribute to the creation of shadowed areas and
reducing the heating of horizontal and vertical urban surfaces [96].
• Water bodies. Pools, fountains, small ponds, ponds, water blades, and also jets, waterfalls,
and sprayed water, the insertion of which within urban areas leads to a decrease in air
temperatures [84,97]. Water can reduce the air temperature by evaporation, absorption,
and heat transport. In addition to an integrated strategy for the effects of climate change,
water bodies can also be used as collecting basins for rainwater [98].
• Cool materials. Materials so-called cool [90], are characterized by high solar re-
flectance [99], obtained through the use of materials with light colors or surfaces
treated with applied paintings [91–93], and also through the creation of materials
within special reflective pigments of the infrared radiation and capable of maintaining
the desired color quality [99]. The use of cool materials within the urban environment
favors the reduction of temperatures in the city and allows to reduce the urban heat
island effect [100–102].
4.2. Collecting and Systematizing Results in a Database
To rationalize and manage the information coming from the microclimatic simulations
carried out and allow their rapid updating according to the hypothesis in which the
forecasts on future climate scenarios should be perfected, a database has been created
within the intervention categories identified for climate adaptation on the open space have
been catalogued, with particular reference to the phenomenon of the heatwaves.
The creation of a database allows to efficiently consult the collected data and favors
an easier consultation of the information contained within decision-making processes and
analysis by stakeholders.
The database contains data relating to:
• The six climate macro-regions defined by the PNACC with the reference cities;
• The 25 recurrent urban patterns for each climate macro-region;
• Information on the dimensional relationships of recurrent urban patterns (distance
between buildings, buildings height, building density, territorial coverage ratio);
• Information on the size ratios of recurring urban patterns of squares and open spaces
(buildings height, perimeter percentage);
• Information on green areas (category, percentage of tree cover);
• The values of urban morphology indicators for each of the recurring urban patterns
(full-empty ratio, average height, sky view factor, hillshade);
• The values of PMV, CO2 concentrations, air temperature (◦ C) of recurrent urban
patterns about current climatic conditions and climatic conditions as of 2050s;Sustainability 2021, 13, 5694 19 of 31
• The values of PMV, CO2 concentrations, air temperature (◦ C) of recurrent urban
patterns following the application of the intervention categories for climate adaptation
about current climatic conditions and climatic conditions as of 2050s;
• The values of PMV, CO2 concentrations, air temperature(◦ C) of recurrent urban pat-
terns following the overall application of the intervention categories for climate adap-
tation about current climatic conditions and climatic conditions as at 2050s;
• The percentage reduction values of PMV values, CO2 concentrations, air temperature
(◦ C) of recurrent urban patterns following the application of climate-proof intervention
categories calculated with current climatic conditions and climatic conditions as at 2050s;
• The percentage reduction values of PMV values, CO2 concentrations, air temperature
(◦ C) of recurrent urban patterns following the overall application of climate-proof
intervention categories calculated with t current climatic conditions and climatic
conditions as at 2050s.
4.3. Database Structure
The construction of an information database containing the results of climate-proof
intervention categories for recurring open spaces (Figure 12) is structured into six sections,
in which the set of simulation output data collected the outputs of simulations downstream
of the application of the five intervention categories and the combination of them into
current climatic conditions and 2050s.
Figure 12. Extract from the database of the open spaces referred to the Climatic Macro-region 2-Reference city Naples:
indicator values of current conditions (2000s) and medium-term scenarios (2050s).Sustainability 2021, 13, 5694 20 of 31
Within the database, simulation data for each of the sections related to the intervention
categories and their combination collect data on:
• Indication of the climate macro-region;
• Classification of recurrent urban patterns;
• Recurrent urban pattern and simulation code;
• Output simulations under current conditions (PMV adult, PMV child, PMV old people,
air temperature, CO2 concentrations);
• Output simulations under medium-term forecast conditions (PMV adult, PMV child,
PMV old people, air temperature, CO2 concentrations);
• The percentage difference between 2000s and 2050s term outputs (PMV adult, PMV
child, PMV old people, air temperature, CO2 concentrations);
• The percentage change between current conditions and application of interven-
tion categories 2000s (PMV adult, PMV child, PMV old people, air temperature,
CO2 concentrations);
• Percentage change between current conditions and application of intervention categories
2050s (PMV adult, PMV child, PMV old people, air temperature, CO2 concentrations).
Besides, the open space database has an additional section within the associated code
and the extent of the solutions related to the applicability within the recurring urban
patterns and the corresponding classification of the urban density.
4.4. Experimental Database Usage Activities with Climate-Proof Technical Solutions for Climate
Adaptation of Recurrent Open Spaces: Testing, Verification, and Simulation Process
The experimental activity for the use of the database of technical solutions aimed
at the implementation of actions for the urban regeneration of recurrent open spaces for
climate adaptation is based on the re-proposal of a testing and verification process through
recursive microclimatic simulation operations carried out with the use of ICT tools already
introduced within the developed methodology.
To evaluate the possible scenarios capable of acting on improving the outdoor comfort
of the open spaces of Italian cities, and based on the data that emerged from the simulation
of the microclimatic behavior of the recurrent urban patterns in the six climatic macro-regions
both for the current climatic conditions and for the climatic conditions at 2050s, it was chosen to
test and verify, through a meta-design application, the degree of applicability and performance
response that the groups of intervention categories identified can ensure a concrete contribution
to climate adaptation in the urban environment about the heatwave phenomenon.
Following the determination of the degree of total and partial applicability of the
climate-proof intervention categories (Figure 13), the simulation process of more than
1800 processes has been initiated, which have determined, for each of the recurring urban
patterns in each of the climatic macro-regions and the different climatic scenarios, the
achievable performance levels expressed through the PMV index, air temperature (◦ C),
and CO2 concentrations (ppm).
Following the execution of simulations in which climate-proof actions of a meta-design
type are applied, it has been observed that these can return a different behavior from time
to time about the morphological and technological-environmental specifications of the
recurring urban patterns associated with the different parts of the cities analyzed, resulting
in a substantial difference in performance on the micro-climate and environmental level.
The experimental application of the categories within the urban patterns representative
of the identified open spaces has made it possible to obtain useful information to understand,
to a greater extent, what are those characteristics of open spaces and actions that influence the
perception of comfort, air temperature, and climate-changing gas emissions and also, to what
extent these can be introduced in the urban environment to achieve adequate performance
levels during periods of increased thermal stress, particularly during heatwaves.You can also read