Harbor-Wide Water Quality Monitoring Report 2021 - NEW YORK / NEW JERSEY HARBOR & ESTUARY PROGRAM - Hudson ...
←
→
Page content transcription
If your browser does not render page correctly, please read the page content below

NEW YORK / NEW JERSEY HARBOR & ESTUARY PROGRAM   CHAPTER 2

Harbor-Wide Water Quality
Monitoring Report 2021
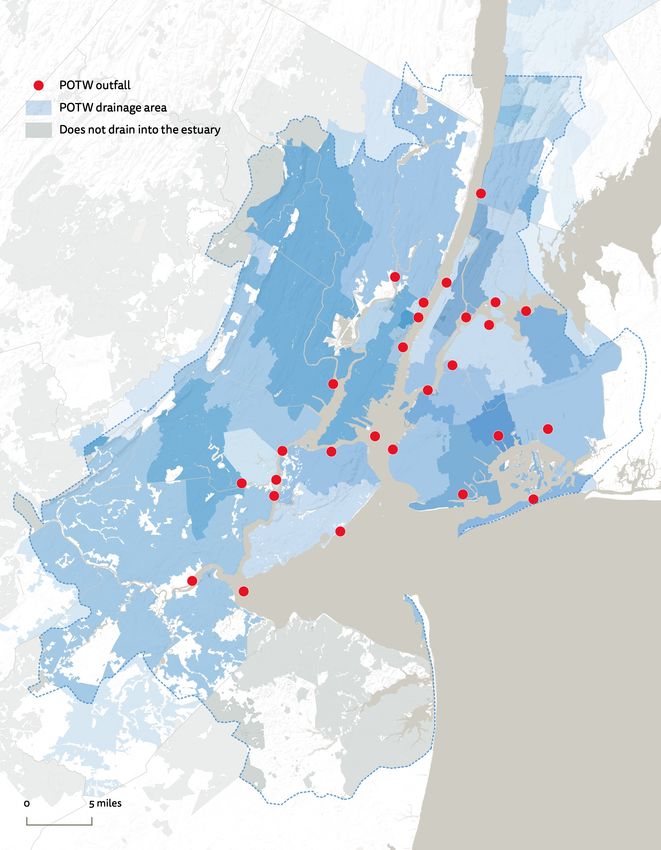
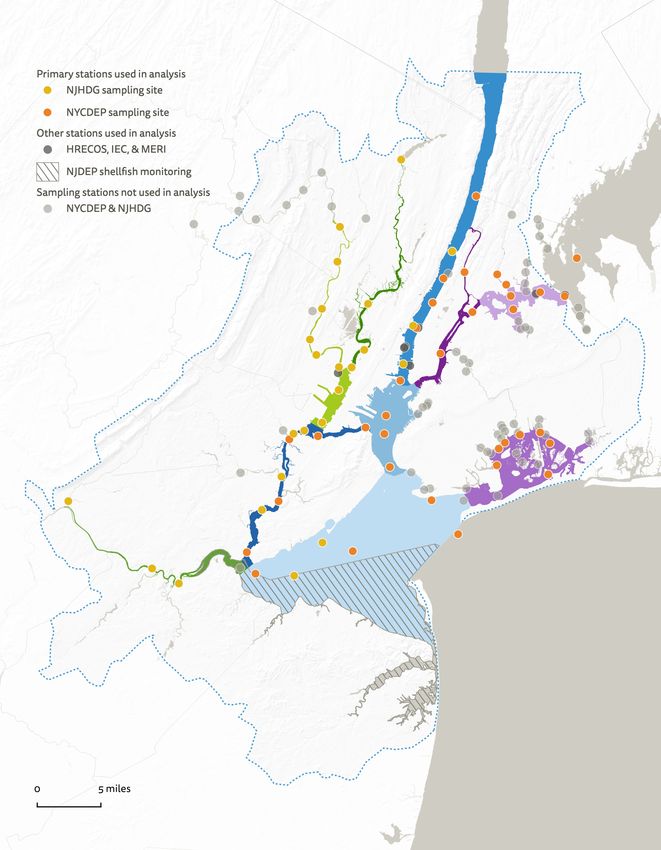
Table of Contents
1 Executive Summary
2 The Harbor Estuary and Shared Waters
      5 Measuring Water Quality Parameters
      8 Water Quality Standards and Criteria
     10 Challenges of Regulating Shared Waters
3 Factors that Affect Water Quality in the Harbor Estuary
     12   Major Point Sources of Pollution
     15   Legacy Toxic Pollution
     16   Improving Water Quality in the Harbor
     17   Timeline of Major Clean Water Act Investments and Improvements
4 Data Sources and Assessment Methodology
    20 Survey Regions and Sampling Sites
    22 Methodology
5 Is the Harbor Estuary Swimmable and Fishable?
    25    Pathogenic Bacteria
    27    Dissolved Oxygen
    26    Total Nitrogen
    27    Chlorophyll-a
6 Regional Waterbody Summaries
    33    Bronx River and the Western Long Island Sound
    37    East River and Harlem River
    41    Jamaica Bay
    45    Lower Passaic River and Newark Bay
    49    Hackensack River
    53    Lower Raritan River
    57    Lower Hudson River
    61    Upper New York Bay
    65    Arthur Kill and Kill van Kull
    69    Lower Bay
7 Appendices
    75 Acronyms/Glossary
    74 A: Current Waterbody Classifications and Criteria in New York and New Jersey waters
    76 B: Regional Waterbody 2017 Assessment Table
8 Acknowledgements
    82 Disclaimer
    83 Preferred Citation
9 References

                                                                 New York – New Jersey Harbor & Estuary Program 1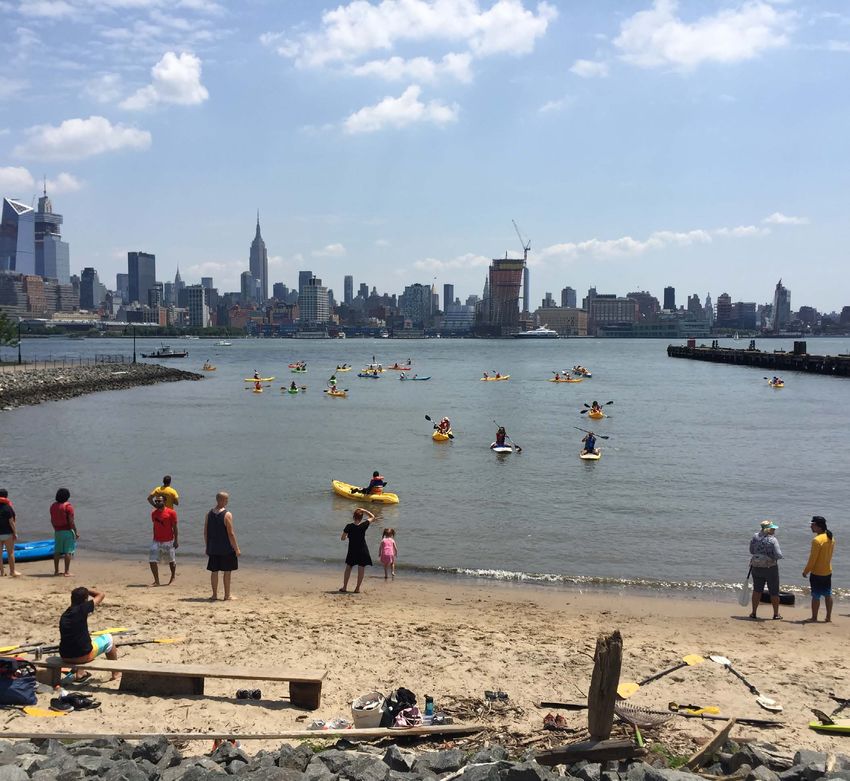
Executive Summary
Water quality affects everything that the New York                               Dischargers Group (NJHDG) were assessed by
– New Jersey Harbor & Estuary Program (HEP) and                                  aggregating 59 individual sampling stations into
our partners strive for. It is the key to to a healthy                           individual “master stations,” representing each of
ecosystem, safe public recreation, and sustainable                               10 principal regional waterbodies in the estuary.
sediment management. Both states have invested                                   Water quality is described by using parameters, for
billions of dollars towards attaining the goals of                               example concentrations of pathogenic bacteria,
the 1972 Clean Water Act. Long term trends in                                    such as Enterococcus and fecal coliform, and dis-
water quality dating back to the 1970s show condi-                               solved oxygen. These two parameters are the
tions improving over time leading most notably to                                primary criteria for evaluating waterbodies and their
the Harbor's increased public access and use in                                  designated uses; the presence/absence of patho-
addition to other benefits. This third edition of the                            genic bacteria indicating safety for recreation and
Harbor-wide Water Quality Report 1 provides the most                             dissolved oxygen being a measure of habitat health
current water quality data in the estuary and its rela-                          for fish and other aquatic organisms. In addition,
tionship to public access and habitat health. The                                this report explores total nitrogen and chloro-
objective of this report is to illustrate where we are                           phyll-a to further understand dissolved oxygen
relative to the fishable and swimmable goals of the                              levels. Evaluated together, these parameters pro-
Clean Water Act and current regulatory standards.                                vide a comprehensive determination whether uses
   Understanding water quality improvements in                                   are being met.
shared waters like the Harbor Estuary can be diffi-                                 To understand how swimmable and fishable the
cult. New York and New Jersey each have different                                estuary’s waters are, these four parameters were
laws, policies, and management approaches when                                   assessed against federal recreational water qual-
it comes to water quality criteria and designated                                ity recommendations and guidance documents.
uses. But looking across geographic and legal juris-                             For each of the 10 regional waterbodies, water
dictions is critical to help the responsible parties                             quality is described using New York’s and/or New
make collaborative decisions.                                                    Jersey’s standards and criteria as of 2020 for
   This report presents water quality data collected                             pathogens (fecal coliform, enterococci, and E. coli)
from 2010 to 2017 from both New York and New                                     and DO. Proposed rulemaking to amend standards
Jersey. We have analyzed the data jointly to advance                             and/or criteria introduced by the states are not
discussions about water management across all                                    explored in this report. This report does not serve
the waters of the Harbor Estuary. Data collected by                              to replace New York’s or New Jersey’s Integrated
the New York City Department of Environmental                                    Water Quality Reports, nor is it meant to be used
Protection (NYCDEP) and the New Jersey Harbor                                    for compliance purposes.

1. New York-New Jersey Harbor Estuary Program (2011). Harbor-Wide Water Quality Monitoring Report for the New York-New Jersey Harbor Estuary, 2nd Edition.
   www.slideshare.net/hudsonriverfoundation/harborwide-water-quality-monitoring-report-for-the-new-yorknew-jersey-harbor-estuary.
2 Water Quality Report 2020
Water quality in the Harbor Estuary has continued to improve
from 2010 to 2017. The number of safe recreational days for             The collaborative mission of HEP and
swimming and other primary contact recreational activities
between June 1st and September 30th is increasing. On average
                                                                        our partners’ is to bring the benefits of
and in much of the estuary, especially the Lower Hudson River,          the Clean Water Act to the people and
Upper New York Bay, Lower Bay, and Jamaica Bay, it is safe to           wildlife of the estuary by reducing the
swim. Dissolved oxygen levels, critical for fish and other aquatic
organisms, are generally favorable and above federal threshold
                                                                        sources of pollution, improving habitat,
values. This extraordinary achievement, especially relative to          and enabling public access and engage-
conditions just a generation ago, is due to the collective efforts of   ment. For more information, please visit
EPA, both states, local government, wastewater utilities, and
environmental and community advocates. These parties have
                                                                        www.harborestuary.org.
taken significant steps to improve the 25 Publically-Owned
Treatment Works (POTWs) that discharge to the estuary, have             systems (MS4), illicit discharges as well as nonpoint source
implemented controls that reduce the volume of combined                 pollutants carried by stormwater. As summarized for each of the
sewer overflows (CSOs) discharging into waterbodies, and are            10 regional waterbody summaries, there are still a number of
carrying out policies and plans to manage stormwater at the             other challenges to consider when determining safe use and
source, such as stormwater management plans.                            making future investments towards achieving the Clean Water
   However, there are still areas of the Harbor Estuary where           Act’s fishable and swimmable waters goal. Notably, the region’s
further investments are needed to achieve the swimmable and             long history of industrial activity has left a legacy of toxic
fishable goals of the Clean Water Act. For example, data in the         contaminants such as polychlorinated biphenyls (PCBs), heavy
Lower Passaic River and Newark Bay, Hackensack River, and the           metals (e.g. mercury), pesticides, and polyaromatic hydrocar-
Lower Raritan River do not show consistently safe pathogenic            bons (PAHs) (Lodge, et al. 2015).
bacteria levels that would permit safe swimming. For these                 Government, utilities, and landowners are planning to invest
smaller waterways (as well as other enclosed and confined               billions of dollars in an attempt to minimize and control sewage
waterways) pathogen levels indicate limits to the public’s ability      and stormwater discharges. This includes the work of New York
to enjoy their waterways for even non-contact recreation. In            City and the 17 CSO municipalities and four utilities in New
addition, the Bronx River and Western Long Island Sound,                Jersey to implement Long Term Control Plans (LTCPs) to reduce
Jamaica Bay, and the Hackensack Rivers show levels of dissolved         the volume of CSOs. In addition, 211 municipalities across both
oxygen, total nitrogen, and chlorophyll-a levels where conditions       states are working to improve stormwater management by
may harm fish and other aquatic organisms and reduce the                implementing plans via MS4 permits. Continued capital invest-
health of the whole ecosystem.                                          ments and other improvements in water management will be
   Addressing these conditions, and continuing to demonstrate           required to address the pathogen and nutrient pollution that still
progress towards current state standards and overall fishable           limit public use and threaten the ecological health of the estuary.
and swimmable goals will require further action to address              This report is intended to help inform HEP and our government,
ongoing sources of pollutants. This includes addressing                 academic, civic and community partners as they make decisions
discharges from POTWs, CSOs, municipal separate storm sewer             about how best to make those future investments.

                                                                                        New York – New Jersey Harbor & Estuary Program 3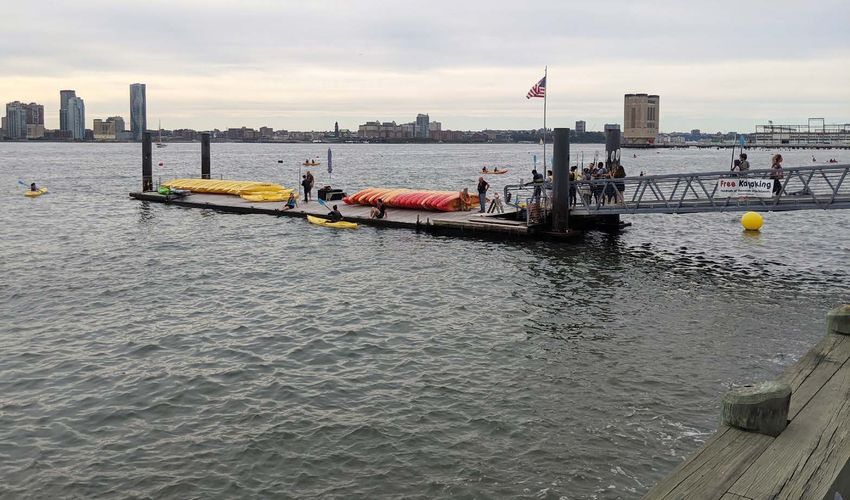
Figure 1.

     Point Source Pollution Proximity
     to Recreational Areas
           Public and private boat launches
           Public and private beaches
           Waterfront parks
     Combined Sewer Outfalls (CSO)
        within 1/2 mile of beach
        within 1/2 mile of boat launch
        other CSOs
     Municipal Separate Storm
     Sewer System (MS4) Outfalls
         within 1/2 mile of beach
         within 1/2 mile of boat launch
         other MS4 outfalls
           Harbor Estuary Watershed
           Boundary

            J MS4 Outfall areas:
           N
           Incomplete or missing
           outfall location data

4 Water Quality Report 2021
CHAPTER 2

The Harbor Estuary
and Shared Waters
The New York-New Jersey Harbor Estuary is the           where attainable, throughout the estuary. Respon-
biggest public resource in the nation’s largest and     sibility for water infrastructure and water quality is
most densely developed metropolitan area. There         fragmented across political jurisdictions and
are more than 250 square miles of open water from       agency, utility, municipal, and landowner responsi-
the Mario Cuomo (Tappan Zee) Bridge south to            bilities. But understanding current water quality
Sandy Hook, NJ, including the lower reaches of the      requires looking across these geographic and legal
Hudson, Passaic, Hackensack, and Raritan Rivers.        jurisdictions. This holistic approach is critical to
Water quality in the Harbor Estuary is key to safe      helping responsible parties make difficult and col-
swimming and boating as well as the underlying          laborative decisions.
environmental quality of shoreline parks and               Water quality monitoring and reporting those
waterfront neighborhoods. Healthy populations of        results to the public is necessary to collect evidence
fish, birds and other wildlife also depend on clean     and inform decisions that protect public health and
water. Since the passage and implementation of          sustain the estuary’s ecology. Stormwater and san-
the federal Clean Water Act in 1972, significant        itary discharges continue to deliver pollution to our
investments have been made to improve water             waters, often in close proximity to recreational
quality in the Harbor Estuary. The benefits are         areas (Figure 1). Primary water quality parameters
readily apparent in the public’s demand and enjoy-      that challenge the health of the estuary include
ment for waterfront access as well as many new          pathogen contamination, low dissolved oxygen,
residences and offices built along the waterfront.      and excessive levels of nutrients. This report com-
Less visible are the growing numbers of fish, whales,   piles the best available data from 2010-2017 on
seals and other marine organisms.                       four water quality parameters to assess the Harbor
   The New York-New Jersey Harbor & Estuary Pro-        Estuary as a whole as well as for 10 principal
gram (HEP) and its partners continue to work            regional waterbodies.
towards achieving fishable, swimmable waters,

5 Water Quality Report 2020                                          New York – New Jersey Harbor & Estuary Program 5

THE HARBOR ESTUARY AND SHARED WATERS

Measuring Water Quality Parameters
A number of parameters are used to measure water quality, provide important information on the
health of the biota living in the estuary, and human use of the estuary for activities such as swimming
and shellfishing. This report focuses on four primary water quality parameters: pathogenic bacteria
(Enterococcus and fecal coliform), dissolved oxygen, nitrogen, and chlorophyll-a. There are other
important water quality parameters that are not explored in this report. Some of these parameters are
explored in the State of the Estuary report (www.hudsonriver.org/NYNJHEPStateoftheEstuary.pdf).
HEP’s Environmental Monitoring Plan (www.hudsonriver.org/article/environmental-monitoring-plan)
identifies parameters where further research and data collection are necessary.

Pathogenic Bacteria:
Enterococcus and Fecal Coliform                                     Dissolved Oxygen
The presence of pathogenic (disease-producing) bacteria in both     The level of dissolved oxygen (DO) in the water is used to
marine and freshwaters are the result of fecal contamination        measure habitat quality for fish and other aquatic organisms.
from untreated waste and stormwater, including human and            Fish tend to swim away from and are otherwise stressed by
non-human sources. State and federal agencies use pathogenic        areas of low DO, but benthic invertebrates are likely to die in low
bacteria as parameters to determine whether waters are safe for     DO areas. The amount of DO is influenced by the time of day
primary contact recreation (swimming) and consuming shell-          (sunlight promotes photosynthesis and therefore the produc-
fish. Fecal coliform bacteria are commonly used as a parameter      tion of oxygen), tidal cycle, season, temperature, and depth of
to measure levels of pathogenic bacteria. In 1986, the U.S. Envi-   the water. In addition, the consumption of oxygen (i.e., respi-
ronmental Protection Agency (EPA) chose Enterococcus as its         ration) by microbes, algae, and fish can also reduce the DO in
recommended parameter to measure pathogenic bacteria in             a waterbody. As these factors change the concentration of
saline waters. Like fecal coliform, Enterococcus bacteria are       DO, the abundance of aquatic organisms also changes. Acute
commonly found in the feces of humans and other warm-               hypoxia (very low dissolved oxygen) can cause fish kills, and if
blooded animals. Enterococcus bacteria have a slower decay rate     levels remain chronically low, predator-prey relationships in
and are more likely to survive longer in highly saline waters.      the estuary can be affected (Yozzo, 2018). Hypoxia is most prob-
For these reasons, Enterococcus bacteria have a greater correla-    lematic in slow-moving tributaries, bays, and deeper parts of the
tion to swimming-associated illnesses than fecal coliform.          estuary where the water is not well mixed.
Fecal coliform are typically mesured in waterbodies that are
suitable for secondary contact recreation or on-water recre-
ational activities, such as kayaking or rowing. Another
commonly measured pathogenic bacterium is Escherichia coli,
or E. coli, which is a good predictor of swimming-associated
illnesses in freshwater systems.

6 Water Quality Report 2021
Nitrogen                                                                                Chlorophyll-a
Among the major nutrients, nitrogen is the one that is most                             Chlorophyll-a is a general indication of phytoplankton, more
limiting in the estuaries. While nutrients like carbon and phos-                        commonly known as microalgae and algae, in the water. Algae
phorus are plentiful in the marine environment, it is the relative                      are a vital food resource at the base of the food web, and thus play
inputs of nitrogen that control excessive growth and reproduc-                          a linchpin role in ecosystem health. Like any healthy diet, both
tion of marine plants and algae (Nixon, 1995). Nitrogen can enter                       the amount and type of food are important. Some algae produc-
our waterways through treated wastewater as well as untreated                           tion is needed to support the estuary’s food web. However, exces-
sewage discharges. Atmospheric deposition2 and stormwater                               sive algae growth can negatively influence the estuary by causing
runoff from over-fertilized lawns and farms are additional                              low DO levels and aesthetic problems such as green scum or bad
sources of nitrogen to the estuary. Generally, nitrogen concentra-                      odors. Some algae produce toxins that can be an ecological and
tions are most problematic during the spring and summer                                 public health concern.
growing seasons. This is due to the combination of increased
nutrients, organic matter (including organic matter produced
over the winter season), and higher temperatures that result in
enhanced biological activity (i.e., biodegradation and decompo-
sition of organic matter). Coupled with decreased oxygen solu-
bility, this reduces the amount of DO available in the water
column for fish and other organisms in the waterbody. In addi-
tion, respiring algae exert DO depletion on a daily timescale in
some parts of the estuary.

   Kayakers at the boathouse on
 New York City's Pier 26 kayaking
      in the Hudson Rver, credit:
                 Rosana Da Silva.

2. Atmospheric deposition is the process where particles, aerosols, and gases move from the atmosphere to the earth’s surface. Atmospheric deposition by wet deposi-
   tion, such as rainfall, fog, or snow, or dry deposition, such as dust carried by wind, are examples of how particles and gases settle onto the surface of land and water.

                                                                                                             New York – New Jersey Harbor & Estuary Program 7
THE HARBOR ESTUARY AND SHARED WATERS

Water Quality Standards and Criteria
New York and New Jersey take a primary role in establishing the       specific parameters and establish numerical values to measure
specific water quality standards that set regulatory goals for the    these parameters for each waterbody. These can be based on
estuary and its waterways. These state standards must be consis-      EPA’s recommendations, modified to reflect site-specific condi-
tent with the fishable and swimmable goals of the federal Clean       tions, or based on their own standard that is scientifically defen-
Water Act and be based on the best available science.                 sible and protective of the waterbody’s designated use. In
   Pathogenic bacteria and dissolved oxygen are the primary           addition, Total Maximum Daily Loads (TMDLs) can be used by
parameters that are used by EPA, New York, and New Jersey to set      the states and EPA to determine the amount of a pollutant that a
protective standards to achieve the designated uses of individual     waterway can take in and still meet their designated uses and
waterbodies in the estuary. While the federal Clean Water Act         water quality criteria. Past research on possible TMDLs for the
calls for all waters to be fishable and swimmable, where attain-      Harbor Estuary on pathogens, dissolved oxygen, nutrients, toxic
able, the designated use sets a specific goal for each individual     contaminants and trace metals are available at www.hudson-
waterbody, for example supporting aquatic life and/or enabling        river.org/article/tmdl.
on-water recreational activities. While there are other desig-           For this report, water quality data for the selected parameters
nated uses, this report focuses only on recreation and supporting     in the Harbor Estuary are analyzed against EPA’s national guid-
fish and other aquatic organisms. The designated uses deter-          ance, referred to as the 2012 Recreational Water Quality Criteria
mine the water quality condition and the management needed            (RWQC), as well as against state criteria and standards in the 10
to support that specific designated use. Existing uses are specifi-   principal regional waterbodies. Where there is no national or
cally defined as the past or present condition that have actually     state guidance for the selected parameters, literature reviews
been attained in a waterbody on or after November 28, 1975 – the      were conducted to identify appropriate thresholds for select
day EPA promulgated the original water quality standards regu-        parameters in the Harbor Estuary. These are presented as a
lation. EPA defines recreational activities as either primary         useful reference in the absence of local thresholds. Like the
contact (such as swimming and bathing) or secondary contact           slight differences in regulatory definitions of recreational uses,
(such as boating). The specific regulatory definitions of these       water quality standards also vary throughout the estuary
recreational uses, and thus the management implications, are          according to the designated uses set by the states for those
determined by New York and by New Jersey, in collaboration            waterbodies. For example, the areas designated for shellfishing
with EPA.                                                             and bathing have the most stringent bacterial standards,
   As a partner to the states, the federal EPA provides guidance      whereas areas designated for fish survival have the least strin-
and oversight. The EPA has established national guidance values       gent bacterial standards (see Appendix A: Current Waterbody
for a variety of water quality parameters. The states choose          Classifications and Criteria in New York and New Jersey waters).

  Primary and Secondary Contact
  New York 10 NYCRR Part 700.1 (regulatory definitions):              New Jersey NJAC 7:9B-1.4 (regulatory definitions):
  Primary contact recreation means recreational activities            Primary contact recreation means water related recreational
  where the human body may come in direct contact with                activities that involve significant ingestion risks and includes,
  raw water to the point of complete body submergence.                but is not limited to, wading, swimming, diving, surfing, and
  Primary contact recreation includes, but is not limited to,         water skiing.
  swimming, diving, water skiing, skin diving and surfing.              Secondary contact recreation means recreational activities
    Secondary contact recreation means recreational activities        where the probability of water ingestion is minimal and
  where contact with the water is minimal and where ingestion         includes, but is not limited to, boating and fishing.
  of the water is not probable. Secondary contact recreation
  includes, but is not limited to, fishing and boating.

8 Water Quality Report 2021
Pathogenic Bacteria:
Enterococcus and Fecal Coliform Total Nitrogen
This report explores available data from 2010-2017 against two Nitrogen is essential for marine life, but too much of a nutrient
threshold values set by the EPA3. EPA’s 2012 RWQC for pathogens can lead to excessive growth of algae and other microscopic
consists of two values4, a geometric mean and a statistical plants. These organisms and the marine species that feed on
threshold value. A geometric mean (GM) is the central tendency them respire, die, and decompose, depleting the oxygen in the
of a dataset, indicating a typical value or median across the water. Unlike pathogens and dissolved oxygen, nitrogen does
waterbody for a given period. Epidemiological studies have not have a threshold value recommendation from EPA. The
determined that waters having a GM of 35 or less colony-forming states of New York and New Jersey have a narrative water quality
units (cfu)5 of Enterococci per 100 milliliters (mL) of water (35 standard that lays out a descriptive condition that needs to be
cfu/100 mL) is protective of public health, meaning it is accept- met6. However, other estuaries in the country have begun to
able for primary contact such as swimming. Exceeding this define numeric threshold values for nitrogen such as in the
value means that the water is not generally safe for primary Chesapeake Bay. The Mid-Atlantic Tributary Assessment Coali-
contact. In addition, a statistical threshold value (STV) is used to tion (MTAC) developed a protocol as a means to increase scien-
express the frequency of pathogenic bacteria samples above a tific validity in reporting their data. For tidal tributaries and
safe limit. The STV standard is that no more than 10% of the estuaries, the MTAC recommends the following thresholds to
water samples should exceed 130 cfu/100 mL. Together, the GM evaluate total nitrogen levels: >1.2 milligrams per liter (mg/L) as
and STV provide a holistic understanding of water quality that poor, values between 0.4-1.2 mg/L as fair, and any value ≤0.4
endeavors to protect the public from exposure to harmful levels mg/L as good (EcoCheck, 2011).
of pathogens (EPA, 2015).
Chlorophyll-a
Dissolved Oxygen
Chlorophyll-a relates to the abundance of the microscopic algae
EPA’s 2000 Dissolved Oxygen Criteria recommends two threshold that consume nutrients like nitrogen that have entered the
values for hypoxia: acute hypoxia, the dissolved oxygen level at waterbody. Too much chlorophyll-a can indicate excessive
which marine life has a greater potential to die, is a minimum of growth and conditions that can lead to low DO concentrations
2.3 milligrams per liter (mg/L); and chronic hypoxia, the contin- and at times, toxic algal blooms. Having low levels of algae
uous level at which dissolved oxygen hinders growth of marine promotes clearer water that supports healthier habitats for fish
life, is 4.8 mg/L. These threshold values aim to be protective of survival and propagation. EPA conducts a National Coastal Condi-
biological health—survival of juvenile and adult fish and other tion Assessment (NCCA) every five years to assess the ecological
aquatic organisms, their growth, and larval recruitment. condition and recreational potential of coastal waters. Although
not a guidance document, EPA’s NCCA program uses the following
thresholds to evaluate levels of chlorophyll-a in estuaries: >20
micrograms per liter (µg/L) as poor, a value between 5 and 20
µg/L as fair, andTHE HARBOR ESTUARY AND SHARED WATERS
Challenges of Regulating Shared Waters
EPA, the states, wastewater utilities, and other stakeholders New Jersey side is classified as SE3. New York’s SD waters best
are committed to working towards achieving our shared goal use is fishing and suitable for fish survival, but not for primary
—reducing the sources of pollution so that the waters of the or secondary contact recreation or fish propagation. However, in
Harbor Estuary will meet the fishable/swimmable goal of the New Jersey, the Arthur Kill’s SE3 classification indicates best use
Clean Water Act, where attainable (Pirani, et al, 2018). With two is suitable for secondary contact recreation, maintenance and
states and two sets of water quality standards and classifica- migration of fish populations.
tions, it is challenging to assess progress towards this goal in the Moreover, the metrics for each class are distinct. New Jersey
shared waters of the Harbor Estuary7. In particular, the Hudson uses fecal coliform for SE3 waters, but New York uses total coli-
River, the Kill van Kull, Arthur Kill, and the Raritan Bay have form and fecal coliform as its pathogen parameter for SD waters.
different standards and classifications per state. These standards These differences create obstacles when defining what consti-
and classifications determine whether or not the waterbody is tutes fishable and swimmable waters in the Harbor Estuary, how
considered suitable for primary or secondary recreation, or if to communicate safe use to the public and decision makers, and
fishing is allowed (see Appendix A: Current Waterbody Classifica- ultimately, the conditions placed on utility and municipal
tions and Criteria in New York and New Jersey waters). For example, discharge permits.
the Arthur Kill on the New York side is classified as SD and on the
New York New Jersey
Waterbody Class SD SE3
Pathogens: Total Coliform Monthly Median Not applicable for this class
There are several different
≤ 2,400/100mL and
waterbody classes and water
80% ≤ 5,000/100mL quality criteria per state. To
review New York and New Jersey
Pathogens: Fecal Coliform Monthly GM ≤200/100mL Monthly GM ≤1,500/100mL
waterbody classes and water
quality standards, see Appendix
Pathogens: Enterococci Not applicable for this class Not applicable for this class A: Current Waterbody Classifica-
tions and Criteria in New York
Dissolved Oxygen ≥3.0 mg/L ≥3.0 mg/L and New Jersey waters.
7. In addition to the two states, the Interstate Environmental Commission (IEC) has also adopted water quality regulations, that outline water classifications
intended uses, and water quality standards supportive of those designated uses in the waters of the Interstate Environmental district which encompasses
portions of the shared waters of New York, New Jersey, and Connecticut. These regulations can be found at www.iec-nynjct.org/do/water/regulations. IEC
supports efforts to move towards more consistent standards in the shared waters.
10 Water Quality Report 2021CHAPTER 3
Factors that Affect Water
Quality in the Harbor Estuary
Under the Clean Water Act, the EPA recognizes two runoff or seeping into groundwater, eventually
broad categories of pollution: point source pollu- making its way into local streams, rivers, the estu-
tion and nonpoint source pollution. Point source ary, and ocean. Examples of nonpoint source
pollution is defined as any contaminant that enters pollution include litter, oil and grease, particles of
the environment from an easily identified and con- tire rubber, pet waste (pathogenic bacteria), and
fined single source. Common examples of point fertilizers used in gardens or lawns. In the Harbor
source water pollution are wastewater treatment Estuary today, water quality is challenged by both
outfalls and combined sewer system outfalls. Non- point and nonpoint sources of pollution. In addi-
point source pollution, on the other hand, is where tion, the region’s long history of industrial activity
the source(s) of the pollutant are widely distributed has left a legacy of toxic contamination in these
or pervasive, and not as easily identifiable. The pol- waters.
lutant is likely carried over land by stormwater
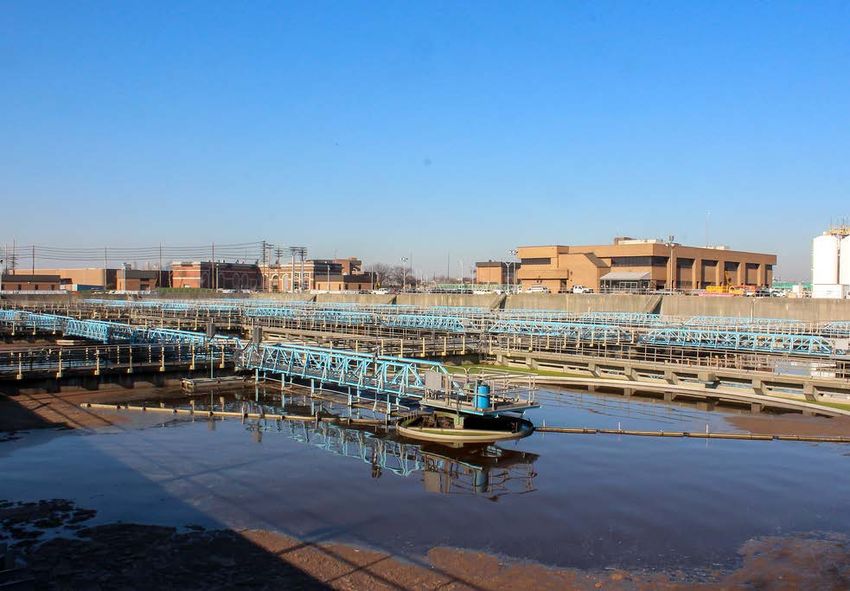
New York – New Jersey Harbor & Estuary Program 11FACTORS THAT AFFECT WATER QUALITY IN THE HARBOR ESTUARY Major Point Sources of Pollution Publicly Owned Treatment Works (POTWs) The most important point source discharges into the Harbor All wastewater that is treated by each of these POTWs receives Estuary are from wastewater managed at publicly-owned treat- both primary and secondary treatment per their respective ment works (POTWs). There are 25 POTWs in the Harbor Estuary, NPDES permits. Primary treatment refers to the removal of each with a National Pollutant Discharge Elimination System coarse material by screening and settling, while secondary treat- (NPDES) permit. The NPDES permit, issued by the states and ment refers to the biological and chemical digestion and removal approved by EPA, dictates the quality and quantity of pollut- of organic matter, followed by a final clarification. The waste- ants that pass through the POTW and discharge into the local water is then disinfected with chlorine, or other disinfectant waterways, including pathogenic bacteria and nutrients such chemical, to remove pathogenic bacteria before it is discharged as nitrogen. Of the 25 POTWs, 14 are in New York City, one is into a nearby waterbody through the permitted POTW outfall. in Yonkers and 10 are found along the New Jersey coastline of Some POTWs also include tertiary treatment that aim to the Harbor Estuary. Collectively, these 25 POTWs treat over two remove remaining inorganic compounds like nitrogen and billion gallons of sewage per day from industrial and commer- phosphorus as well as dichlorination treatment to reduce chlo- cial sources and over 12 million residents. This volume does not rine from the effluent. include smaller discharges from publicly and privately-owned wastewater treatment facilities that discharge into freshwater streams, groundwater, or the Atlantic Ocean. Left: Newtown Creek wastewater facility in Brooklyn, NY, credit: NYCDEP; right: Passaic Valley Sewerage Commission’s (PVSC) wastewater facility in Newark, NJ, credit: PVSC 12 Water Quality Report 2021
Figure 2
Drainage area per Publically Owned
Treatment Works and Discharge Outfall
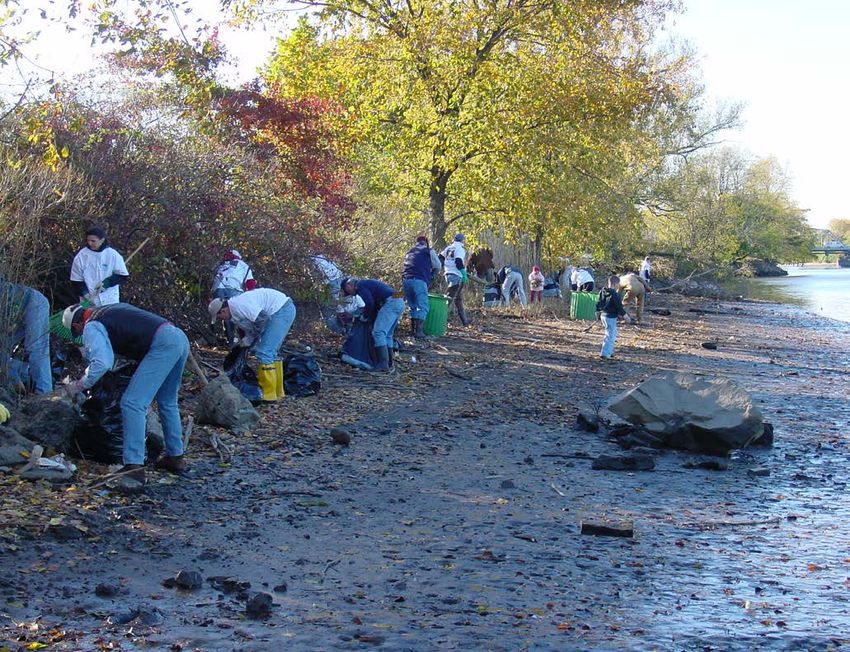
New York – New Jersey Harbor & Estuary Program 13FACTORS THAT AFFECT WATER QUALITY IN THE HARBOR ESTUARY Combined Sewer Systems (CSS) or Combined Sewer Overflow (CSO) For much of the region, wastewater arrives at the POTW through an annual estimate of 43 billion gallons of stormwater and a combined sewer system (CSS): a complex of pipelines that untreated sewage water into the estuary (NRDC, 2020; Jersey collect both stormwater and sanitary waste (sewage) and sends Water Works, 2018). the combined flows to a POTW for treatment. During heavy To address CSOs, permittees in both New Jersey and New rainfall or snowmelt events, the excess volume of stormwater in York have developed and are currently implementing Long addition to sanitary flows may exceed the capacity of the pipe- Term Control Plans (LTCPs) to identify and evaluate solutions line, the POTW, or both. When this occurs, the excess volume of for reducing the impacts of CSOs (NYCDEP, 2018; NJDEP, 2020). mixed, untreated sewage water is discharged into a local water- The NYCDEP has 11 LTCPs in varying degrees of development body. This is referred to as a combined sewer overflow (CSO) and and approvals while in Yonkers, the Yonkers Joint Wastewater the term CSO is commonly used to describe combined sewer Treatment Plant completed their LTCP in 1995 for 13 CSOs. In systems. CSOs, common in older cities across the country, were New Jersey, 21 municipalities (17 of which are within the Harbor designed this way to prevent flooding in streets and homes, and Estuary) and four utilities that have active CSO permits and are operational problems at the POTWs during wet weather events. finalizing LTCPs in 2020. There are 607 CSO outfalls across the estuary that discharge Left: An active CSO discharging into the Raritan River in Perth Amboy, NJ, credit: Raritan Riverkeeper. Right: Volunteers helping to pick up marine debris (litter) along the shoreline of the Passaic River in Lyndhurst, NJ, credit: Christopher Brooks. 14 Water Quality Report 2021
Municipal Separate Storm Sewer Systems (MS4)
In contrast to CSSs, municipal separate sewer systems (MS4s)           the atmosphere as precipitation or settling dust all contribute
are designed to address wet weather flows by separating the            these nonpoint source pollutants to stormwater runoff. These
sanitary and wet weather flows. During rain or snowmelt events,        pollutants harm fish and wildlife populations, kill vegetation,
the stormwater flows are collected in a series of separate sewer       and make recreational areas unsafe and unpleasant.
lines and discharged directly into a nearby waterbody through             Once a pollutant is picked up by water from a sidewalk or
a stormwater outfall (SWO). The sanitary flows to the POTWs            other hard surfaces, it is most likely carried into a local water-
remain largely unaffected during wet weather events as they            body without receiving treatment. Managing stormwater poses
are in separate pipelines. Like CSSs, MS4s are also regulated          a number of challenges. In New Jersey, the state issued its MS4
under the NPDES to reduce pollution in stormwater runoff. Not          permits and finalized its stormwater rules in 2004 while in New
only are MS4 permits issued to municipalities, but they are also       York City, the first MS4 permit was received in 2015 that aim to
issued to industrial and commercial facilities that need to obtain     address the challenges posed by nonpoint source pollutants in
coverage for stormwater discharges. Sediments, nutrients (from         these systems. Dominated by urban and suburban land uses, the
fertilizers or otherwise), pathogens (bacteria and viruses), road      watersheds of the Harbor Estuary are covered by buildings, pave-
salts, oils and grease, organic compounds and heavy metals,            ment, and compacted landscapes. These impervious surfaces
and litter are widely recognized as nonpoint source pollutants         significantly reduce the amount of rain and snowmelt that can
that may discharge directly into a waterbody during wet weather        soak into the ground to be naturally filtered by soil and vegeta-
events as stormwater runoff. Residential and commercial prop-          tion. In turn, there is a sharp increase in the volume and velocity
erties, roadways and parking lots, agricultural operations, faulty     of stormwater runoff that carries nonpoint source pollutants.
septic systems, construction sites, and direct deposition from

Illicit Discharges

In addition to nonpoint source pollutants, waterbodies are also        drain and discharge into a local waterbody. However, not all dry
challenged by illicit discharges. An illicit discharge is defined as   weather flows constitute an illicit discharge. Dry weather flows
an enclosed storm drain or open channel with a measurable flow         can be relatively clean, if they originate from springs, ground-
of polluted water during dry weather (Brown, et al, 2004). Illicit     water seepage, or leaks from drinking water distribution pipes.
discharges can happen when a sewage pipe breaks or cracks,             Water quality sampling and track downs are needed to confirm
causing sewage (i.e., pathogenic bacteria) to seep into the storm      whether pollutants are present and address their sources.

Legacy Toxic Pollution
The Harbor Estuary has a legacy of toxic contamination due             Act in 1976, and other federal and state laws greatly reduced
to years of unregulated industrial pollution. These chemi-             the discharge of these chemicals into the Harbor Estuary. But
cals originated from electric capacitor manufacturing (poly-           these and other toxic chemicals still reside at high concentra-
chlorinated biphenyls commonly referred to as PCBs), coal              tions in the sediments, soils and groundwater of brownfields,
gasification (dioxins and volatile hydrocarbon compounds),             landfills, and federally-designated Superfund sites throughout
coal-powered energy production (mercury), battery manufac-             the watershed. Federal and state programs designed to clean up
turing (cadmium), herbicides and pesticide production and              these legacy contaminants are actively working towards reme-
application (dioxins released from Agent Orange, dichlorodi-           diation at many sites across the estuary, but contamination is
phenyltrichloroethane or DDT, chlordane, and dieldrin), and            widespread and progress has been slow. The impact of indus-
many other industrial processes. The passage of the Clean              trial pollutants on water quality will continue to be a challenge
Water Act in 1972, the Resource Conservation and Recovery              for many decades to come.

                                                                                     New York – New Jersey Harbor & Estuary Program 15
FACTORS THAT AFFECT WATER QUALITY IN THE HARBOR ESTUARY
Improving Water Quality in the Harbor
Investments in water pollution control programs have signifi- water quality standards. Implementation of these LTCPs will
cantly improved water quality in the estuary. As indicated in require additional financial support as well as continued coor-
HEP’s 2018 State of the Estuary Report, water quality improve- dination, collaboration, research and communication with the
ment is one of the Harbor Estuary’s biggest success stories, with numerous stakeholders. MS4 permits, required of the 214
conditions improving over time for a number of parameters municipalities in the estuary, likewise require additional invest-
including pathogenic bacteria, dissolved oxygen, and nutrients ment and actions to manage stormwater.
(Stinnette, et al, 2018). For example, the NYCDEP has estimated that $45 billion in
These improvements are the result of billions of dollars of POTW and other wastewater infrastructure investments alone
investments in upgrading POTWs, implementing stormwater have been made since the 1970s, with plans for an additional $6
controls, and dredging and other remediation to remove or billion of capital investments in the implementation of the
control legacy toxics (see figure 3). While water quality in the City’s 11 LTCPs. New Jersey ratepayers and local governments
Harbor Estuary has markedly improved, additional investment have made similar expenditures and are estimating between
is needed to address pollutants that continue to limit public use $2.3 and $2.8 billion in future costs of implementing 18 munic-
and impair the ecological health of the estuary and to realize the ipal LTCPs. Improving the public’s common understanding of
fishable, swimmable waters called for in the Clean Water Act. current water quality in the estuary, and how it compares to the
Government, utilities, and landowners have already invested standards and classifications that benchmark progress, would
billions of dollars in an attempt to minimize and control CSOs allow EPA and the States to establish specific metrics for success
over the last 40 years and will continue to do so for the foresee- that resonate with the public. Such clarity is essential to advance
able future. Between New York and New Jersey, 28 LTCPs will be these shared waters toward the Clean Water Act’s fishable and
developed by 2020 with the goal of meeting receiving waterbody swimmable goals.
Long Term Short Term
INDICATORS Trend Trend TREND IDENTIFIERS
Dissolved Oxygen Indicates a trend that is improving in terms
Enterococcus of environmental health
Nitrogen Indicates a trend that is deteriorating in
terms of environmental health
Water Temperature
Debris Collected by Indicates that the data are not trending,
Skimmers and Booms are stable or variable
Debris Collected on Beaches I ndicates that there are insufficient data to determine
a trend or that this type of analysis is not applicable
Microplastics
Chemical Contaminants
of Emerging Concern
HEP’s adopted water quality goal is to reduce the sources of pollution so that the
waters of the Harbor Estuary will meet the fishable, swimmable goal of the Clean
Water Act, where attainable. The indicators and trends (above) are from HEP’s
State of the Estuary report that show our progress.
16 Water Quality Report 2021Figure 3.
Timeline of major Clean Water Act
investments and improvements
1970 – 1989 1970 EPA was officially established to protect human health by safeguarding the air
we breathe, water we drink and land on which we live.
1972 Clean Water Act and the establishment of the National Pollution Discharge
Elimination System (NPDES) permit program.
1984 NYCDEP developed a city-wide CSO abatement program.
1985 EPA, NYSDEC, and NJDEP initiated the Use Attainability Analysis to document
the assessment of waters in the New York Harbor Complex.
1986 NYCDEP opened the North River WWTP Facility.
1987 NYCDEP opened the Red Hook WWTP Facility.
1988 North Hudson Sewage Authority opened their Adams Street WWTP Facility.
1989 EPA’s Office of Water issued a National Combined Sewer Overflow Control Policy
(54 Federal Register 37370)
1990 – 1999 1991 Secaucus Municipal Utility Authority opened their WWTP Facility.
1992 NYCDEP entered into an Administrative Consent Order with NYSDEC.
1994 EPA issued a National CSO Policy requiring the development of CSO Long Term
Control Plans (LTCPs).
1995 All POTWs conducted 100% treatment of dry weather sewage in the Harbor Estuary.
1996 North Hudson Sewage Authority opened their West New York WWTP Facility.
1997 New York and New Jersey signed on to HEP’s Comprehensive Conservation Management Plan.
1999 NJDEP required all CSO permit holders to implement floatable controls. Congress directed
the U.S. Army Corps of Engineers to develop a long-term Comprehensive Restoration
Plan for the Hudson-Raritan Estuary.
2000 – 2009 2000 EPA’s National CSO Policy became law.
2003 New Jersey CSO permit holders completed installation of floatable controls.
2004 NJDEP’s General CSO Permit updated to require the Nine Minimum Controls.
2004
NJDEP finalized its stormwater rules and issued MS4 permits to municipalities and
industrial facilities.
2005 NYCDEP entered into a CSO consent order with NYSDEC to develop 11 waterbody/
watershed facility plans. New Jersey Harbor Dischargers Group established a
harbor-wide water monitoring program in NJ’s portion of the harbor.
New York – New Jersey Harbor & Estuary Program 17FACTORS THAT AFFECT WATER QUALITY IN THE HARBOR ESTUARY
2006 Adoption of the System-Wide Eutrophication Model (SWEM) by NYSDEC and NJDEP.
2000 – 2009
2006 NYSDEC issued a Nitrogen Consent Order in the Long Island Sound / East River
and Jamaica Bay with NYCDEP and approved by EPA.
2007 NYCDEP commissioned the Flushing Bay CSO Facility.
2010 NYCDEP published the NYC Green Infrastructure Plan.
2010 – 2019
2011 NYCDEP commissioned Paerdegat and Alley Creek Facilities.
2012 NYCDEP received approval from NYSDEC on the modified CSO consent order
which incorporates green infrastructure and commits to 11 LTCPs.
2015 NJDEP issued new CSO Permits requiring LTCPs.
2015 NYSDEC issued and MS4 permit to NYCDEP.
2017 NYCDEP received approval for the following LTCPs: Alley Creek, Westchester Creek,
Hutchinson River, Flushing Creek, Flushing Bay, Bronx River, and Gowanus Canal. NYCDEP
completed nitrogen controls in the Long Island Sound/East River Consent Order.
2018 NYCDEP received approval for the following LTCPs: Coney Island Creek and Newtown
Creek; and is pending approval for Jamaica Bay and Tributaries. New York and New Jersey
sign on to HEP’s Comprehensive Conservation Management Plan.
2020 NYCDEP submitted an LTCP for the City-wide/Open Waters. NJDEP received LTCPs from 25
2020 – 2030 CSO permittees in the state, 18 of which are within the Harbor Estuary. New Jersey’s 25 CSO
permit holders planned capital investments between $2.3-2.8 billion dollars to implement
LTCPs, based upon draft LTCPs subjected to future NJDEP review and approval.
2022 NYCDEP to complete nitrogen removal upgrades in Jamaica Bay per the 2006
Consent Order.
18 Water Quality Report 2021CHAPTER 4
Data Sources and
Assessment Methodology
Water quality monitoring provides the evidence report). Water quality data are assessed relative to
necessary for policy experts, water managers and the state standards and designated uses in 10 prin-
the public to make sound decisions regarding the cipal regional waterbodies of the Harbor Estuary
effectiveness of policies such as the NPDES CSO (see Regional Waterbody Summaries section of
Control Policy. Monitoring improves our under- this report). These principal regional waterbodies
standing of whether water quality is getting better reflect the recommendations from the five tech-
or worse over time, and to alert the community nical work groups and committees organized by
of both existing and emerging problems that HEP and past HEP publications, including the last
require action to protect human health and the Harbor-Wide Water Quality Monitoring Report. By
environment. For the purpose of this report, the combining these two considerations, this report
water quality of the Harbor Estuary is assessed provides a common basis for understanding
using federal recreational water quality recom- current data and will help advance discussion
mendations, considering the estuary relative to of appropriate policies in the shared efforts to
the standards of waters suitable for swimming and achieve the Clean Water Act goals of fishable and
other primary contact recreation (see Is the Harbor swimmable waters, where attainable8.
Estuary Swimmable and Fishable? section of this
8. This report does not serve to replace New York’s or New Jersey’s Integrated Water Quality Reports, nor is it meant to be used for compliance purposes.
New York – New Jersey Harbor & Estuary Program 19DATA SOURCES AND ASSESSMENT METHODOLOGY
Survey Regions
and Sampling Sites Methodology
There are a number of water quality monitoring programs These data were analyzed from June 1st through September
undertaken by federal, state, and municipal agencies; water and 30th for the eight years from 2010 to 201710. Figure 4 high-
wastewater utilities; and scientists and citizen scientists across lights the number of sampling stations in the Harbor Estuary
the Harbor Estuary9. and identifies the stations used in this assessment. Data from
To assess water quality, monitoring data were gathered from these sampling stations within each region were consolidated to
two comprehensive harbor-wide monitoring programs: the create one “master station” for each region and present results
NYCDEP and the NJHDG harbor surveys. Where available, data for that waterbody. Monitoring occurred on a weekly basis
from the Interstate Environmental Commission (IEC), Meadow- using grab samples within the water column. Typically, both a
lands Environmental Research Institute (MERI), Hudson River top and bottom water sample is collected, or if the waterbody is
Environmental Observing System (HRECOS), New Jersey Depart- too shallow, one meter from the bottom. Sampling locations are
ment of Environmental Protection (NJDEP), and the United typically determined by areas of concern, upstream and down-
States Geological Survey (USGS) were reviewed to further assess stream of wastewater discharges, and/or tributary entrances.
water quality as indicated by the two comprehensive harbor- Pathogenic standards are based on five samples taken within
wide programs. This report is organized by 10 regional water- a 30-day period for regulatory purposes and dissolved oxygen
bodies. These include: standards include durational concentrations, which were not
explored and a limitation to this report. This methodology does
• Bronx River and the Western Long Island Sound
not allow for true comparisons between the data and water
• East River and Harlem River
quality standards and the report should not be used for regula-
• Jamaica Bay
tory compliance. Please note that this analysis is solely focused
• Lower Passaic River and Newark Bay
on the critical recreational season (although data are collected
• Hackensack River
year-round). While water quality parameters are displayed
• Lower Raritan River
individually, reviewing parameters holistically offer important
• Lower Hudson River
insights to the status of the waterbody. Data from smaller trib-
• Upper New York Bay
utaries of the Harbor Estuary, such as the Second River or
• Arthur Kill and Kill van Kull
Newtown Creek, were not included in the assessment as these
• Lower Bay (includes Raritan Bay, Sandy Hook Bay, and the
enclosed and confined waterbodies and their existing impair-
Lower New York Bay)
ments are not as representative of the conditions in the overall
regions as the downstream sampling stations. It is important to
note that the generally poorer quality of water in these enclosed
and confined waterbodies is the subject of considerable atten-
tion by the public, water managers, and regulatory agencies. For
more information about enclosed and confined waterbodies,
the Hudson-Raritan Estuary Comprehensive Restoration Plan
(www.hudsonriver.org/article/hrecrp) details what is desirable
and achievable for these waterbodies.
9. For additional information, HEP’s 2018 State of the Estuary report utilizes the best available data from these programs to illuminate both long-term (roughly 30
years) and shorter-term trends for water quality, habitat, toxics, and other parameters. HEP’s Environmental Monitoring Plan identifies and inventories moni-
toring programs and makes data available while also identifying priorities for future environmental monitoring, including gaps in currently available data for
parameters such as pathogenic bacteria and dissolved oxygen. Past TMDL efforts and reports for the Harbor Estuary on pathogens, dissolved oxygen, nutrients,
toxic contaminants and trace metals are available at www.hudsonriver.org/article/tmdl.
10. Dates were selected as a reflection of high recreational activity, though it is noted that both New York City and the state of New Jersey define the recreational
season differently from the dates chosen for this report.
20 Water Quality Report 2021CHAPTER 4
Figure 4
Harbor Estuary Sampling Regions
Lower
Hudson
River
Hackensack
River
Bronx River &
Western Long
Island Sound
Lower
Passaic River
& Newark Bay East River &
Harlem River
Lower
Hudson
River
Upper New
Arthur Kill York Bay
& Kill van
Kull
Lower Bay
Lower
Raritan River
New York – New Jersey Harbor & Estuary Program 21DATA SOURCES AND ASSESSMENT METHODOLOGY
City of Water Day – In Your
Neighborhood Event at the
Hoboken Cove Community
Boathouse, credit: Rob Pirani
22 Water Quality Report 20201CHAPTER 5
Is the Harbor Estuary
Swimmable and Fishable?
The quality of the water in the Harbor Estuary is that Affect Water Quality in the Harbor Estuary),
described using four key parameters: pathogens, these parameters provide a holistic evaluation of
dissolved oxygen, total nitrogen, and chlorophyll-a. how fishable and swimmable are the waterbodies
To make this assessment, data from individual in the Harbor Estuary.
sampling stations from 2010-2017 were aggregated Overall water quality in the Harbor Estuary is
into a single master station for each of the 10 improving. The degree of improvements varies
regional waterbodies in the Harbor Estuary. The from parameter to parameter, where some areas of
data, primarily from June 1 through September 30, the estuary have a dissolved oxygen problem and
were compiled from two comparable harbor surveys others a pathogen problem. Conditions overall are
conducted by NYCDEP and by the NJHDG (see Data improving and we expect improvements to con-
Sources and Assessment Methodology section of tinue as NYCDEP and New Jersey municipalities
this report). collectively work to reduce combined sewer over-
To understand how swimmable our waters are, flows, improve POTW discharges, and continue to
this information was compared against federal rec- address stormwater discharges.
reational water quality recommendations for This report does not serve to replace New
pathogens, as if the estuary were considered a York’s or New Jersey’s Integrated Water Quality
bathing beach. To generally determine the quality Reports, nor is it meant to be used for compli-
of these waters for fish and wildlife (or how fishable ance purposes. State standards that inform water
they are), EPA and other nationally recognized quality trends and advancement towards the
standards for dissolved oxygen, total nitrogen, and goals of the Clean Water Act are also used when
chlorophyll-a are used. Together, along with the exploring the 10 principal geographic regions in
many factors that impact water quality (see Factors the next section, Regional Waterbody Summaries.
New York – New Jersey Harbor & Estuary Program 23IS THE HARBOR ESTUARY SWIMMABLE AND FISHABLE?
Pathogenic Bacteria
Enterococcus
The number of recreational days deemed acceptable for primary Six of the 10 regional waterbodies in the Harbor Estuary have a
contact between June 1 and September 30 is increasing over geometric mean of Enterococcus that is decreasing over time.
time in the majority of the Harbor Estuary. The data in the Lower In addition to the 30-day geometric mean value, EPA’s 2012
Passaic River and Newark Bay, Hackensack River, and the Lower recreational water quality criteria also calls for a STV, which indi-
Raritan River presents a less consistent picture. In these regions, a cate the frequency of pathogen levels found in samples. If 10% or
noticeable positive decrease was observed between 2012 through more of samples (the 10th percentile) from the sampling period
2015 followed by a negative increase in 2016 and 2017. This exceed 130 cfu/100 mL, then the water is deemed unsafe for
assessment is based on monthly averages (the 30-day geometric primary recreation like swimming. Figure 6 illustrates the
mean concentrations) of Enterococcus bacteria in the 10 regional percentiles of all discrete samples taken between June 1 and
waterbodies of the Harbor Estuary as well as how often the level September 30 of each year (2010-2017) that are found to be
of this pathogenic bacteria was found to be unsafe in individual greater than 130 cfu/100 mL. Throughout the eight years, about
samples (the Standard Threshold Value or STV). half of the 10 regional waterbodies in the estuary consistently
The 30-day geometric mean concentrations are compiled for exceed the 10th percentile. The Lower Passaic River and Newark
the master station in the 10 principal regional waterbodies for Bay and the Lower Raritan River remain over the 10th percentile
each year between 2010 and 2017. Figure 5 illustrates the percent for all the years assessed, while the Hackensack River, East River
of time, or summer days, that the geometric mean exceeds the and Harlem River, and the Bronx River and Western Long Island
threshold of 35 cfu/100 mL for safe primary contact activities11. Sound regions flucuate between just below the 10th and just
above the 20th percentiles from year to year.
Enterococcus
Percent Summer Days, 30 - Day Geomean Above 35 cfu/100 ml
% 30-day geomean
Bronx River and the 100
Western Long Island Sound
East River and Harlem River
80
Jamaica Bay
Hackensack River
60
Lower Passaic River
and Newark Bay
Arthur Kill and Kill van Kull Figure 5. Changes in Enterococci
40
30-day geometric mean analysis
Lower Raritan River
showing percent of time (days)
Lower Bay where the geometric mean
20 is greater than EPA’s 2012
Upper New York Bay Recreational Water Quality
Standard of 35 cfu/100 mL over
Lower Hudson River the summer season for each
0
2010 2011 2012 2013 2014 2015 2016 2017 sampling year.
11. It is important to note that there are discrete samples greater than 35 throughout the Harbor Estuary in each summer period. When computing the 30-day
geometric mean, the distributions of those high value samples are not necessarily greater than 35 cfu.
24 Water Quality Report 2021You can also read