Water: from clouds to planets
←
→
Page content transcription
If your browser does not render page correctly, please read the page content below
Water: from clouds to planets

                                                    Ewine F. van Dishoeck
     Leiden Observatory, Leiden University, The Netherlands; Max Planck Institute for Extraterrestrial Physics, Garching, Germany

                                                        Edwin A. Bergin
                                                     University of Michigan, USA

                                                          Dariusz C. Lis
                                                California Institute of Technology, USA

                                                      Jonathan I. Lunine
                                                       Cornell University, USA

                        Results from recent space missions, in particular Spitzer and Herschel, have lead to
                    significant progress in our understanding of the formation and transport of water from clouds
                    to disks, planetesimals, and planets. In this review, we provide the underpinnings for the
                    basic molecular physics and chemistry of water and outline these advances in the context of
                    water formation in space, its transport to a forming disk, its evolution in the disk, and finally
                    the delivery to forming terrestrial worlds and accretion by gas giants. Throughout, we pay
                    close attention to the disposition of water as vapor or solid and whether it might be subject to
                    processing at any stage. The context of the water in the solar system and the isotopic ratios
                    (D/H) in various bodies are discussed as grounding data point for this evolution. Additional
                    advances include growing knowledge of the composition of atmospheres of extra-solar gas
                    giants, which may be influenced by the variable phases of water in the protoplanetary disk.
                    Further, the architecture of extra-solar systems leaves strong hints of dynamical interactions,
                    which are important for the delivery of water and subsequent evolution of planetary systems.
                    We conclude with an exploration of water on Earth and note that all of the processes and key
                    parameters identified here should also hold for exoplanetary systems.

1.   INTRODUCTION                                                      in space, what its abundance is in various physical environ-
                                                                       ments, and how it is transported from collapsing clouds to
    With nearly 1000 exoplanets discovered to date and
                                                                       forming planetary systems. At the same time, new results
statistics indicating that every star hosts at least one planet
                                                                       are emerging on the water content of bodies in our own solar
(Batalha et al., 2013), the next step in our search for life
                                                                       system and in the atmospheres of known exoplanets. This
elsewhere in the universe is to characterize these planets.
                                                                       review attempts to synthesize the results from these differ-
The presence of water on a planet is universally accepted
                                                                       ent fields by summarizing our current understanding of the
as essential for its potential habitability. Water in gaseous
                                                                       water trail from clouds to planets.
form acts as a coolant that allows interstellar gas clouds
                                                                           Speculations about the presence of water on Mars and
to collapse to form stars, whereas water ice facilitates the
                                                                       other planets in our solar system date back many centuries.
sticking of small dust particles that eventually must grow
                                                                       Water is firmly detected as gas in the atmospheres of all
to planetesimals and planets. The development of life re-
                                                                       planets including Mercury and as ice on the surfaces of the
quires liquid water and even the most primitive cellular life
                                                                       terrestrial planets, the Moon, several moons of giant plan-
on Earth consists primarily of water. Water assists many
                                                                       ets, asteroids, comets and Kuiper Belt Objects (see review
chemical reactions leading to complexity by acting as an ef-
                                                                       by Encrenaz, 2008). Evidence for past liquid water on Mars
fective solvent. It shapes the geology and climate on rocky
                                                                       has been strengthened by recent data from the Curiosity
planets, and is a major or primary constituent of the solid
                                                                       rover (Williams et al., 2013). Water has also been detected
bodies of the outer solar system.
                                                                       in spectra of the Sun (Wallace et al., 1995) and those of
    How common are planets that contain water, and how
                                                                       other cool stars. In interstellar space, gaseous water was de-
does the water content depend on the planet’s formation his-
                                                                       tected more than 40 years ago in the Orion nebula through
tory and other properties of the star-planet system? Thanks
                                                                       its masing transition at 22 GHz (1 cm; Cheung et al., 1969)
to a number of recent space missions, culminating with the
                                                                       and water ice was discovered a few years later through its
Herschel Space Observatory, an enormous step forward has
                                                                       infrared bands toward protostars (Gillett and Forrest, 1973).
been made in our understanding of where water is formed

                                                                   1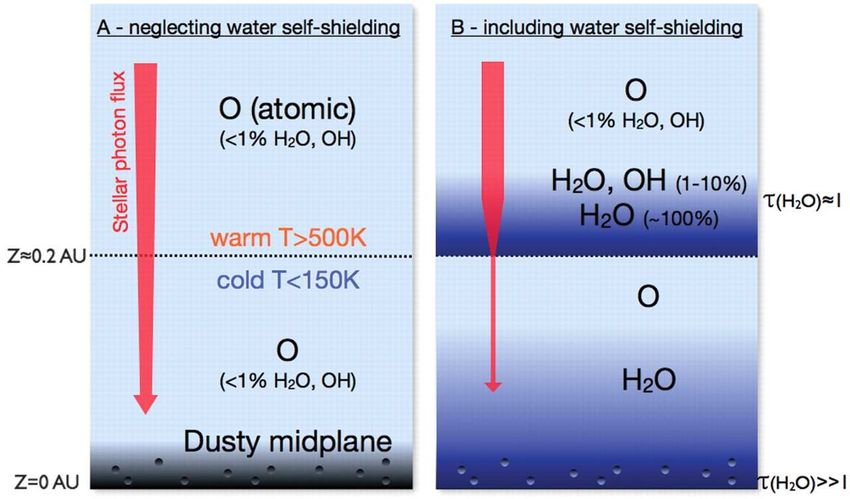
Water vapor and ice have now been observed in many star-                than those of rocks (3.2–4.4 gr cm−3 for magnesium-iron
and planet-forming regions throughout the galaxy (reviews               silicates).
by Cernicharo and Crovisier, 2005; Boogert et al., 2008;                    Clathrate hydrates are crystalline water-based solids in
Melnick, 2009; Bergin and van Dishoeck, 2012) and even                  which small non-polar molecules can be trapped inside
in external galaxies out to high redshifts (e.g., Shimonishi            ‘cages’ of the hydrogen-bonded water molecules. They can
et al., 2010; Lis et al., 2011; Weiß et al., 2013). Water is            be formed when a gas of water mixed with other species
indeed ubiquitous throughout the universe.                              condenses1 out at high pressure and has enough entropy
    On their journey from clouds to cores, the water                    to form a stable clathrate structure (Lunine and Stevenson,
molecules encounter a wide range of conditions, with tem-               1985; Mousis et al., 2010). Clathrate hydrates are found
peratures ranging from
Other collision partners such as H, He and electrons are
                                                                      generally less important. In cometary atmospheres, water
                                                                      itself provides most of the collisional excitation.
                                                                          Astronomers traditionally analyze molecular observa-
                                                                      tions through a Boltzmann diagram, in which the level pop-
                                                                      ulations are plotted versus the energy of the level involved.
                                                                      The slope of the diagram gives the inverse of the excitation
                                                                      temperature. If collisional processes dominate over radia-
                                                                      tive processes, the populations are in ‘local thermodynamic
                                                                      equilibrium’ (LTE) and the excitation temperature is equal
                                                                      to the kinetic temperature of the gas, Tex = Tkin . Generally
                                                                      level populations are far from LTE and molecules are ex-
Fig. 1.— The near-IR spectrum of the Earth showing the
                                                                      cited by collisions and de-excited by spontaneous emission,
many water vibrational bands together with CO2 . The
                                                                      leading to Tex < Tkin . The critical density roughly delin-
bands below 3 µm are due to overtones and combination
                                                                      eates the transition between these regimes: ncr = Auℓ /Cuℓ
bands and are often targeted in exoplanet searches. This
                                                                      and therefore scales with µ2uℓ νuℓ
                                                                                                       3
                                                                                                         , where A is the Einstein
spectrum was observed with the NIMS instrument on the
                                                                      spontaneous emission coefficient, µ the electric dipole mo-
Galileo spacecraft during its Earth flyby in December 1990.
                                                                      ment and ν the frequency of the transition u → ℓ. In the
From Encrenaz (2008), with permission from Annual Re-
                                                                      case of water, the combination of a large dipole moment
views, based on Drossart et al. (1993).
                                                                      (1.86 Debye) and high frequencies results in high critical
                                                                      densities of 108 –109 cm−3 for pure rotational transitions.
very broad profiles, with the much stronger ν3 band over-                 Analysis of water lines is much more complex than for
whelming the weak ν1 band. The ice profile shapes depend              simple molecules, such as CO, for a variety of reasons.
on the morphology, temperature and environment of the wa-             First, because of the large dipole moment and high frequen-
ter molecules (Hudgins et al., 1993). Crystalline water ice           cies, the rotational transitions of water are usually highly
is readily distinguished by a sharp feature around 3.1 µm             optically thick, even for abundances as low as 10−10 . Sec-
that is lacking in amorphous water ice. Libration modes of            ond, the water transitions couple effectively with mid- and
crystalline water ice are found at 45 and 63 µm (Moore and            far-infrared radiation from warm dust, which can pump
Hudson, 1994).                                                        higher energy levels. Third, the fact that the ‘backbone’
    Spectra of hydrous silicates (also known as phyllosil-            levels with KA =0 or 1 have lower radiative decay rates
icates, layer-lattice silicates or ‘clays’) show sharp fea-           than higher KA levels can lead to population ‘inversion’,
tures at 2.70–2.75 µm due to isolated OH groups and a                 in which the population in the upper state divided by its
broader absorption from 2.75–3.2 µm caused by interlay-               statistical weight exceeds that for the lower state (i.e., Tex
ered (‘bound’) water molecules. At longer wavelengths,                becomes negative). Infrared pumping can also initiate this
various peaks can occur depending on the composition; for             inversion. The result is the well-known maser phenomenon,
example, the hydrous silicate montmorillonite has bands at            which is widely observed in several water transitions in star-
49 and 100 µm (Koike et al., 1982).                                   forming regions (e.g., Furuya et al., 2003; Neufeld et al.,
    Bound-bound electronic transitions of water occur at far-         2013; Hollenbach et al., 2013). The bottom line is that ac-
UV wavelengths around 1240 Å, but have not yet been de-              curate analysis of interstellar water spectra often requires
tected in space.                                                      additional independent constraints, for example from H18   2 O
                                                                      or H172 O  isotopologues,  whose  abundances   are reduced  by
2.3.   Water excitation                                               factors of about 550 and 2500, respectively, and whose lines
   The strength of an emission or absorption line of water            are more optically thin. At infrared wavelengths, lines are
depends on the number of molecules in the telescope beam              often spectrally unresolved, which further hinders the inter-
and, for gaseous water, on the populations of the individual          pretation.
energy levels. These populations, in turn, are determined by          2.4.     Water chemistry
the balance between the collisional and radiative excitation
and de-excitation of the levels. The radiative processes in-          2.4.1.    Elemental abundances and equilibrium chemistry
volve both spontaneous emission and stimulated absorption                The overall abundance of elemental oxygen with respect
and emission by a radiation field produced by a nearby star,          to total hydrogen nuclei in the interstellar medium is esti-
by warm dust, or by the molecules themselves.                         mated to be 5.75 × 10⁻⁴ (Przybilla et al., 2008), of which
   The main collisional partner in interstellar clouds is H2 .        16–24% is locked up in refractory silicate material in the
Accurate state-to-state collisional rate coefficients, Cuℓ , of       diffuse interstellar medium (Whittet, 2010). The abundance
H2 O with both ortho- and para-H2 over a wide range of                of volatile oxygen (i.e., not tied up in some refractory form)
temperatures have recently become available thanks to a               is measured to be 3.2×10⁻⁴ in diffuse clouds (Meyer et al.,
dedicated chemical physics study (Daniel et al., 2011).               1998), so this is the maximum amount of oxygen that can

                                                                  3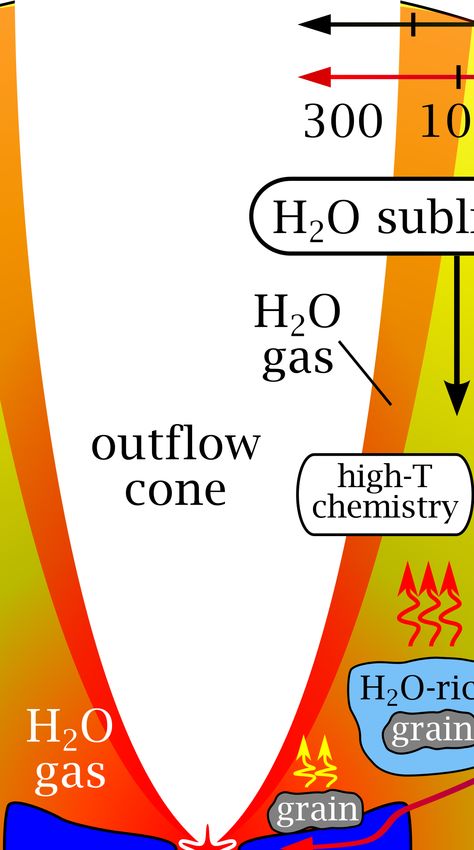
Ion                                                                    is established at densities above roughly 1013 cm−3 , when
           Molecule                   High-T                EA [K]
                                                           ~10 000
                                                                                    three body processes become significant. Such conditions
                                                           ~3 000                   are found in planetary atmospheres and in the shielded mid-
            O+                  H+      O                  ~2 000                   planes of the inner few AU of protoplanetary disks.
               H2
                                H+3                    Surface                          Under most conditions in interstellar space, however, the
                           +
                                      H hv H2                                       densities are too low for equilibrium chemistry to be es-
                 OH
                                                         s-O                        tablished. Also, strong UV irradiation drives the chem-
                      H2               OH                s-O2
                                                         s-O3
                                                                                    istry out of equilibrium, even in high-density environments,
                                e-
                                                                                    such as the upper atmospheres of planets and disks. Under
                 H2O+                                      H, H2
                                e-    H hv H2                                       these conditions, the fractional abundances are determined
                                                hv      hv O, OH
                 H2
                                                                                    by the kinetics of the two-body reactions between the vari-
                                                T
                               HCO+
                                                        s-H2O                       ous species in the gas. Figure 2 summarizes the three routes
           H3O+                 e-     H2O      hv
                                                                                    to water formation that have been identified. Each of these
                                                                                    routes dominates in a specific environment.
                      Gas Phase                      Grain Surface
                                                                                    2.4.2.   Low temperature gas-phase chemistry
 Fig. 2.— Summary of the main gas-phase and solid-state                                 In diffuse and translucent interstellar clouds with den-
 chemical reactions leading to the formation and destruction                        sities less than ∼ 104 cm−3 and temperatures below 100
 of H2 O under non-equilibrium conditions. Three different                          K, water is formed largely by a series of ion-molecule re-
 chemical regimes can be distinguished: (i) ion-molecule                            actions (e.g., Herbst and Klemperer, 1973). The network
 chemistry, which dominates gas-phase chemistry at low                              starts with the reactions O + H+            +
                                                                                                                      3 and O + H2 leading to
 T ; (ii) high-temperature neutral-neutral chemistry; and (iii)                          +         +
                                                                                    OH . The H3 ion is produced by interactions of energetic
 solid state chemistry. e stands for electron, ν for photon                         cosmic-ray particles with the gas, producing H+               +
                                                                                                                                        2 and H ,
 and s−X indicates that species X is on the grains. Simpli-                         with the subsequent fast reaction of H2 + H2 leading to H+
                                                                                                                            +
                                                                                                                                                  3.
 fied version of figure by van Dishoeck et al. (2011).                              The cosmic ray ionization rate of atomic hydrogen denoted
                                                                                    by ζH can be as high as 10−15 s−1 in some diffuse clouds,
 cycle between water vapor and ice in dense clouds. Count-                          but drops to 10−17 s−1 in denser regions (Indriolo and Mc-
 ing up all the forms of detected oxygen in diffuse clouds,                         Call, 2012; Rimmer et al., 2012). The ionization rate of H2
 the sum is less than the overall elemental oxygen abudance.                        is ζH2 ≈ 2ζH .
 Thus, a fraction of oxygen is postulated to be in some yet                             A series of rapid reactions of OH+ and H2 O+ with H2
 unknown refractory form, called UDO (‘unknown depleted                             lead to H3 O+ , which can dissociatively recombine to form
 oxygen’), whose fraction may increase from 20% in diffuse                          H2 O and OH with branching ratios of ∼0.17 and 0.83, re-
 clouds up to 50% in dense star-forming regions (Whittet,                           spectively (Buhr et al., 2010). H2 O is destroyed by pho-
 2010). For comparison, the abundances of elemental car-                            todissociation and by reactions with C+ , H+  3 and other ions
 bon and nitrogen are 3 × 10⁻⁴ and 1 × 10⁻⁴ , respectively,                         such as HCO+ . Photodissociation of H2 O starts to be effec-
 with about 2/3 of the carbon thought to be locked up in solid                      tive shortward of 1800 Å and continues down to the ioniza-
 carbonaceous material.                                                             tion threshold at 983 Å (12.61 eV), including Ly α at 1216
     For a gas in thermodynamic equilibrium (TE), the frac-                         Å. Its lifetime in the general interstellar radiation field, as
 tional abundance of water is simply determined by the el-                          given by Draine (1978), is only 40 yr.
 emental composition of the gas and the stabilities of the
                                                                                    2.4.3.   High-temperature gas-phase chemistry
 molecules and solids that can be produced from it. For
 standard interstellar abundances2 with [O]/[C]> 1, there                               At temperatures above 230 K, the energy barriers for re-
 are two molecules in which oxygen can be locked up: CO                             actions with H2 can be overcome and the reaction O + H2
 and H2 O. At high pressures in TE, the fraction of CO re-                          → OH + H becomes the dominant channel initiating wa-
 sults from the equilibrium between CO and CH4 , with CO                            ter formation (Elitzur and Watson, 1978). OH subsequently
 favored at higher temperatures. For the volatile elemen-                           reacts with H2 to form H2 O, a reaction which is exother-
 tal abundances quoted above, this results in an H2 O frac-                         mic, but has an energy barrier of ∼2100 K (Atkinson et al.,
 tional abundance of (2 − 3) × 10−4 with respect to to-                             2004). This route drives all the available gas-phase oxygen
 tal hydrogen, if the CO fractional abundance ranges from                           into H2 O, unless strong UV or a high atomic H abundance
 (0 − 1) × 10−4 . With respect to H2 , the water abundance                          convert some water back to OH and O. High-temperature
 would then be (5 − 6) × 10−4 assuming that the fraction of                         chemistry dominates the formation of water in shocks, in
 hydrogen in atomic form is negligible (the density of hydro-                       the inner envelopes around protostars, and in the warm sur-
 gen nuclei nH = n(H) + 2n(H2 )). Equilibrium chemistry                             face layers of protoplanetary disks.

2 The notation [X] indicates the overall abundance of element X in all forms,

 be it atoms, molecules or solids.

                                                                                4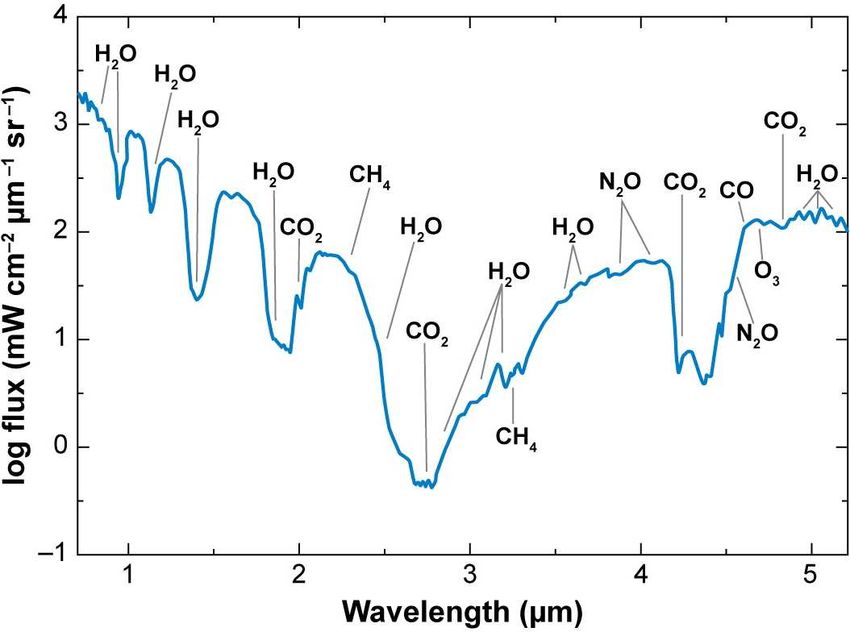
2.4.4.   Ice chemistry                                               phase abundances of H2 O as high as the original ice abun-
   The timescale for an atom or molecule to collide with a           dances. These simulations use a binding energy of 5600 K
grain and stick to it is tfo = 3 × 10⁹ /nH2 yr for normal size       for amorphous ice and a slightly higher value of 5770 K for
grains and sticking probabilities close to unity (Hollenbach         crystalline ice, derived from laboratory experiments (Fraser
et al., 2009). Thus, for densities greater than 104 cm−3 ,           et al., 2001). Thermal desorption of ices contributes to the
the time scales for freeze-out are less than a few ×105 yr,          gas-phase water abundance in the warm inner protostellar
generally smaller than the lifetime of dense cores (at least         envelopes (‘hot cores’) and inside the snow line in disks.
105 yr). Reactions involving dust grains are therefore an            2.4.5.   Water deuteration
integral part of the chemistry. Even weakly bound species,
such as atomic H, have a long enough residence time on the               Deuterated water, HDO and D2 O, is formed through the
grains at temperatures of 10–20 K to react; H2 also partic-          same processes as illustrated in Figure 2. There are, how-
ipates in some surface reactions, but remains largely in the         ever, a number of chemical processes that can enhance the
gas. Tielens and Hagen (1982) postulated that the forma-             HDO/H2 O and D2 O/H2 O ratios by orders of magnitude
tion of water from O atoms proceeds through three routes             compared with the overall [D]/[H] ratio of 2.0 × 10⁻⁵ in
involving hydrogenation of s-O, s-O2 and s-O3 , respec-              the local interstellar medium (Prodanović et al., 2010). A
tively, where s-X indicates a species on the surface. All            detailed description is given in the chapter by Ceccarelli et
three routes have recently been verified and quantified in           al., here only a brief summary is provided.
the laboratory and detailed networks with simulations have               In terms of pure gas-phase chemistry, the direct ex-
been drawn up (see Cuppen et al., 2010; Oba et al., 2012;            change reaction H2 O +HD ↔ HDO + H2 is often consid-
Lamberts et al., 2013, for summaries).                               ered in solar system models (Richet et al., 1977). In ther-
   Water ice formation is in competition with various des-           mochemical equilibrium this reaction can provide at most a
orption processes, which limit the ice build-up. At dust tem-        factor of 3 enhancement, and even that may be limited by
peratures below the thermal sublimation limit, photodesorp-          kinetics (Lécluse and Robert, 1994). The exchange reac-
tion is an effective mechanism to get species back to the gas        tion D + OH → H + OD, which has a barrier of ∼100 K
phase, although only a small fraction of the UV absorptions          (Sultanov and Balakrishnan, 2004), is particularly effective
results in desorption of intact H2 O molecules (Andersson            in high-temperature gas such as present in the inner disk
and van Dishoeck, 2008). The efficiency is about 10−3 per            (Thi et al., 2010b). Photodissociation of HDO enhances
incident photon, as determined through laboratory experi-            OD compared with OH by a factor of 2–3, which could be
ments and theory (Westley et al., 1995; Öberg et al., 2009;         a route to further fractionation.
Arasa et al., 2010). Only the top few monolayers of the                  The bulk of the deuterium fractionation in cold clouds
ice contribute. The UV needed to trigger photodesorption             comes from gas-grain processes. Tielens (1983) pointed out
can come either from a nearby star, or from the general in-          that the fraction of deuterium relative to hydrogen atoms ar-
terstellar radiation field. Deep inside clouds, cosmic rays          riving on a grain surface, D/H, is much higher than the over-
produce a low level of UV flux, ∼ 104 photons cm−2 s−1 ,             all [D]/[H] ratio, which can be implanted into molecules in
through interaction with H2 (Prasad and Tarafdar, 1983).             the ice. This naturally leads to enhanced formation of OD,
Photodesorption via X-rays is judged to be inefficient, al-          HDO and D2 O ice according to the grain-surface formation
though there are large uncertainties in the transfer of heat         routes. The high atomic D/H ratio in the gas arises from the
within a porous aggregate (Najita et al., 2001). UV pho-             enhanced gaseous H2 D+ , HD+             +
                                                                                                     2 , and D3 abundances at low
todesorption of ice is thought to dominate the production of         temperatures (≤25 K), when the ortho-H2 abundance drops
gaseous water in cold pre-stellar cores, the cold outer en-          and their main destroyer, CO, freezes out on the grains (Pa-
velopes of protostars and the outer parts of protoplanetary          gani et al., 1992; Roberts et al., 2003). Dissociative re-
disks.                                                               combination with electrons then produces enhanced D. The
   Other non-thermal ice desorption processes include cos-           enhanced H2 D+ also leads to enhanced H2 DO+ and thus
mic ray induced spot heating (which works for CO, but is             HDO in cold gas, but this is usually a minor route compared
generally not efficient for strongly bound molecules like            with gas-grain processes.
H2 O) and desorption due to the energy liberated by the re-              On the grains, tunneling reactions can have the opposite
action (called ‘reactive’ or ‘chemical’ desorption). These           effect, reducing the deuterium fractionation. For example,
processes are less well explored than photodesorption, but           the OD + H2 tunneling reaction producing HDO ice is ex-
a recent laboratory study of s-D + s-OD → s-D2 O suggests            pected to occur slower than the OH + H2 reaction leading
that as much as 90% of the product can be released into the          to H2 O ice. On the other hand, thermal exchange reac-
gas phase (Dulieu et al., 2013). The details of this mech-           tions in the ice, such as H2 O + OD → HDO + OH have
anism, which has not yet been included in models, are not            been shown to occur rapidly in ices at higher temperatures;
yet understood and may strongly depend on the substrate.             these can both enhance and decrease the fractionation. Both
   Once the dust temperature rises above ∼100 K (pre-                thermal desorption at high ice temperatures and photodes-
cise value being pressure dependent), H2 O ice thermally             orption at low ice temperatures have a negligible effect on
sublimates on timescales of years, leading to initial gas-           the deuterium fractionation, i.e., the gaseous HDO/H2 O and

                                                                 5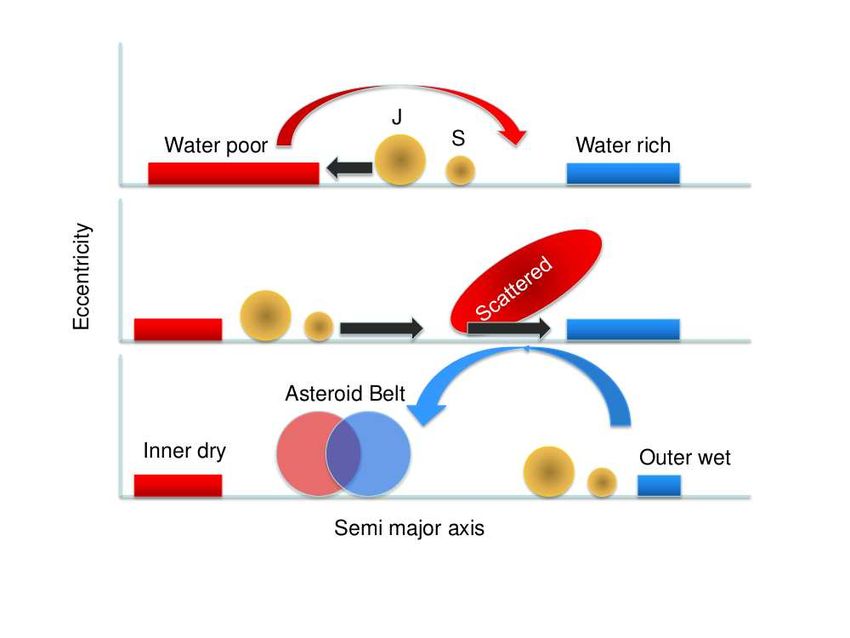
D2 O/H2 O ratios reflect the ice ratios if no other gas-phase
processes are involved.

3.   CLOUDS AND PRE-STELLAR CORES: ONSET
     OF WATER FORMATION
    In this and following sections, our knowledge of the wa-
ter reservoirs during the various evolutionary stages from
clouds to planets will be discussed. The focus is on low-
mass protostars (
the line of sight are (0.5–1)×10−4 .
                                                                         The water vapor abundance in protostellar envelopes
                                                                     is probed through spectrally-resolved Herschel-HIFI lines.
                                                                     Because the gaseous water line profiles are dominated by
                                                                     broad outflow emission (Fig. 3), this component needs to
                                                                     be subtracted, or an optically thin water isotopologue needs
                                                                     to be used to determine the quiescent water. Clues to the
                                                                     water vapor abundance structure can be obtained through
                                                                     narrow absorption and emission features in so-called (in-
                                                                     verse) P-Cygni profiles (see NGC 1333 IRAS 4A in Fig. 3).
                                                                     The analysis of these data proceeds along the same lines
                                                                     as for pre-stellar cores. The main difference is that the dust
                                                                     temperature now increases inwards, from a low value of 10–
                                                                     20 K at the edge to a high value of several hundred K in
                                                                     the center of the core (Fig. 4). In the simplest spherically
Fig. 4.— Schematic representation of a protostellar enve-            symmetric case, the density follows a power-law n ∝ r−p
lope and embedded disk with key steps in the water chem-             with p=1–2. As for pre-stellar cores, the data require the
istry indicated. Water ice is formed in the parent cloud             presence of a photodesorption layer at the edge of the core
before collapse and stays mostly as ice until the ice sub-           with a decreasing water abundance at smaller radii, where
limation temperature of ∼100 K close to the protostar is             gaseous water is maintained by the cosmic ray induced pho-
reached. Hot water is formed in high abundances in shocks            todesorption of water ice (Coutens et al., 2012; Mottram
associated with the outflow, but this water is not incorpo-          et al., 2013). Analysis of the combined gaseous water and
rated into the planet-forming disk. Figure by R. Visser,             water ice data for the same source shows that the ice/gas
adapted from Herbst and van Dishoeck (2009).                         ratio is at least 104 (Boonman and van Dishoeck, 2003).
                                                                     Thus, the bulk of the water stays in the ice in this cold part,
                                                                     at a high abundance of ∼ 10−4 as indicated by direct mea-
flow at ‘hot spots’ where the precessing jet interacts with
                                                                     surements of both the water ice and gas.
the cloud (Nisini et al., 2010). Thus, water traces the cur-
rently shocked gas at positions, which are somewhat offset           4.3.   Protostellar envelopes: the warm inner part
from the bulk of the cooler entrained outflow gas seen in
the red- and blue-shifted lobes of low-J CO lines (Tafalla              When the infalling parcel enters the radius at which
et al., 2013; Lefloch et al., 2010).                                 the dust temperature reaches ∼100 K, the gaseous water
    Determinations of the water abundance in shocks vary             abundance jumps from a low value around 10−10 to val-
from values as low as 10−7 to as high as 10−4 (see van               ues as high as 10−4 (e.g., Boonman et al., 2003; Herpin
Dishoeck et al., 2013, for summary). In non-dissociative             et al., 2012; Coutens pet al., 2012). The 100 K radius scales
shocks, the temperature reaches values of a few thousand K           roughly as 2.3 × 10¹⁴ (L/L⊙ ) cm (Bisschop et al., 2007),
and all available oxygen is expected to be driven into water         and is small,
HIFI lines can be optically thick even for H2 18 O and H17
2 O,
because of their much higher Einstein A coefficients. Sec-
ond, the physical structure of the envelope and embedded
disk on scales of a few hundred AU is not well understood
(Jørgensen et al., 2005), so that abundances are difficult
to determine since the column of warm H2 is poorly con-
strained. Compact flattened dust structures are not neces-
sarily disks in Keplerian rotation (Chiang et al., 2008) and
only a fraction of this material may be at high temperatures.
Jørgensen and van Dishoeck (2010b) and Persson et al.
(2012) measure water columns and use H2 columns derived
from continuum interferometry data on the same scales
(∼1′′ ) to determine water abundances of ∼ 10−8 −10−5 for
three low-mass protostars, consistent with the fact that the Fig. 5.— Schematic view of the history of H2 O gas and ice
bulk of the gas on these scales is cold and water is frozen. throughout a young disk at the end of the accretion phase.
From a combined analysis of the interferometric and HIFI The main oxygen reservoir is indicated for each zone. The
data, using C18 O 9–8 and 10–9 data to determine the warm percentages indicate the fraction of disk mass contained in
H2 column, Visser et al. (2013) infer water abundances of each zone. Zone 1 contains pristine H2 O formed prior to
2 × 10⁻⁵ − 2 × 10⁻⁴ in the ≥100 K gas, as expected for the star formation and never altered during the trajectory from
larger-scale hot cores. cloud to disk. In Zone 7, the ice has sublimated once and re-
The important implication of these results is that the condensed again. Thus, the ice in planet- and planetesimal-
bulk of the water stays as ice in the inner few hundred AU forming zones of disks is a mix of pristine and processed
and that only a few % of the dust may be at high enough ice. From Visser et al. (2011).
temperatures to thermally sublimate H2 O . This small frac-
tion of gas passing through high-temperature conditions for
ice sublimation is consistent with 2D models of collaps- chemistry in such a shock (Watson et al., 2007). This view
ing envelope and disk formation, which give fractions of that accretion shocks do not play a role also contrasts with
< 1 − 20% depending on initial conditions (Visser et al., the traditional view in the solar system community that all
2009, 2011; Ilee et al., 2011; Harsono et al., 2013; Hincelin ices evaporate and recondense when entering the disk (Lu-
et al., 2013). nine et al., 1991; Owen and Bar-Nun, 1993).
Figure 5 shows the history of water molecules in disks
4.4. Entering the disk: the accretion shock and history at the end of the collapse phase at tacc = 2.5 × 10⁵ yr for
of water in disks a standard model with an initial core mass of 1 M⊙ , angu-
lar momentum Ω0 = 10−14 s−1 and sound speed cs = 0.26
The fact that only a small fraction of the material within
km s−1 (Visser et al., 2011). The material ending up in zone
a few hundred AU radius is at ≥ 100 K (§ 4.3) implies that
1 is the only water that is completely ‘pristine’, i.e., formed
most of the water is present as ice and is still moving in-
as ice in the cloud and never sublimated, ending up intact
wards (Fig. 4). At some radius, however, the high-velocity
in the disk. Material ending up in the other zones contains
infalling parcels must encounter the low-velocity embed-
water that sublimated at some point along the infalling tra-
ded disk, resulting in a shock at the boundary. This shock
jectory. In zones 2, 3 and 4, close to the outflow cavity,
results in higher dust temperatures behind the shock front
most of the oxygen is in atomic form due to photodissoci-
than those achieved by stellar heating (Neufeld and Hollen-
ation, with varying degrees of subsequent reformation. In
bach 1994; see Visser et al. 2009 for a simple fitting for-
zones 5 and 6, most oxygen is in gaseous water. Material in
mula) and can also sputter ices. At early times, accretion
zone 7 enters the disk early and comes close enough to the
velocities are high and all ices would sublimate or experi-
star to sublimate. This material does not end up in the star,
ence a shock strong enough to induce sputtering. However,
however, but is transported outward in the disk to conserve
this material normally ends up in the star rather than in the
angular momentum, re-freezing when the temperature be-
disk, so it is not of interest for the current story. The bulk
comes low enough. The detailed chemistry and fractions of
of the disk is thought to be made up through layered ac-
water in each of these zones depend on the adopted physical
cretion of parcels that fall in later in the collapse process,
model and on whether vertical mixing is included (Semenov
and which enter the disk at large radii, where the shock is
and Wiebe, 2011), but the overall picture is robust.
much weaker (Visser et al., 2009). Indeed, the narrow line
widths of H182 O of only 1 km s
−1
seen in the interferomet- 5. PROTOPLANETARY DISKS
ric data (Jørgensen and van Dishoeck, 2010b) argue against
earlier suggestions, based on Spitzer data, of large amounts Once accretion stops and the envelope has dissipated,
of hot water going through an accretion shock in the embed- a pre-main sequence star is left, surrounded by a disk of
ded phase, or even being created through high-temperature gas and dust. These protoplanetary disks form the crucial
link between material in clouds and that in planetary sys-
8H 2O OH OH H 2O
tems. Thanks to the new observational facilities, combined VLT/CRIRES Herschel/PACS
Normalized flux + offset
with sophisticated disk chemistry models, the various wa-
ter reservoirs in disks are now starting to be mapped out. T Tauri T Tauri
Throughout this chapter, we will call the disk out of which
our own solar system formed the ‘solar nebula disk’. 3
5.1. Hot and cold water in disks: observations
Herbig Ae
With increasing wavelengths, regions further out and Herbig Ae
deeper into the disk can be probed. The surface layers of 2.930 2.932 2.934 65 66 67
the inner few AU of disks are probed by near- and mid-IR Wavelength (micron)
observations. Spitzer-IRS detected a surprising wealth of
highly-excited pure rotational lines of warm water at 10– Fig. 6.— Near-IR (left) and far-IR (right) spectra of a T Tau
30 µm (Carr and Najita, 2008; Salyk et al., 2008), and and a Herbig Ae disk, showing OH lines in both but H2 O
these lines have since been shown to be ubiquitous in disks primarily in disks around cooler T Tau stars. Figure by D.
around low-mass T Tauri stars (Pontoppidan et al., 2010a; Fedele, based on Fedele et al. (2011, 2013).
Salyk et al., 2011), with line profiles consistent with a disk
origin (Pontoppidan et al., 2010b). Typical water excitation
temperatures are Tex ≈450 K. Spectrally resolved ground- the water-poor (the snow line) to be probed. As shown by
based near-IR vibration-rotation lines around 3 µm show LTE excitation disk models, the largest sensitivity to the
that in some sources the water originates in both a disk location of the snow line is provided by lines in the 40–60
and a slow disk wind (Salyk et al., 2008; Mandell et al., µm region, which is exactly the wavelength range without
2012). Abundance ratios are difficult to extract from the observational facilities except for SOFIA (Meijerink et al.,
observations, because the lines are highly saturated and, in 2009). For one disk, that around TW Hya, the available
the case of Spitzer data, spectrally unresolved. Also, the IR shorter and longer wavelength water data have been used
lines only probe down to moderate height in the disk until to put together a water abundance profile across the entire
the dust becomes optically thick. Nevertheless, within the disk (Zhang et al., 2013). This disk has a dust hole within
more than an order of magnitude uncertainty, abundance ra- 4 AU, within which water is found to be depleted. The water
tios of H2 O/CO∼1–10 have been inferred for emitting radii abundance rises sharply to a high abundance at the inner
up to a few AU (Salyk et al., 2011; Mandell et al., 2012). edge of the outer disk at 4 AU, but then drops again to very
This indicates that the inner disks have high water abun- low values as water freezes out in the cold outer disk.
dances of order ∼ 10−4 and are thus not dry, at least not in The cold gaseous water reservoir beyond 100 AU is
their surface layers. The IR data show a clear dichotomy in uniquely probed by Herschel-HIFI data of the ground ro-
H2 O detection rate between disks around the lower-mass T tational transitions at 557 and 1113 GHz. Weak, but clear
Tauri stars and higher-mass, hotter A-type stars (Pontoppi- detections of both lines have been obtained in two disks,
dan et al., 2010a; Fedele et al., 2011). Also, transition disks around the nearby T Tau star TW Hya (Hogerheijde et al.,
with inner dust holes show a lack of water line emission. 2011) and the Herbig Ae star HD 100546 (Hogerheijde et
This is likely due to more rapid photodissociation by stars al., in prep.) (Fig. 3). These are the deepest integrations
with higher T∗ , and thus stronger UV radiation, in regions obtained with the HIFI instrument, with integration times
where the molecules are not shielded by dust. up to 25 hr per line. Similarly deep integrations on 5 other
Moving to longer wavelengths, Herschel-PACS spectra disks do not show detections of water at the same level, nor
probe gas at intermediate radii of the disk, out to 100 AU. do shallower observations of a dozen other disks of differ-
Far-IR lines from warm water have been detected in a few ent characteristics. One possible exception, DG Tau (Po-
disks (Rivière-Marichalar et al., 2012; Meeus et al., 2012; dio et al., 2013), is a late class I source with a well-known
Fedele et al., 2012, 2013). As for the inner disk, the abun- jet and a high X-ray flux. The TW Hya detection implies
dance ratios derived from these data are highly uncertain. abundances of gaseous water around 10−7 in the intermedi-
Sources in which both H2 O and CO far-infrared lines have ate layer of the disk, with the bulk of the oxygen in ice on
been detected (only a few) indicate H2 O/CO column den- grains at lower layers. Quantitatively, 0.005 Earth oceans
sity ratios of 10−1 , suggesting a water abundance of order of gaseous water and a few thousand oceans of water ice
10−5 at intermediate layers, but upper limits in other disks have been detected (1 Earth ocean = 1.4×1024 gr=0.00023
suggest values that may be significantly less. Again the MEarth ). While this is plenty of water to seed an Earth-like
disks around T Tauri stars appear to be richer in water than planet with water, a single Jovian-type planet formed in this
those around A-type stars (Fig. 6). ice-rich region could lock up the bulk of this water.
In principle, the pattern of water lines with wavelength Direct detections of water ice are complicated by the
should allow the transition from the gaseous water-rich to fact that IR absorption spectroscopy requires a background
light source, and thus a favorable near edge-on orientation
3 Alternative nomenclatures in the literature include ‘primordial disk’, of the disk. In addition, care has to be taken that foreground
‘presolar disk’, ‘protosolar nebula’ or ‘primitive solar nebula’. clouds do not contribute to the water ice absorption (Pon-
9distribution of water, representing the condensation or sub-
limation front of water in the disk, where the gas temper-
atures and pressures allow water to transition between the
solid and gaseous states (Fig. 7). For the solar nebula disk,
there is a rich literature on the topic (Hayashi, 1981; Sas-
selov and Lecar, 2000; Podolak and Zucker, 2004; Lecar
et al., 2006; Davis, 2007; Dodson-Robinson et al., 2009).
Within our modern astrophysical understanding, this divid-
ing line in the midplane is altered when viewed within the
framework of the entire disk physical structure. There are a
number of recent models of the water distribution that elu-
cidate these key issues (Glassgold et al., 2009; Woitke et al.,
2009b; Bethell and Bergin, 2009; Willacy and Woods, 2009;
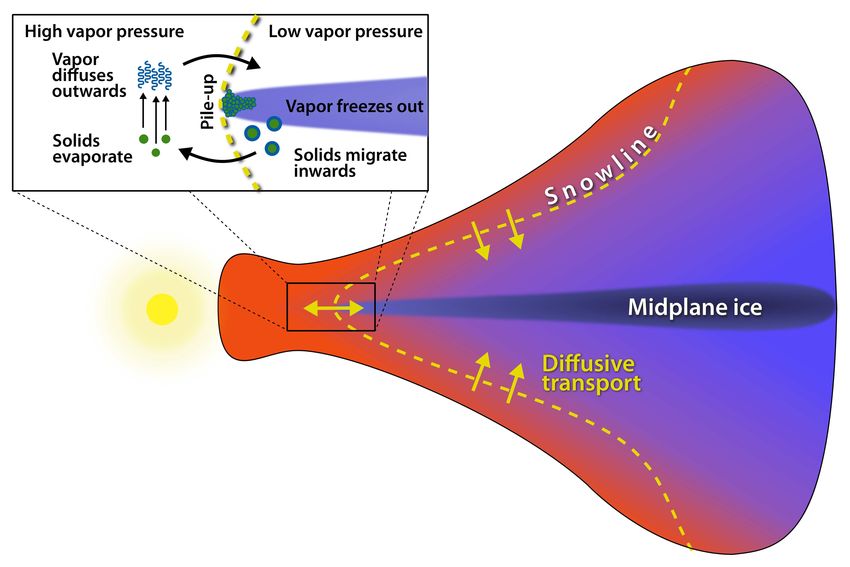
Fig. 7.— Cartoon illustrating the snow line as a function of Gorti et al., 2011; Najita et al., 2011; Vasyunin et al., 2011;
radius and height in a disk and transport of icy planetesimals Fogel et al., 2011; Walsh et al., 2012; Kamp et al., 2013).
across the snowline. Diffusion of water vapor from inner to
outer disk followed by freeze-out results in pile-up of ice 5.2.1. General distribution of gaseous water
just beyond the snowline (the cold finger effect). Figure by Fig. 8 shows the distribution of water vapor in a typi-
M. Persson, based on Meijerink et al. (2009); Ciesla and cal kinetic chemical disk model with radius R and height
Cuzzi (2006). z. The disk gas temperature distribution is crucial for the
chemistry. It is commonly recognized that dust on the disk
surface is warmer than in the midplane due to direct stellar
toppidan et al., 2005). The 3 µm water ice band has been photon heating (Calvet et al., 1992; Chiang and Goldreich,
detected in only a few disks (Terada et al., 2007; Honda 1997). Furthermore the gas temperature is decoupled from
et al., 2009). To measure the bulk of the ice, one needs the dust in the upper layers due to direct gas heating (e.g.,
to go to longer wavelengths, where the ice features can be Kamp and Dullemond, 2004). There are roughly 3 areas
seen in emission. Indeed, the crystalline H2 O features at 45 where water vapor is predicted to be abundant and there-
or 60 µm have been detected in several sources with ISO- fore possibly emissive (see also discussion in Woitke et al.,
LWS (Malfait et al., 1998, 1999; Chiang et al., 2001) and 2009a). These 3 areas or “regions” are labelled with coor-
Herschel-PACS (McClure et al., 2012, Bouwman et al., in dinates (radial and vertical) that are specific to the physical
prep). Quantitatively, the data are consistent with 25–50% structure (radiation field, temperature, density, dust proper-
of the oxygen in water ice on grains in the emitting layer. ties) of this model. Different models (with similar dust- and
The ISO-LWS far-infrared spectra also suggested a gas-rich conditions) find the same general structure, but not
strong signature of hydrated silicates in at least one tar- at the exact same physical location.
get (Malfait et al., 1999). Newer Herschel-PACS data show Region 1 (R = inner radius to 1.5 AU; z/R < 0.1): this
no sign of such a feature in the same target (Bouwman, priv. region coincides with the condensation/sublimation front in
comm.). An earlier claim of hydrated silicates at 2.7 µm the midplane at the snow line. Inside the snow line wa-
in diffuse clouds has now also been refuted (Whittet et al., ter vapor will be abundant. Reaction timescales imposed
1998; Whittet, 2010). Moreover, there is no convincing by chemical kinetics limit the overall abundance depend-
detection of any mid-infrared feature of hydrated silicates ing on the gas temperature. As seen in Fig. 8, if the gas
in hundreds of Spitzer spectra of T Tauri (e.g., Olofsson temperature exceeds ∼ 400 K then the midplane water will
et al., 2009; Watson et al., 2009), Herbig Ae (e.g., Juhász be quite abundant, carrying all available oxygen not locked
et al., 2010) and warm debris (e.g., Olofsson et al., 2012) in CO and refractory grains. If the gas temperature is be-
disks. Overall, the strong observational consensus is that low this value, but above the sublimation temperature of
the silicates prior to planet formation are ‘dry’. ∼ 160 K, then chemical kinetics could redistribute the oxy-
5.2. Chemical models of disks gen towards other species. During the early gas- and dust-
rich stages up to a few Myr, this water vapor dominated
The observations of gaseous water discussed in § 5.1 in- region will persist and is seen in nearly all models. How-
dicate the presence of both rotationally hot Tex ≈ 450 K ever, as solids grow, the penetrating power of UV radiation
and cold (Tex < 50 K) water vapor, with abundances of is increased. Since water vapor is sensitive to photodisso-
∼ 10−4 and much lower values, respectively. Based on the ciation by far-UV, this could lead to gradual decay of this
chemistry of water vapor discussed in § 2.4, we expect it layer, which would be consistent with the non-detection of
to have a relatively well understood distribution within the water vapor inside the gaps of a small sample of transition
framework of the disk thermal structure, potentially modi- disks (e.g., Pontoppidan et al., 2010a; Zhang et al., 2013).
fied by motions of the various solid or gaseous reservoirs. Region 2 (R > 20 AU; surface layers and outer disk
This is broadly consistent with the observations. midplane): In these disk layers the dust temperature is uni-
Traditionally, the snow line plays a critical role in the
100.5
formly below the sublimation temperature of water. Fur-
K
0K
200
thermore at these high densities (n > 106 cm−3 ) atoms
150
and molecules freeze out on dust grains on short timescales 0.4
log (H2O)
(§2.4). Under these circumstances, in the absence of non-
thermal desorption mechanisms, models predict strong
freeze-out with the majority of available oxygen present 0.3
on grains as water ice. Much of this may be primordial
z/R
water ice supplied by the natal cloud (Visser et al., 2011,
Fig. 5). 0.2
K
0K
200
The detection of rotationally cold water vapor emission 150
in the outer disk of TW Hya demonstrates that a tenuous
layer of water vapor is present and that some non-thermal 0.1 10.7
desorption process is active (Hogerheijde et al., 2011). The
10.7
leading candidate is photodesorption of water ice (Dominik ice
0.0
et al., 2005; Öberg et al., 2009), as discussed in § 2.4.4, 1 10 100
particularly given the high UV luminosities of T Tauri stars R [AU]
(Yang et al., 2012a). This UV excess is generated by ac-
cretion and dominated by Lyα line emission (Schindhelm Fig. 8.— Abundance of gaseous water relative to total
et al., 2012). hydrogen as a function of radial distance, R, and rela-
Once desorbed as OH and H2 O, the UV radiation then tive height above the midplane, z/R, for a disk around
also destroys the water vapor molecules leading to a bal- an A-type star (T∗ =8600 K). Three regions with high H2 O
ance between these processes and a peak abundance near abundance can be distinguished. Regions 1 and 3 involve
(1 − 3) × 10−7 (Dominik et al., 2005; Hollenbach et al., high-temperature chemistry, whereas region 2 lies beyond
2009). In general most models exhibit this layer, which the snow line and involves photodesorption of water ice.
is strongly dependent on the location and surface area of The white contours indicate gas temperatures of 200 and
ice-coated grains (i.e. less surface area reduces the effec- 1500 K, whereas the red contour shows the nH = 5 × 10¹⁰
tiveness of photodesorption). Direct comparison of mod- cm−3 density contour. From Woitke et al. (2009b).
els with observations finds that the amount of water va-
por predicted to be present exceeds the observed emission
(Bergin et al., 2010; Hogerheijde et al., 2011). This led to support water formation via the high-temperature chemistry
the suggestion that the process of grain growth and sedi- (i.e., region 3 goes out to larger radii than region 1). Thus
mentation could operate to remove water ice from the UV the water zone on the disk surface presents the largest sur-
exposed disk surface layers. This is consistent with spec- face area and it is this water that is readily detected with
troscopic data of the TW Hya scattered light disk, which current astronomical observations of high-lying transitions
do not show water ice features in the spectrum originating of H162 O with Spitzer and Herschel. The snow line in the
from this layer (Debes et al., 2013). However, further fine midplane is thus potentially hidden by the forest of water
tuning of this settling mechanism is needed (Dominik and transitions produced by the hot chemistry on the surface.
Dullemond, in prep., Akimkin et al., 2013). An alternative There are some key dependences and differences which
explanation may be a smaller dust disk compared with the can be highlighted. One important factor is the shape
gas disk (Qi et al., 2013). of the UV radiation field. In general, models that use a
Region 3 (R < 20 AU; z/R > 0.1): Closer to the ex- scaled interstellar UV radiation field, for example based
posed disk surface the gas and dust become thermally de- on FUSE/IUE/HST observations of the UV excess (Yang
coupled. The density where this occurs depends on the rel- et al., 2012a), neglect the fact that some molecules like
ative amount of dust grains in the upper atmosphere, which H2 and CO require very energetic photons to photodisso-
may be altered by dust coagulation and settling (Jonkheid ciate, which are not provided by very cool stars. A better
et al., 2004; Nomura et al., 2007) and on the thermal ac- approach is to take the actual stellar continua into account
commodation of the dust gas interaction (Burke and Hol- (van Dishoeck et al., 2006), with UV excess due to accre-
lenbach, 1983). In these decoupled layers Tgas ≫ Tdust , tion added where appropriate (van Zadelhoff et al., 2003).
and when the gas temperature exceeds a few hundred K the A very important factor in this regard is the relative strength
neutral-neutral gas-phase pathways for water formation be- of the Lyα line to the overall UV continuum. Observations
come efficient, leading to water abundances of order 10−5 find that Lyα has nearly an order of magnitude more UV
(Fig. 8). flux than the stellar FUV continuum in accreting sources
More directly, the disk surface is predicted to be wa- (Bergin et al., 2003; Schindhelm et al., 2012). In addi-
ter vapor rich at gas temperatures & few hundred K and tion because of the difference in scattering (Lyα isotropic
dust temperatures ∼100 K. Indeed, there should exist sur- from H atom surface; UV continuum anisotropic from dust
face layers at radii where the midplane temperature is suffi- grains), Lyα will dominate the radiation field deeper into
ciently low to freeze water vapor, but where the surface can the disk (Bethell and Bergin, 2011).
11drift is known to be highly effective at a few AU for rocks
up to meter size (or mm size further out in the disk) (e.g.,
Weidenschilling and Cuzzi, 1993). This drift of icy plan-
etesimals can be a source of water vapor enrichment inside
the snow line (Ciesla and Cuzzi, 2006). The astrophysical
signature of this phenomenon would be the presence of wa-
ter vapor in the inner disk with an abundance greater than
the stellar oxygen abundance, because the planetesimals are
hydrogen-poor, that is, the main volatile species, H2 , is not
present in water-rich planetesimal ices. Some of this hot
water can diffuse outwards again and re-condense just out-
side the snowline (the cold finger effect. Fig. 7) which in-
Fig. 9.— Cartoon illustrating the water self-shielding creases the density of solids by a factor of 2–4 and thereby
mechanism and the resulting vertical stratification of O and assists planet formation (Stevenson and Lunine, 1988). Al-
H2 O. Inclusion of water self-shielding in the upper lay- ternatively, icy grains can be trapped in pressure bumps
ers leads to a ‘wet’ warm layer. From Bethell and Bergin where they can grow rapidly to planetesimals before mov-
(2009). ing inward (e.g., van der Marel et al., 2013).
6. WATER IN THE OUTER SOLAR SYSTEM
Most models find the presence of this warm water layer
in dust-dominated disks. However, Bethell and Bergin In the standard model of the disk out of which our solar
(2009) suggest that water can form in such high abundances system formed, the snow line was at 2.7 AU at the end of
in the surface layer that it mediates the transport of the en- the gas-rich phase (Hayashi, 1981). This snow line likely
ergetic UV radiation by becoming self-shielding (Fig. 9). moved inward from larger distances in the early embedded
If this is the case, then the surface water would survive for phase (Kennedy and Kenyon, 2008). Thus, it is no surprise
longer timescales, because it is somewhat decoupled from that water ice is a major constituent of all solar system bod-
the dust evolution. As a consequence water and chemistry ies that formed and stayed beyond the snow line. Never-
in the midplane might be protected even as the FUV absorb- theless, their water ice content, as measured by the mass
ing dust grains settle to the midplane. in ice with respect to total ice+rock mass can differ sub-
Additional factors of importance for the survival of this stantially, from few hundred K) layers exist on disk surfaces the present-day solar system. In § 8, possible mechanisms
(Bruderer et al., 2012). However, as the gas disk dissipates, of supplying water from these reservoirs to the terrestrial
the accretion rate onto the star decays on timescales of a planet zone will be discussed.
few Myr. Thus the UV luminosity that is associated with
this accretion declines and the disk will cool down, cut- 6.1. Outer asteroid belt
ting off the production of water from the hot (T & 400 K) Since the outer asteroid belt is located outside the
gas-phase chemistry on the exposed surface. In addition, Hayashi snow line, it provides a natural reservoir of icy
as shown by Glassgold et al. (2009) and Ádámkovics et al. bodies in the solar system. This part of the belt is domi-
(2013), the formation of surface water requires the pres- nated by so-called C, P and D class asteroids with sizes up
ence of H2 to power the initiating reaction. Finally, vertical to a few 100 km at distances of ∼3, 4 and ≥4 AU, respec-
mixing through turbulence or disk winds can bring water tivily, characterized by their particularly red colors and very
ice from the lower to the upper layers where the ice sub- low albedos, < ∼ 0.1 (Bus and Binzel, 2002). Because of their
limates and adds to the oxygen budget and water emission spectroscopic similarities to the chemically primitive car-
(Heinzeller et al., 2011). bonaceous chondrites found as meteorites on Earth, C-type
asteroids have been regarded as largely unaltered, volatile-
5.2.2. Planetesimal formation and water ice transport
rich bodies. The P- and D-types may be even richer in
The dust particles in disks collide and grow, with water organics.
ice mantles generally thought to help the coagulation pro- The water content in these objects has been studied
cesses. The evolution of dust to pebbles, rocks and plan- though IR spectroscopy of the 3 µm band. In today’s so-
etesimals (1–100 km bodies, the precursors of comets and lar system, any water ice on the surface would rapidly sub-
asteroids) is described in the chapters by Testi et al. and limate at the distance of the belt, so only water bonded to
Johansen et al.. The disk models cited above do not take the rocky silicate surface is expected to be detected. Hy-
into account transport of ice-rich planetesimals from the drated minerals can be formed if the material has been in
cold outer to the warm inner disk, even though such radial contact with liquid water. The majority of the C-type aster-
12oids show hydrated silicate absorption, indicating that they small ice particles evenly distributed on the surface. A sub- indeed underwent heating and aqueous alteration episodes surface ice reservoir could also be present if Themis un- (Jones et al., 1990, and refs. therein). However, only 10% derwent differentiation resulting in a rocky core and an ice of the P and D-type spectra show weak water absorption, mantle. Jewitt and Guilbert-Lepoutre (2012) find no di- suggesting that they have largely escaped this processing rect evidence of outgassing from the surface of Themis or and that the abundance of hydrated silicates gradually de- Cybele with a 5σ upper limit for the water production rate clines in the outer asteroid belt. Nevertheless, asteroids that 1.3×1028 mol s−1 , assuming a cometary water-to-CN mix- do not display water absorption on their surfaces (mostly ing ratio. They conclude that any ice that exists on these located beyond 3.5 AU) may still retain ices in their inte- bodies should be relatively clean and confined to a
comets formed in the Jupiter-Neptune region and were sub-              ton, like Pluto, has a bulk density and hence ice-rock ratio
sequently ejected into the Oort cloud by gravitational inter-          consistent with what is expected for a solar nebula disk in
actions with the giant planets. In reality, the picture is sig-        which CO dominated over CH4 . Its water fraction is about
nificantly more complex due to migration of the giant plan-            15–35%. At this large distance from the Sun, N2 can also
ets in the early solar system (see below). In addition, recent         be frozen out and Triton’s spectrum is indeed dominated
simulations (Levison et al., 2010) suggest that the Sun may            by N2 ice with traces of CH4 and CO ices; the water sig-
have captured comets from other stars in its birth cluster. In         natures are much weaker than on other satellites (Cruik-
this case, a substantial fraction of the Oort-cloud comets,            shank et al., 2000). The smaller Trans Neptunion Objects
perhaps in excess of 90%, may not even have formed in the              (TNOs) (
Jupiter is not known. The measured abundance of gaseous                dation states existed in the solar nebula disk at different
water—the primary carrier of oxygen in the Jovian atmo-                times and locations. For example, the driest rocks, the en-
sphere since there is little CO—provides only a lower limit            statite chondrites, are thought to have come from parent
since the troposphere at about 100 mbar is a region of mini-           bodies formed inward of all the other parent bodies, and
mum temperature (∼110 K for Jupiter) and therefore acts as             their mineralogy suggests reducing conditions—consistent
a cold trap where water can freeze out. Thus, the amount of            with a depleted water vapor abundance—in the region of the
gaseous water is strongly affected by condensation and rain-           nebula where they formed (Krot et al., 2000). One recent
out associated with large-scale advective motions (Show-               model of the early evolution of Jupiter and Saturn hypoth-
man and Dowling, 2000), meteorological processes (Lunine               esizes that these giant planets moved inward significantly
and Hunten, 1987), or both. The Galileo probe fell into a              during the late stages of their formation, reaching 1.5 AU
so-called ‘hot spot’ (for the excess brightness observed in            in the case of Jupiter (Walsh et al., 2011), almost certainly
such regions at 5 µm wavelengths), with enhanced trans-                inward of the snow line (see § 8.2). If planetesimals in this
parency and hence depleted in water, and is thus not rep-              region accreted volatiles on refractory organic and silicate
resentative of the planet as a whole. The water abundance,             surfaces which were then incorporated into Jupiter, the lat-
less than 1/10 the solar value in the upper atmosphere, was            ter would appear carbon-rich and oxygen-depleted. How-
observed to be higher at higher pressures, toward the end              ever, temperatures in that region may not have been low
of the descent (Roos-Serote et al., 2004). The sparseness of           enough to provide sufficient amounts of the more volatile
the measurements made it impossible to know whether the                phases. A second possibility is that Jupiter’s migration scat-
water had ‘leveled out’ at a value corresponding to 1/3 solar          tered these water poor planetesimals to the colder outer so-
or would have increased further had the probe returned data            lar system, where they trapped noble gases and carbon-and
below the final 21 bar level.                                          nitrogen-bearing species at lower temperature—but water
    As noted above, predictions for standard models of plan-           ice, already frozen out, was not available.
etesimal accretion—where volatiles are either adsorbed on,                 In order to test such models, one must directly deter-
or enclathrated in, water ice—give oxygen abundances 3–                mine the abundance of oxygen-bearing species in Jupiter
10 times solar in the Jovian deep interior. Although atmo-             and if possible, in Saturn. The case of Saturn is similar to
spheric explanations for the depleted water abundance in               that of Jupiter in the sense that the carbon excess as derived
Jupiter are attractive, one must not rule out the possibility          from CH4 spectroscopy is as expected, but again no reliable
that water truly is depleted in the Jovian interior—that is,           oxygen abundance can be determined. Under the conditions
the oxygen-to-hydrogen ratio in Jupiter is less enriched than          present in the Jovian envelope at least (if not its core), water
the carbon value at 4±2 times solar. A motivation for mak-             will dominate regardless of the initial carbon oxidation state
ing such a case is that at least one planet with a C/O>1—a             in the solar nebula. NASA’s Juno mission to Jupiter will
‘carbon-rich planet’—has been discovered (Madhusudhan                  measure the water abundance down to many tens of bars
et al., 2011a), companion to the star WASP12a with a C/O               via a microwave radiometer (MWR) (Janssen et al., 2005).
ratio of 0.44, roughly solar. One explanation is that the por-         Complementary to the MWR is a near-infrared spectrome-
tion of this system’s protoplanetary disk was somehow de-              ter JIRAM (Jovian Infrared Auroral Mapper), that will ob-
pleted in water at the time the planet formed and acquired             tain the water abundance in the meteorological layer (Adri-
its heavy element inventory (Madhusudhan et al., 2011b).               ani et al., 2008). The two instruments together will be able
    Prior to this discovery, the possibility of a carbon-rich          to provide a definitive answer for whether the water abun-
Jupiter was considered on the basis of the Galileo results             dance is below or above solar, and in the latter case, by how
alone by Lodders (2004) who proposed that in the early so-             much, when Juno arrives in 2016. Juno will also determine
lar system formation the snow line might have been fur-                the mass of the heavy element core of Jupiter, allowing for
ther from the Sun than the point at which Jupiter formed,              an interpretation of the significance of the envelope water
and volatiles adhering to solid organics rather than water             abundance in terms of total oxygen inventory.
ice were carried into Jupiter.                                             There is no approved mission yet to send a probe into
    Mousis et al. (2012) looked at the possibility that Jupiter        Saturn akin to Galileo. However, the Cassini Saturn Or-
may have acquired planetesimals from an oxygen-depleted                biter will make very close flybys of Saturn starting in 2016,
region by examining element-by-element the fit to the                  similar to what Juno will do at Jupiter. Unfortunately, a
Galileo probe data of two contrasting models: one in which             microwave radiometer akin to that on Juno is not present
the planetesimal building blocks of Jupiter derived from a             on Cassini, but a determination of the heavy element core
disk with C/O= 1/2 (roughly, the solar value), and the other           mass of Saturn may be obtained from remote sensing. In
in which C/O=1. Within the curent error bars, the two cases            summary, the fascinating possibility that Jupiter and Saturn
cannot be distinguished. However, any determination of the             may have distinct oxygen abundances because they sam-
deep oxygen abundance in Jupiter yielding an enrichment                pled at different times and to differing extents regions of
of less than 2 times solar would be a strong argument in fa-           the solar nebula disk heterogeneous in oxygen (i.e., water)
vor of a water depletion, and thus high C/O ratio, at certain          abundance is testable if the bulk oxygen abundances can be
places and times in the solar nebula disk.                             measured.
    Are such depletions plausible? A wide range of oxi-

                                                                  15
You can also read