A 14.5-million-year record of East Antarctic Ice Sheet fluctuations from the central Transantarctic Mountains, constrained with cosmogenic 3He ...
←
→
Page content transcription
If your browser does not render page correctly, please read the page content below
The Cryosphere, 14, 2647–2672, 2020
https://doi.org/10.5194/tc-14-2647-2020
© Author(s) 2020. This work is distributed under
the Creative Commons Attribution 4.0 License.

A 14.5-million-year record of East Antarctic Ice Sheet fluctuations
from the central Transantarctic Mountains, constrained with
cosmogenic 3He, 10Be, 21Ne, and 26Al
Allie Balter-Kennedy1,2, , Gordon Bromley2,3 , Greg Balco4 , Holly Thomas1 , and Margaret S. Jackson3
1 School of Earth and Climate Sciences, University of Maine, Orono, Maine, USA
2 Climate Change Institute, University of Maine, Orono, Maine, USA
3 Geography, National University of Ireland Galway, Galway, Ireland
4 Berkeley Geochronology Center, Berkeley, California, USA

 previously published under the name Allie Balter

Correspondence: Allie Balter-Kennedy (abalter@ldeo.columbia.edu)

Received: 17 February 2020 – Discussion started: 2 March 2020
Revised: 5 July 2020 – Accepted: 15 July 2020 – Published: 20 August 2020

Abstract. The distribution of moraines in the Transantarctic       1   Introduction
Mountains affords direct constraint of past ice-marginal po-
sitions of the East Antarctic Ice Sheet (EAIS). Here, we de-       In this paper, we describe glacial deposits preserved in the
scribe glacial geologic observations and cosmogenic-nuclide        central Transantarctic Mountains (TAM; Fig. 1) that provide
exposure ages from Roberts Massif, an ice-free area in the         unambiguous evidence for the presence of the East Antarc-
central Transantarctic Mountains. We measured cosmogenic           tic Ice Sheet (EAIS), in a configuration similar to today, for
3 He, 10 Be, 21 Ne, and 26 Al in 168 dolerite and sandstone        periods of the middle Miocene, late Pliocene, and early to
boulders collected from 24 distinct deposits. Our data show        Middle Pleistocene. Our chronology therefore provides ge-
that a cold-based EAIS was present, in a configuration sim-        ologic targets for ice volume reconstructions derived from
ilar to today, for many periods over the last ∼ 14.5 Myr, in-      marine proxy records and sea-level estimates. Current esti-
cluding the mid-Miocene, late Pliocene, and early to Mid-          mates of pre-Pleistocene EAIS ice volume are based largely
dle Pleistocene. Moraine ages at Roberts Massif increase           on δ 18 O of benthic foraminifera (e.g., Shevenell et al., 2008),
with distance from, and elevation above, the modern ice mar-       which primarily records global temperature and ice volume,
gin, which is consistent with a persistent EAIS extent during      and far-field sea-level indicators (e.g., Miller et al., 2005),
glacial maxima and slow, isostatic uplift of the massif itself     such as raised shorelines (e.g., Rovere et al., 2014). These
in response to trough incision by outlet glaciers. We also em-     proxy records (e.g., Holbourn et al., 2013), along with strati-
ploy the exceptionally high cosmogenic-nuclide concentra-          graphic evidence from ice-proximal sediment cores (Levy et
tions in several boulders, along with multi-isotope measure-       al., 2016) and modeling studies (Gasson et al., 2016), sug-
ments in sandstone boulders, to infer extremely low erosion        gest that during the middle Miocene the EAIS oscillated be-
rates ( 5 cm Myr−1 ) over the period covered by our record.       tween states both larger and smaller than present in response
Although our data are not a direct measure of ice volume,          to fluctuations in CO2 and temperature. After ∼ 14 Ma, such
the Roberts Massif glacial record indicates that the EAIS was      proxy records suggest a general presence of the EAIS but
present and similar to its current configuration during at least   with potentially significant retreat during past warm peri-
some periods when the global temperature was believed to be        ods, such as the mid-Pliocene warm period (3.3–3.0 Ma; e.g.,
warmer and/or atmospheric CO2 concentrations were likely           Dutton et al., 2015, and references therein), when tempera-
higher than today.                                                 tures are thought to have been 2–3 ◦ C warmer than prein-
                                                                   dustrially (Haywood et al., 2013) and CO2 was ∼ 400 ppm
                                                                   (Pagani et al., 2010; Seki et al., 2010). Although valuable

Published by Copernicus Publications on behalf of the European Geosciences Union.
2648                                                  A. Balter-Kennedy et al.: A 14.5-million-year record of EAIS fluctuations

                                                                       glacial flood deposits in the Coombs Hills resulting from
                                                                       wet-based glaciation afford 3 He ages of between ∼ 8.5 and
                                                                       10.5 Myr, assuming zero erosion, and as much as ∼ 15 Myr
                                                                       if erosion rates of 0.03–0.06 m Myr−1 are applied (Margeri-
                                                                       son et al., 2005). In the same region, 40 Ar and 39 Ar ages on
                                                                       in situ ash layers interbedded with cold-based ablation tills in
                                                                       the Asgard Range date the transition from temperate to po-
                                                                       lar glaciation to between 15 and 13.6 Ma (Sugden and Den-
                                                                       ton, 2004). The preservation of such deposits over the last
                                                                       ∼ 15 Myr has been invoked as evidence for persistent polar
                                                                       desert conditions and by extension the presence of the EAIS
                                                                       since that time (Denton et al., 1993).
                                                                          Chronologic constraints on the overlying cold-based de-
                                                                       posits come primarily from surface-exposure dating, which
                                                                       has been employed at several locations throughout the TAM,
                                                                       including southern Victoria Land (Brook et al., 1995, 1993;
                                                                       Brown et al., 1991; Bruno et al., 1997; Ivy-Ochs et al.,
                                                                       1995; Strasky et al., 2009), Beardmore (Ackert and Kurz,
                                                                       2004) and Law (Kaplan et al., 2017) glaciers in the central
                                                                       TAM, and Scott (Spector et al., 2017) and Reedy (Brom-
                                                                       ley et al., 2010; Todd et al., 2010) glaciers in the south-
                                                                       ern TAM. Approximately 30 previously published expo-
                                                                       sure ages (see ICE-D:ANTARCTICA online database, http:
                                                                       //antarctica.ice-d.org, last access: 22 July 2020) indicate the
                                                                       preservation of cold-based glacial landforms in Antarctica
                                                                       that are at least 5 Ma in age. For example, a prominent
                                                                       boulder moraine in the Dominion Range, upper Beardmore
                                                                       Glacier, was dated with 3 He to 5.2 Ma (Ackert and Kurz,
                                                                       2004). Similarly, 10 Be ages from erratic boulders at Reedy
Figure 1. Location of Roberts Massif. The massif lies at the head      Glacier suggest deposition of the “Reedy E drift” at >∼ 5 Ma
of the Shackleton Glacier, which flows from the polar plateau of the
                                                                       (Bromley et al., 2010).
East Antarctic Ice Sheet at ∼ 2500 m elevation, down through the
Transantarctic Mountains, to the Ross Ice Shelf near sea level. Base
                                                                          To further constrain the pre-Pleistocene configurations of
map generated from the MODIS MOA (Scambos et al., 2007) and            the EAIS, we exploit the extensive moraine record at Roberts
Antarctic Digital Database via the Quantarctica compilation (http:     Massif, a high-elevation site in the central TAM, where stud-
//quantarctica.npolar.no, last access: 22 July 2020).                  ies on nearby nunataks have suggested that old (> 5 Ma) de-
                                                                       posits exist (e.g., Ackert and Kurz, 2004). Roberts Massif
                                                                       (86.374◦ S, 177.135◦ W) is a ∼ 100 km2 ice-free area situ-
for elucidating long-term trends in sea-level change, these            ated at the head of Shackleton Glacier, an outlet of the EAIS
proxy records do not directly record the volume of specific            (Fig. 1). The massif is bounded to the south and east by the
ice sheets. In contrast, glacial deposits from ice-free areas of       EAIS, to the north and west by the upper Shackleton Glacier,
Antarctica itself provide direct geologic evidence for past ice        and to the northeast by an unnamed branch of Zaneveld
sheet variability.                                                     Glacier. Today, the EAIS at Roberts Massif is cold based
   Previous geomorphic and glacial chronologic studies in              and the environment is that of a polar desert. We employed
the Transantarctic Mountains (TAM), a ∼ 3000 km long to-               cosmogenic 3 He, 21 Ne, 10 Be, and 26 Al to date moraines at
pographic barrier through which outlet glaciers of the EAIS            Roberts Massif to create a comprehensive glacial geologic
drain into the Ross Embayment (Fig. 1), suggest the presence           record for this site comprising 168 samples. Our record af-
of pre-Pleistocene glacial deposits. Two distinct categories of        fords an unprecedented view of EAIS variability in the cen-
deposits characterize the Antarctic glacial geologic record:           tral TAM over the last ∼ 15 Myr and provides valuable new
basal tills of the Sirius Group (e.g., Mayewski, 1975; Mercer,         insight into EAIS behavior during periods of the Miocene
1972), which indicate at least one period of temperate glacia-         and Pliocene, when temperatures and atmospheric CO2 were
tion, and thin, bouldery drifts and moraines deposited by ice          likely similar to or higher than today.
frozen to the bed (e.g., Prentice et al., 1986), which over-
lie the older temperate deposits. In southern Victoria Land,
Schaefer et al. (1999) reported a minimum age of > 10 Myr
for Sirius Group tills at Mt Fleming. Similarly, relict sub-

The Cryosphere, 14, 2647–2672, 2020                                                       https://doi.org/10.5194/tc-14-2647-2020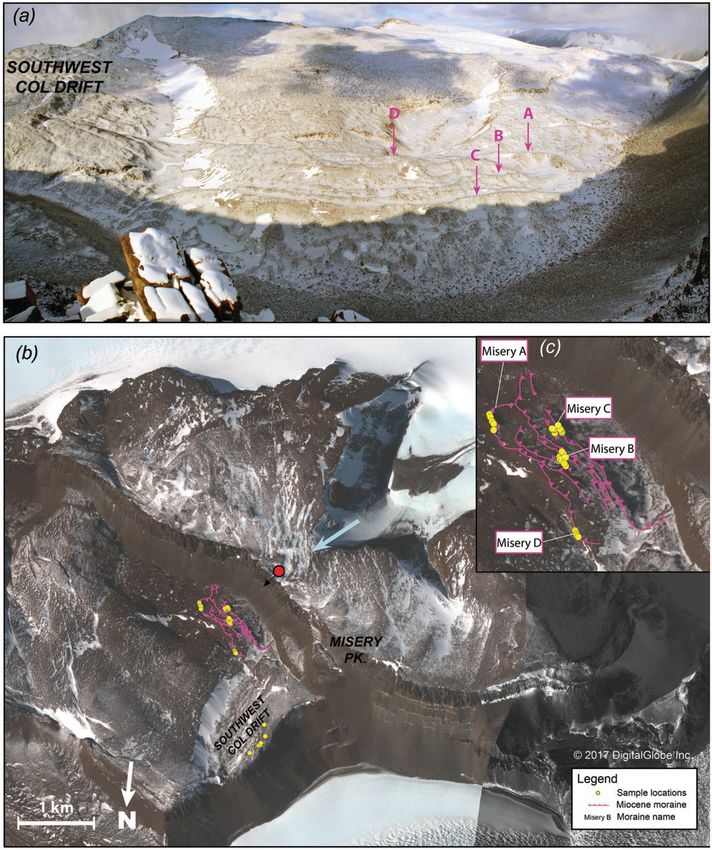
A. Balter-Kennedy et al.: A 14.5-million-year record of EAIS fluctuations                                                 2649

2     Methods                                                    enes at the University of Maine Cosmogenic Isotope Labora-
                                                                 tory, we followed a modified version of the method described
2.1     Geomorphic mapping and sample collection                 by Bromley et al. (2014). We sieved crushed samples to iso-
                                                                 late the 125–250 µm grain size fraction, which was boiled
Fieldwork took place during the 2015–2016 and 2016–2017          for 2 h in 10 % HNO3 to remove Fe oxides and other weath-
austral summers. In the field, we identified and mapped          ering products. We then removed lighter minerals (mostly
moraines, till deposits, and fault scarps on to 2 m resolution   plagioclase) using a water-based heavy liquid with a den-
satellite imagery provided by the Polar Geospatial Center,       sity of 2.94 g cm−3 and leached remaining material in 5 %
University of Minnesota. We collected samples for surface-       HF to dissolve adhering plagioclase and remove outer sur-
exposure dating from the upper surfaces of erratic boul-         faces of pyroxene grains potentially enriched in implanted
ders located on moraine crests and drift sheets, focusing on     4 He from U and Th decay (Blard and Farley, 2008; Bromley

boulders in stable positions (i.e., perched atop other boul-     et al., 2014). Finally, etched pyroxenes were passed through
ders, not broken) and exhibiting minimal evidence for sur-       a magnetic separator and handpicked to remove remaining
ficial erosion. Owing to the prevalence of nuclide inheri-       contaminants under a binocular microscope.
tance documented by previous Antarctic cosmogenic studies           We then measured 3 He concentrations in clean pyroxene
(e.g., Stone et al., 2003; Todd et al., 2010), which is linked   separates at the Berkeley Geochronology Center using the
to incomplete erosion by cold-based ice of previously ex-        BGC “Ohio” system, which consists of a MAP 215-50 sec-
posed surfaces, we sampled large (generally > 1 m tall), an-     tor field mass spectrometer with updated detectors and count-
gular boulders, following the reasoning that such forms are      ing electronics, coupled to a fully automated gas extraction
(i) less likely to have been reworked from the underlying Sir-   and purification system. Gas extraction on this system uses
ius Group tills than visibly molded, striated, and/or polished   a laser “microfurnace” in which ∼ 15–40 mg aliquots of py-
cobbles of exotic lithologies and (ii) more likely to have at    roxene, encapsulated in Ta packets, are heated under vacuum
least one side that is free of inherited nuclides.               using a 150 W, 810 nm diode laser coupled to a coaxial op-
   We collected samples of ∼ 1–5 cm thickness using ei-          tical pyrometer in a feedback loop allowing control of the
ther a hammer and chisel or a drill and wedges. To char-         pyrometer temperature. The pyrometer is calibrated by heat-
acterize each sampled boulder fully and document its ge-         ing a thermocouple in an identical apparatus. However, note
omorphic context, we described, measured, sketched, and          that precise temperature measurement is not necessary for
photographed each boulder from at least four different an-       this work. In most cases (Table S2 in the Supplement), we
gles. We located samples in the field using an uncorrected       extracted helium in an initial 15 min heating step at 1225 ◦ C,
handheld GPS unit (estimated horizontal precision typically      followed by a second 15 min heating step at 1325 ◦ C to en-
±6 m) and measured elevations by barometric traverse from        sure complete extraction. The second heating step typically
temporary benchmarks established using differentially cor-       contained 1 %–5 % of total He released. We added additional
rected GPS and corrected to orthometric heights relative to      heating steps for a few representative samples to test for com-
the EGM96 geoid. The estimated vertical precision of the         plete extraction and found He signals indistinguishable from
temporary benchmarks is between ±0.05 and ±0.3 m. For            blanks. Gases released into the extraction line were purified
barometric differential elevation measurements relative to       by reaction with SAES getters and frozen to activated char-
the benchmarks, we used a Kestrel 4000 barometric altime-        coal at 12 K, after which helium was released into the mass
ter and looped between samples and benchmarks to correct         spectrometer at 33 K. In all cases, we measured 4 He signals
for time-dependent changes in atmospheric pressure. The es-      on a Faraday cup and 3 He on a continuous dynode electron
timated total uncertainty in sample elevations measured us-      multiplier operated in pulse-counting mode.
ing this procedure is ±2.5 m, reflecting the precision of the       We quantified both 3 He and 4 He sensitivity by peak
differential GPS surveys and the barometer and the repro-        height comparison between samples and aliquots of custom-
ducibility of differential barometric elevation measurements     mixed helium gas standards, calibrated using direct pres-
of representative sites also surveyed by differential GPS in     sure measurements of both isotopes using Baratron capac-
this and other studies. We measured topographic shielding at     itance manometers, containing between 1.57 × 10⁻¹⁸ and
sample sites using a handheld compass and inclinometer and       4.71 × 10⁻¹⁶ mol of 3 He and between 4.39 × 10⁻¹⁴ and
the procedure described by Balco et al. (2008, with accom-       1.26 × 10⁻¹¹ mol of 4 He. Ferrar pyroxene has relatively high
panying online material).                                        and highly variable 4 He concentrations, and the MAP 215
                                                                 mass spectrometer displays a significant pressure depen-
2.2     Cosmogenic-nuclide measurements                          dence on He sensitivity (Burnard and Farley, 2000), so accu-
                                                                 rately quantifying machine sensitivity over a wide pressure
2.2.1    Cosmogenic helium-3 analyses                            range was an important aspect of this work. We addressed
                                                                 this by (i) source tuning at He pressures similar to those ex-
We measured cosmogenic 3 He concentrations in pyroxene           pected for sample analyses to improve linearity in the pres-
separated from samples of Ferrar dolerite. To separate pyrox-    sure range of interest and (ii) ensuring that observed He pres-

https://doi.org/10.5194/tc-14-2647-2020                                               The Cryosphere, 14, 2647–2672, 2020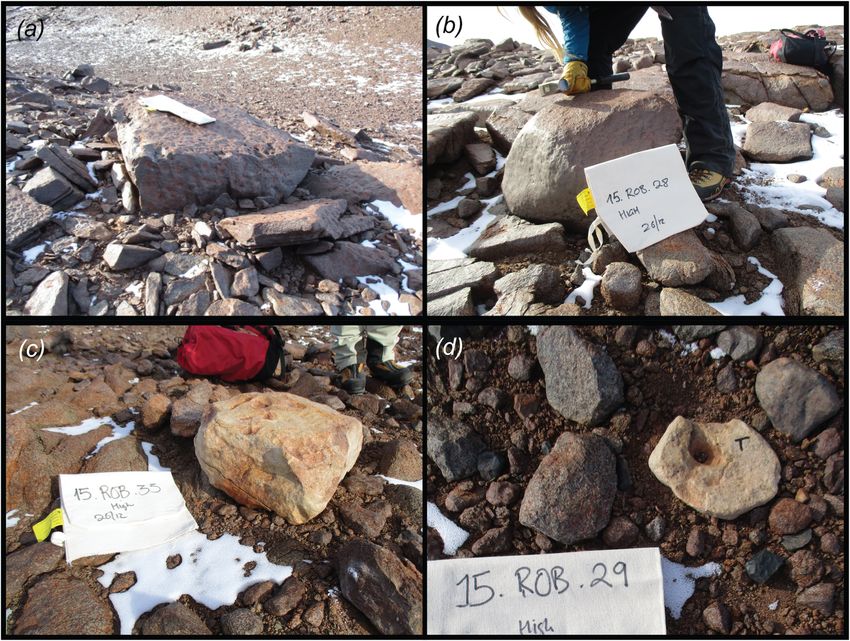
2650                                              A. Balter-Kennedy et al.: A 14.5-million-year record of EAIS fluctuations

sures in sample analyses were bracketed within the pressure
range available from standard analyses. In many cases, this
required discarding results of an initial analysis and reana-
lyzing the sample with a different size aliquot calculated to
match sample and standard pressures. Total process blanks
measured on empty Ta packets had fewer than 105 atoms
3 He and 1010 atoms 4 He, which is negligible for all sam-

ples discussed here. Reported measurement uncertainties in
3 He concentrations include uncertainties from 3 He counting

statistics (typically 1 %–2 %) as well as the variance in sensi-
tivity inferred from gas standard analyses spanning the pres-
sure range of interest (typically 1 %–3 %).
   As additional quality-control measures, we analyzed
aliquots of the CRONUS-P pyroxene standard (Blard et al.,
2015) together with samples throughout each period of anal-
ysis and made replicate analyses of a total of 121 pyrox-
ene samples as well as an additional 21 samples of Fer-
rar pyroxene from other Antarctic sites (Fig. 2). In each of
six distinct measurement periods between 2016 and 2019,
we analyzed two to four aliquots of CRONUS-P. Although
average measured 3 He concentrations in individual mea-
surement periods varied from 4.80 ± 0.30 × 10⁹ to 5.14 ±
0.1 × 10⁹ atoms g−1 , data from different measurement peri-
ods were not distinguishable as separate populations. The
mean and standard deviation of 19 measurements during the
entire period was 5.03±0.15×10⁹ atoms g−1 (2.9 %), which
is indistinguishable from the accepted value of 5.02 × 10⁹
(Blard et al., 2015). Replicate analyses of other samples
had a mean relative standard deviation of 2.2 % (Fig. 2).
As expected from counting statistics, replicate scatter var-
ied with 3 He concentrations, ranging from 3 % for concen-
trations < 2 × 10⁹ atoms g−1 to 1.5 % for concentrations >
7 × 10⁹ atoms g−1 .
   Ferrar pyroxene is known to contain a nonzero concentra-        Figure 2. Quality-control data for 3 He measurements. (a) Repli-
tion of noncosmogenic (presumably magmatic) 3 He. Kaplan           cate analyses of CRONUS-P in all measurement periods during
et al. (2017), Margerison et al. (2005), and Ackert (2000) ob-     2016–2019. Blue lines indicate dates samples in this study were
tained maximum limiting concentrations for noncosmogenic           analyzed. Error bars show 68 % confidence estimates (i.e., 1σ ); rel-
3 He of 5–7×10⁶ atoms g−1 , which are consistent with an un-       atively large uncertainties and poor reproducibility in the final two
                                                                   measurement periods reflect unusually nonlinear helium sensitivity
published estimate (Balco, unpublished data) of 3.3 ± 1.0 ×
                                                                   and relatively large scatter in analyses of gas standards during these
106 atoms g−1 . As this is 1.2 % of the lowest total 3 He con-     periods. Horizontal lines show mean and standard deviation of all
centration measured in a Roberts Massif erratic in this study      measurements. (b) Relative standard deviation of replicate analyses
and 0.1 % of the average concentration observed, we disre-         of 142 samples of Ferrar pyroxene analyzed during this study. Of
gard it and assume that all observed 3 He in pyroxene is cos-      these samples, 21 are not from Roberts Massif and therefore are not
mogenic.                                                           reported in this study but are included here for completeness. The
                                                                   size of the symbol indicates the number of times each sample was
2.2.2   Cosmogenic beryllium-10 and aluminum-26                    analyzed. The pink circle is CRONUS-P.
        analyses

We purified quartz from sandstone samples using established        07KNSTD standard (Nishiizumi et al., 2007) at LLNL and
physical and chemical procedures (e.g., Schaefer et al., 2009)     corrected for background 10 Be by procedural blanks with
at the University of Maine Cosmogenic Isotope Laboratory.          a range of 23 000–44 000 atoms. Al isotope ratios are mea-
Chemical extraction of beryllium and aluminum and prepa-           sured relative to the KNSTD standardization of Nishiizumi
ration of BeO and Al2 O3 targets took place at the Univer-         (2004) and corrected for a procedural blank of 75 000 ±
sity of Maine and Lawrence Livermore National Laboratory           75 000 atoms. Note that blank corrections for both 10 Be and
(LLNL). Ratios of 10 Be/9 Be were measured relative to the         26 Al are negligible for samples in this study. One measure-

The Cryosphere, 14, 2647–2672, 2020                                                     https://doi.org/10.5194/tc-14-2647-2020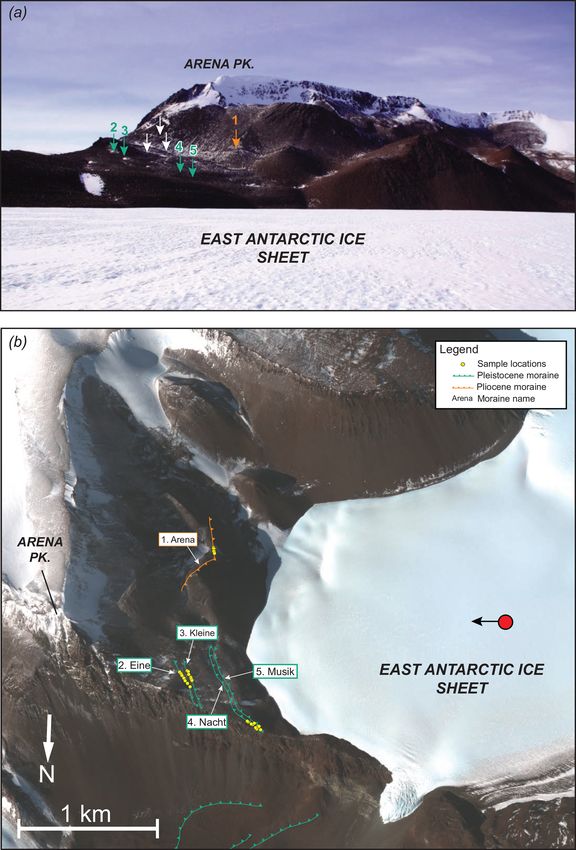
A. Balter-Kennedy et al.: A 14.5-million-year record of EAIS fluctuations                                                   2651

ment of the CRONUS-A quartz standard (Jull et al., 2015)           2.8 Matoms g−1 , similar to but slightly higher than estimates
run together with these samples yielded 3.491 ± 0.047 ×            for Beacon Supergroup sandstones in the Dry Valleys region
107 atoms g−1 10 Be and 1.494 ± 0.030 × 10⁸ atoms g−1 26 Al        (Balco et al., 2019; Middleton et al., 2012). We then mea-
(Table S5), indistinguishable from accepted values for both        sured U and Th concentrations in quartz and computed ap-
nuclides. Reported uncertainties for 10 Be and 26 Al measure-      parent (U−Th)/21 Ne closure ages as described in Balco et
ments include uncertainties in AMS isotope ratio measure-          al. (2019); excluding one outlier attributed to a spurious Th
ment, process blanks, and 9 Be/27 Al concentrations.               measurement, the mean and standard deviation of apparent
                                                                   closure ages is 603 ± 110 Myr. If we assume that all other
2.2.3   Cosmogenic neon-21 analyses                                sandstone erratics from Roberts Massif that we analyzed in
                                                                   this study have a similar source and therefore a similar appar-
We measured 21 Ne in the same quartz separates used for 10 Be      ent closure age, we can estimate nucleogenic 21 Ne concentra-
analysis using the BGC Ohio noble gas mass spectrometer            tions using U and Th concentrations and this closure age esti-
system also used for 3 He measurements and described above.        mate. Note that this apparent closure age is older than the de-
Aliquots of quartz samples were degassed in two heating            positional age of the Beacon Supergroup. If these sandstone
steps at 850 and 1100 ◦ C, and calculations of excess 21 Ne        samples are derived from the Beacon Supergroup, therefore,
(see below) are based on total Ne released in both heating         it is most likely inaccurate as a cooling age. However, the
steps. Ne isotope measurements at BGC use a 39 Ar spike to         provenance of the sandstone erratics is unknown, and in any
quantify and correct for the 40 Ar++ interference on mass 20       case this inaccuracy would not affect the assumption that
and are described in Balco and Shuster (2009). We quantified       Roberts Massif sandstone erratics have a single characteris-
Ne abundances by peak height comparison between samples            tic apparent closure age. Table S4 shows the results of this
and aliquots of an air standard containing between 5 × 10⁻¹⁶       procedure. For samples with less than 200 Matoms g−1 total
and 2 × 10⁻¹⁴ mol Ne and calibrated using a Baratron capac-        excess 21 Ne, we measured U and Th concentrations in in-
itance manometer. In contrast to helium, neon sensitivity was      dividual samples and applied the mean closure age inferred
linear within this range at all times. Corrections for mass dis-   from the ice-proximal samples, which resulted in subtraction
crimination, when necessary, are also based on the air stan-       of up to 20 % of total excess 21 Ne as nucleogenic and had
dard and assumed atmospheric 21 Ne/20 Ne and 22 Ne/20 Ne           a significant effect on results. For samples with higher 21 Ne
ratios of 0.002959 and 0.1020, respectively. A total of 20         concentrations, the uncertainty in the nucleogenic 21 Ne esti-
analyses of the CRONUS-A quartz standard during the pe-            mate is negligible and we used an average value rather than
riod of this study yielded a mean and standard deviation of        measuring U and Th in individual samples. For example, for
319.8 ± 6.3 Matoms g−1 (2 % RSD) excess 21 Ne, indistin-           samples from the Southwest Col on Misery Platform, dis-
guishable from the accepted value of 320 Matoms g−1 (Ver-          cussed below, estimated nucleogenic 21 Ne is less than 0.5 %
meesch et al., 2015).                                              of total excess 21 Ne. Reported uncertainties for 21 Ne mea-
   Neon isotope ratios, as observed in previous stud-              surements, as for 3 He, are derived from counting statistics as
ies for TAM sandstones, were indistinguishable from the            well as reproducibility of the gas standards.
atmospheric–cosmogenic mixing line (see Supplement, Ta-
ble S3). However, Balco et al. (2019) and Middleton et             2.2.4   Treatment of replicates for cosmogenic noble gas
al. (2012) have also shown that significant concentrations                 measurements
of nucleogenic 21 Ne produced by decay of trace U and
Th are present in quartz from this lithology. To calculate         For the majority of samples, we made replicate 3 He and 21 Ne
cosmogenic 21 Ne concentrations in quartz samples, there-          measurements and performed chi-squared tests on replicate
fore, we first calculated excess 21 Ne with respect to atmo-       sets with the null hypothesis that all measurements on the
spheric composition, following Balco et al. (2019) in as-          same sample belong to a single population and disagree only
suming that excess 21 Ne consists of both cosmogenic and           because of measurement uncertainty. If we could not reject
nucleogenic 21 Ne, and estimated nucleogenic 21 Ne concen-         the null hypothesis at 95 % confidence, we took the error-
trations using the following procedure. First, we measured         weighted mean of replicate analyses as the true nuclide con-
excess 21 Ne concentrations in a set of six sandstone sam-         centration and the standard error as the uncertainty. If the
ples from ice-proximal sites at Upper Roberts Massif that          null hypothesis was rejected, we used the arithmetic mean
have apparent 10 Be exposure ages of less than 10 kyr and          and standard deviation. A caveat to this procedure, how-
one additional sample with an apparent 10 Be exposure age          ever, is that we found that our 3 He results from CRONUS-
of 75 kyr. Assuming that these samples have experienced a          P during the period of this study did not pass a chi-squared
single period of exposure, we calculated the 21 Ne concen-         test (p = 0.02), indicating that our internal uncertainty esti-
tration attributable to this exposure and subtracted it from       mates for individual 3 He measurements are underestimating
total excess 21 Ne concentrations to obtain estimates of nu-       the true scatter in multiple measurements of the same sam-
cleogenic 21 Ne; the resulting mean and standard deviation         ple. Thus, we adjusted calculated uncertainties upward when
for nucleogenic 21 Ne estimates in these samples are 10.5 ±        necessary such that no 3 He concentration has a relative un-

https://doi.org/10.5194/tc-14-2647-2020                                                 The Cryosphere, 14, 2647–2672, 2020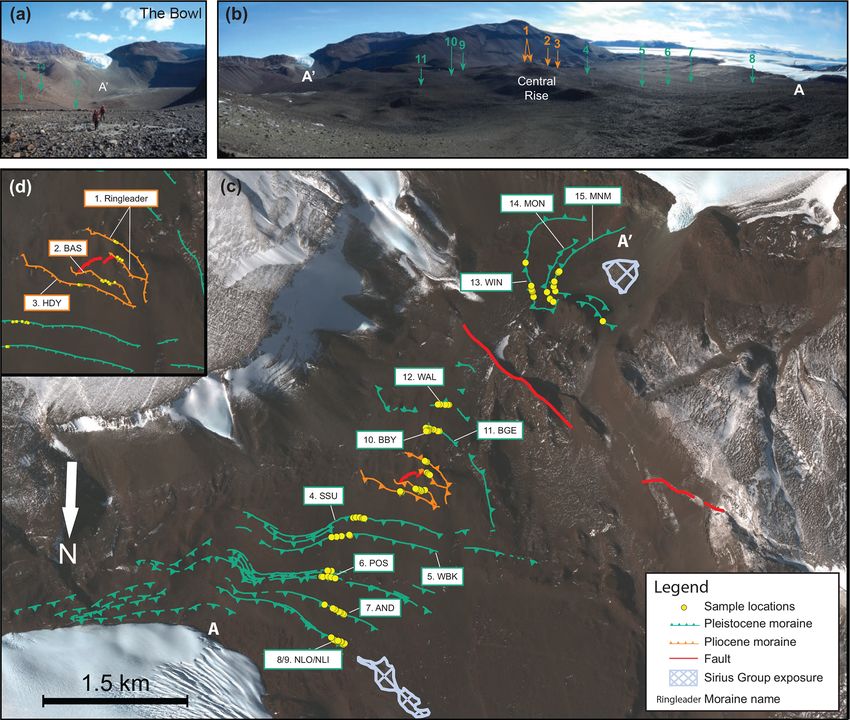
2652                                              A. Balter-Kennedy et al.: A 14.5-million-year record of EAIS fluctuations

certainty of less than 2.9 %, the relative standard deviation of   mit us to have underestimated 10 Be production rates but not
CRONUS-P measurements. 21 Ne results from CRONUS-A,                to have overestimated them. However, a majority of data in
on the other hand, passed the chi-squared test (p = 0.35), so      this study are 3 He exposure ages, and we have no similar
we did not make a similar adjustment to 21 Ne data. However,       constraint on 3 He production rates. 3 He production rate cali-
cosmogenic 21 Ne concentrations do include an additional un-       bration data display substantially more scatter than 10 Be, and
certainty derived from nucleogenic 21 Ne subtraction after av-     estimates of total global uncertainty for 3 He exposure dating
eraging of replicates.                                             range from less than 2 % (Goehring et al., 2018) to more than
                                                                   10 % (Borchers et al., 2016; Phillips et al., 2016). Production
2.3    Surface-exposure age calculations                           rate calibration uncertainty therefore may be significant for
                                                                   3 He results.

We calculated exposure ages from measured nuclide concen-
trations using Version 3 of the online exposure age calculator
described by Balco et al. (2008) and subsequently updated          3     Results
(http://hess.ess.washington.edu, last access: 22 July 2020).
                                                                   3.1     Field observations
We employed the time-dependent “LSDn” scaling method
of Lifton et al. (2014) and the Antarctic atmosphere model         Roberts Massif is defined topographically by large-scale nor-
of Stone (2000). Production rate calibration for 10 Be, 26 Al,     mal faulting that has produced escarpments as much as ∼
and 3 He use the “primary” calibration datasets of Borchers        1200 m in relief (Fig. 3). These faults delineate a number
et al. (2016) for these nuclides, and we compute 21 Ne pro-        of broad, subhorizontal surfaces, including a lower-elevation
duction rates by assuming a 21 Ne/10 Be production ratio of        platform (hereafter “Lower Roberts”); a middle-elevation
4.03 (Balco et al., 2019; Balco and Shuster, 2009; Kober et        platform, comprising the Misery Platform and Upper Roberts
al., 2011). In contrast to exposure-dating studies that are lo-    sites; and the high peaks of the massif, including Misery
cated at similar altitude and latitude to production rate cal-     Peak (2725 m) and Arena Peak (informal name; 2700 m).
ibration sites, our study involves significant extrapolations      Local bedrock comprises sandstones of the Beacon Super-
from the locations of calibration data, mostly at low ele-         group and pyroxene-bearing Ferrar dolerite, which includes
vation and high latitude or high elevation and low latitude,       a fine-grained variety and a friable, coarse-grained variety.
to the high-elevation–high-latitude sites at Roberts Massif.       Notably, the termini of the EAIS, Shackleton Glacier, and the
Scaling methods that can be fit equivalently to the cali-          unnamed spur of Zaneveld Glacier at Roberts Massif are rel-
bration data predict different production rates at our sites.      atively free of debris, containing only the occasional boulder.
Specifically, production rates predicted by LSDn scaling are       Further, we did not observe any evidence of glacial outwash
∼ 15 % higher than those predicted by the scaling method of        or liquid water at any of these margins, indicating that the ice
Lal (1991) and Stone (2000; the “St” and “Lm” scaling meth-        bounding Roberts Massif is currently cold based.
ods of Balco et al., 2008). However, at several high-elevation
sites in Antarctica, including Roberts Massif, measured 10 Be      3.1.1    Lower Roberts
and 26 Al concentrations are significantly higher than val-
ues for production–decay saturation predicted by the St and        In the southern portion of the Lower Roberts area, a complex
Lm methods, indicating that these methods overpredict pro-         of faults forms a deep, back-tilted basin named “The Bowl”
duction rates at high-elevation–high-latitude locations (see       by Hambrey et al. (2003). With the exception of a 100 m re-
discussion in Balco, 2016, https://cosmognosis.wordpress.          lief bedrock hill, referred to here as the Central Rise, and the
com/2016/09/09/saturated-surfaces-in-antarctica/, last ac-         Bowl, the Lower Roberts area exhibits relatively gentle to-
cess: 22 July 2020). On the other hand, saturation concentra-      pography (Fig. 4). Dolerite bedrock surfaces outcrop at sev-
tions predicted by the LSDn method are consistent with the         eral locations throughout Roberts Massif and commonly ex-
highest measured 10 Be and 26 Al concentrations in Antarc-         hibit glacial polish, striations, and molding consistent with
tica. Thus, we conclude that, at least in the high TAM, expo-      erosion beneath a wet-based glacier. Most of these bedrock
sure ages calculated using LSDn scaling are likely accurate        outcrops are directly overlain by semilithified, poorly sorted
and exposure ages calculated using St or Lm scaling would          pockets of sediment (several meters thick in places), contain-
be spuriously old.                                                 ing deeply striated gravel- to cobble-sized clasts of heteroge-
   Additional uncertainties in exposure-age estimates derive       nous, non-native lithologies embedded in an olive-gray, clay-
from the choice of production rate calibration data. Estimated     rich matrix (Figs. 4 and 5). We interpret these sediments as
total uncertainties for 10 Be exposure ages derived from cal-      lodgement tills associated with the Sirius Group. First de-
ibration data are ∼ 6 % (Borchers et al., 2016). Yet, any          scribed by Mercer (1972), the Sirius Group occurs through-
10 Be calibration dataset that predicted significantly lower       out the upper (>∼ 1500 m elevation) TAM as erosional rem-
production rates, and therefore lower saturation concentra-        nants of clay-rich diamicton that are correlated with at least
tions, would not be consistent with the 10 Be data from the        one period of past temperate glaciation. An in-depth sedi-
Southwest Col (see discussion in Sect. 4.3). These data per-       mentological study of glacially eroded bedrock surfaces and

The Cryosphere, 14, 2647–2672, 2020                                                    https://doi.org/10.5194/tc-14-2647-2020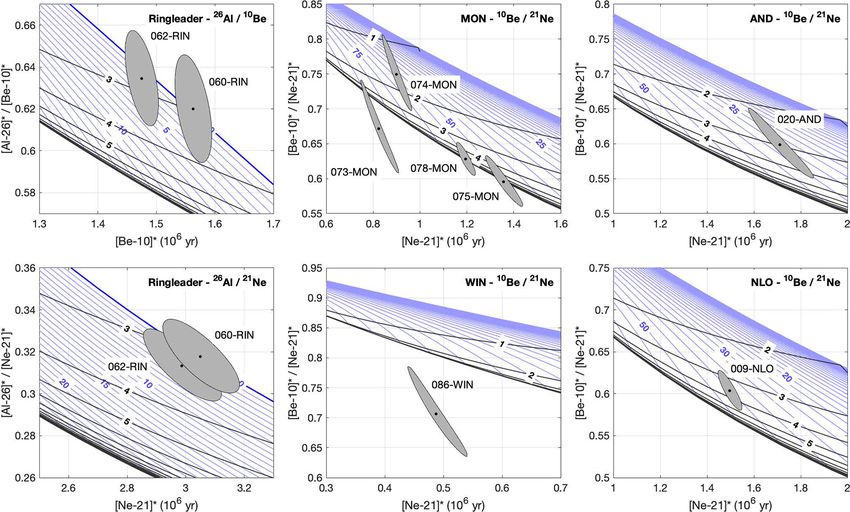
A. Balter-Kennedy et al.: A 14.5-million-year record of EAIS fluctuations 2653
Figure 3. (a) Oblique aerial photograph of Roberts Massif looking west along the spine of the Transantarctic Mountains, with the East
Antarctic Ice Sheet to the left. Enlargement (b) shows Misery Platform, which is the hanging wall of the large normal fault that bisects the
massif. Panel (c) shows the extensive moraine sequence at Lower Roberts Massif. The moraine sequence at Upper Roberts (Fig. 7) faces
west and is hidden from this viewing angle. The locations A and A0 match Fig. 4. Image is a 1963 US Navy trimetrogon aerial photograph,
TMA 1211/179 R.
Sirius Group tills at Roberts Massif and other locations along comprise accumulations of stacked boulders, and avoided the
the upper Shackleton Glacier is provided by Hambrey et numerous discontinuous moraine mounds and isolated er-
al. (2003). ratic boulders, from which former ice marginal positions are
Bedrock and Sirius Group tills are blanketed by patchy difficult to reconstruct. The stratigraphically oldest moraine
glacial drift, comprising primarily angular, cobble-to- in the Lower Roberts sequence, the Ringleader moraine (in-
boulder-sized clasts with little to no fine-grained material formal name) encircles the summit of the Central Rise, in-
(Fig. 5). Ferrar dolerite is the most abundant lithology, al- dicating that north- and south-flowing ice masses once con-
though this drift includes the occasional sandstone boulder, verged to form a continuous ice surface across the Lower
as well as rounded cobbles reworked from the underlying Roberts area at least ∼ 170 m higher than the modern ice
tills described above. A key feature of this drift deposit is margin to the north. From the Ringleader moraine, at the
the abundance of open-work boulder moraines, which we tar- highest position in the Lower Roberts site, we sampled north-
geted for surface-exposure dating (Fig. 6). These low-relief ern (extending from Ringleader to A in Fig. 4) and south-
(1–2 m high) ridges are composed primarily of large, angu- ern (extending from Ringleader to A0 in Fig. 4) moraine
lar dolerite boulders and are oriented subparallel to the mod- transects. Listed in stratigraphic order, the northern tran-
ern ice edge, marking former marginal positions of the EAIS sect included the BAS, HDY, SSU, WBK, POS, AND,
to the south and the unnamed spur of the Zaneveld glacier and NLO–NLI moraines (moraine initials correspond to in-
to the north. The sediments of these drifts and associated formal names and sample ID suffixes listed in the ICE-
boulder-belt moraines exhibit characteristics typical of cold- D:ANTARCTICA online database and Table S1); from the
based glaciation, being thin, patchy, and clast-supported with southern transect we sampled the BBY, BGE, WAL, WIN,
little to no fine-grained material (Figs. 5 and 6; Atkins, 2013). MON, and MNM moraines. Notably, the POS moraines con-
Furthermore, clasts are generally angular and lack the stria- stitute a complex of three main ridges, while the NLO–NLI
tions, polish, and molding associated with erosive wet-based moraines comprise two distinct ridges spaced only by ∼ 5 m.
ice. The youngest deposit at Roberts Massif comprises a thin
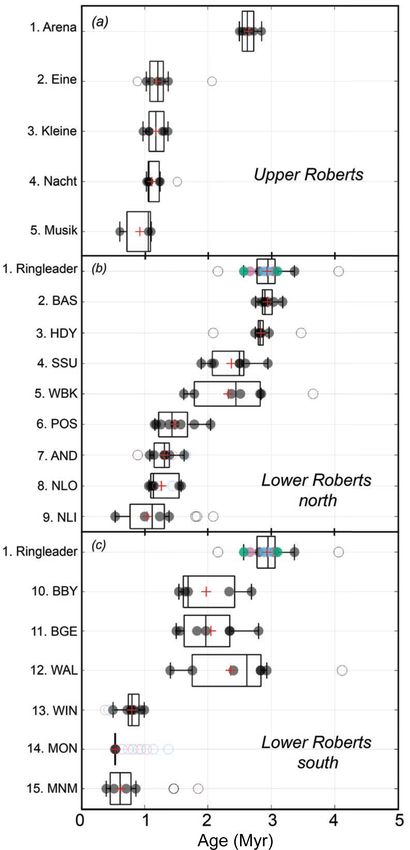
We identified and sampled for surface-exposure dating 15 layer of sandstone and dolerite debris that extends several
moraines throughout the Lower Roberts area. We focused tens of meters beyond the current ice margins. Clasts are
on the most prominent, laterally continuous moraines, which relatively unweathered (i.e., exhibit minimal staining and/or
https://doi.org/10.5194/tc-14-2647-2020 The Cryosphere, 14, 2647–2672, 2020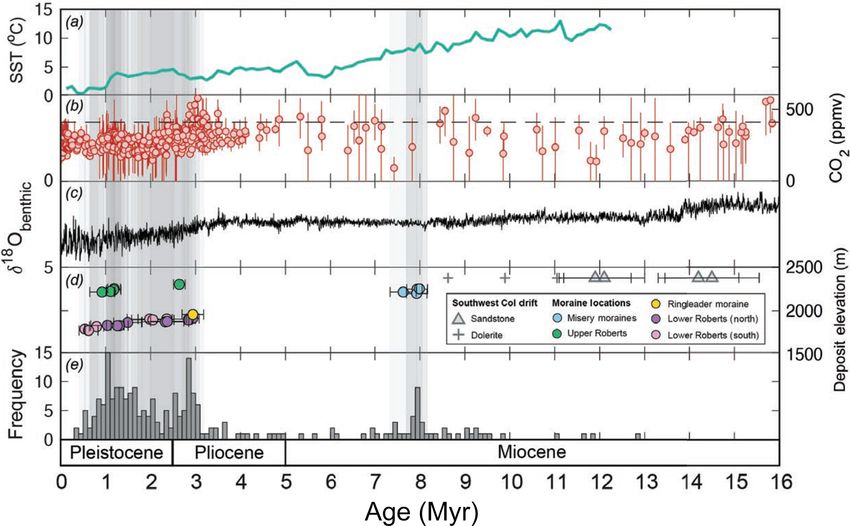
2654                                                A. Balter-Kennedy et al.: A 14.5-million-year record of EAIS fluctuations

Figure 4. Map of Lower Roberts. (a) Photograph of the Bowl, showing cold-based drift and moraines overlying Sirius Group deposits, which
appear light gray, and (b) photo of the Lower Roberts area. In (a) and (b), arrows point to sampled moraines, with numbers corresponding
to moraine names in (c) and (d), and letters A and A0 corresponding to positions in (c). (c) Glacial geomorphic map showing moraines
and sample locations at Lower Roberts, as well as the location of observed Sirius Group outcrops. The NLO–NLI and POS are moraine
complexes that comprise two or more crests, and the BBY moraine is a short moraine segment just north of the BGE moraine. (d) Closer
view of the Pliocene-aged moraines encircling the Central Rise, shown in orange in (c). The base map is derived from WorldView-2 satellite
imagery (© 2017, DigitalGlobe, Inc.).

exfoliation) and exhibit fresh scuff marks (abrasions formed           dark red staining, pitting of up to ∼ 0.5 cm depth, exfoliation
as cold-based ice drags entrained boulders across underlying           up to ∼ 4 mm, and weathering rinds 1–2 mm thick, while the
surfaces; Atkins et al., 2002; Fig. 5f). With the exception of         presence of sandstone clasts is increasingly rare (Fig. 6d). In
a few discontinuous segments, this unit generally is not asso-         contrast, dolerite boulders that we sampled on the innermost
ciated with distinct moraines. Based on strong similarities in         moraines were generally blue-gray in color and lacked sig-
position, morphology, and relative weathering with deposits            nificant weathering characteristics, such as staining or pitting
reported from other TAM sites (e.g., Todd et al., 2010), we            (Fig. 6c). Although the boulders on the outermost moraines
correlate the youngest drift unit at Roberts Massif with the           at Roberts Massif display more pronounced weathering than
most recent late Quaternary expansion of Shackleton Glacier            those on the inner moraines, the characteristics described
and EAIS and do not discuss it further.                                here represent relatively minimal surface weathering com-
   Outboard of this relatively unweathered limit, drift and            pared to slightly warmer and wetter Antarctic locations, such
moraine boulders become progressively more weathered                   as the McMurdo Dry Valleys. There, ∼ 3 Ma clasts, which
with distance from and elevation above the modern ice. For             are similar in age to those on the HDY, BAS, and Ringleader
instance, dolerite boulders belonging to the outermost de-             moraines (Sect. 3.4), display pitting of greater than 4 cm
posits of the HDY, BAS, and Ringleader moraines (up to                 depth (Swanger et al., 2011). Additionally, we did not ob-
3 km from and 170 m above the modern ice margin) exhibit               serve any cross-cutting relationships between moraine crests

The Cryosphere, 14, 2647–2672, 2020                                                         https://doi.org/10.5194/tc-14-2647-2020
A. Balter-Kennedy et al.: A 14.5-million-year record of EAIS fluctuations                                                                  2655

Figure 5. Views of drifts and tills described at Roberts Massif. (a) The gray, fine-grained Sirius Group deposits atop striated dolerite bedrock;
(b) Sirius Group exposed in section in the Bowl, with 120 cm long pole for scale; (c) striated, glacially molded Sirius cobble embedded in a
fine-grained matrix; (d) sample 16-ROB-089-COL, a freshly scoured sandstone clast in the Bowl, likely deposited as a thin drift sheet atop
older deposits during a Late Quaternary expansion of the EAIS; (e) cold-based AND moraine, which is Pleistocene in age; and (f) Misery B
moraine, which is Miocene in age.

throughout Lower Roberts, either on the ground or in satel-                dicating deposition by a cold-based EAIS. Similar to obser-
lite imagery. Therefore, we conclude that moraines at this site            vations at Lower Roberts, a fresh-looking drift of sandstone
increase in age with distance away from and elevation above                and dolerite boulders extends several tens of meters beyond
the modern ice sheet surface. Altogether, these surfacemost                the modern ice edge. At the Upper Roberts site, that fresh de-
deposits indicate that the Lower Roberts area records > 15                 posit is associated with a low-relief (∼ 1.5 m) ridge. We at-
prior expansions of cold-based ice.                                        tribute this deposit to the most recent expansion of the EAIS
                                                                           during the Late Quaternary and do not discuss it further in
3.1.2   Upper Roberts                                                      this paper. We focused on five moraine ridges located along a
                                                                           vertical transect between ∼ 60 and 150 m above and oriented
The Upper Roberts site is situated on a steep, west-facing                 subparallel to the modern ice surface (2150 m). In order of
slope of Arena Peak, directly adjacent to the northward-                   descending elevation, we identified and sampled the Arena
flowing lobe of the EAIS that ultimately flows over the                    (2300 m), Eine (2260 m), Kleine (2240 m), Nacht (2220 m),
Bowl headwall (Fig. 7). Here, we mapped glacial drift and                  and Musik (2220 m) moraines (informal names). Addition-
moraines identical in character to those at Lower Roberts, in-             ally, we mapped moraine segments preserved both within

https://doi.org/10.5194/tc-14-2647-2020                                                            The Cryosphere, 14, 2647–2672, 2020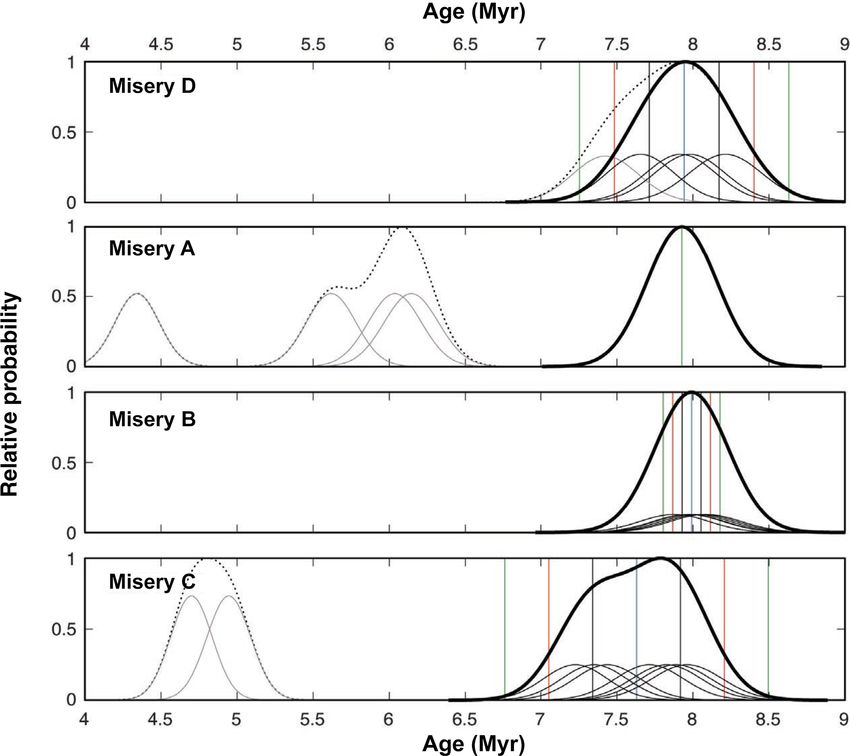
2656                                               A. Balter-Kennedy et al.: A 14.5-million-year record of EAIS fluctuations

Figure 6. Photographs of moraines and sampled boulders at Roberts Massif. (a) Blue-gray dolerite boulder 16-ROB-010-NLO on the second
moraine from the modern EAIS in the Lower Roberts northern transect; (b) red-stained dolerite boulder 16-ROB-059-RIN on the Ringleader
moraine, the outermost moraine in the Lower Roberts area; (c) relatively unweathered sandstone boulder 16-ROB-009-NLO; (d) red-stained
and varnished sandstone boulder 16-ROB-062-RIN on the Ringleader moraine; (e) relatively unweathered, blue-gray dolerite boulder 15-
ROB-064-MUS on the Musik moraine, the innermost moraine at Upper Roberts; and (f) weathered and red-stained dolerite boulder 15-ROB-
038-ARM on the Arena moraine, the outermost moraine at Upper Roberts.

and above (up to ∼ 2500 m elevation) this transect, but, ow-         3.1.3   Misery Platform
ing to lateral discontinuity and poor preservation on high-
gradient slopes, we did not sample these limits for surface-
                                                                     Misery Platform is a broad, gently sloping platform in the
exposure dating. As at Lower Roberts, the general increase in
                                                                     southwest part of Roberts Massif (Figs. 3 and 8). Compris-
boulder-surface weathering (Fig. 6) and the absence of cross-
                                                                     ing the top surface of the hanging-wall block of a large nor-
cutting moraine stratigraphy (determined from field observa-
                                                                     mal fault, Misery Platform is bounded to the south by a
tions and satellite imagery; Fig. 7) suggest that glacial de-
                                                                     ∼ 300–340 m high fault scarp. At the base of the scarp, we
posits at Upper Roberts become older with increasing eleva-
                                                                     mapped a series of arcuate moraine ridges (here termed the
tion above the modern EAIS.
                                                                     Misery moraines), four of which we sampled for exposure-
                                                                     age dating (Figs. 8 and 9). The southern edge of the footwall
                                                                     block, which includes Misery Peak (2723 m elevation), drops
                                                                     steeply to the EAIS surface at ∼ 2200 m elevation and ex-
                                                                     hibits south-facing, amphitheater-shaped valleys that are oc-

The Cryosphere, 14, 2647–2672, 2020                                                      https://doi.org/10.5194/tc-14-2647-2020
A. Balter-Kennedy et al.: A 14.5-million-year record of EAIS fluctuations 2657 Figure 7. Upper Roberts Massif. (a) Photograph of the Upper Roberts transect with moraines marked by arrows, numbered corresponding to sampled moraines in (b). White arrows in (a) denote undated moraines. (b) Geomorphic map of Upper Roberts. The red circle and arrow shows the location and vantage of photo in (a). The base map in (b) is derived from WorldView-2 satellite imagery (© 2017, DigitalGlobe, Inc.). cupied partially by north-flowing lobes of the EAIS (Fig. 8). where a north-flowing lobe of the EAIS overtopped the broad The largest of these valleys is located directly south of the slopes east of Misery Peak and cascaded down the escarp- Misery moraines, and its extension above the current sur- ment, where it deposited the Misery moraines on the platform face of the EAIS suggests that this lobe of ice was signifi- below. This interpretation requires that the Misery moraines cantly thicker in the past. Further, a thin drift of glacial er- (a) postdate the formation of the fault scarp and (b) were ratics atop the footwall block at ∼ 2550 m elevation marks deposited by an EAIS that was sufficiently thick (> 300 m https://doi.org/10.5194/tc-14-2647-2020 The Cryosphere, 14, 2647–2672, 2020
2658                                               A. Balter-Kennedy et al.: A 14.5-million-year record of EAIS fluctuations

above the current surface) to overtop the footwall block. Al-       depth. Based on the thin nature of this deposit, we interpret
though the Misery moraines are similar in elevation to those        the Southwest Col drift as a cold-based ablation till deposited
sampled at Upper Roberts, they represent the highest former         by the EAIS. Owing to its weathering state, we suggest that
ice surface elevation of the EAIS examined in this study.           this deposit is the oldest glacial unit in our record. Surface-
   Compared to moraines at Lower and Upper Roberts, the             exposure ages from this site therefore provide a minimum-
Misery moraines are relatively broad and high-relief (∼ 2–          limiting age for temperate glaciation at Roberts Massif.
5 m high) and comprise finer matrix material (silt-to-gravel).
Moraine crests are mantled with angular dolerite boulders           3.1.4    Summary of field observations
exhibiting pronounced weathering features, including deep
red-to-purple staining, 2–3 mm thick weathering rinds, and          We mapped three primary surfaces at Roberts Massif (listed
ventifaction pits of up to 2 cm depth. On the basis of these        in stratigraphic order): glacially molded and striated do-
physical characteristics, they appear older than the outer-         lerite bedrock, temperate-style tills belonging to the Sirius
most moraines at both Lower and Upper Roberts. Therefore,           Group, and cold-based drifts associated with openwork boul-
we interpret the Misery moraines as cold-based ice-marginal         der moraines. All samples collected for surface-exposure dat-
features marking the ostensibly oldest and most extensive           ing are derived from the cold-based deposits marking for-
EAIS terminus positions that we documented at Roberts               mer positions of the EAIS. At both the Lower and Upper
Massif. We used cross-cutting relationships of the Misery           Roberts sites, weathering patterns and the lack of cross-
moraines to determine their stratigraphic order. From outer-        cutting moraines suggest that relative moraine ages increase
most (oldest) to innermost (youngest), we sampled boulders          with distance from, and elevation above, the modern ice sheet
on the following moraine crests: Misery D, Misery A, Mis-           margin. Deposits on Misery Platform (the Misery moraines
ery B, Misery C (note that the designations A–D are field           and the Southwest Col drift) exhibit more advanced subaerial
designations reflecting the sequence of sample collection, not      weathering than our other sites, indicating that these deposits
the stratigraphic order; Fig. 8). Importantly, we avoided sam-      are significantly older. In Sect. 4.2, we describe results from
pling adjacent to overlapping moraine segments.                     cosmogenic-nuclide measurements made on samples from
   Immediately outside of, and stratigraphically underlying,        23 separate moraine ridges and one drift sheet.
the Misery moraines, the weathered bedrock surface is man-
                                                                    3.2     Results from cosmogenic-nuclide measurements
tled with a thin patchy ablation till, dominated by dolerite
boulders and a small number of sandstone clasts, and asso-          We made 293 cosmogenic 3 He measurements in pyroxene
ciated with a coarse-grained sand and gravel deflation sur-         from 155 dolerite boulders, 32 21 Ne and 13 10 Be measure-
face. We observed this unit throughout Misery Platform and          ments in quartz from 13 sandstone boulders, and two 26 Al
collected samples for surface-exposure dating from boulders         measurements in quartz from two sandstone boulders (also
on Southwest Col, located approximately 1.5 km northwest            measured for 21 Ne and 10 Be). Samples were derived from
of the Misery moraine complex and 400 m above the mod-              23 distinct moraine crests and one glacial drift sheet (South-
ern surface of Shackleton Glacier (Fig. 8). Here, the abla-         west Col). Apparent exposure ages span two periods: ∼ 13–
tion till (“Southwest Col drift”) mantles a bedrock surface         8 Ma at Misery Platform and ∼ 3 Ma–400 ka at Upper and
of heavily stained and deeply exfoliated coarse-grained do-         Lower Roberts (Tables 1 and S1). “Apparent” exposure ages
lerite. In places, granular sediments fill joints and depressions   refer to the calculated age of the boulder given the mea-
in the bedrock. These sediments are characterized by red-           sured nuclide inventory, assuming that the boulder has ex-
stained silt-to-gravel-sized grains, which may derive from the      perienced only one period of exposure, with no erosion or
disintegration of the dolerite bedrock, and gravel-to-cobble-       burial during that time. Boulder information, nuclide concen-
sized clasts of various lithologies. In contrast to the Sirius      trations, complete step-degassing results for 3 He and 21 Ne
Group deposits observed elsewhere at Roberts Massif, boul-          are summarized in Tables S2, S3, and S5, and the full dataset
ders comprising Southwest Col drift are predominantly do-           is archived online in the ICE-D:ANTARCTICA database
lerite (as opposed to a broad mix) and generally more angu-         (http://antarctica.ice-d.org, last access: 22 July 2020). In this
lar.                                                                section, we summarize these cosmogenic-nuclide data and
   We sampled three dolerite clasts (one boulder and two            highlight the possible effects of surface erosion and other ge-
cobbles) and four sandstone clasts (three boulders and one          omorphic processes on exposure ages, which ultimately lead
cobble), all of which are perched on bedrock and/or inter-          us to estimates of the emplacement age of the moraines.
stitial sediments, for surface-exposure dating. The surface
of the dolerite boulder (15-ROB-28-COL) exhibits deep red           3.2.1    Constraints on erosion rates from paired
staining and evidence of significant wind abrasion, except                   10 Be–21 Ne measurements
on the lee side where there is a thick red-brown weather-
ing rind (Fig. 9). The sandstone boulders (15-ROB-32-COL,           As a majority of landforms at Roberts Massif are several mil-
15-ROB-33-COL, and 15-ROB-34-COL) exhibit orange-to-                lion years old, quantifying the magnitude of surface erosion
red staining, surface varnish, and ventifaction of up to 4 cm       is key to accurate exposure dating. Here, we summarize geo-

The Cryosphere, 14, 2647–2672, 2020                                                     https://doi.org/10.5194/tc-14-2647-2020
A. Balter-Kennedy et al.: A 14.5-million-year record of EAIS fluctuations 2659 Figure 8. Map of Misery Platform. (a) Photo of the Misery moraines. Pink arrows point to the sampled Misery moraines and are labeled with the corresponding moraine letter. The location of the Southwest Col drift is also labeled. The photo was taken from the location of the red circle in (b) looking in the direction of the black arrow (vantage to the northeast). (b) Geomorphic map of the Southwest Col area. The Southwest Col drift mantles the bedrock outboard of the Misery moraines. The blue arrow denotes the direction of ice flow when the Misery moraines were deposited. (c) Closer view of the Misery moraine complex. The base map in (b) and (c) is derived from WorldView-2 satellite imagery (© 2017, DigitalGlobe, Inc.). chemical data and field observations that allow us to place ples have experienced continuous exposure at a steady ero- limits on long-term erosion rates. Four sandstone erratics at sion rate, the 10 Be–21 Ne data imply true exposure ages in the Southwest Col have 10 Be concentrations close to predicted range of 12–15 Myr but varying surface erosion rates in the production-erosion saturation values, and apparent 21 Ne ex- range of 0.5–3 cm Myr−1 . These low erosion rates are consis- posure ages of 9–12 Myr. As these samples have nearly the tent with our field observations pertaining to surface erosion highest concentrations of these nuclides yet measured on of these sandstones as described in Sect. 3.1.3. Earth, concentration measurements are correspondingly (and Apparent 3 He exposure ages from three dolerite clasts unusually) precise, making it possible to use the paired 10 Be– also located on Southwest Col, and which therefore should 21 Ne data to simultaneously infer exposure ages and surface have the same true exposure age as the sandstone clasts, are erosion rates from these samples (Fig. 10; Gillespie and Bier- 8.6, 10, and 11 Myr. Assuming that the true exposure age man, 1995; Lal, 1991). Given the assumption that these sam- of the deposit is no greater than 14.5 Myr, as implied by https://doi.org/10.5194/tc-14-2647-2020 The Cryosphere, 14, 2647–2672, 2020
2660                                               A. Balter-Kennedy et al.: A 14.5-million-year record of EAIS fluctuations

Figure 9. Photographs of boulders from the Misery Platform. (a) dolerite boulder 15-ROB-017-MZC on the Misery C moraine; (b) Dolerite
boulder 15-ROB-028-COL at the Southwest Col; (c) sandstone boulder 15-ROB-035-COL at the Southwest Col; (d) Sandstone cobble
15-ROB-029-COL at the Southwest Col.

the two-nuclide data for the highest-nuclide-concentration           clasts are rare on these moraines, these data provide some
sandstone (15-ROB-032-COL) shown in Fig. 10, this im-                insight into the exposure history of these boulders that we
plies maximum erosion rates for the dolerite clasts of 3.8,          can use to assess the importance of inheritance and postde-
2.7, and 1.9 cm Myr−1 , respectively. Further assuming that          positional disturbance for moraine exposure ages.
the dolerite clast with the highest 3 He concentration (15-             In general, a boulder that has experienced a single pe-
ROB-028-COL) has been exposed at the drift surface for the           riod of exposure that is equal to the emplacement age of
longest period, and has therefore experienced mainly surface         the moraine should display concordant 10 Be, 21 Ne, and 26 Al
weathering rather than exhumation from till, we propose that         ages that are the same as those of other boulders on the
∼ 2 cm Myr−1 is likely a maximum limit on rock surface ero-          moraine. For the Ringleader moraine (Fig. 11), 10 Be–21 Ne–
sion rates for dolerite surfaces in our study area. The assump-      26 Al measurements are concordant at 2.8–3 Ma, therefore

tion that this clast has been exposed at the surface is sup-         consistent with simple exposure at negligible erosion, and lie
ported by the fact that 15-ROB-028-COL is a boulder, while           in the center of the range of 3 He ages from dolerite clasts
the rest of the dolerite surfaces we sampled on Southwest Col        on the same moraine (Fig. 12). These observations suggest
are cobbles. If the deposit is younger than 14.5 Myr, an even        that (i) the sandstone boulders have experienced a single pe-
lower erosion rate would be implied. Although this is an ex-         riod of exposure with minimal postdepositional exhumation
tremely low surface weathering rate by global standards, it is       or weathering, which is consistent with our field observa-
nonetheless consistent with the polar desert climate and the         tions as described in Sect. 3.1.1; (ii) their exposure age most
field observations described in Sect. 3.1.3 (i.e., angular clasts    likely represents the true emplacement age of the moraine;
with surface varnish and minimal pitting).                           and (iii) two outliers in the 3 He age distribution can likely be
                                                                     attributed to both inheritance (one ∼ 4 Myr age) and postde-
3.2.2   Information about geomorphic processes from                  positional disturbance (one ∼ 2 Myr age).
        multiple-nuclide measurements                                   In contrast, paired 10 Be–21 Ne measurements on four boul-
                                                                     ders on the MON moraine and one on the WIN moraine
As on Southwest Col, we also measured multiple nuclides              (Fig. 11), both adjacent to the Bowl and emplaced by ice
(10 Be and 21 Ne and, in one case, 26 Al) in several sandstone       from Upper Roberts overflowing the Bowl headwall (Fig. 4),
boulders on the Ringleader, WIN, MON, AND, and NLO                   display discordant apparent ages. Additionally, apparent ex-
moraines at Lower Roberts (Fig. 11). Although sandstone              posure ages from both sandstone and dolerite boulders at

The Cryosphere, 14, 2647–2672, 2020                                                      https://doi.org/10.5194/tc-14-2647-2020
A. Balter-Kennedy et al.: A 14.5-million-year record of EAIS fluctuations 2661
Table 1. Roberts Massif moraine and drift ages and statistics.
Site Elevation Count Age range of Mean age Age range Coefficient Reduced
(m) (samples excluded) raw data (Myr) (Myr)a (Myr)b of variance (%) χ2
Misery Platform
Southwest Col 2377 7 (4) 5.20–12.86c – 8.63–12.86 –d –d
Misery D 2249 4 (1) 7.43–8.21 7.94 ± 0.23 – 3% 1.00
Misery A 2198 1 (4) 4.34–7.93 7.93 ± 0.23 – –e –e
Misery B 2252 8 (0) 7.88–8.08 7.99 ± 0.06 – 1% 0.07
Misery C 2215 7 (2) 4.70–7.96 7.63 ± 0.29 – 4% 1.74
Upper Roberts
Arena 2303 6 (0) 2.50–2.85 2.64 ± 0.13 – 5% 2.49
Eine 2255 5 (2) 0.89–2.07 1.19 ± 0.14 – 11 % 14.23
Kleine 2241 6 (0) 0.97–1.37 1.18 ± 0.16 – 14 % 23.74
Nacht 2221 6 (1) 1.03–1.52 1.11 ± 0.10 – 9% 6.42
Musik 2215 3 (0) 0.61–1.10 – 0.61–1.10 30 % 184.80
Lower Roberts
Ringleader 1957 9 (2) 2.16–4.07 2.94 ± 0.24 2.57–3.37 8% 5.10
Northern transect
BAS 1914 7 (0) 2.76–3.18 2.94 ± 0.14 2.76–3.18 5% 2.52
HDY 1895 5 (2) 2.09–3.48 2.84 ± 0.08 2.75–2.97 3% 0.90
WBK 1877 6 (1) 1.62–3.66 – 1.62–2.84 22 % 81.95
SSU 1872 7 (0) 1.90–2.95 – 1.90–2.95 15 % 28.78
POS 1865 8 (0) 1.16–2.05 – 1.16–2.05 21 % 48.23
AND 1830 6 (3) 0.89–1.66 – 1.08–1.63 15 % 24.88
NLO 1829 6 (2) 1.07–1.58 – 1.07–1.58 19 % 36.07
NLI 1832 4 (3) 0.54–2.09 – 0.54–1.39 36 % 373.32
Southern transect
BBY 1905 5 (0) 1.55–2.69 – 1.55–2.69 25 % 68.30
BGE 1906 6 (1) 1.41–4.12 – 1.41–2.93 27 % 157.67
WAL 1896 7 (0) 1.50–2.80 – 1.50–2.80 23 % 69.22
WIN 1818 7 (2) 0.38–1.00 – 0.51–1.00 20 % 76.27
MON 1791 2 (8) 0.53–1.38 0.54 ± 0.01 – 2% 0.24
MNM 1774 4 (3) 0.40–1.85 – 0.40–0.87 33 % 166.30
a Used for moraines with age distributions close to normal and/or a coefficient of variance < 15 %. b Used for moraines with non-normal (scattered) age distributions which
have a coefficient of variance > 15 %. c Four youngest ages, obtained from 10 Be measurements, are near saturation and thus not considered. d Population statistics only
presented for moraines. e All boulders but one are considered outliers on Misery A.
these moraines are relatively scattered (coefficient of vari- trations in clasts sourced from the adjacent headwall, and the
ance > 20 %). The 10 Be–21 Ne data (Fig. 11) could be ex- true ages of the moraines are therefore likely close to the
plained either (i) by an extended period of steady erosion young end of their age distributions.
at an ice-free site prior to entrainment and deposition of the Finally, paired 10 Be–21 Ne measurements from the AND
clasts or (ii) by repeated exposure and ice cover of the sam- and NLO moraines (Fig. 11), both at the ice-proximal end of
ples prior to emplacement. Both of these conditions are likely the northern Lower Roberts transect, fall within the “erosion
if these boulders were sourced from the adjacent outcrop area island” on the two-nuclide diagram, indicating that their true
of sandstone on the Bowl headwall (Fig. 4a). Thus, we con- exposure ages are older than the apparent ages for either nu-
sider it most plausible that the apparent exposure ages of clide. In addition, these clasts have apparent ages higher than
these sandstones reflect prior exposure and, thus, overesti- most 3 He ages from these moraines (Fig. 12). Again, this is
mate the true age of the moraine. In general, these results best explained if the scatter exhibited by these moraines is
imply that high scatter in exposure ages for moraines in the largely the result of inheritance.
Bowl are most likely explained by inherited nuclide concen-
https://doi.org/10.5194/tc-14-2647-2020 The Cryosphere, 14, 2647–2672, 2020You can also read