Integrated proteomic and transcriptomic profiling identifies aberrant gene and protein expression in the sarcomere, mitochondrial complex I, and ...
←
→
Page content transcription
If your browser does not render page correctly, please read the page content below
Williams et al. BMC Genomics     (2021) 22:438
https://doi.org/10.1186/s12864-021-07758-0

 RESEARCH                                                                                                                                           Open Access

Integrated proteomic and transcriptomic
profiling identifies aberrant gene and
protein expression in the sarcomere,
mitochondrial complex I, and the
extracellular matrix in Warmblood horses
with myofibrillar myopathy
Zoë J. Williams*, Deborah Velez-Irizarry, Keri Gardner and Stephanie J. Valberg

  Abstract
  Background: Myofibrillar myopathy in humans causes protein aggregation, degeneration, and weakness of skeletal
  muscle. In horses, myofibrillar myopathy is a late-onset disease of unknown origin characterized by poor
  performance, atrophy, myofibrillar disarray, and desmin aggregation in skeletal muscle. This study evaluated
  molecular and ultrastructural signatures of myofibrillar myopathy in Warmblood horses through gluteal muscle
  tandem-mass-tag quantitative proteomics (5 affected, 4 control), mRNA-sequencing (8 affected, 8 control),
  amalgamated gene ontology analyses, and immunofluorescent and electron microscopy.
  Results: We identified 93/1533 proteins and 47/27,690 genes that were significantly differentially expressed. The
  top significantly differentially expressed protein CSRP3 and three other differentially expressed proteins, including,
  PDLIM3, SYNPO2, and SYNPOL2, are integrally involved in Z-disc signaling, gene transcription and subsequently
  sarcomere integrity. Through immunofluorescent staining, both desmin aggregates and CSRP3 were localized to
  type 2A fibers. The highest differentially expressed gene CHAC1, whose protein product degrades glutathione, is
  associated with oxidative stress and apoptosis. Amalgamated transcriptomic and proteomic gene ontology analyses
  identified 3 enriched cellular locations; the sarcomere (Z-disc & I-band), mitochondrial complex I and the
  extracellular matrix which corresponded to ultrastructural Z-disc disruption and mitochondrial cristae alterations
  found with electron microscopy.

* Correspondence: will3084@msu.edu
Large Animal Clinical Sciences, College of Veterinary Medicine, Michigan
State University, 784 Wilson Road, East Lansing, MI 48824, USA

                                        © The Author(s). 2021 Open Access This article is licensed under a Creative Commons Attribution 4.0 International License,
                                        which permits use, sharing, adaptation, distribution and reproduction in any medium or format, as long as you give
                                        appropriate credit to the original author(s) and the source, provide a link to the Creative Commons licence, and indicate if
                                        changes were made. The images or other third party material in this article are included in the article's Creative Commons
                                        licence, unless indicated otherwise in a credit line to the material. If material is not included in the article's Creative Commons
                                        licence and your intended use is not permitted by statutory regulation or exceeds the permitted use, you will need to obtain
                                        permission directly from the copyright holder. To view a copy of this licence, visit http://creativecommons.org/licenses/by/4.0/.
                                        The Creative Commons Public Domain Dedication waiver (http://creativecommons.org/publicdomain/zero/1.0/) applies to the
                                        data made available in this article, unless otherwise stated in a credit line to the data.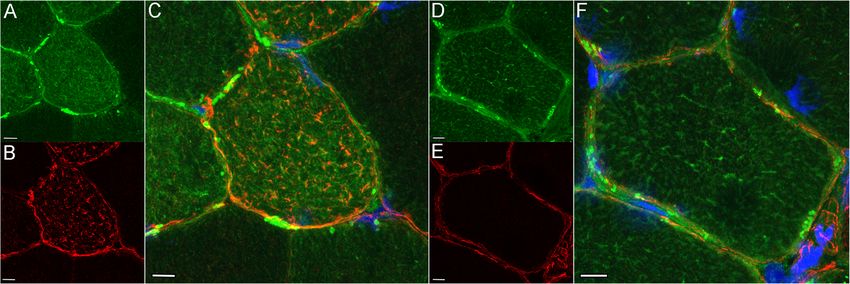
Williams et al. BMC Genomics   (2021) 22:438                                                                   Page 2 of 20

 Conclusions: A combined proteomic and transcriptomic analysis highlighted three enriched cellular locations that
 correspond with MFM ultrastructural pathology in Warmblood horses. Aberrant Z-disc mechano-signaling, impaired
 Z-disc stability, decreased mitochondrial complex I expression, and a pro-oxidative cellular environment are
 hypothesized to contribute to the development of myofibrillar myopathy in Warmblood horses. These molecular
 signatures may provide further insight into diagnostic biomarkers, treatments, and the underlying pathophysiology
 of MFM.
 Keywords: Myofibrillar myopathy, Warmblood, Gluteal muscle, Proteomics, Transcriptomics, Z-disc

Background                                                         Transgenic animal models have confirmed the patho-
Myofibrillar myopathy (MFM) is classically known as a           logic impact of some genetic mutations that result in
late-onset protein aggregate myopathy in humans that            MFM in humans [5, 14–18]. However, tightly controlled
can affect skeletal and cardiac muscle leading to muscle        laboratory environments, homogeneous genetic back-
atrophy, weakness, respiratory compromise, and cardio-          grounds, small animal size, and reduced life expectancy
myopathy [1–3]. In humans, at least 8 genes, some con-          of laboratory animals make it difficult to assess import-
taining more than 70 different mutations, cause MFM             ant variables that may impact the expression of diseases
types 1–8 and an additional 8 genes are associated with         in humans [19]. A naturally occurring model of canine
MFM-like protein aggregate myopathies [3–6]. The                or equine MFM would be beneficial to further evaluate
cause of MFM in approximately 50% of human patients,            the complex mechanisms causing myofibrillar disruption
however, remains unknown [6]. The variety of genes              and protein aggregation [8, 9, 20].
causing desmin aggregate myopathies and the heteroge-              The current knowledge base of underlying pathophysi-
neous clinical signs that arise over a wide range of ages,      ologic mechanisms makes treatment options for MFM
suggest that the underlying basis for MFM is complex,           in humans and horses limited. Identifying new bio-
influenced by both genetic and environmental factors [6,        markers through integrated proteomic, transcriptomic
7].                                                             and metabolomic analyses could provide more targeted
  MFM has recently been described in adult horses of            treatments for this complex disease [21–24]. Multi-omic
Arabian and Warmblood (WB) breeds [8, 9]. Adult WB              approaches highlight key pathways and cellular re-
horses are diagnosed with MFM at on average 11 years-           sponses that stretch beyond the predictive measures of
of-age and show clinical signs of exercise intolerance, a       genomic variation and causative mutations [22]. Tran-
reluctance to move forward under saddle, a mild lame-           scriptomic and proteomic profiling was employed to de-
ness and mild to moderate muscle atrophy [9, 10]. Thus,         lineate underlying pathophysiology of MFM in Arabian
MFM can severely impact a horse’s athletic career and           horses [25]. However, a combined analysis interweaving
even breeding potential. Paralleling MFM in humans,             both transcriptomic and proteomic data to highlight dis-
horses with MFM have myofilament disarray, Z-disc dis-          ease pathways has yet to be implemented in either
ruption, desmin aggregation, focal accumulation of gran-        equine or human MFM.
ulofilamentous material and clusters of degenerate                 Transcriptomic and proteomic profiling of gluteal
mitochondria in skeletal muscle [3, 8, 9, 11]. Despite the      muscle in endurance-trained Arabian MFM horses
similar histopathologic findings, there has been no under-      highlighted alterations in cysteine-based antioxidants
lying monogenic cause identified in WB with MFM. Com-           and metabolic pathways linked to oxidative stress [25].
mercial testing for MFM is not currently recommended            Arabian horses with MFM, however, have much greater
by the authors due to a lack of correlation between the         stamina than MFM WB and different genetic back-
variants evaluated in the genetic tests and a diagnosis of      grounds, therefore the underlying pathophysiology may
MFM by histopathology [12]. Sixteen candidate MFM               have different molecular signatures between breeds. The
genes found to be associated with MFM or MFM-like my-           variation in clinical presentation and severity of equine
opathies in humans have been examined in MFM WB                 MFM between Arabians and Warmbloods suggests that
horses and no significant coding variants were identified       they could be separate diseases or MFM could repre-
when compared to control WB and publicly available data         sents a complex interaction of multiple gene sets of low
[13]. While an underlying genetic cause is still be possible,   effect size that are influenced by environmental factors.
current findings suggest that MFM in WB is likely a com-           We hypothesized that biomarkers and unique molecu-
plex disease with strong environmental influences. The          lar signatures of MFM WB could be elucidated by inte-
etiopathology of MFM in WB could share similarities with        grating proteomic and transcriptomic analyses. The
the 50% of human MFM cases that have an unknown –               objectives of our study were to 1) identify differentially
potentially complex– etiology.                                  expressed proteins (DEP) and their pathways in MFM
Williams et al. BMC Genomics      (2021) 22:438                                                                                     Page 3 of 20

WB muscle using proteomic analyses, 2) identify differ-                   horse was filtered resulting in 76.4% of the filtered reads
entially expressed gene transcripts (DEG) and their path-                 mapping to the equine genome, EquCab 3.0. Of those
ways in gluteal muscle from MFM and control WB                            reads, 97.2% were unique and retained for downstream
using mRNA-sequencing, and 3) integrate the data to                       analysis. After filtering out genes with low read counts,
identify overarching molecular signatures of MFM in                       14,366 total genes were quantified (55.6% of the total
WB and their correspondence to muscle ultrastructure.                     raw reads and 51.9% of the total annotated genes) for
                                                                          DEG analysis between MFM and control WB
Results                                                                   (Additional File 1).
Proteomics
Technical replicates of endogenous control
                                                                          Differential expression
A control sample was divided into two technical repli-
                                                                          There were 47 significantly DEG out of 14,366 genes
cates; each was run in triplicate. There was a significant
                                                                          identified in MFM WB versus control WB with in-
correlation in spectral quantification within runs (r =
                                                                          creased DEG for 34 transcripts and decreased for 13
1.00) and across runs (r = 0.98–1.00), indicating that in-
                                                                          (Fig. 1B). The log2 FC ranged from − 6.7 for hemoglobin
ternal assay validation of runs and technical replicates
                                                                          subunit beta (HBB,) to 4.8 for glutathione specific
was achieved.
                                                                          gamma-glutamylcyclotransferase 1 (CHAC1). Eight of
                                                                          the 47 transcripts were novel transcripts unannotated in
Differential expression
                                                                          the current equine reference genome and 2 of the tran-
There were 93 significantly DEP out of 1533 proteins
                                                                          scripts with locus identification were uncharacterized.
identified in MFM versus control WB (P < 0.003, FDR ≤
                                                                          Eleven of the 47 DEG (23%) had a log2 FC > 2 and
0.05) (Fig. 1A). Foutry-nine DEP had increased expres-
                                                                          are either transcription factors, involved in thiol-
sion and 44 DEP had decreased. The protein with the
                                                                          based glutathione degradation, thiol-based inhibition
highest log2 FC was a Z-disc protein CSRP3 (log2 FC
                                                                          of ubiquitination, or erythrocyte energy metabolism
0.74) and the protein with the most negative log2 FC
                                                                          (Table 2).
was D-dopachrome decarboxylase (DDT, log2 FC −
0.61). The 26 DEP with a log2 FC ≥ 0.30 generally had
functions in the sarcomere and Z disc, mitochondria                       Comparative differential protein and gene expression
complex 1 and protein processing (Table 1). Four blood-                   There was low correlation between DEG and DEP. None
borne proteins including fibrinogen and thrombospon-                      of the 1229 identified gene IDs that were common to
din were also DEP.                                                        both the transcriptomic and proteomic datasets were
                                                                          significantly DE in both datasets. None of the DEG were
Transcriptomics                                                           expressed in the proteomic data. Only HBB from the
mRNA reads and mapping                                                    transcriptomic data > 2 log2 FC was also present in the
A sequencing depth of approximately 75.6 X per horse                      proteomic analysis, however it was not DE. Many of the
was achieved. An average of 56 ± 13.9 million reads per                   27 DE proteins with > 0.3 log2 FC were also expressed in

 Fig. 1 A. Protein expression according to the adjusted P value and the log2 fold change for 1533 proteins. Ninety-three of the proteins were
 significantly DE (P ≤ 0.0027) between MFM and control WB. B. Gene expression according to the adjusted P value and the log2 fold change for
 14,366 genes. Forty-seven of the DE genes were significantly DE (P ≤ 0.0001) between MFM and control WB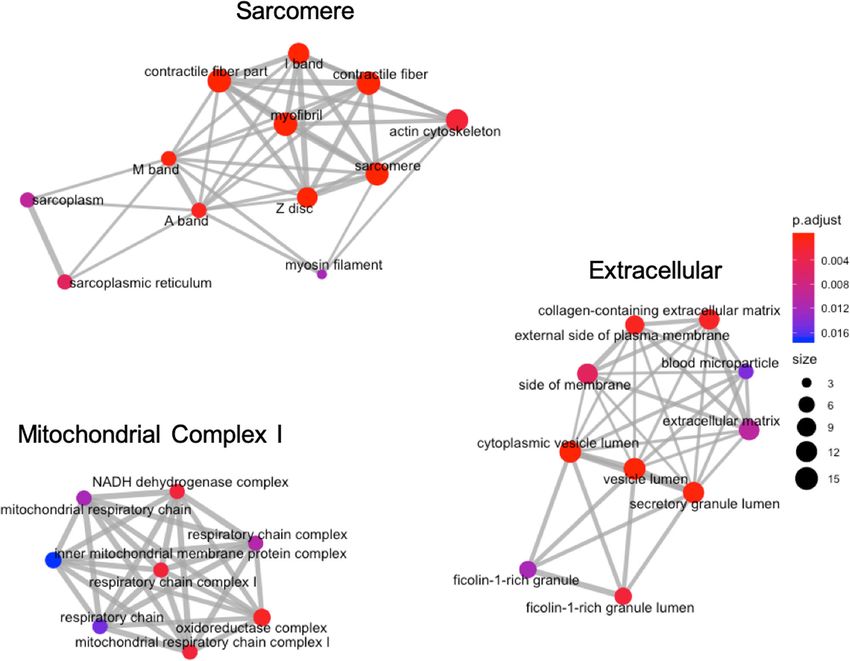
Williams et al. BMC Genomics        (2021) 22:438                                                                                       Page 4 of 20

Table 1 Significantly DE proteins with a log2 fold change of ≥0.30 in MFM WB compared to control WB
Cellular location/     Gene     Protein                               Log2    P        Function                                   Detected in
process                ID                                             FC      adjusted                                            transcriptomics
Sarcomere              CSRP3    Cysteine and glycine-rich protein 3   ↑0.74   0.002     Z-disc regulator of myogenesis            No
                       SMTNL1 Smoothelin-like protein 1               ↑0.62   < 0.0001 Regulates contractile properties           Yes
                       MYBPC1 Myosin-binding protein C, slow-         ↑0.46   < 0.0001 Myosin-muscle contraction, creatine        Yes
                              type                                                     kinase binding
                       PDLIM3   PDZ and LIM domain protein 3          ↑0.34   < 0.0001 Z-disc cytoskeletal organization,          Yes
                                                                                       maintenance
                       SYNPO2 Synaptopodin-2                          ↑0.34   < 0.0001 Z-disc cytoskeletal organization,          Yes
                                                                                       maintenance
                       TNNT1    Troponin T, slow skeletal muscle      ↓0.33   0.0003    Thin filament contractility               Yes
                       NEB      Nebulin                               ↓0.31   0.0005    Thin filament integrity                   Yes
Cytoskeleton           EML1     Echinoderm microtubule-associated ↑0.35       0.002     microtubule cytoskeleton                  Yes
                                protein-like 1
Mitochondria           NDUFV3 NADH dehydrogenase [ubiquinone] ↑0.48           0.0007    complex 1 electron transfer               Yes
                              flavoprotein 3
                       MTND4    NADH-ubiquinone oxidoreductase        ↓0.52   < 0.0001 complex 1 assembly and catalysis           No
                                chain 4
                       APOO     MICOS complex subunit                 ↓0.33   0.0024    maintenance of cristae                    Yes
Protein processing     HNRN     Heterogeneous nuclear                 ↑0.43   0.0002    mRNA processing                           Yes
                       PA1      ribonucleoprotein A1
                       EEF2K    Eukaryotic elongation factor 2        ↑0.37   0.001     Regulates protein synthesis               Yes
                                kinase
                       UCHL1    Ubiquitin carboxyl-terminal hydro-    ↑0.34   0.001     Thiol protease- processing of             Yes
                                lase isozyme L1                                         ubiquinated proteins
                       EIF3C    Eukaryotic translation initiation     ↑0.32   0.0006    mRNA processing                           No
                                factor 3 subunit C
                       BCAP31 B-cell receptor-associated protein      ↑0.34   0.0005    Protein chaperone                         Yes
                              31
                       ASNA1    ATPase ASNA1                          ↓0.32   0.0006    Post-translational delivery proteins to   Yes
                                                                                        ER
Cytoplasm              DDT      D-dopachrome decarboxylase            ↑0.61   0.002     D-dopachrome to 5,6-dihydroxyindole       No
                       CAT      Catalase                              ↓0.30   0.002     Antioxidant- (cytoplasm, mitochondria     Yes
                                                                                        and peroxisomes)
Sarcoplasmic           TRDN     Triadin                               ↑0.52   < 0.0001 Calcium release complex                    Yes
reticulum
Sarcolemma             SLMAP    Sarcolemmal membrane-associated       ↑0.38   < 0.0001 Unfolded protein binding                   Yes
                                protein
Extracellular matrix   CDH13    Cadherin-13                           ↑0.35   0.0004    Cell-cell adhesion                        Yes
Extracellular          HP       Haptoglobin                           ↑0.52   < 0.0001 preproprotein for haptoglobin- binds       No
                                                                                       hemoglobin
                       FGB      Fibrinogen beta chain                 ↑0.46   0.001     Inflammation/blood clot                   Yes
                       FGG      Fibrinogen gamma chain                ↑0.36   < 0.0001 Inflammation/blood clot                    No
                       FGA      Fibrinogen alpha chain                ↑0.34   0.0006    Inflammation/blood clot                   No
                       APOA1    Apolipoprotein A-I                    ↓0.35   < 0.0001 Cholesterol transport                      No

the transcriptomic data, however they were not DE as                          MFM and control WB was observed for CSRP3 (P = 0.8;
gene transcripts at the time of sampling.                                     log2FC = 0.08) or any of the genes on this scaffold.

CSRP3 differential expression                                                 Coding single nucleotide polymorphism analysis
The scaffold NW_019641951 contained six genes, in-                            A total of 72,365 coding single nucleotide polymor-
cluding CSRP3. No differential expression between                             phisms (cSNP) were called for all 16 horses, of which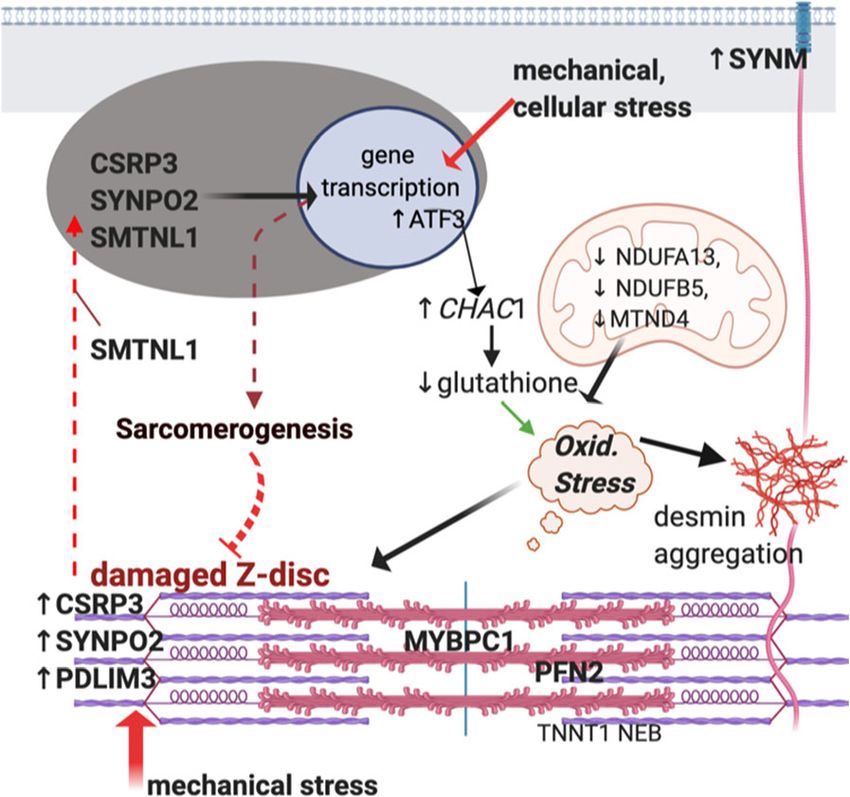
Williams et al. BMC Genomics      (2021) 22:438                                                                                    Page 5 of 20

Table 2 Significantly DE annotated genes with a log2 FC > 2 in MFM WB compared to control WB
Function        Gene ID    Gene                                      log2    P        Function                                Detected in
                                                                     FC      adjusted                                         proteomics
Transcription   CCR7       C-C Motif Chemokine Receptor 7            ↑3.4    0.02      Lymphocyte activation                  no
factors
                NR4A2      Nuclear receptor subfamily 4 group A      ↑2.9    0.031     Steroid-thyroid hormone-retinoid       no
                           member 2                                                    receptor
                GADD45G Growth Arrest and DNA Damage                 ↑2.6    0.014     Response to environmental stresses     no
                        Inducible Gamma
                ATF3       Cyclic AMP-dependent transcription fac-   ↑2.5    0.05      Cellular stress response               no
                           tor ATF-3
                CEBPD      CCAAT/enhancer-binding protein delta      ↑2.5    0.009     Immune and inflammatory responses,     no
                                                                                       myostatin
Thiol-          CHAC1      Glutathione-specific gamma-               ↑4.8    0.006     Glutathione degradation, apoptosis,    no
dependent                  glutamylcyclotransferase 1                                  Notch signaling
                OTUD1      OTU domain-containing protein 1           ↑2.8    0.021     Thiol-dependent ubiquitin-specific     no
                                                                                       protease activity
Immune          ADAM       ADAM Like Decysin 1                       ↓3.5    0.021     Disintegrin metalloproteinase          no
response        DEC1
Cell-cell       THBS1      Thrombospondin                            ↑2.7    0.007     Blood clot formation, inhibits         no
interactions                                                                           angiogenesis
Erythrocyte     AMPD3      AMP deaminase 3                           ↑2.6    < 0.0001 Deaminase activity (erythrocyte form)   no
                HBB        Hemoglobin subunit beta                   ↓6.7    0.019     Oxygen and iron binding                yes not DEP

43.6% had a minor allele frequency > 0.1. There were                        Transcriptomics
1208 variants that mapped to significant DEG and DEP.                       GO analysis for DEG after background correction re-
No significant coding SNPs associated with the MFM                          vealed 15 significantly enriched GO biological process
phenotype when comparing the 8 MFM and 8 control                            terms. The GO term with the lowest adjusted P value
WB (Additional File 2, FDR ≤ 0.05). In the unplaced scaf-                   was response to ketone (GO:1901654, q = < 0.0001, 8 DE
fold containing CSRP3, 236 coding SNPs were identified                      gene transcripts) (Additional File 5). Seven of the 8 re-
from the RNA-seq reads aligned to NW019641951. Of                           sponse to ketone DE genes were also defined as response
these, only 28 passed quality filtering with 11 mapping                     to steroid hormone. There were no significantly enriched
to CSRP3. No cSNP associated with the MFM                                   GO terms for GO cellular location terms or GO molecu-
phenotype.                                                                  lar function (Additional File 4).

Co-inertia analysis                                                         Amalgamated data
The co-inertia analysis (CIA) resulted in a global similar-                 After merging both the DEP and the DEG gene IDs with
ity between transcriptomics and proteomics (RV-coeffi-                      a merged background correction, there was significant
cient) of 0.795. The cumulative proportion of variance                      GO enrichment in biological process, molecular func-
estimated from the first two pairs of loading vectors                       tion, and cellular location terms. Many DEG and DEP
were 0.806 (0.565 and 0.241, respectively). There were                      appeared in multiple terms within their respective GO
71 proteins and 76 genes selected as the top divergent                      category (Additional Files 4, 5 and 6). Interestingly, the
variables from the omics sample space. Five of the DEP                      45 significant GO terms for cellular locations had 3 dis-
(APOA1, HP, HCCS, CSRP3 and APOO) and four of                               tinct clusters that fell within 1) Z-disc and sarcomere
the DEG (CHAC1, HBB, ADAMDEC1 and NR4A2) were                               structure, 2) complex I and the respiratory chain of
among the top selected in the CIA (Additional File 3).                      mitochondria, and 3) extracellular matrix and vesicles
                                                                            (Fig. 2) (Additional File 4).
Enrichment analyses
Proteomics                                                                  Co-inertia analysis
GO biological process yielded one significant enrichment                    The top divergent genes and proteins selected from the
term, cytoskeletal organization (GO:0007010) containing                     co-inertia analysis were combined for pathway enrich-
26 DE proteins. After background correction, there was                      ment with merged background correction. Muscle sys-
no significant enrichment in either GO molecular func-                      tem and circulatory system processes were significantly
tion or GO cellular location (Additional File 4).                           enriched for biological processes, lipoprotein particules
Williams et al. BMC Genomics      (2021) 22:438                                                                                        Page 6 of 20

 Fig. 2 Enriched GO cellular location terms for DE gene transcripts merged with DE proteins in MFM WB. The size of the vertex indicates the
 number of DE target genes in that term. The color of the vertex indicates the adjusted P value and the edges (lines) connecting the vertices
 reflect DE target genes that were common between the GO terms

for cellular component and ferroptosis for KEGG path-                      activity (4/12), actinin/actin binding (3/12), protein lipid
ways (Additional File 7).                                                  complex/binding (2/12), extracellular matrix/cell adhe-
  There were 126 significant GO biological terms and                       sion (2/12) and structural constituent of muscle (1/12)
those that contained more than 10 gene IDs included:                       (Additional File 4).
purine nucleotide metabolic process (7/39 terms),                            Reactome pathway analysis of amalgamated data re-
muscle cell development/ contraction/differentiation (6/                   vealed 11 significantly enriched pathways. The pathway
39), ribonucleotide/ribophosphate metabolic process (4/                    with the most DEP and DEG was metabolism of amino
39), nucleoside/tide metabolic process (3/39), cellular                    acids and derivatives (R-HSA-71291, q = 0.02). Similar to
adhesion/regulation (3/39), response to inorganic/toxic                    the GO analysis, there was overlap between pathways
substance (2/39), cofactor/precursor energy metabolism                     and DE gene IDs (Additional File 8), but metabolism of
(2/39), heterocyclic or aromatic compound metabolism                       amino acids and derivatives (R-HSA-71291) and striated
(2/39), apoptotic signaling (2/39), actin filament                         muscle contraction (R-HSA-390522, q = 0.07) were path-
organization (2/39), blood circulation (2/39), response to                 ways that had no overlap. The remaining pathways were
oxidative stress/reactive oxygen species (2/39), nitrogen                  integrin signaling (R-HSA-9006921) with the largest
catabolic process (1/39), and protein post-translational                   amount of overlap in related pathways and complex I
modification (1/39) (Additional File 4).                                   biogenesis (R-HSA-6799198) which shared DE genes
  There were 12 significant GO molecular functional                        with respiratory chain electron transport (R-HSA-
terms included: NADH dehydrogenase/oxidoreductase                          611105) (Additional File 4).
Williams et al. BMC Genomics (2021) 22:438 Page 7 of 20
Amalgamated STRING analysis Immunofluorescent microscopy
After filtering, the STRING protein interaction network Equine heart stained intensely for CSRP3 as a positive
revealed 4 distinct clusters of protein interactions spe- control, whereas sections incubated without the primary
cific to the sarcomere, extracellular matrix, mitochon- or secondary antibody had no background staining as
drial and ribosomal/translational activity (Additional did a tissue not expected to contain CSRP3 (equine
Files 9 and 10). liver) (Additional File 11). CSRP3 staining was evident in
type 2A and occasionally type 2AX fibers (Fig. 4 A-D) of
MFM electron microscopy both control and MFM horses. CSRP3 staining had a
Z-disc streaming and myofilament disarray were appar- striated appearance showing colocalization with desmin
ent in several regions of muscle fibers of 5 MFM WB ex- at the Z disk in some regions of MFM WB muscle fibers
amined with many other regions of myofibers having (Fig. 5 A-F). Muscle fibers with intense CSRP3 staining
normal myofibril alignment (Fig. 3A). A few regions of had a disrupted sarcoplasmic architecture compared to
myofibrils had severe myofibrillar disruption with not- controls in MFM horses (Fig. 6 A-F). CSRP3 staining
able ectopic accumulation of Z-disc material (Fig. 3B, colocalized with desmin aggregates in some type 2A fi-
C). Mitochondria appeared to have a normal appearance bers (Fig. 6 A-C) (Additional File 12).
in many regions of the myofiber, however, subsarcolem-
mal areas contained mitochondria with pleomorphic Discussion
shapes in some regions and other regions showed mito- Myofibrillar myopathy can prematurely end an equine
chondria varying in the density and arrangement of cris- athlete’s career by causing exercise intolerance, muscle
tae (Fig. 3D). atrophy, myofibrillar disruption, and ectopic protein
Fig. 3 A. Normal appearing myofibrils adjacent to myofibrils with Z-disc disruption (arrow) and myofilament disarray in an MFM WB. 10 k. B.
Marked myofilament disarray and ectopic accumulation of Z-disc material in an MFM WB. 10 k. C. Higher magnification of B. highlighting Z disc
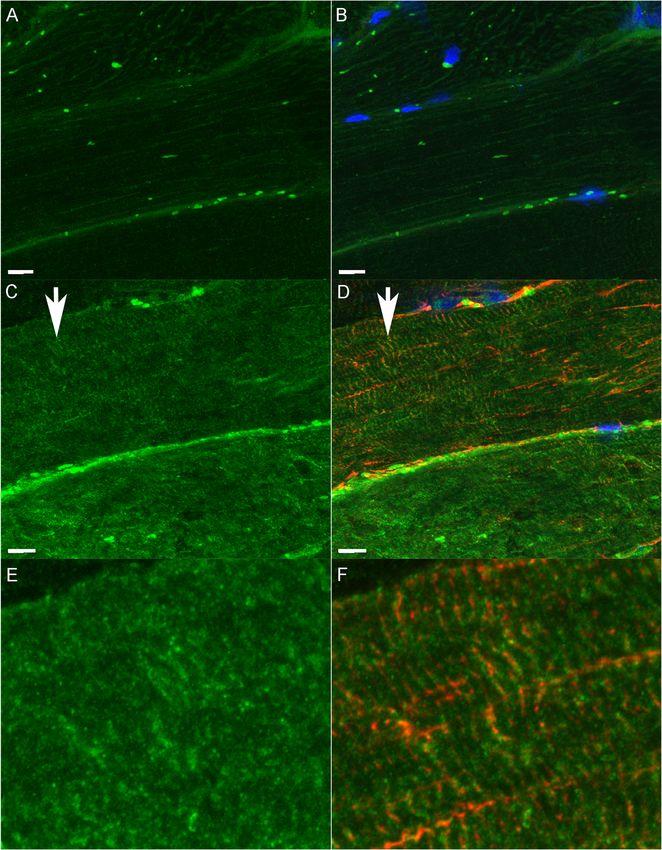
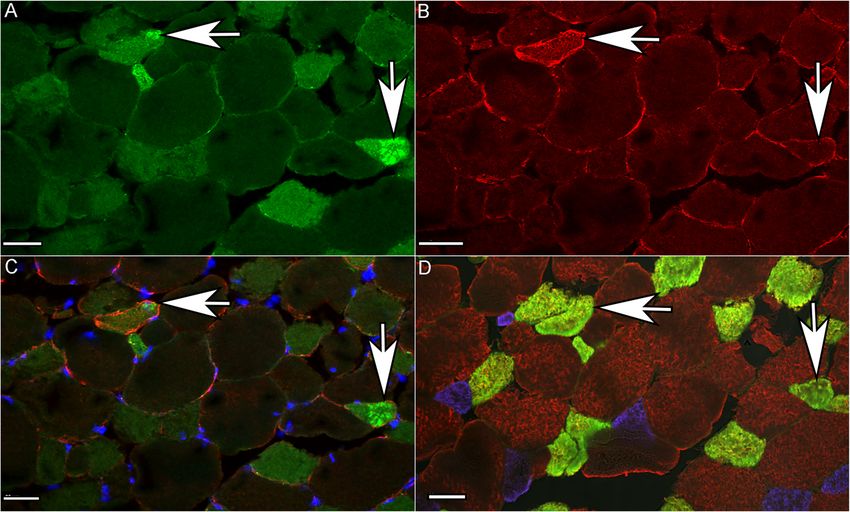
protein aggregation (arrow). 40 k. D. Mitochondria showing variability in size and cristae formation in an MFM WB. 27 kWilliams et al. BMC Genomics (2021) 22:438 Page 8 of 20 Fig. 4 Immunofluorescent staining of cross-sections of muscle from an MFM horse. Horizontal and vertical arrows indicate the same fiber in all 4 images. Bar = 40 μm. A. Fibers with more intense CSRP3 staining or aggregates of CSRP3 correspond to type 2A fibers in D (vertical and horizontal arrows). B. Fibers with desmin aggregates corresponded to type 2A fibers in D (horizontal arrow). Some (vertical arrow) but not all fibers with desmin aggregates also had CSRP3 aggregates. C. Merged CSRP3 and desmin showing colocalization of CSRP3 with desmin aggregates (horizontal arrow) in some but not all fibers (vertical arrow). D. Fiber type stain showing type 1 fibers (blue), type 2A fibers (yellow) and type 2X fibers (brown) aggregation. Therefore, MFM has financial implications Ultrastructural evaluation coupled with transcriptomic for horse owners, breeders, trainers, grooms, and riders. and proteomic enrichment analyses all underscored Z- A naturally occurring equine model of MFM offers the disc pathology as a primary characteristic of MFM WB. opportunity to study the disease in depth while in a Our proteomic analysis identified five α-actinin associ- complex environment and also has comparative implica- ated Z-disc proteins that had increased DEP in MFM tions for human MFM. The present study is the first to WB. The co-inertia analysis identified nine additional utilize a combined multi-omic approach amalgamating actin cytoskeletal proteins and one gene as exhibiting di- proteomic and transcriptomic data to investigate bio- vergent expression. Three of these proteins, SYNM, markers and unique molecular signatures of MFM in PDLIM3 (ALP) and CSRP3 (MLP) have well known WB horses. Our amalgamated transcriptomic and prote- functions in myocyte cytoarchitecture [27]. SYNM, an omic enrichment analyses identified 3 distinct enriched intermediate filament, anchors desmin to the Z-disc cellular locations in MFM WB gluteal muscle which par- [28]. PDLIM3 colocalizes with α-actinin and enhances alleled the ultrastructural skeletal muscle pathology. actin cross-linking [29]. CSRP3 interacts with telethonin, Forty-five enriched GO cellular location terms in our in- α-actinin, cofilin-2 and calcineurin at the Z- disc and tegrated analysis of MFM WB clustered to 1) the Z-disc has multiple proposed roles including maintenance of and sarcomere, 2) complex I of the mitochondrial elec- the cytoskeleton, myogenesis and autophagy [30, 31]. tron transport chain, and 3) the extracellular matrix. SYNM, CSRP3 and PDLIM are found in ectopic protein While there were additional enriched GO terms identi- aggregates in human MFM together with desmin and fied, the authors have prioritized discussion of the genes numerous other proteins [28, 29, 32, 33]. Similarly, and proteins corresponding to the 3 cellular locations CSRP3 was also found to colocalize with some desmin highlighted by the amalgamated proteomic and tran- aggregates in MFM WB. scriptomic GO analysis in congruence with ultrastruc- Four of the DEP in MFM WB, CSRP3, PDLIM3, tural alterations observed in the electron micrographs. SYNPO2 (myopodin), SYNPOL2, are proteins integrally As more is discovered about MFM in WB, other path- involved in the Z-disc’s role of sensing, integrating, and ways may have added significance in the pathogenesis of transducing biomechanical stress signals into signaling MFM. responses [27, 34, 35]. CSRP3 and SYNPO2 translocate Disruption of the Z-disc and ectopic Z-disc associated from the cytoplasm to the nucleus in response to phys- protein aggregation are hallmark histologic features of ical stretch, stress or strain where they impact gene tran- MFM in both humans and horses [8, 9, 11, 26]. scription and myogenesis through interactions with
Williams et al. BMC Genomics      (2021) 22:438                                                                                       Page 9 of 20

 Fig. 5 Immunofluorescent staining for CSRP3 and desmin in longitudinal sections of gluteal muscle. Bar = 10 μm. A. Section from a control horse
 stained with CSRP3 showing a normal pattern of staining. The fluorescent spheres appear to be red blood cells. B. Merged CSRP3 and desmin
 staining of the same section from a control horse. Nuclei are blue. C. Longitudinal section of an MFM horse stained with CSRP3 taken at the
 same intensity as the control horse in A. Some, but not all, fibers in the MFM horse had a striated appearance (vertical arrow). D. Merged CSRP3
 and desmin staining of the same MFM section in C showing focal regions of the Z disc that had both CSRP3 and desmin staining (vertical arrow).
 E. Close up view of region under arrow in C showing some striation in the CSRP3 stain. F. Close up view of region under the arrow in D showing
 colocalization of CSRP3 with desmin in some areas

transcription factors such as MyoD [36, 37]. The second                    produces a compensatory adaptation in which the first
most highly DEP, SMTNL1, also undergoes nuclear                            insult from eccentric exercise triggers a signaling cas-
translocation with strong impacts on gene transcription                    cade that prevents damage when exposed to a second
[38, 39]. The integral role that these proteins have in                    exercise bout [42]. The increase in CSRP3, SMTLN,
gene transcription could indicate a potential disruption                   PDLIM3 and SYNPO2 in WB MFM horses could repre-
in adaptive responses to muscle strain or stress in MFM.                   sent an exaggerated adaptive signaling response designed
  Eccentric muscle contractions cause Z-disc damage                        to strengthen a pathologically weakened sarcomere. Al-
and subsequent elevations in CSRP3, PDLIM3 and                             ternatively, an ineffective mechano-signaling response by
SYNPO2 expression [40, 41]. This type of exercise                          CSRP3, PDLIM3 and SYNPO2 could hinder the
Williams et al. BMC Genomics      (2021) 22:438                                                                                    Page 10 of 20

 Fig. 6 Immunofluorescent staining of cross-sections of a myofiber in gluteal muscle from an MFM WB and a control horse. Bar = 10 μm A.
 Disorganized pattern of CSRP3 staining in the myoplasm of an MFM horse compared to the control horse. B. Desmin aggregates in an MFM
 horse. C. Merged image showing colocalization of aggregates of desmin and CSRP3 (orange) in an MFM horse. Colocalization with CSRP3
 occurred in some but not all fibers with desmin aggregates. D. Normal pattern of CSRP3 staining in a control horses taken at the same exposure
 as A. E. Normal pattern of desmin staining in a control horses taken at the same exposure as B. F. Merged desmin and CSRP3 stains in a
 control horse

sarcomere’s ability to adapt and tolerate normal
exercise-associated mechanical forces (Fig. 7) [43].
  Among the four mechanosensing proteins, CSRP3 is
considered a master regulator of muscle function and
has aberrant primary expression patterns reported in hu-
man cardiomyopathy and secondary expression in skel-
etal muscle diseases [44, 45]. CSRP3 staining localized
specifically to type 2A fibers which was the fiber type
that also showed desmin aggregation in MFM WB. Si-
lencing of CSRP3 results in the down-regulation of the
expression of myogenic genes and the up-regulation of
atrophy-related gene expression [45]. Mutations in
CSRP3 have been associated with myofibrillar disarray
and hypertrophic cardiomyopathy in humans [30, 46,
47], however, the coding sequence of CSRP3 in MFM
WB did not contain any variants associated with the
MFM phenotype. Thus, altered CSRP3 expression could
be one of several proteins that play a role in the patho-
genesis or response to the MFM WB phenotype.
  In addition to the Z-disc, Complex I of the mitochon-
drial electron transfer system was a highlighted cellular
location in MFM WB in the GO and STRING analyses.
Seventeen mitochondrial proteins were DE (12 with ↓ex-                      Fig. 7 Proposed mechanism causing MFM WB based on DEG, DEP
pression) in MFM WB relative to controls including 4                        and enrichment analyses. Exercise combined with Z-disc instability
subunits of complex I. Furthermore, complex I biogen-                       in MFM WB induces an increase in PDLIM3, SYNPO3 and CSRP3
esis and oxidoreductase activity were enriched GO cellu-                    protein expression. Nuclear translocation of CSRP3, SYNPO2 and
                                                                            SMTNL1 with TF activation induces gene transcription designed to
lar and molecular function terms in the reactome and
                                                                            strengthen the sarcomere. A primary instability in the Z disc or a
the amalgamated GO analysis in MFM WB. Decreased                            primary defect in mechanosignaling in MFM WB could lead to
complex I expression could lead to altered mitochon-                        inadequate sarcomereogenesis and Z disc repair in MFM WB. A
drial function and cellular oxidative capabilities. Reduced                 decrease in complex I mitochondrial subunits and enhanced
complex I expression could, however, prove beneficial in                    glutathione degradation may be perturbing redox homeostasis with
                                                                            downstream effects of oxidative damage to proteins and
circumstances where complex I is generating excessive
                                                                            aggregation of desmin [43]
reactive oxygen species.
Williams et al. BMC Genomics (2021) 22:438 Page 11 of 20 Oxidative stress arises when reactive oxygen species, reflect a compensatory response of MFM WB muscle to produced largely by complex I, overwhelm antioxidant prevent further sarcomere instability and damage. capacity [48, 49]. Oxidative stress has been implicated as The magnitude of log2 FC for all DEP was relatively a key component of MFM in humans, Arabian MFM small in our study, with CSRP3 showing the highest log2 and may also play a role in MFM WB as suggested by FC at 0.74. Desmin itself was not a DEP, yet desmin ag- the present enrichment analysis of DEG and DEP [8, gregates in mature myofibers were used as the means for 50–52]. The DEG with the largest fold change in MFM phenotyping horses. One potential explanation for the WB and among the top divergent genes in the CIA ana- lack of desmin DE and low log2 FC in proteins in gen- lysis was CHAC1 (4.8 log2 fold change), which encodes eral could lie in the focal nature and fiber type specificity an enzyme that degrades the thiol-based antioxidant of MFM in WB horses. CSRP3 staining and desmin ag- glutathione. As a component of the unfolded protein re- gregates only occurred in type 2A and 2AX fibers within sponse, activation of CHAC1 serves as a cellular stress MFM-WB gluteal muscle and desmin aggregates only response designed to promote apoptosis [52–54]. occurred in a small portion of these type 2A fibers in CHAC1 mRNA expression is promoted by activating agreement with a previous study [9]. Analysis of many transcription factor 3 and 4 (ATF3, ATF4) [53, 54]. normal fibers combined with fewer affected fibers could ATF3 was a significantly DEG (2.5 log2 FC) in MFM WB potentially have diluted the magnitude of DEP. It is pos- and ATF4 although not DE was among the top divergent sible that more type 2A fibers are affected in MFM than genes in CIA. Occurring after exercise, upregulation of those with desmin aggregates and that desmin aggrega- ATF3 regulates the expression of inflammatory cytokines tion in WB MFM represents a late secondary response and promotes molecular adaptations to endurance train- to stabilize the Z-disc. Desmin aggregation can occur ing [55]. Concurrent increases in CHAC1 expression and from a variety of causes beyond mutations in cytoskel- enrichment of oxidative pathways could contribute to etal or Z-disc proteins including dysfunction of oxidative stress in MFM WB by increasing reactive oxy- ubiquitin-proteasome systems, aggresome formation, gen species from complex I and enhancing degradation chaperone inhibited aggresome formation, abnormal p62 of the ubiquitous antioxidant glutathione in skeletal expression, and oxidative stress [51, 69–74]. muscle. Although apoptosis is a beneficial survival re- Human MFM proteomic studies have used laser cap- sponse in mitotic tissues, it has limited benefits in post- ture to compare the proteome of fibers with and without mitotic cells such as muscle that are limited to satellite desmin aggregates within the same patients [32]. Signifi- cell mediated repair [56]. Through its effects on protein cant differences in numerous proteins have been identi- structure, function, aggregation, and apoptosis, oxidative fied between affected and unaffected fibers using this stress could further exacerbate sarcomere disarray and approach with values reported as ratios of spectral inten- myofiber degeneration in MFM WB [51, 57, 58]. sities. The differences in reported spectral intensities Interestingly, the extracellular matrix which plays a and variation in study design make it difficult to com- crucial role in mechanical force transduction, recruit- pare the magnitude of protein expression between the ment of satellite cells for repair, and muscle mainten- human MFM studies and the present WB MFM study. ance, was another enriched cellular location in the Normalized log2 FC were assessed in a study of MFM amalgamated GO and STRING analyses of MFM WB Arabian horses [25] and only 3 proteins were DEP with compared to control WB [59]. The extracellular matrix approximately 3–4 log2 FC differences from control is connected to the sarcolemma through dystroglycan horses. complexes and integrin mediated adhesion [60] Several It was of note that the present study found little cor- of the DEG and DEP localized to the extracellular matrix relation between DEG and DEP. A lack of correlation (GO:0009897) in MFM WB, including increased expres- between proteomic and transcriptomic expression pro- sion of three fibrinogen subunits, thrombospondin and files has been identified previously in other studies [75– neural cell adhesion protein. Fibrinogen can be a driver 77]. On the other hand the global similarity between our of dystrophic skeletal muscle fibrosis [61]. The Reactome transcriptomics and proteomics was moderately high at analysis highlighted integrin signaling pathways (R-HSA- 79%. Potential factors responsible for this disconnect in- 9006921) [62, 63], which are activated by transduction of clude different half-lives of protein and mRNA, with mechanical forces at the Z-disc to the sarcolemma half-lives of sarcomeric proteins being long (3 to 10 through intermediate filaments and the cytoskeleton days), post-translational and transcriptional modifica- [64–68]. Upregulation of α7-integrin protein is believed tions, decreased proteasomal degradation, dysfunctional to be a mechanism to reinforce muscle load-bearing ubiquitination, negative feedback, and timing of cellular structures and resist injury with repeated bouts of exer- response [78–80]. The Z-disc is a dynamic structure cise [60]. Thus, upregulation of the extracellular matrix with proteins exchanging out of and into the Z-band and proteins related to integrin signaling pathways could from cytoplasmic pools [81, 82]. In our study, horses
Williams et al. BMC Genomics   (2021) 22:438                                                                 Page 12 of 20

were sampled at rest at only one time point which could       Muscle biopsy and histologic analyses
have limited our ability to capture temporal relationships    Resting muscle biopsy samples were obtained by one au-
between gene and protein expression and impacts of ex-        thor (SJV) from the gluteus medius muscle by percutan-
ercise. Interstingly, the STRING protein interaction ana-     eous needle biopsy technique [83]. Horses had not
lysis also highlighted several DEP coorelating to             undertaken strenuous exercise in at least the preceding
ribosomal and protein translation which may warrant           48 h. A portion of gluteal muscle was flash frozen in li-
further investigation into the impact that those proteins     quid nitrogen and stored at − 80 °C until analysis and if
play in this disease state. The lack of correspondence be-    the sample was large enough, a portion was placed in
tween DEG and DEP further emphasizes the importance           formalin. Another portion of the sample was oriented in
of amalgamated analyses, as conducted in the present          cross-section and frozen in isopentane chilled in liquid
study, in elucidating molecular characteristics of            nitrogen. This sample underwent a battery of tinctorial
diseases.                                                     and histochemical stains including adenosine triphos-
  The present study was limited to transcript and pro-        phate staining at pH 4.4 and desmin immunohistochem-
tein expression analyses. Similar to genome first ap-         istry as previously described [9]. Formalin-fixed paraffin
proaches, the individual assessment of transcriptomic or      embed samples were stained with desmin. MFM horses
proteomic analyses provides a limited view into the cel-      had a minimum of > four (range 5–177) mature myofi-
lular regulation and response to disease. However, the        bers with desmin aggregates in muscle biopsies (Table 3).
integration of two or more omic modalities has led to         Control horses had no evidence of desmin aggregates or
the expansion of personalized and precision medicine of       other histopathology. Muscle fiber types had been re-
both common and rare diseases ranging from mono-              ported previously for the horses used in the present
genic to complex in origin [24]. Studies seeking to evalu-    proteomic and transcriptomic analyses and there was no
ate a more complete cellular perspective would ideally        difference in muscle fiber type composition for horses
add genomic, epigenomic, and metabolomic profiling            (P = 0.21) (MFM WB type 1: 26% ± 11%, type 2: 74% ±
[22–24].                                                      11%, control WB type 1: 32% ± 6%, type 2: 68% ± 6%)
                                                              [13].
Conclusion                                                       The research was approved by an institutional animal
An amalgamated transcriptomic and proteomic analysis          care and use committee at Michigan State University
identified 3 distinct cellular locations congruent with ul-   (IACUC AUF # 04/16–045-00) in compliance with the
trastructural pathology in WB horses with MFM. The            US National Research Council’s Guide for the Care and
DEG and DEPs associated with these enriched locations         Use of Laboratory Animals, the US Public Health Ser-
have functions in Z-disc organization, mechanosignaling,      vice’s Policy on Humane Care and Use of Laboratory
oxidoreductase electron transport, and oxidative stress.      Animals, Guide for the Care and Use of Laboratory Ani-
It is possible that MFM in WB could arise from aberrant       mals, and Animal Research: Reporting of In Vivo Experi-
mechanosignaling proteins and oxidative stress with im-       ments guidelines.
pacts on gene regulation, sarcomerogenesis, and com-
plex I expression. The molecular signatures identified in     Proteomics
the present study, may provide further insights into diag-    Horses
nostic biomarkers, potential treatments, and the patho-       Muscle samples from five MFM WB (14.4 ± 3 yrs) and
physiology of MFM in WB horses. Further studies,              four control WB (13.8 ± 4.6 yrs) with one biological con-
however, are needed to confirm dysregulation of specific      trol replicate were analyzed on a 10-plex assay (Table 1).
pathways associated with MFM in WB horses.
                                                              Sample preparation, peptide fractionation and mass
Materials and methods                                         spectrometry
Sample collection                                             Protein was extracted from snap frozen gluteal muscle
Case selection                                                biopsies with a radioimmunoprecipitation lysis buffer [G
The MFM WB horses included in the present study had           Biosciences (https://ww.gbiosciences.com/)] and protease
a chronic history of poor performance and exercise in-        inhibitor with a ratio of 25 μl extraction buffer per mg of
tolerance not attributable to an orthopedic lameness.         muscle, while on ice. Protein was then quantified with a
Control WB were matched to the same farm as MFM               bicinchoninic acid assay and pelleted. From each sample,
WB or were located within a 15-mile radius of an MFM          500 μg of protein was digested in trypsin with a Filter-
WB except for one MFM WB that did not have a match-           Aided Sample Preparation protocol and spin ultrafiltra-
ing control. Control WB had no veterinary or owner            tion unit cutoff of 30,000 Da [84]. Reverse phase C18
documented history of exercise intolerance. One author        SepPaks were used to de-salt the resulting peptides (Wa-
(SJV) performed a physical examination of all horses.         ters Corporation, Milford, MA) which were then dried
Williams et al. BMC Genomics (2021) 22:438 Page 13 of 20
Table 3 MFM and control Warmblood (WB) horses used in this study, their sex (male, males castrate, female), age, number of
muscle fibers with desmin aggregates, number of muscle fibers with desmin aggregates/ 4X high power filed (HPF), horses used in
ATPase fiber typing, mRNA-sequencing, proteomic analysis electron microscopy (EM) and immunofluorescence microscopy (IF)
Horse WB breed Sex Age Fibers with desmin Fibers with desmin agg. ATPase Fiber RNAseq Proteomics EM IF
(yrs) agg. /HPF typing
– MFM-WB
1 Danish WB M 12 177 8 – x x x x
2 Dutch WB/ MC 10 61 5 – x – – x
Thoroughbred
3 Oldenburg MC 8 15 5 x x x – –
4 Hanoverian/ F 18 17 5 x x x x x
Thoroughbred
5 Hanoverian/Trakehner MC 10 40 5 x x – – –
6 Danish WB F 16 49 12 x x x – x
7 Holsteiner MC 14 5 1 x x x – –
8 Oldenburg F 6 5 1 x x – – –
9 WB M 8 36 5 – – – – x
10 Dutch WB F 11 6 1 – – – x –
11 Holsteiner MC 11 46 4 – – – x –
12 Dutch WB F 9 12 3 – – – x –
Control-WB
13 Oldenburg M 18 0 0 x x – – –
14 Dutch WB/ MC 7 0 0 x x – – –
Thoroughbred
15 Westphalian MC 13 0 0 x x – – x
16 Hanoverian MC 13 0 0 x x x – –
17 Swedish F 11 0 0 x x – – –
18 Holsteiner F 19 0 0 x x x – –
19 Hanoverian F 15 0 0 x x x – –
20 Belgian WB X MC 10 0 0 x x x – –
21 Irish Sport Horse MC 8 0 0 – – – – x
22 Dutch WB MC 10 0 0 – – – – x
by vacuum centrifugation. Peptide quantification was stageTips [85]. Samples were then dried to 2 μL via vac-
verified by colorimetric peptide concentration using 5 μL uum centrifugation and then frozen at -20C.
from each sample digest.
LC/MS/MS analysis
Isobaric labeling and gel fractionation Samples were suspended in 2%ACN/0.1% Formic Acid
Samples containing 100 μg of peptide were re-suspended to 20uL and an injection of 5uL was automatically made
in 100 μL of 100 mM of TEAB and labeled with TMT10 using a Thermo EASYnLC 1200 (Thermo Fisher Scien-
reagents (Thermo Fisher Scientific, Waltham, MA) per tific, Waltham, MA) onto a Thermo Acclaim PepMap
manufacturer’s protocol. Labeling efficiency was tested RSLC 0.1 mm × 20 mm C18 trapping column and
by mass spectrometry with 5 μL from each sample. Equal washed for ~ 5 min with buffer A. Bound peptides were
sample proportions were mixed, de-salted, dried to a then eluted onto a Thermo Acclaim PepMap RSLC
resulting volume of 2 μL and stored at -20C. Dried pep- 0.075 mm × 250 mm C18 resolving column over 95 min
tides were suspended in Agilent Offgel buffer to a vol- with a gradient of 2%B to 32%B in 84 min, ramping to
ume of 1.5 mL and an Agilent 3100 OFFGEL 100% B at 85 min and held at 100%B for the duration of
Fractionator (Agilent, Santa Clara, CA) was used to frac- the run (Buffer A = 99.9% Water/0.1% Formic Acid, Buf-
tionate the samples into 12 portions over a non-linear 3- fer B = 80% Acetonitrile/0.1% Formic Acid/19.9%H2O)
10pH gradient per manufacturer’s instructions. Follow- at a constant flow rate of 300 nl/min. Column
ing electrophoresis, fractions were de-salted with C18 temperature was maintained at a constant temperatureWilliams et al. BMC Genomics (2021) 22:438 Page 14 of 20
of 50 °C using and integrated column oven (PRSO-V1, Consortium via the PRIDE [91] partner repository with
Sonation GmbH, Biberach, Germany). the dataset identifier PXD019187 and https://doi.org/10.
Eluted peptides were sprayed into a ThermoScientific 6019/PXD019187.
Q-Exactive HF-X mass spectrometer (Thermo Fisher
Scientific, Waltham, MA) using a FlexSpray spray ion Transcriptomics
source. Survey scans were taken in the Orbi trap (120, Horses
000 resolution, determined at m/z 200) and the top Transcriptomic analysis was performed on muscle from
twenty ions in each survey scan are then subjected to eight MFM WB (mean age 13.6 ± 4 yrs) and eight con-
automatic higher energy collision induced dissociation trol WB (13.9 ± 3 yrs) (Table 1).
with fragment spectra acquired at 45,000 resolution. The
resulting MS/MS spectra were converted to peak lists RNA isolation
using Proteome Discoverer, v2.2 (Thermo Fisher Scien- Total RNA was isolated from flash frozen gluteus medius
tific, Waltham, MA) and searched against UniprotKB for samples as previously described [13]. Quantification and
all Equus caballus sequences. Results were appended quality of RNA was assessed using a Qubit Fluorometer
with common laboratory contaminants using the and RNA HS Assay Kit (Thermo Fisher Scientific, Wal-
Sequest HT search algorithm. The search output was tham, MA) and RNA integrity (RIN) was determined
then analyzed using Scaffold, v4.8.4 (Proteome Software, using an Agilent 2100 Bioanalyzer and an Agilent RNA
Inc., Portland, OR), to probabilistically validate protein 6000 Pico Kit (Agilent Technologies, Santa Clara, CA).
identifications (FDR < 0.01). Quantification of reporter Samples with RIN > 7.0 were used for further analysis.
ion intensities is done using the Q + S module within Library construction was performed with a strand-
Scaffold. The proteomic methodology used here has specific polyA capture protocol (TruSeq Stranded
been previously validated and its use is standard proto- mRNA Library, (Illumina, San Diego, CA) and sequen-
col for the Michigan State Proteomics Core [86, 87]. cing was performed in a 2x150bp paired end format
using HiSeq 4000 SBS reagents for a target of 35–40
Quantitative data analysis million reads for each sample. Base calling was done by
Scaffold Q+ (version Scaffold 4.9.0, Proteome Software Illumina Real Time Analysis (RTA) v2.7.7 and output of
Inc., Portland, OR) was used to quantitate TMT Label RTA was sorted and converted to FastQ format with
Based Quantitation peptide and protein identifications. Illumina Bcl2fastq v2.19.1 for analysis.
Peptide identifications were accepted if they could be
established at greater than 95.0% probability by the Scaf- Assembly and mapping
fold Local FDR algorithm. Protein identifications were All paired end RNA-seq reads were initially assessed for
accepted if they could be established at greater than quality using FastQC [92] and MultiQC [93]. Reads with
99.9% probability and contained at least 2 identified pep- adapter sequence contamination were trimmed using
tides. Protein probabilities were assigned by the Protein Trimmomatic [94] and low quality reads (Q ≤ 30) were
Prophet algorithm [88]. Proteins that contained similar filtered with ConDeTri [95]. Filtered reads were mapped
peptides and could not be differentiated based on MS/ to the Equcab 3.0 reference genome (National Center of
MS analysis alone were grouped to satisfy the principles Biotechnology Information https://www.ncbi.nlm.nih.
of parsimony. Proteins sharing significant peptide evi- gov/assembly/GCF_002863925.1/) using Bowtie2 [96] in-
dence were grouped into clusters. Channels were cor- dexes and the Tophat2 aligner [97]. SAMTools [98] was
rected by the matrix in all samples according to the used to retain uniquely aligned reads (76%) for down-
algorithm described in i-Tracker [89]. Normalization stream analysis. The transcriptomes of each horse were
was performed iteratively (across samples and spectra) assembled with Cufflinks [99] to create a unified annota-
on intensities, as described in Statistical Analysis of Rela- tion and quantify the expression of known and novel
tive Labeled Mass Spectrometry Data from Complex genes. HTSeq [100] was used to count the number of
Samples Using ANOVA [90]. Medians were used for reads aligning to the annotated genes, retaining genes
averaging. Spectra data were log-transformed, pruned of with expression observed across all horses in this study.
those matched to multiple proteins, and weighted by an Sequence data have been deposited in the NCBI Se-
adaptive intensity weighting algorithm. Of 108,665 spec- quence Read Archive with BioProject number
tra in the experiment at the given thresholds, 79,921 PRJNA603671 (accessions SRR10997329 to
(74%) were included in quantitation. Differentially SRR10997344).
expressed proteins were determined by applying a per-
mutation test and corrected by Benjamini-Hochberg Differential expression and statistics
(FDR ≤ 0.05, P ≤ 0.003). The mass spectrometry proteo- For the MFM WB and control WB, raw read counts per
mics data have been deposited to the ProteomeXchange gene were normalized using the trimmed mean of M-Williams et al. BMC Genomics (2021) 22:438 Page 15 of 20
values [101]. DE was determined by fitting a negative bi- STRING protein interaction network
nomial generalized log-linear model per gene with diag- A STRING protein interaction analysis was conducted
nosis of MFM as coefficient of interest using EdgeR on the amalgamated DEP and DEG using publically aval-
[102] and corrected for multiple testing with the ible software [110]. Physical networks were assessed
Benjamini-Hochberg method with a false discovery based on confidence or strength of data supporting pro-
rate ≤ 0.05. tein complexes. Active interaction sources included text-
mining, experiments, and databases. The minimum
interaction score was set to the highest confidence
Unplaced scaffold containing CSRP3 (0.90).
The most upregulated protein in MFM horses, cysteine
and glycine-rich protein 3 (CSRP3), was located on the
Transcriptome and proteome co-inertia analysis
EquCab3.0 NW_019641951 scaffold that was discarded
A co-inertia analysis (CIA) was conducted to assess the
in the first quantitation. In order to include CSRP3 gene
correspondence between the collected transcriptomics
expression in our analysis, CSRP3 was assessed by align-
and proteomics datasets. CIA is a multi-variate statistical
ing unmapped RNA-seq reads to NW_019641951 and
method similar to canonical correlation analysis that
DE analysis was then performed using the same negative
aims to quantify the co-variability between two datasets.
binomial GLM.
This correspondence is a global measure of variability
known as the “co-intertia” parameter. To estimate this
Coding single nucleotide polymorphism analysis parameter we used the gene and proteins quantified for
Coding single nucleotide polymorphisms were called the five MFM and four control horses selected for prote-
from all significant DEG and DEP that had mapped gene omics. Log-cpm were estimated for the TMM normal-
IDs using SAMtools bcftools mpileup [103]. Variants ized raw gene read counts and median protein spectral
that were called in 7 or more of the 8 horses per group counts [111, 112]. CIA was performed on the centered
(16 total MFM and control WB), had a PHRED score ≥ and scaled log-cpm of genes and proteins with an iden-
30, and a minimum of 10 reads were retained for statis- tity matrix as positive weights for the samples and the
tical analysis. Variant allele frequencies were compared Eluclidean metric of log-cpm as positive weights for the
between MFM and control WB using a Fisher’s exact gene and proteins, repectively [113]. Pairs of optimal co-
test and a Benjamini-Hochberg test to account for mul- inertia loading vectors were estimated via eigenvalue de-
tiple comparisons (FDR < 0.05). The cSNP analysis was composition as described [113]. The first two loading
also used to perform a genomic relationship matrix vectors of each omic-dataset were used to select the top
[104] which determined that the MFM horses were not 20 divergent genes and proteins from each quadrant and
more closely related than the control horses (maximum evaluated for pathway enrichment. Pathway enrichment
coefficient was 0.01). analyses included GO, Reactome, and KEGG [105–107,
109, 114, 115].
Enrichment analyses
Electron microscopy
Gene ontology analyses
Electron microscopy (EM) had previously been per-
Gene Ontology (GO) enrichment analyses was per-
formed on 2 MFM WB and one control-WB included in
formed for DEG, DEP, and amalgamated DEG and DEP
the transcriptomic and proteomic analyses [9]. EM was
dataset. Significant DE gene symbols were translated to
prospectively performed on 3 additional MFM WB to
ENTREZ gene IDs in the R package org. Hs.eg.db using
substantiate the ultrastructural changes with MFM
the human annotation [105–107] and were then ana-
(Horses 10–12, Table 1). Muscle was fixed in 2.5% glu-
lyzed and depicted with the default settings in cluster-
taraldehyde in 0.1 mol/L sodium cacodylate buffer. Sam-
Profiler R package [108]. This provided pathway
ples were dissected to approximately 5 mm2 oriented
enrichment analysis for biological processes, cellular lo-
longitudinally and processed as previously described [8].
cation, and molecular function.
Immunofluorescence microscopy
Reactome pathway analyses Horses
A reactome pathway analysis was performed for amal- Frozen sections were evaluated for immunofluorescent
gamated DE genes and DE proteins. The converted (IF) microscopy from 5 MFM WB, 3 of which were used
ENTREZ gene IDs annotated to human were analyzed in the proteomic analysis, and 3 control horses. The use
with the R package ReactomePA [109] and depicted with of horses not included in the proteomic analysis was dic-
the default settings in clusterProfiler R package [108]. tating by availability of frozen muscle samples (Table 1).You can also read