Spatial patterns of aboveground phytogenic Si stocks in a grass-dominated catchment - results from UAS-based high-resolution remote sensing
←
→
Page content transcription
If your browser does not render page correctly, please read the page content below
Biogeosciences, 18, 5163–5183, 2021
https://doi.org/10.5194/bg-18-5163-2021
© Author(s) 2021. This work is distributed under
the Creative Commons Attribution 4.0 License.

Spatial patterns of aboveground phytogenic Si stocks in a
grass-dominated catchment – results from UAS-based
high-resolution remote sensing
Marc Wehrhan1 , Daniel Puppe2 , Danuta Kaczorek1,3 , and Michael Sommer1,2,4
1 Leibniz  Centre for Agricultural Landscape Research (ZALF), “Landscape Pedology” Working Group,
15374 Müncheberg, Germany
2 Leibniz Centre for Agricultural Landscape Research (ZALF), “Silicon Biogeochemistry” Working Group,

15374 Müncheberg, Germany
3 Department of Soil Environment Sciences, Warsaw University of Life Sciences (SGGW), 02-776 Warsaw, Poland
4 Institute of Geography and Environmental Science, University of Potsdam, 14476 Potsdam, Germany

Correspondence: Marc Wehrhan (wehrhan@zalf.de)

Received: 5 February 2021 – Discussion started: 3 March 2021
Revised: 27 July 2021 – Accepted: 6 August 2021 – Published: 22 September 2021

Abstract. Various studies have been performed to quantify         aboveground vegetation of various terrestrial ecosystems. We
silicon (Si) stocks in plant biomass and related Si fluxes in     further found spatial patterns of plant aboveground Si stocks
terrestrial biogeosystems. Most studies are deliberately de-      to reflect spatial heterogeneities in soil properties. From our
signed on the plot scale to ensure low heterogeneity in soils     results, we concluded that (i) aboveground biomass of plants
and plant composition, hence similar environmental condi-         seems to be the main factor of corresponding phytogenic
tions. Due to the immanent spatial soil variability, the trans-   Si stock quantities, and (ii) a detection of biomass hetero-
ferability of results to larger areas, such as catchments, is     geneities via UAS-based remote sensing represents a promis-
therefore limited. However, the emergence of new technical        ing tool for the quantification of lifelike phytogenic Si pools
features and increasing knowledge on details in Si cycling        at landscape scales.
lead to a more complex picture at landscape and catchment
scales. Dynamic and static soil properties change along the
soil continuum and might influence not only the species com-
position of natural vegetation but also its biomass distribu-     1   Introduction
tion and related Si stocks. Maximum likelihood (ML) classi-
fication was applied to multispectral imagery captured by an      Biogenic silicon (BSi), i.e. silica precipitates (SiO2 · nH2 O)
unmanned aerial system (UAS) aiming at the identification         synthesized by various organisms, has been recognized as
of land cover classes (LCCs). Subsequently, the normalized        a key factor controlling Si fluxes from terrestrial to aquatic
difference vegetation index (NDVI) and ground-based mea-          ecosystems (Dürr et al., 2011; Street-Perrott and Barker,
surements of biomass were used to quantify aboveground Si         2008; Struyf and Conley, 2012), which mainly results from
stocks in two Si-accumulating plants (Calamagrostis epige-        its pool size and a larger solubility compared to silicate
jos and Phragmites australis) in a heterogeneous catchment        minerals (e.g. Cornelis and Delvaux, 2016). Eukaryotic and
and related corresponding spatial patterns of these stocks to     prokaryotic organisms, i.a., plants, bacteria, fungi, diatoms,
soil properties. We found aboveground Si stocks of C. epige-      testate amoebae, and sponges, are able to synthesize BSi
jos and P. australis to be surprisingly high (maxima of Si        (Clarke, 2003; Ehrlich et al., 2010), and corresponding BSi
stocks reach values up to 98 g Si m−2 ), i.e. comparable to       pools can be found in terrestrial biogeosystems (Puppe et al.,
or markedly exceeding reported values for the Si storage in       2015; Puppe, 2020; Sommer et al., 2006). BSi structures of
                                                                  different origin indicate differences in their physicochem-

Published by Copernicus Publications on behalf of the European Geosciences Union.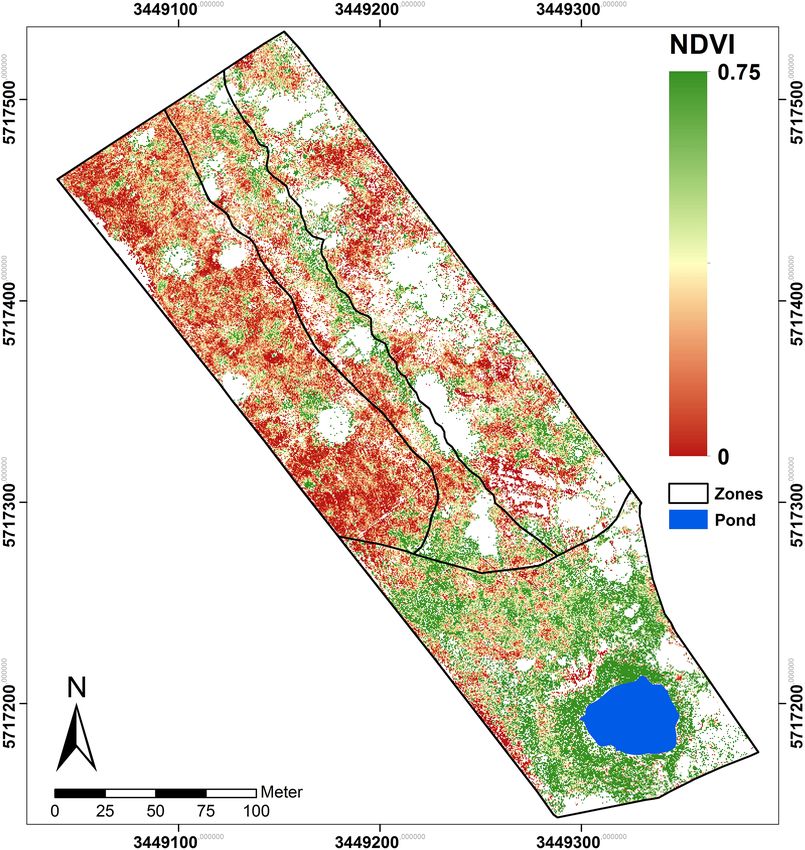
5164          M. Wehrhan et al.: Spatial patterns of aboveground phytogenic Si stocks in a grass-dominated catchment

ical surface properties (Puppe and Leue, 2018), which in           linear, orthogonal or ratio combinations of reflectance cal-
turn control their dissolution kinetics (Bartoli, 1983; Fraysse    culated from different wavelengths ranging from the visible
et al., 2006, 2009). In most terrestrial ecosystems phyto-         (VIS) to the near-infrared (NIR) part of the electromagnetic
genic Si, i.e. BSi synthesized by plants, generally represents     spectrum (Bouman, 1992) and found to be appropriate prox-
the largest BSi pool in soil–plant systems, hence exerting         ies for temporal and spatial variation in vegetation canopies
the strongest influence on Si fluxes into soils (reviewed by       and biophysical parameters (Gao et al., 2000; Haboudane
Schaller et al., 2021). In agricultural soil–plant systems the     et al., 2004). In particular, the normalized difference vege-
recycling of phytogenic Si has been found to boost the bi-         tation index (NDVI), as the most commonly used VI, relates
ological Si feedback loop and to compensate for Si losses          reflectance in red (sensitive to chlorophyll absorption) and
by crop harvest (Alexandre et al., 1997; Blecker et al., 2006;     near-infrared (sensitive to canopy and leaf structure) wave-
Cornelis et al., 2010; Yang et al., 2020; Li et al., 2020; Puppe   bands (Rouse, 1974). Numerous satellite-based studies ap-
et al., 2021).                                                     plied VIs to quantify biophysical vegetation parameters of
   For the majority of higher plants Si is considered a ben-       crops (Moran et al., 1995; Kross et al., 2015), grassland
eficial element, because various positive effects of Si accu-      (Gammon et al., 1995; Wang et al., 2005), pristine or near-
mulation in plants have been revealed, i.e. increased plant        natural ecosystems (Cui et al., 2013; Kim et al., 2015). The
growth and resistance against abiotic and biotic stresses (e.g.    recent development of unmanned aerial systems (UAS) of-
Epstein, 2009; Ma and Yamaji, 2006; Puppe and Sommer,              fers new options for high-resolution observations at land-
2018). In this context, in particular grasses of the family        scape and catchment scales.
Poaceae (or Gramineae) are known as strong Si accumulators            Numerous missions have been conducted over hardly ac-
(Hodson et al., 2005; Katz et al., 2021), and corresponding Si     cessible areas or protected ecosystems such as wetlands
storage in aboveground vegetation, e.g. in the Great Plains or     (Strecha et al., 2012; Zweig et al., 2015), riparian zones of
the tropical humid grass savanna, has been found to be an im-      lakes and rivers (Husson et al., 2014, 2016), estuarine tidal
portant driver in Si cycling (Blecker et al., 2006; Alexandre      flats (Kaneko and Nohara, 2014), riparian forests (Dunford
et al., 2011). Various studies have been performed to quan-        et al., 2009), and Antarctic moss beds (Turner et al. 2014).
tify Si stocks and fluxes in/from the above- and belowground       Most of the studies delineated the patchy and small-scale
plant biomass (e.g. Alexandre et al., 1997; Bartoli, 1983;         distribution of plant communities and identified individual
Cornelis et al., 2010; Sommer et al., 2013; Turpault et al.,       species by using off-the-shelf (partly modified) compact dig-
2018). Most of these studies were performed at (sequences          ital cameras providing an adequate sub-decimetre resolution
of) small-scale plots (< 102 m2 ) with intended low hetero-        in VIS and NIR spectral wavelengths. Successful preprocess-
geneity in soils and plant canopy composition. Often results       ing workflows were developed for UAS imagery as a prereq-
were extrapolated to larger spatial units up to the global scale   uisite for accurate image interpretation (Laliberte et al., 2011;
implicitly assuming similar environmental conditions (e.g.         Berni et al., 2009; Kelcey and Lucieer, 2012; Lelong et al.,
Carey and Fulweiler, 2012). However, the emergence of new          2008; Wehrhan et al., 2016). However, none of these studies
technical features and increasing knowledge on details in Si       addressed both the classification of species composition and
cycling (e.g. the role of lateral fluxes) leads to a more com-     the quantification of respective aboveground biomass frac-
plex picture at landscape and catchment scales. Dynamic and        tions. To the best of our knowledge there has been no study
static soil properties change along the soil continuum and         published until now that finally quantifies aboveground plant
might influence not only the species composition of natu-          Si accumulation and its spatial distribution using UAS re-
ral vegetation but also its biomass distribution and related Si    mote sensing in a heterogeneous catchment and relates the
stocks. In fact, changes in soil properties have been found to     spatial patterns to relevant soil properties.
affect Si bioavailability in soils, leading to changes in plant       In the current study, we apply UAS-based remote sens-
Si concentrations (e.g. Li et al., 2019) with consequences for     ing to the grass-dominated, artificial catchment “Chicken
plant performance and ecosystem functioning (reviewed by           Creek”. It represents an ideal study site for Si cycling at
Katz et al., 2021).                                                catchment scale for several reasons. Firstly, the vegetation
   Remote sensing represents an efficient tool to provide spa-     dynamics and soil development have been intensively mon-
tially consistent information on environmental objects, con-       itored ab initio (e.g. Elmer et al., 2013; Zaplata et al.,
ditions and properties. To identify different land covers or to    2011a, b). From this database the site-specific appearance
assess biodiversity indicators, supervised classification tech-    and spread of two predominant Si accumulators, Calama-
niques such as maximum likelihood (ML) have found wide             grostis epigejos and Phragmites australis (both belonging to
acceptance (Fuller et al., 1998; Otukei et al., 2010; Shafri       the Poaceae family), can be derived, which allows an estima-
et al., 2007; Strecha et al., 2012; Gonzáles et al., 2015). A      tion of mean annual Si uptake rates.
widespread method for the derivation of quantitative canopy           Secondly, extensive soil data (repetitive sampling cam-
properties is the use of vegetation indices (VIs) in combi-        paigns) are available at a 20 m × 20 m grid (Gerwin et al.,
nation with ground-based measurements (Thenkabail et al.,          2011). Potentially important drivers for the observed spatial
2002; Lelong et al., 2008; Zarco-Tejada et al., 2012). VIs are     patterns of plants, such as the soil texture and nutrients, can

Biogeosciences, 18, 5163–5183, 2021                                                   https://doi.org/10.5194/bg-18-5163-2021
M. Wehrhan et al.: Spatial patterns of aboveground phytogenic Si stocks in a grass-dominated catchment 5165
be withdrawn from these data. Thirdly, previous studies al-
ready clarified the BSi pool dynamics in soils at Chicken
Creek during initial pedogenesis (Puppe et al., 2014, 2016,
2017, 2018). Here, we present a methodological approach to
quantify the Si stocks of two Si accumulators (i.e. C. epigejos
and P. australis) at catchment scale and their relationship to
soil-related drivers. In detail we want to answer three major
research questions:
i. How large are aboveground phytogenic Si stocks?
ii. To what extent are spatial patterns of C. epigejos and P.
australis and corresponding Si stocks driven by initial
soil properties?
iii. What are the benefits and limitations of UAS-based re-
mote sensing of phytogenic Si stocks?
2 Methods
2.1 Study area
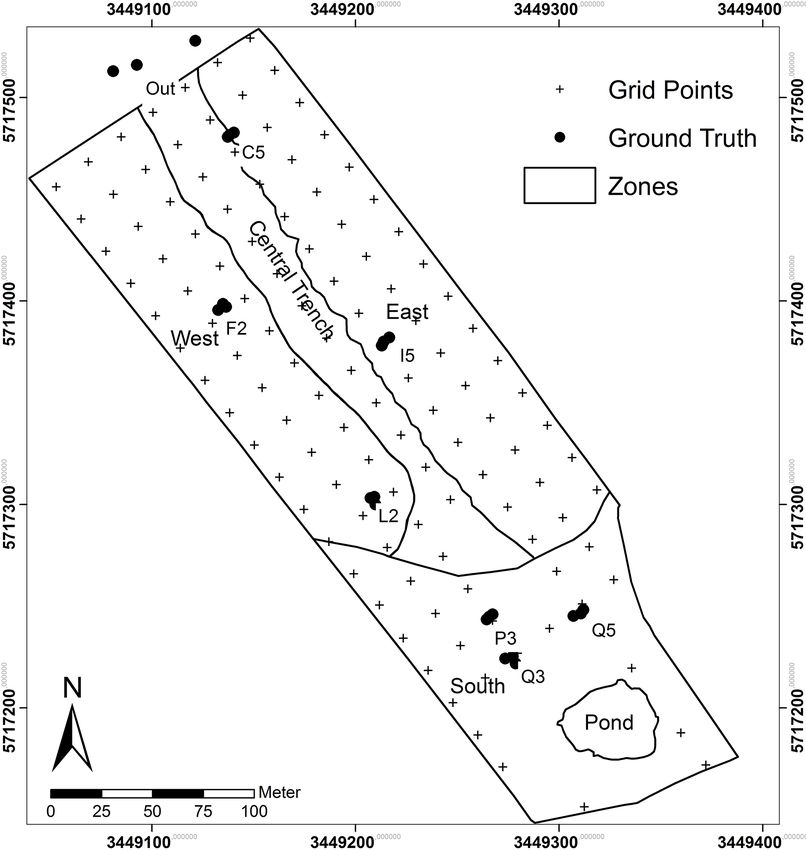
The artificial catchment “Chicken Creek” (6 ha in size, Figure 1. Schematic map of the artificial catchment “Chicken
thereof 5.3 ha fenced) was constructed in an open-cast min- Creek” showing grid points, ground truth sites and zones, delineat-
ing area of Lusatia, Germany (51.6049◦ N, 14.2667◦ E), in ing areas with slightly different soil properties.
2004–2005 (construction finished in September 2005). A 2–
4 m thick, surficial layer of Quaternary sandy sediment was
dumped on a 1–2 m pan-shaped layer of Tertiary clays, which 2.2 Ground-based measurements
seals the whole catchment at its base. In the lower part of
the catchment, additional clay dams were constructed on top 2.2.1 Aboveground biomass
of the clay layer (transverse to the slope). These dams act
as a stabilization barrier preventing the sandy substrate from Ground-based measurements were carried out on 22 Au-
sliding downhill and serve as a funnel to direct groundwa- gust 2014, 1 d after the UAS mission. Shoot biomass (in-
ter flow into the artificial pond downstream (Gerwin et al., clude stems, leaves and inflorescence) with a dominance of
2010). Due to the artificial construction, the lower boundary C. epigejos was sampled at sites C5, F2, I5 and L2, which
conditions of the catchment site are clearly defined including represent raster points equipped for extensive soil moisture
knowledge about the 3D sediment structures (Gerke et al., and temperature monitoring. Three additional sites (CA1 to
2013; Schneider et al., 2011). The construction work left a CA3) were sampled outside of the fenced area to include sites
bare land surface on which natural vegetation could develop of high population densities (Fig. 1). At each site plants were
without disturbance (natural succession) but also created a cut within an area of 50 cm × 50 cm (0.25 m2 ) from three lo-
zonal pattern of soil properties caused by the natural hetero- cations, which represent a (local) gradient of low, medium
geneity of the parent material taken from different areas in and high population densities. Analogously, three sites close
the fore-field according to the progression of the mine (Ger- to raster points P3, Q2 and Q5 with a dominant occurrence
win et al., 2009) (Fig. 1). of P. australis were sampled. The dead, tufted biomass of C.
C. epigejos has been present since the very beginning and epigejos and the brown shoots including the litter of P. aus-
belonged to the most dominating species since 2010, espe- tralis were sampled separately within the same areas. This
cially in the western part of the catchment. P. australis has material of the preceding seasons is referred to as litter here-
also been present from the beginning of vegetation develop- after. A subset of the brown P. australis shoots have been re-
ment in 2006, but it was mainly restricted to the area around tained for further analysis in order to find out whether the Si
the pond in the southern part of the catchment (Elmer et al., content is different from green shoots or not. All plant sam-
2011; Schaaf et al., 2010). The sub-continental climate is ples were oven-dried at 105 ◦ C for 48 h to further determine
characterized by a mean annual precipitation of 563 mm and the Si content.
a mean annual temperature of 8.9 ◦ C.
https://doi.org/10.5194/bg-18-5163-2021 Biogeosciences, 18, 5163–5183, 2021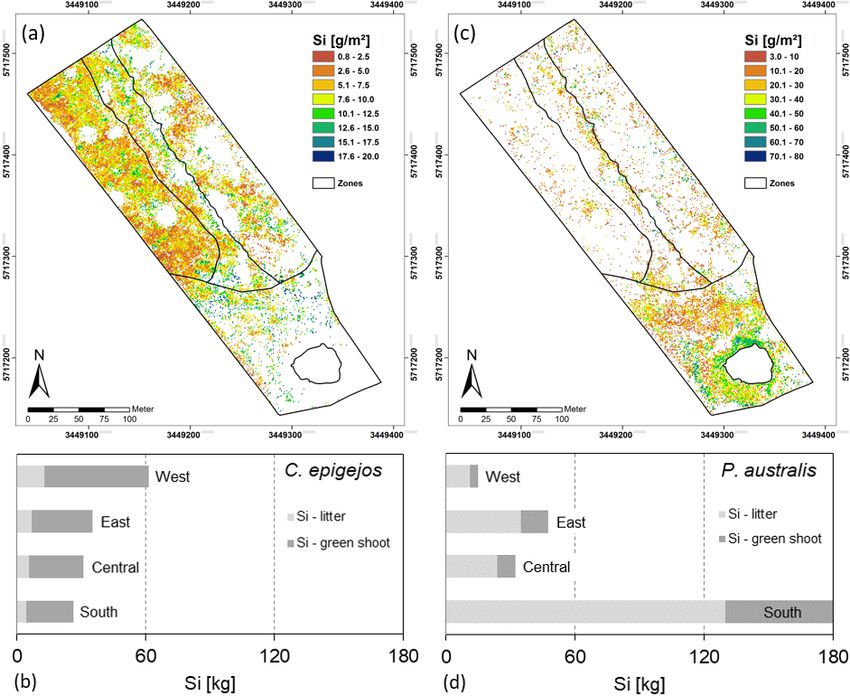
5166          M. Wehrhan et al.: Spatial patterns of aboveground phytogenic Si stocks in a grass-dominated catchment

2.2.2   Si analysis of plant material                             tubes were gently shaken for 20 s by hand to prevent abra-
                                                                  sion of mineral particles from colliding during constant (me-
An aliquot of 5 g from the dried plant material was used to       chanical) shaking by using, e.g. a roll mixer. After extraction,
determine the Si content. The collected plant material was        solutions were centrifuged (4000 rpm, 20 min) and filtrated
carefully washed with distilled water to remove adhering soil     (0.45 µm polyamide membrane filters), and Si was measured
particles and oven-dried at 45 ◦ C. Subsequently the samples      via ICP–OES (ICP-iCAP 6300 DUO, Thermo Fisher Scien-
were milled using a knife mill (Grindomix GM 200, Retsch)         tific Inc). Only plastic equipment was used during the com-
in two steps: 4000 rpm for 1 min and then 10 000 rpm for          plete extraction procedure to exclude any Si contamination.
3 min. Sample aliquots of approximately 100 mg were di-           Analyses of water-extractable Si were performed at a mini-
gested under pressure in PFA digestion vessels using a mix-       mum of two lab replicates per sample.
ture of 4mL distilled water, 5 mL nitric acid (65 %) and 1 mL         The alkaline extractant Tiron (C6 H4 Na2 O8 S2 · H2 O) was
hydrofluoric acid (40 %) at 190 ◦ C using a microwave diges-      used for the detection of potential differences in the amor-
tion system (Mars 6, CEM). A second digestion step was            phous silica stocks (as a proxy of synthesized biogenic and
used to neutralize the hydrofluoric acid with 10 mL of a 4 %      pedogenic siliceous structures representing the main source
boric acid solution at 150 ◦ C. Silicon was measured by ICP-      for plant-available Si), although a partial dissolution of pri-
OES (ICP-iCAP 6300 Duo, Thermo Fisher Scientific GmbH)            mary minerals is well known (Sauer et al., 2006). However,
with an internal standard. To avoid contamination, only plas-     due to the fact that the suitability of the so-called DeMaster
tic equipment was used during the complete procedure. Anal-       technique (which represents the de facto standard method)
yses were performed in three lab replicates.                      for quantification of amorphous biogenic Si has been re-
                                                                  cently questioned (Meunier et al., 2014; Li et al., 2019), we
2.2.3   Soil sampling and soil analysis                           performed no time-course extraction using a short time ex-
                                                                  traction (1 h) for all samples. Based on the short extraction
Soil sampling of the upper 30 cm was carried out subse-           time of only 1 h, we excluded extensive extraction of mineral
quent to catchment completion in 2005 at 124 grid points          Si forms (see Kaczorek et al., 2019). The Tiron-extractable
in a 20 m × 20 m grid (see Fig. 1). Soil samples were anal-       Si (SiTiron ) was determined according to the method de-
ysed for various physicochemical properties (for details see      veloped by Biermans and Baert (1977), modified by Ko-
Gerwin et al., 2010). From these we used data of clay and         dama and Ross (1991). The extraction solution was produced
nitrogen (N), which are known as important drivers for veg-       by dilution of 31.42 g Tiron with 800 mL of distilled wa-
etation development at Chicken Creek (Elmer et al., 2013;         ter, followed by addition of 100 mL sodium carbonate so-
Zaplata et al., 2011a, b). In addition, we analysed the plant-    lution (5.3 g Na2 CO3 + 100 mL distilled water) under con-
available potassium (K), phosphorus (P) and Si content in         stant stirring. The final pH of 10.5 was reached by adding
retained samples from 2005 to evaluate their effects on spa-      small volumes of a 4 M NaOH solution. For the extraction,
tial patterns of C. epigejos and P. australis and corresponding   30 mg of dry soil was weighed into 80 mL centrifuge tubes,
aboveground phytogenic Si stocks.                                 and a 30 mL aliquot of the Tiron solution was added into
   The plant-available K and P were determined with the           it. The tubes were then heated at 80 ◦ C in a water bath for
double-lactate method, which is used in Germany for the           1 h. The extracted solutions were centrifuged at 4000 rpm
determination of plant-available potassium and phosphorus.        for 30 min and filtrated (0.45 µm polyamide membrane fil-
The extraction solution comprises a 0.04 m calcium lactate        ters, Whatman NL 17), and Si concentrations were measured
solution buffered with 0.02 m hydrochloric acid at pH of          by ICP-OES. To avoid contamination, only plastic equipment
3.6 using a soil-to-solution ratio of 1 : 50 (VDLUFA, 1991).      was used during the complete procedure. Analyses of Tiron-
A total of 4 g of air-dried soil (< 2 mm) was weighed into        extractable Si were performed in three lab replicates per sam-
polyethylene laboratory bottles. Afterwards, 200 mL of ex-        ple.
traction solution was added into those bottles and placed on
a mechanical shaker for 90 min. After filtration, the phospho-    2.3   UAS remote sensing
rus concentration was determined by colorimetry (Gallery
Plus, Microgenics), and the potassium concentration was           We used a fixed-wing UAS Carolo P360 (Fig. 2) with a
measured using flame atomic absorption spectroscopy (AAS-         wingspan of 3.6 m and a take-off weight of 22.5 kg. The
iCE 3300, Thermo Fisher). The reported values are in mg K         UAS is equipped with a 12-band multi-camera array Mini-
or P per 100 g dry soil.                                          MCA 12 (MCA hereafter) (Tetracam Inc., CA, USA). The
   Plant-available Si (water-extractable Si; see Sauer et al.,    12 narrow-band filters (between 10 and 40 nm bandwidth)
2006) was determined as described in Puppe et al. (2017). In      cover the spectral range from visible to near-infrared wave-
short, 10 g of dry soil (< 2 mm) was weighed and put into         lengths with focus on the characteristic reflectance features
80 mL centrifuge tubes, and 50 mL distilled water was added       of healthy vegetation (chlorophyll absorption band around
into it with three drops of a 0.1 % NaN3 solution to prevent      660 nm, the red-edge region between 680 and 750 nm) and
microbial activity. Total extraction time was 7 d. Twice a day    one of the water absorption bands around 950 nm. Hereafter,

Biogeosciences, 18, 5163–5183, 2021                                                  https://doi.org/10.5194/bg-18-5163-2021
M. Wehrhan et al.: Spatial patterns of aboveground phytogenic Si stocks in a grass-dominated catchment 5167
ing, is computed using the mean and variance–covariance
matrices of the pixel values representing the training area.
The Jeffries–Matusita (J–M) distance (Kavzoglu and Mather,
2000), the divergence measure used in this study, was com-
puted for all possible LCC pairs. A computed value of zero
indicates that classes are inseparable, and a value of 1414
means total separability (Swain and Davis, 1978).
2.5 Calculation of the normalized difference vegetation
index (NDVI)
The NDVI is an intrinsic vegetation index that simply ac-
counts for the chlorophyll absorption feature in red (R) and
the structural information inherent in high NIR reflectance
of a green vegetation canopy. It does not involve any external
Figure 2. Unmanned aerial system (UAS) Carolo P360 with multi- factor other than the measured spectral information and was
camera array Mini-MCA 12 (visible lenses at the underside of the calculated by
camera).
(NIR − R)
NDVI = , (1)
(NIR + R)
bands are denoted according to their respective centre wave-
length in nanometres (e.g. b713 for the red-edge band). where NIR and R are the reflectance in the near-infrared and
The UAS mission was conducted during the flowering pe- red bands. Since radiometric calibration was renounced in
riod of C. epigejos on 21 August 2014 under acceptable flight this study, NIR and R refer to DNs instead of at-surface re-
conditions (moderate wind speed and little cloud shadow). flectance. In order to investigate the potential of the available
A small negligible area was covered in the southeast part bands in the red edge (RE, the steep incline between VIS and
with no or little occurrence of C. epigejos and P. australis. NIR reflectance typically for green vegetation) and NIR do-
At this time, the foliage is medium green and the large in- main, five variations of the NDVI were calculated. The four
florescences are clearly visible. This facilitates the (i) spatial NIR bands correspond to b831 , b861 , b899 and b953 . In the
delineation and (ii) spectral distinction between C. epigejos case of the RE band b713 , NIR has to be substituted by RE in
populations and dozens of other existing grass-like species. Eq. (1).
Due to camera specifications a unique flight altitude of 163 m Coefficients of determination (R 2 ) were calculated for the
above ground is required to achieve the desired ultrahigh relationships between the examined VIs and the ground-
ground sampling distance (GSD) of ∼ 0.1 m. Details about measured fresh shoot biomass of C. epigejos and P. australis
UAS, camera specifications and mission settings are pre- as individual species and for the pooled dataset consisting
sented in Appendix A1. The post-processing chain including of all measures. Since the fresh litter accumulated during
radiometric corrections, mosaicking and geo-referencing is the preceding seasons was covered by the tall-growing C.
described in more detail in Appendix A2. epigejos and P. australis and therefore cannot be estimated
directly, R 2 values were calculated analogously for the sum
2.4 Image classification of the fresh shoot biomass and litter. The latter was done in
order to find out whether correlations between calculated VIs
A supervised ML classification was applied to identify indi- and fresh shoot biomass and between VIs and fresh shoot
vidual dominant plant species or communities. The ML clas- biomass including the litter can be used for an indirect esti-
sifier requires a proper selected set of training areas for all mation of fresh litter.
objects visible in the image. For this purpose we used field
inspections and available botanical mappings at grid points 2.6 Statistical analysis
(data provided by Markus Zaplata, personal communication,
2016). Details regarding conditions and constraints of the Correlations were analysed using Spearman’s rank correla-
ML classifier are given in Appendix B1. tion (rs , monotonic relationships) and Pearson’s correlation
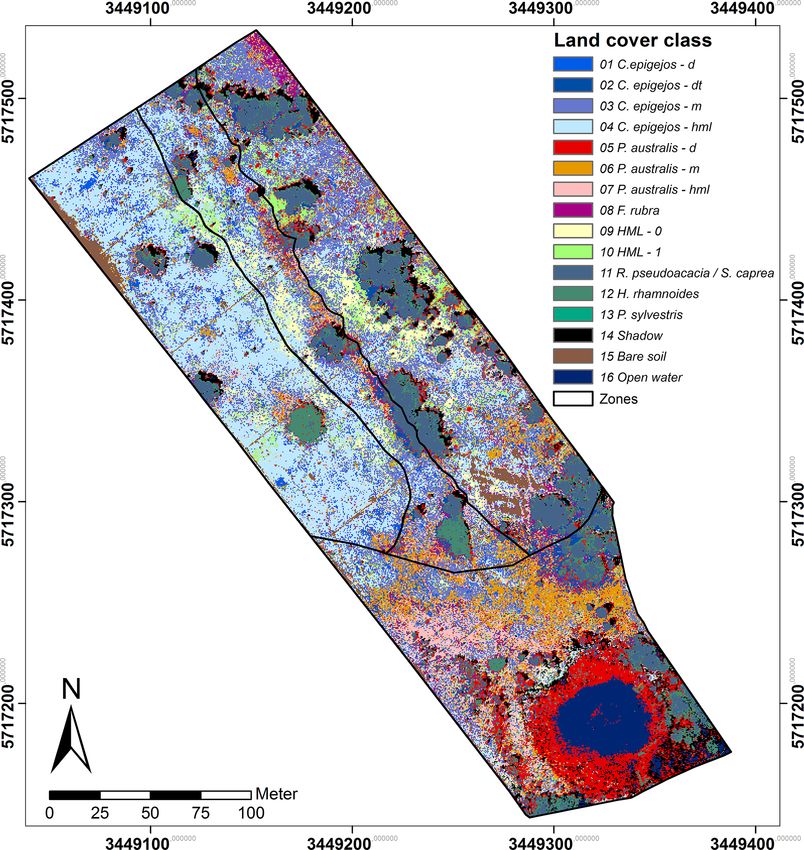
Finally 16 relevant land cover classes (LCCs) were de- (r, linear relationships). Significance between independent
fined including three classes of non-vegetation (shadow, bare samples was tested with the Kruskal–Wallis analysis of vari-
soil, open water) and four classes of legume and non-legume ance (ANOVA) followed by multiple pairwise comparisons
woods (Table 1). The statistical separability of the LCC sig- (Dunn’s post hoc test). Statistical analyses were performed
natures was computed before each classification run. Diver- using the software package SPSS Statistics (version 22.0.0.0,
gence, an often used separability measure in remote sens- IBM Corp.).
https://doi.org/10.5194/bg-18-5163-2021 Biogeosciences, 18, 5163–5183, 20215168 M. Wehrhan et al.: Spatial patterns of aboveground phytogenic Si stocks in a grass-dominated catchment
Table 1. List of the 16 relevant land cover classes (LCC) as predefined for classification on the basis of field survey and botanical mappings.
Group LCC Description
No
Grass-like communities 01 C. epigejos – d Dense population
02 C. epigejos – dt Dense population close to trees (sunlit side of Robinia
pseudoacacia)
03 C. epigejos – m Population with a minor fraction of visible herbs,
mosses and lichens
04 C. epigejos – HML Sparse population with a large fraction of visible herbs,
mosses and lichens
05 P. australis – d Dense population with a particular fraction of shadow
06 P. australis – m Population with a minor fraction of other visible grass-
like species and shadow
07 P. australis – HML Sparse population with a large fraction of visible herbs,
mosses and lichens
08 F. rubra Population of Festuca rubra agg.
Legume and non-legume herbs, 09 HML-0 Herb, moss and lichen populations without any other
mosses visible grass-like species
Lichen (HML) communities 10 HML-1 Herb, moss and lichen populations with a minor fraction
of grass-like species (unidentified)
Legume and non-legume woods 11 R. pseudoacacia/S. caprea Large individuals of Robinia pseudoacacia and Salix
caprea
Individuals 12 H. rhamnoides Large individuals of Hippophae rhamnoides
13 P. sylvestris Small individuals of Pinus sylvestris
Non-vegetation 14 Shadow Shadow of trees and bushes
15 Bare soil Predominately sandy substrate
16 Open water
Table 2. Mean, standard deviation (SD), min, max and coefficient of variation (CV) calculated for fresh and dry biomass samples of C.
epigejos and P. australis. All units in [g m−2 ].
C. epigejos (n = 15) P. australis (n = 9)
Fresh Dry Fresh Dry
green shoot Litter green shoot Litter green shoot Litter (incl. brown shoot) green shoot Litter (incl. brown shoot)
Mean 387 84 214 78 456 634 204 482
Sd 243 39 131 36 262 332 120 310
Min 126 14 57 13 133 251 50 178
Max 1018 150 465 139 830 1337 384 1106
CV [%] 63 47 61 47 58 52 59 64
3 Results Figure 3 depicts the mean signatures of the 16 LCCs. In
Fig. 3a all LCCs other than those classified as C. epigejos
3.1 Image classification or P. australis (8 to 16) revealed large differences and could
thus be clearly distinguished. While open water and shadow
The computed J–M distance for the 120 LCC pairs showed showed the lowest DNs over all spectral bands, the highest
an average of 1386 and a minimum of 1142. While the sig- DNs in the visible range were characteristic for sandy soil
natures of 79 LCCs were almost totally separable (J–M dis- (Stoner and Baumgardner, 1981). Regardless of the use of
tance ≥ 1410), a fair separability existed for 32 LCC pairs DNs instead of reflectance, the signatures of trees and bushes
(J–M distance ≥ 1248). Values below 1249 were computed showed the characteristic features of green vegetation. With
for nine LCC pairs, indicating a poor separability. decreasing chlorophyll content and population densities of
photosynthetically active species (here F. rubra) and a simul-
Biogeosciences, 18, 5163–5183, 2021 https://doi.org/10.5194/bg-18-5163-2021M. Wehrhan et al.: Spatial patterns of aboveground phytogenic Si stocks in a grass-dominated catchment 5169
taneously increasing fraction of shadow, cryptogam species
and dead plant material (LCCs 9 and 10), DNs showed a
more or less monotonous increase in DNs from the VIS to
the NIR wavelength domain. The signatures of LCCs 1 to 7
are depicted in Fig. 3b. The signature of the dense P. australis
population (LCC 5) exhibited a shape similar to the signa-
tures of trees and bushes, but DNs were lower in the NIR
domain influenced by a higher fraction of shadow visible
to the sensor. All other signatures appeared similar regard-
ing the general shape (monotonous increase), but the separa-
bility was fairly high for most of them caused by the lower
overall reflectance and the flatter slope of the signature with
an increasing fraction of visible non-photosynthetic material
and shadow. Amongst the 10 pairs showing poor separabil-
ity, four pairs comprised LCCs describing transitional states
within the same species (e.g. P. australis; LCC 6 and LCC 7)
or could not clearly distinguish between C. epigejos and P.
australis. The first case was uncritical as the respective LCCs
were treated as one LCC in further analysis. The second case
could not be avoided due to co-occurrence within the same
area of interest. However, resulting misclassifications were
negligible with respect to the small differences of Si content
observed for both species.
Constraints had to be accepted regarding the poor separa-
Figure 3. Mean signatures of classified LCCs other than C. epigejos
bility between F. rubra (LCC 8), C. epigejos (LCC 2) and P.
and P. australis (a) and respective signatures of C. epigejos and P.
australis classes (b). Note the different scaling of the y axes.
australis (LCC 6 and 7). Although mean signatures indicated
fair separability at least in the NIR domain, class variances
were large and diminished the separability.
3.2 Spatial coverage and zonal distribution of land
cover classes
C. epigejos (40 %) and P. australis (22 %) cover most of the
area followed by trees, bushes and the respective shadow
with a spatial coverage of 19 %. Legume and non-legume
herbs, mosses and lichens without or with a minor fraction
of grass-like species cover 4.5 % and 4.8 % respectively. The
remaining area was classified as F. rubra (LCC 8; 3.5 %),
open water (3.1 %) and bare soil (2.6 %). The spatial cover-
age of each of the 16 LCCs is depicted in Fig. 4.
The Si accumulators C. epigejos and P. australis showed
a clear zonal distribution. C. epigejos was widespread in
the northern zones of the catchment. Populations with high
density (LCC 1 and 2) occurred regularly near the sunlit
side of R. pseudoacacia (LCC 2). In reality, the populations
were distributed more circularly around the trees, but the
shaded side prevented classification during image acquisi-
tion. Other high-density populations (LCC 1) were predomi-
nately spread as smaller patches in the western zone. A clear
zonal distinction could be observed for the two C. epigejos
classes dominating the northern zones. The sparse popula-
tions (LCC 4) with a spatial coverage of 19 % occurred in
Figure 4. Spatial distribution of classified land cover classes (LCC).
the western zone and the central trench. LCC 3 as the second
largest class (15 %) was widespread in the eastern zone and
the central trench but spatially separated by trees, bushes and
https://doi.org/10.5194/bg-18-5163-2021 Biogeosciences, 18, 5163–5183, 20215170 M. Wehrhan et al.: Spatial patterns of aboveground phytogenic Si stocks in a grass-dominated catchment
larger patches of other LCCs (HML 0 and 1, bare soil). P.
australis mainly occurred in the southern zone of the catch-
ment with a dense population concentrated around the arti-
ficial pond. A narrow band ran from the northwest to the
southeast along the central trench. The less dense and the
sparse populations (LCCs 6 and 7) occurred in a band-like
pattern running in the west–east direction. The zonal pat-
tern reflected mainly wetter areas, i.e. the pond’s fringe or
sites where lateral groundwater flow approached the surface
(return flow). The narrow NW–SE band marked the edge
of an erosion gully along the central trench, and the W–E
band matched the belowground clay dams, where groundwa-
ter flow was forced towards the land surface.
3.3 Ground-based measurements of above ground
biomass of C. epigejos and P. australis
With the exception of the separately sampled litter, the vari-
ation in fresh shoot biomass was larger than the respec-
tive variation at P. australis sites (Table 2). The lowest
amount was sampled at plot I5-2 with 126 g m−2 . In contrast,
amounts at plot CA-1 were 8 times higher (1018 g m−2 ).
Since the sampled litter was predominately dead material, Figure 5. NDVIb713 calculated from Eq. (1) using the red edge
differences between fresh and dry samples were naturally band. The area corresponds with the classified spread of C. epigejos
(LCCs 1–4) and P. australis (LCCs 5–7).
small. However, the overall variance was similar to that of
fresh and dry shoot biomass but it should be noted that no
correlation existed between the two quantities. High amounts
of litter were sampled at plots with low and high shoot ative errors (MREs) [%] for the examined relationships are
biomass (e.g. I5-2 and CA-2 respectively). The variation be- summarized in Table 3.
tween the three plots at one site reflected the small-scale vari- Regarding the band combinations, the NDVI using the RE
ability of the island-like populations of C. epigejos with de- b713 (Fig. 5) was found to be the best predictor for both
creasing shoot biomass from the centre to the margins. While species as well as for fresh green shoot biomass (Fig. 6a)
amounts at L2-3 (centre) were 1.5 times higher than at L2-2 and for the sum of fresh green shoot biomass and fresh lit-
(margin), the factor increased to almost 3 between plots I5-3 ter (Fig. 6b). In both cases high R 2 values could be observed
and I5-2. The separately sampled litter varied within a range for C. epigejos (R 2 = 0.87) and P. australis (R 2 = 0.74 and
between 14 g m−2 (L2-1) and 126 g m−2 (I5-3). R 2 = 0.78 respectively). While the other band combinations
Since there was no access to the dense P. australis popula- performed well for C. epigejos, the predictive power de-
tion in the surroundings of the pond, the highest and lowest creased significantly for P. australis (R 2 range between 0.40
amounts of fresh and dry shoot biomass were collected at site and 0.11). VIs of P. australis showed higher values at the
Q5. The small-scale variability in fresh green shoot biomass same fresh green biomass amounts and generally a larger
(factor of 4.9) was even higher compared with C. epigejos. scatter of values than C. epigejos. This effect was related to
The fresh and dry samples of litter showed a high variance the different plant architecture of the two species. The com-
indicated by a CV of 74 % between plots. Again, the low- bination of broader green leaves and larger but less individual
est and highest amounts were sampled at site Q5 with fresh plants of P. australis led to higher VIs representing the same
weights of 57 g m−2 at Q5-2 and 646 g m−2 at Q5-1. biomass. On the other hand, the number of pixels affected by
shadow with decreasing population densities increased the
scatter of VI values.
3.4 VI performance
3.5 Estimation of dry biomass fractions
All relationships calculated for the combinations between
NDVIs and ground-measured biomass showed a positive Taking into account the results of Sect. 3.3, dry green shoots
linear trend. The low NDVI values, ranging between 0.08 and the sum of dry green shoots and litter were calculated
(C. epigejos; L2-2; NDVIb891 ) and 0.41 (P. australis; P3- separately for each species. The quantities were highly cor-
2; NDVIb856 ) indicated no saturation effects. The respective related, with R 2 values of 0.88 and 0.86 for C. epigejos and
R 2 , root-mean-square errors (RMSEs) [g m−2 ] and mean rel- 0.99 and 0.97 for P. australis. The respective linear regres-
Biogeosciences, 18, 5163–5183, 2021 https://doi.org/10.5194/bg-18-5163-2021M. Wehrhan et al.: Spatial patterns of aboveground phytogenic Si stocks in a grass-dominated catchment 5171
Table 3. R 2 , RMSE and MRE for relationships between examined NDVIs and aboveground biomass of C. epigejos and P. australis.
Fresh green shoot biomass Fresh green shoot biomass plus litter
C. epigejos P. australis C. epigejos P. australis
(litter incl. brown shoot)
Band R2 RMSE MRE R2 RMSE MRE R2 RMSE MRE R2 RMSE MRE
[g m−2 ] [%] [g m−2 ] [%] [g m−2 ] [%] [g m−2 ] [%]
b713 0.87 84 27.3 0.74 126 38.5 0.87 89 19.5 0.79 353 31.3
b861 0.82 100 29.2 0.37 197 55.3 0.81 106 20.9 0.36 389 30.0
b899 0.82 99 31.6 0.33 202 60.6 0.80 108 23.1 0.40 376 29.1
b953 0.73 123 36.6 0.11 234 76.6 0.70 132 27.1 0.21 434 39.7
Figure 6. Response of NDVIb713 to fresh green shoot biomass (a) and the sum of fresh green shoot biomass and litter (b) of C. epigejos and
P. australis.
sions (Fig. 7a and b) were used to model their spatial distri- LCCs 1–4 (C. epigejos) and 5–7 (P. australis). The total Si
bution in a first step. In a second step, the modelled amounts stock (sum of green shoot biomass and litter) accumulated in
of dry green shoots were subtracted from the modelled sum P. australis contributed to 64 % (275 kg) to the total Si stock
of dry green shoots and litter to yield the spatial distribution calculated for the whole catchment (429 kg) despite the fact
of dry litter. that the areal coverage was almost half that of C. epigejos.
This was simply caused by the fact that P. australis formed
3.6 Silicon content and stocks of C. epigejos and P. more dry biomass per unit ground area than C. epigejos (fac-
australis tor of 2.3 on average). The spatial distribution of total Si
stocks calculated on the basis of the real areal coverage of
both species is depicted in Fig. 8a and c. According the
The mean Si content within dry litter of C. epigejos (3.7 %)
higher biomass production, Si stocks of P. australis reached
was 1.8 times higher than the Si content in the dry shoot
a maximum (98 g m−2 ) in the fringe around the pond. The
biomass of the current year (2.1 %). The effect was less
majority between 3 and 60 g Si m−2 occurred in the southern
pronounced for the three analysed fractions of P. australis
zone and in a narrow band along erosion gullies in the central
(Table 4). The Si content ranged between 3.0 % (dry litter
trench.
without dry brown shoot biomass), 2.5 % (dry brown shoot
With the exception of a few patches in the southern zone,
biomass) and 2.3 % (dry green shoot biomass). As we re-
the vast majority of values did not exceed 17 g m−2 in the
garded the sum of the first two fractions as litter, the mean of
case of C. epigejos. It is noticeable that the southern zone
both contents (2.7 %) was used for further calculations. The
showed a clear two-parted internal zonation. The northern
mean fairly represented real conditions since both fractions,
part was a type of a transition zone showing a co-occurrence
on average, contributed to the sum in equal amounts. Finally,
of both species with high Si accumulation in C. epigejos,
the respective Si content was used to calculate the Si stocks in
whereas the southern part was dominated by P. australis in
both fractions of C. epigejos and P. australis. The areas given
the surroundings of the pond. This indicated that the spa-
in Table 4 equal the summed areal coverage of the classified
https://doi.org/10.5194/bg-18-5163-2021 Biogeosciences, 18, 5163–5183, 20215172 M. Wehrhan et al.: Spatial patterns of aboveground phytogenic Si stocks in a grass-dominated catchment
Figure 7. Correlation between fresh and dry green shoot biomass (a) and the respective biomass including litter (b) for C. epigejos and P.
australis.
Table 4. Mean Si content of biomass fractions of C. epigejos and P. australis and respective Si stocks calculated from the areal coverage
derived from ML classification.
Si content [%] Si stocks
Fractions Mean CV [%] [g m−2 ] Area [m2 ] Si [kg]
C. epigejos Shoot biomass 2.1 (0.7) 33 6.0 20 755 125
n = 15 Litter 3.7 (1.0) 27 1.4 30
Total 7.4 155
P. australis Shoot biomass 2.3 (0.4) 17 7.5 10 063 75
n=9 Litter 2.7 (0.4) 13 19.8 199
Total 27.3 274
Catchment 13.9 30 818 429
tial pattern was caused by soil moisture conditions rather in this area and the partially wet and flooded sites around the
than the initial spatial differences in soil properties induced pond.
by construction work and explained the relatively low zonal
contribution of 17 % (26 kg) to the total Si stock of 154 kg 3.7 Relationship between Si stocks of C. epigejos, P.
(Fig. 8b). australis and site properties
Regardless of the accumulated Si in the southern zone and
the central trench, the clear distinction between the eastern From a total of 124 grid points, we excluded all locations in
and western zone was striking. While the western zone con- the central trench due to disturbances in soil properties and
tributed to 40 % (62 kg), only 23 % (35 kg) was accumulated related nutrient availability caused by water erosion com-
in the eastern zone. Values corresponded to mean Si stocks pared to the initial conditions in 2005. Moreover, we ex-
of 4.0 and 2.3 g m−2 respectively. cluded several grid points within the remaining zones located
Figure 8d shows the Si stocks accumulated in P. australis below trees and bushes without any classified occurrence of
calculated for each of the four zones. While the southern C. epigejos and P. australis. Finally, Si stocks and site prop-
zone contributed 66 % (180 kg Si) to the total amount, Si erties of 35 grid points located in the western zone, 32 in the
stocks in northern zones played a minor role. Mean Si stocks eastern zone and 18 in the southern zone were used for statis-
reached 12.2 g Si m−2 in the southern zone but significantly tical analysis. Mean Si stocks were extracted from a squared
lower values in the eastern (3.1 g Si m−2 ) and western (1.0 g area of 25 m2 around each grid point.
Si m−2 ) zones. Although mean Si stocks in the central trench Compared to the zonal means of 4.0, 2.3 and 1.8 g m−2
were similar to those in the eastern zone (3.6 g Si m−2 ), the for C. epigejos, the Si stocks extracted at grid points in-
occurrence of P. australis tended to be more linear along the creased to 4.7 g m−2 in the western zone, 2.6 g m−2 in the
main gully. Regarding habitat requirements of P. australis, eastern zone and 3.3 g m−2 in the southern zone (Fig. 9a).
the occurrence was a result of higher soil moisture conditions However, the ratios of 0.9 for the western and eastern zones
indicated an adequate representation of the grid points for
Biogeosciences, 18, 5163–5183, 2021 https://doi.org/10.5194/bg-18-5163-2021M. Wehrhan et al.: Spatial patterns of aboveground phytogenic Si stocks in a grass-dominated catchment 5173
Figure 8. Spatial distribution of Si stocks of C. epigejos (a) and P. australis (c) and total amounts of Si accumulated in the four zones by C.
epigejos (b) and P. australis (d). Note the different legend scales in (a) and (c).
tistically significant between the western and eastern zones
for C. epigejos and between the southern zone and the other
two zones for P. australis. Among the examined soil proper-
ties, means of clay content (Fig. 10a) showed a correspond-
ing trend with respect to Si accumulation in dry biomass of
C. epigejos for all three zones including the significant dif-
ference between the western and eastern zones (rs = 0.385,
p = 0.001).
Significant differences were found for SiTiron (Fig. 10b)
between the western and eastern zones, whereas values in
Figure 9. Si stocks of C. epigejos (a) and P. australis (b) at grid
the southern zone did not differ very much from those in
points in the western, eastern and southern zones. Numbers rep-
the eastern zone (rs = 0.416, p < 0.001). The water-soluble
resent zonal means (box plots: mean, upper and lower quartiles;
minimum; and maximum). The letters “a” and “b” indicate statisti- Si (Fig. 10c) could be ruled out as a driving factor since
cal significance of differences between zones according to Kruskal– there was no differentiation between means over all zones
Wallis ANOVA (p < 0.05). Note the different scaling of the y axes. (rs = 0.004, p = 0.971). The zonal distribution of the most
important nutrients drew a similar picture. Highly signif-
icant differences of means between the western and east-
both zones. The large difference in the southern zone was ern zones were found for nitrogen (Fig. 10d) and potassium
mainly caused by the two-parted zonation with almost no (Fig. 10e). For both nutrients, slightly higher values com-
occurrence of C. epigejos in more than half of the southern pared to the eastern zone could be observed for the south-
zone area. Zonal Si stocks accumulated in P. australis in the ern zone, which is in accordance with higher Si stocks (N:
western, eastern and southern zones (1.0, 3.1 and 12.2 g m−2 ) rs = 0.412, p < 0.001; KDL : rs = 0.419, p < 0.001). It can
were sufficiently represented by grid points in all zones (1.5, be concluded that PDL is not a driving factor for the spa-
2.6 and 10.0 g m−2 ) (Fig. 9b). According to Kruskal–Wallis tial spread of C. epigejos populations at Chicken Creek,
ANOVA (p < 0.05), differences in mean Si stocks were sta-
https://doi.org/10.5194/bg-18-5163-2021 Biogeosciences, 18, 5163–5183, 20215174 M. Wehrhan et al.: Spatial patterns of aboveground phytogenic Si stocks in a grass-dominated catchment
the tropical humid grass savanna (tall grass Loudetia sim-
plex, 3.3 g Si m−2 ; Alexandre et al., 2011) or forested bio-
geosystems (beech forest: 8.3 g Si m−2 , Sommer et al., 2013;
beech–fir forest: 18 g Si m−2 , pine forest: 9 g Si m−2 , Bartoli,
1983). Maxima of Si stocks at Chicken Creek reach val-
ues (up to 98 g Si m−2 ) that are comparable to the Si stor-
age in wetlands (50 to 100 g Si m−2 ; Struyf and Conley,
2009). Due to the fact that the Si content of C. epigejos and
P. australis is in line with published values for grasses in
general (Hodson et al., 2005), we conclude the observed Si
stocks to be predominantly driven by the (high) biomasses
of both plants. If we assume a more or less steady an-
nual Si accumulation in C. epigejos for 5 years (C. epige-
jos has become one of the most dominating plant species
since 2010; Zaplata et al., 2011b), the mean Si accumula-
tion in the aboveground biomass of C. epigejos amounted
to about 6.0 g Si m−2 yr−1 . If we further assume a similar
time span for the Si accumulation in P. australis, the mean
Si accumulation in the aboveground biomass of P. australis
amounted to about 7.5 g Si m−2 per year. Thus, annual Si
fixation in C. epigejos and P. australis at Chicken Creek ex-
ceeds published data on annual biosilicification rates of tem-
perate forest biogeosystems (beech forest: 3.5 g Si m−2 yr−1 ,
Sommer et al., 2013; beech–fir forest: 2.6 g Si m−2 yr−1 , pine
forest: 0.8 g Si m−2 yr−1 , Bartoli, 1983; Douglas fir forest:
Figure 10. Soil properties and nutrients at grid points in the west- 3.1 g Si m−2 yr−1 , Norway spruce forest: 4.4 g Si m−2 yr−1 ,
ern, eastern and southern zones (box plots: mean, upper and lower black pine forest: 0.2 g Si m−2 yr−1 , European beech forest:
quartiles; minimum; and maximum). Figures depict the distribution 2.3 g Si m−2 yr−1 , oak forest: 1.9 g Si m−2 yr−1 , Cornelis
of clay content (a), Tiron-extractable amorphous Si (SiTiron) (b), et al., 2010).
water-soluble Si (Si – H2 O) (c), nitrogen (d), potassium (e) and In light of potential aboveground biomasses of, e.g., C.
phosphorus (f). Numbers represent zonal means. The letters “a” and epigejos (up to about 700 g m−2 ; Rebele and Lehmann,
“b” indicate statistical significance of differences between zones ac- 2001), our results emphasize the significance of grasses for
cording to Kruskal–Wallis ANOVA (p < 0.05). Si cycling in general. In this context, eutrophication is one
of the most important drivers of the increased abundance of
C. epigejos in many regions of central Europe, especially
since availability was more or less equal in all three zones
eastern Germany, Poland and the Czech Republic (Rebele
(Fig. 10f) (rs = −0.019, p = 0.871).
and Lehmann, 2001), while on the other hand eutrophication
As stated before, the occurrence of P. australis was gov-
might also be one of the drivers of the decline of P. australis
erned mainly by soil moisture conditions. Therefore neither
in numerous European wetlands since the 1950s (van der Put-
examined soil properties nor nutrient availability showed a
ten, 1997).
recognizable impact on the spatial spread along zones. No
Considering the net primary production of the major
significant correlations between Si stocks of P. australis and
biome types worldwide and the average amounts of Si fixed
soil properties were detectable with the exception of SiTiron
in the corresponding vegetation, the significance of grasses
(rs = −0.307, p = 0.007).
for Si cycling becomes much clearer: tropical woodland and
savanna, temperate steppe, tundra, wetland and cultivated
4 Discussion land belong to the biome types where Si is actively accumu-
lated and vegetation is widely dominated by grasses (Carey
4.1 Aboveground phytogenic Si stocks at Chicken and Fulweiler, 2012). Humans directly affect the distribution
Creek and size of these biomes and thus influence corresponding Si
cycling through intensified land use and management change
Mean aboveground Si stocks of P. australis and C. epige- in forestry and agriculture (Struyf et al., 2010; Vandevenne
jos are surprisingly high and are comparable to or markedly et al., 2015a, b). Si exports through harvested crops generally
exceed reported values for the Si storage in aboveground lead to a Si loss in agriculturally used soils (anthropogenic
vegetation, e.g. in the Great Plains (short grass steppe and desilication) (Desplanques et al., 2006; Guntzer et al., 2012;
tall grass prairie, 2.2 to 6.7 g Si m−2 ; Blecker et al., 2006), Keller et al., 2012; Meunier et al., 2008; Vandevenne et al.,
Biogeosciences, 18, 5163–5183, 2021 https://doi.org/10.5194/bg-18-5163-2021M. Wehrhan et al.: Spatial patterns of aboveground phytogenic Si stocks in a grass-dominated catchment 5175
2012). These losses can be compensated for by, e.g., the ap- 4.3 Benefits and limitations of UAS-based remote
plication of phytogenic Si in the form of biochar or crop sensing of phytogenic Si stocks
straw recycling (Li and Delvaux, 2019; Yang et al., 2020;
Puppe et al., 2021). On a global scale, field crops synthesize Natural ecosystems are characterized by an abundant flora,
about 35 % of Si accumulated in vegetation, and this pro- arranged in a complex spatial pattern. Despite the use of
portion is going to increase with increased agricultural pro- ultrahigh-resolution UAS imagery, a sufficient classification
duction within the next decades (Carey and Fulweiler 2016). of all relevant species in an ecosystem is challenging or even
In this context, targeted manipulation of Si cycling might impossible and has been addressed in previous studies (e. g.
be a promising strategy to enhance carbon sequestration in Dunford et al., 2009; Laliberte et al., 2011; Husson et al.,
agricultural biogeosystems to mitigate climate change (Song 2016).
et al., 2014). While larger individuals like trees and bushes are easy
to identify, the size of the majority of species at Chicken
4.2 Initial soil properties as drivers of spatial patterns Creek is far below the 10 cm spatial resolution of the mul-
of C. epigejos and P. australis and corresponding Si tispectral imagery used in our study, and tall growing plants
stocks or broadleaved species prevent the sensor from seeing low-
growing species below. Consequently, and in contrast to the
In general, the composition and structure of plant communi- classification of monocultures, the produced LCC map of the
ties and the spatial distribution of plant biomass are mainly Chicken Creek catchment merely represents the spatial dis-
controlled by climatic, edaphic (e.g. soil moisture/texture, tribution of species or species compositions visible to the
pH and nutrients) and geographic–historic factors as well as sensor. For this reason, we could hardly use the botanical
by species interactions (e.g. consumption by herbivores) and mapping at grid points provided by Markus Zaplata (per-
anthropogenic perturbations (e.g. Polis 1999). At Chicken sonal communication, 2016), to validate our classification,
Creek consumption of plants by herbivores can be generally but we could use these data as a rough quality check. Hence,
excluded, because the total study area is fenced. Studies of training areas for the classification have been defined giv-
Zaplata et al. (2011a, 2013) indicated that differences in veg- ing priority to the two main Si accumulators under study.
etation dynamics at Chicken Creek can be directly derived However, both limitations were of minor importance in the
from slight differences in edaphic conditions resulting from case of P. australis and C. epigejos. Even smaller patches
construction work with large machines (Gerwin et al., 2010). of both species were large enough to be identified with the
In this context, especially differences in soil pH, carbon spatial resolution. With the exception of the transition zone
content, calcium carbonate and conductivity between the northeast of the pond, where C. epigejos co-exists below P.
sandier eastern and the loamier western parts were identi- australis, populations are spatially separated and represent
fied to influence plant species distribution in general (Zaplata the uppermost layer of the canopy within the respective plant
et al., 2013). Our results generally corroborate this differen- community. This may lead to slight underestimations of the
tiation between zones of Chicken Creek with clay, N, KDL spread of C. epigejos and the subsequently estimated Si stock
and Tiron-extractable Si content as important drivers of the in this area. The clear spectral distinction between similar
small-scale distribution of C. epigejos. Süß et al. (2004) signatures prevents many other species from proper classifi-
analysed plant successional trajectories and corresponding cation in general and in particular in the case of only a few
drivers in calcareous sand ecosystems in the northern upper available spectral bands. This limitation can be diminished
Rhine valley in Germany. They found the successional trajec- by choosing an appropriate date for image acquisition, when
tories of C. epigejos to be correlated to total N, extractable the predominately green leaves of C. epigejos and P. aus-
P and K as well as soil moisture. In contrast, the most im- tralis enhance the optical contrast against the background re-
portant nutrients for aboveground biomass production of C. flectance of herbs, mosses and lichens. This cannot avoid the
epigejos seem to be N and calcium, while P and K seem to inclusion of other grass-like species such as F. rubra or B.
have no significant effect on biomass production (Rebele and sylvaticum in one of the C. epigejos or P. australis classes
Lehmann, 2001). This is also in line with our observation that and the confusion with litter in the case of sparse vegetation
PDL seems to be no driver of the small-scale distribution of cover.
C. epigejos at Chicken Creek. Plant-available Si concentra- The majority of studies using the original NDVI, other VIs
tions seem to be no driver for the distribution of C. epigejos or combinations of VIs have been derived from satellite im-
and P. australis as well. This might be a hint that Si accu- agery at the landscape level (e. g. short grass prairie, An-
mulation in plants is probably more influenced by the phy- derson et al., 1993; short grass steppe, Todd et al., 1998;
logenetic position of a plant than by environmental factors rangeland, Mundava et al., 2014; different types of grass-
like temperature or Si availability (see Prychid et al., 2004; land and temperate steppe, Meng et al., 2018) showing poor
Hodson et al., 2005; Cooke and Leishman 2012). up to moderate correlations between VIs and aboveground
biomass. R 2 values range between 0 and 0.6 for either total
biomass or fractions of biomass caused by insufficient spatial
https://doi.org/10.5194/bg-18-5163-2021 Biogeosciences, 18, 5163–5183, 20215176 M. Wehrhan et al.: Spatial patterns of aboveground phytogenic Si stocks in a grass-dominated catchment
and spectral resolution but mainly by background reflectance ductivity (biomass) and anthropogenic desilication on a lo-
of soil, shadow or non-photosynthetic plant components such cal (i.e. site-specific) scale. Due to the fact that ultrahigh-
as standing dead plants or litter. The immense quantity of resolution imagery captured by UASs is capable of differen-
studies which evaluated different sensors with numerous VIs tiating between Si-accumulating species and respective fresh
at various scales and environments hamper a clear assess- biomass and litter, this technique is also a promising tool for
ment of our results. While several studies reported no or mi- the detailed assessment of Si fluxes in grasslands. As Si con-
nor improvements in the relationships between red-edge VIs tent of litter has been recognized as an important driver of de-
involving the wavelength region between 680 and 750 nm composition rates (Schaller et al., 2016, 2017), information
and vegetation parameters (e. g. Cui and Kerekes, 2018; Eas- on litter Si stocks will further help us to better understand
terday et al., 2019), other studies carried out over heteroge- ecosystem biogeochemistry in general.
neous forest stands have proven the red-edge reflectance to
be sensitive to chlorophyll content while largely being unaf-
fected by structural properties and crown shadow (e.g. Zarco- 5 Conclusions
Tejada et al., 2018; Xu et al., 2019). This explains in part
We found mean aboveground Si stocks of P. australis and C.
the outperformance of our results compared to the aforemen-
epigejos to be comparable to or even distinctly higher than re-
tioned studies and the results presented here, in particular
ported values for the Si storage in aboveground vegetation of
for P. australis, which show a drastic decrease in R 2 values
different terrestrial biogeosystems. Biomasses of both plants
when NIR reflectance bands were used instead of the red-
were quite high and have been found to be the main driver of
edge band. The most important benefit of UAS remote sens-
Si stocks at Chicken Creek as Si concentrations of C. epige-
ing of phytogenic Si stocks is its potential to cover the het-
jos and P. australis were in line with previously published
erogeneity in plant biomasses and thus phytogenic Si stocks.
values.
This is in contrast to previous studies, which assumed identi-
From our results we can conclude that the distribution of
cal biomasses for Si stock quantifications (e.g. Cornelis et al.,
C. epigejos and P. australis and corresponding Si stocks at
2010; Sommer et al., 2013; Turpault et al., 2018). In addition,
Chicken Creek are clearly determined by initial soil proper-
these studies mainly focused on a single plant species in a
ties. While we found clay, N, KDL and Tiron-extractable Si
given ecosystem. Conversely, UAS remote sensing enables
contents to be important drivers of the small-scale distribu-
the detection of biomasses of different plant species simulta-
tion of C. epigejos, the distribution of P. australis was mainly
neously and thus the quantification of Si stocks in a lifelike
governed by soil moisture conditions. For the distribution of
way. Furthermore, UAS remote sensing enables the detec-
both grasses and corresponding Si stocks, we found no re-
tion of plant biomasses in larger areas, i.e. at a landscape
lation to plant-available Si concentrations in soils. This sup-
scale, which is also in contrast to previous studies, which
ports our findings that biomasses are the main drivers of Si
used results of small study plots for an extrapolation to larger
stocks at Chicken Creek.
spatial units up to a global scale implicitly assuming similar
The UAS-based remote sensing of phytogenic Si stocks
environmental conditions (e.g. Carey and Fulweiler, 2012).
exhibits several benefits: (i) the heterogeneity in plant
Due to the fact that aboveground biomass of plants seems
biomasses and corresponding Si stocks can be covered, (ii)
to be the main factor of corresponding phytogenic Si stock
biomasses of different plant species can be detected simul-
quantities (the variations in Si content in a plant species in
taneously and (iii) plant biomasses in larger areas, i.e. at a
a given ecosystem are considerably lower, especially when
landscape scale, can be captured. However, UAS-based re-
we assume that the phylogenetic position of a plant – rather
mote sensing of phytogenic Si stocks is aggravated by some
than environmental factors – determines potential plant Si
technical limitations (e.g. the spatial resolution of the multi-
content; see, e.g. Hodson et al., 2005), detection of biomass
spectral imagery) that have to be considered during the inter-
heterogeneities via UAS remote sensing represents a promis-
pretation of results.
ing tool for the quantification of lifelike phytogenic Si pools
at landscape scales.
As both species, C. epigejos and P. australis, analysed
at Chicken Creek show a wide range of biomass (0.1–
98 g m−2 ), the use of mean biomasses in Si stock calculations
or Si cycling models generally leads to deviations and thus
substantial Si stock underestimations or overestimations. For
a profound understanding of Si cycling in general and the
influence of land use in particular, detailed information on
the small-scale spatial distribution of plant-related Si stocks
based on an accurate biomass assessment is urgently needed.
This information will help us to understand the interaction
between edaphic factors, plant distribution, ecosystem pro-
Biogeosciences, 18, 5163–5183, 2021 https://doi.org/10.5194/bg-18-5163-2021You can also read


