Effectiveness of Repeated Sprint Training in Hypoxia vs. with Blood Flow Restriction - Serval
←
→
Page content transcription
If your browser does not render page correctly, please read the page content below
University of Lausanne
 Faculty of Social and Political Sciences
 Institute of Sport Sciences
 Autumn 2020

 Effectiveness of Repeated Sprint Training in Hypoxia vs.
 with Blood Flow Restriction

 A Master Thesis in Human Movement and Sport Sciences
 Presented by Laramée Louis

Director: Prof. Millet Grégoire
Expert: Dr. Malatesta Davide
Thesis defense: Lausanne, 28 January 2021
Acknowledgments

First of all, I would like to thank all the subjects who took part in this study, for their time, their
sweat, their motivation and their hard work.

I express my profound gratitude to my thesis director Prof. Grégoire Millet, for providing me
with this unique opportunity to work on this complex and multidisciplinary scientific research
project, as well as for his guidance and quick feedbacks.

During the data collection and the training phase, I had the chance to work and learn from a lot
of amazing professional people such as Prof. Nicolas Place and PhD student Chris Donelly who
helped me with the neurostimulation, Prof. Fabio Borrani who helped me understand how to
operate the VO2 analyzer, Prof. Bengt Kayser who introduced me to microbiopsies and PhD
student Sonia Condo Alonso who showed me the skills for blood tests.

I would like to specially thank and acknowledge Sarah Jean Willis that had the patience to help
me throughout the entire study. I have never known someone that dedicated to the scientific
work like her. I learned a lot from her. Her constant motivation and will to succeed pushed me
outside my comfort zone. Thank you.

Finally, I can never thank my family and close ones enough for their warm and unwavering
multi-form support throughout this thesis and my academic studies as a whole. I most certainly
could not have done it without them.

 2
Abstract

Introduction: Repeated-sprint training in hypoxia (RSH) is known to improve intermittent
high-intensity performance and repeated-sprint ability (RSA), in particular by enhancing
fatigue resistance. The underlying physiological changes after such short hypoxic exposure,
less than 10 h for 9 sessions, are at the most interest for endurance and team sport athletes.
Repeated-sprint training with blood flow restriction (RS-BFR) seems to impact performance as
well by localized hypoxia and different physiological mechanisms. Therefore the purpose of
this study was to assess the different effects of a three weeks of RSH vs. RS-BFR in young
male adults. Methods: Twenty-four recreationally trained young male adults (25.8 ± 5.2 years,
77.2 ± 6.7 kg, 181 ± 7 cm) were randomly assigned to three groups experimental groups that
performed nine sessions of repeated sprints (six sets of six 6-s maximal sprint with 24 s and 4
min recovery) on an electronic braked cycle ergometer either in normoxia (RSN), or RSH at a
simulated altitude of 3800 m, or RS-BFR with an occlusion percentage at 45% of total arterial
occlusion. Subjects were tested PRE (1 week before) and POST (1 week after) intervention.
Performance tests consisted in a RSA test, a 6-min submaximal test at 1.5w.kg-1, a Wingate test
and a 10-km time trial (TT). The measurement of leg muscle oxygenation was assessed with
near-infrared spectroscopy (NIRS). Measurement of oxygen consumption, lactate, strength,
blood and biopsies were assessed at PRE and POST. Results: Only performance and VO2
values are displayed in this study. RSA mean power output increased to the same extent in the
three groups (p < 0.01) (RSN: 6.3%; RSH: 6.9%; RS-BFR: 7.3%) along with peak power output
(RSN: 8.7%; RSH: 7.4%; p < 0.01) (RS-BFR: 8.8%; p < 0.001). Wingate mean power output
was significantly greater in the RSH (4.2%; p < 0.05) and RS-BFR groups (3.4%; p < 0.05) but
not in the RSN group. 10k TT mean power output was significantly greater post-training for
every group (p < 0.001) (RSN: 9.9%; RSH: 10.1%; RS-BFR: 8.8%). TT cycling economy
values were significantly decreased post-training for the RSH (10.2%; p < 0.05) and the RS-
BFR groups (12.1%; p < 0.01) but not for in RSN group. Conclusion: Both RSH and RS-BFR
lead to greater anaerobic (Wingate) and aerobic (economy) adaptations than the same training
performed in normoxia. Repeated sprint training with BFR was as efficient as RSH with
underlying physiological improvements not totally understood yet.

 3
Résumé
Introduction: L'entraînement de répétition de sprint en hypoxie (RSH) est connu pour
améliorer les performances à haute intensité, la capacité à répéter des sprints (RSA) et
augmenter la résistance à la fatigue. Les changements physiologiques sous-jacents après une
exposition hypoxique aussi courte, moins de 10 h en 9 séances, sont des plus intéressants pour
les athlètes d'endurance et de sports d'équipe. L'entraînement de répétition de sprint avec
restriction du débit sanguin (RS-BFR) semble également avoir un impact sur les performances
par une hypoxie localisée avec différents mécanismes physiologiques. Par conséquent, le but
de cette étude était d'évaluer les différents effets de trois semaines de RSH vs RS-BFR chez des
jeunes hommes adultes. Méthodes: Vingt-quatre jeunes hommes adultes entraînés de manière
récréative (25,8 ± 5,2 ans, 77,2 ± 6,7 kg, 181 ± 7 cm) ont été répartis au hasard dans trois
groupes expérimentaux qui ont effectué neuf sessions de sprints répétés (six séries de six 6 s
maximum sprint avec 24 s et 4 min de récupération) sur un ergocycle électronique soit en
normoxie (RSN), soit RSH à une altitude simulée de 3800 m, ou RS-BFR avec un pourcentage
d'occlusion à 45% de l'occlusion artérielle totale. Les sujets ont été testés PRE (1 semaine avant)
et POST (1 semaine après) intervention. Les tests de performance ont consisté en un test RSA,
un test sous-maximal de 6 minutes à 1,5 w.kg-1, un test Wingate et un contre-la-montre (TT) de
10 km. La mesure de l'oxygénation musculaire des jambes a été évaluée par spectroscopie
proche infrarouge (NIRS). La mesure de la consommation d'oxygène, du lactate, de la force,
du sang et des biopsies a été évaluée au PRE et au POST. Résultats: Seules les valeurs de
performance et de VO2 sont affichées dans cette étude. La puissance moyenne RSA a augmenté
dans la même mesure dans les trois groupes (p
List of figures
FIGURE 1. OXYGEN CASCADE DECREASE IN PO2 FROM ATMOSPHERIC AIR TO THE
 MITOCHONDRIA, IN NORMOBARIC NORMOXIA, AND ITS CAUSES. ADAPTED FROM (M. G.

 MILLET & SCHMITT, 2011). ........................................................................................... 10
FIGURE 2. EFFECT OF HYPOXIA ON THE DECREASE IN PO2 AND ITS EFFECT ON THE OXYGEN
 CASCADE. ADAPTED FROM (MILLET & SCHMITT, 2011).................................................. 10

FIGURE 3. CURRENT PANORAMA OF THE DIFFERENT HYPOXIC TRAINING METHODS FOR A RANGE
 OF ATHLETES ENGAGED IN ENDURANCE AND TEAM-SPORTS. ADAPTED FROM (MILLET ET

 AL., 2013) AND (GIRARD ET AL., 2017).. ........................................................................ 12

FIGURE 4 : LEGS BFR CUFFS USED DURING REPEATED SPRINT CYCLING TRAININGS. ................ 16
FIGURE 5. STUDY DESIGN. ..................................................................................................... 23
FIGURE 6. ONE TRAINING SESSION PROTOCOL. ....................................................................... 25
FIGURE 7. THE ELECTROSTIMULATION PROTOCOL. ................................................................. 26
FIGURE 8. THE REPEATED SPRINT ABILITY TEST (RSA). .......................................................... 27
FIGURE 9. PERFORMANCE VALUES OF MEANPOWER DURING THE REPEATED SPRINT ABILITY
 TEST BETWEEN PRE- AND POST-TRAINING FOR RSN, RSH AND RS-BFR. ........................ 30
FIGURE 10. PERFORMANCE VALUES OF PEAKPOWER DURING THE REPEATED SPRINT ABILITY
 TEST BETWEEN PRE- AND POST-TRAINING FOR RSN, RSH AND RS-BFR.. ....................... 31
FIGURE 11. PERFORMANCE VALUES OF MEANPOWER DURING THE 30S WINGATE TEST BETWEEN
 PRE- AND POST-TRAINING FOR RSN, RSH AND RS-BFR. ................................................ 34

FIGURE 12. PERFORMANCE VALUES OF MEANPOWER DURING THE 10KM TIME TRIAL TEST
 BETWEEN PRE- AND POST-TRAINING FOR RSN, RSH AND RS-BFR.. ............................... 36

FIGURE 13. PHYSIOLOGICAL VALUES OF THE CYCLING ECONOMY DURING THE 10KM TIME
 TRIAL TEST BETWEEN PRE- AND POST-TRAINING FOR RSN, RSH AND RS-BFR.. ............. 37

 5

List of tables

TABLE 1. PHYSIOLOGICAL AND METABOLIC RESULTS FROM THE REPEATED SPRINT ABILITY TEST
 (RSA)........................................................................................................................... 29
TABLE 2. PERFORMANCE AND PHYSIOLOGICAL RESULTS FROM THE SUBMAX TEST (SUBMAX). 32
TABLE 3. PHYSIOLOGICAL AND METABOLIC RESULTS FROM THE 30S WINGATE TEST (WINGATE)
 ..................................................................................................................................... 33
TABLE 4. PHYSIOLOGICAL RESULTS FROM THE 10KM TIME TRIAL TEST (10KTT) .................... 35

 6
Table of contents

1. Introduction .............................................................................................................................................. 9

 1.1 HYPOXIA, DEFINITION AND GENERALITIES ................................................................ 9
 1.1.1 Terrestrial hypoxia ................................................................................................ 9
 1.1.2 Artificial hypoxia ................................................................................................. 11
 1.2 TRAINING IN HYPOXIA ................................................................................................. 11
 1.2.1 REPEATED SPRINT TRAINING IN HYPOXIA .................................................................. 12
 1.2.2 PHYSIOLOGICAL ADAPTATIONS OF RSH TRAINING ..................................................... 14
 1.3 LOCAL HYPOXIA .......................................................................................................... 15
 1.3.1 Blood Flow Restriction ........................................................................................ 15
 1.3.2 Physiological responses of BFR training ............................................................. 17
 1.4 AIMS AND HYPOTHESES ............................................................................................... 19

2. Methods .................................................................................................................................................. 21

 2.1 SUBJECTS .................................................................................................................... 21
 2.2 EXPERIMENTAL DESIGN ............................................................................................... 22
 2.3 FAMILIARIZATION ....................................................................................................... 23
 2.4 TRAINING PROTOCOL ................................................................................................... 24
 2.5 TESTING...................................................................................................................... 25
 2.6 STATISTICAL ANALYSIS: .............................................................................................. 28

3. Results ..................................................................................................................................................... 29

 3.1 RSA RESULTS ............................................................................................................. 29
 3.2 SUBMAX RESULTS ....................................................................................................... 32
 3.3 30S WINGATE RESULTS................................................................................................ 33
 3.4 10KM TIME TRIAL RESULTS ......................................................................................... 35

4. Discussion .............................................................................................................................................. 38

 4.1 RSA ........................................................................................................................... 38
 4.2 SUBMAX ..................................................................................................................... 40
 4.3 30S WINGATE:............................................................................................................. 40
 4.4 10KTT: ....................................................................................................................... 42

 7
5. Practical applications ........................................................................................................................... 43

6. Limitations ............................................................................................................................................. 43

7. Conclusion.............................................................................................................................................. 44

8. Bibliography .......................................................................................................................................... 45

7. Appendix ................................................................................................................................................ 58

 7.1 FOOD QUESTIONNAIRE ................................................................................................. 58
 7.2 PAR-Q QUESTIONNAIRE .............................................................................................. 60
 7.3 INFORMATION FOR PARTICIPANTS ................................................................................ 60
 7.4 DETAILED STUDY INFORMATIONS FOR PARTICIPANTS.................................................... 61
 7.5 CONSENT FORM FOR PARTICIPANTS .............................................................................. 69
 7.6 BORG’S SCALE............................................................................................................. 71
 7.7 RECRUITMENT FLYER .................................................................................................. 72
 7.8 ETHICAL AUTORISATION .............................................................................................. 73

 8
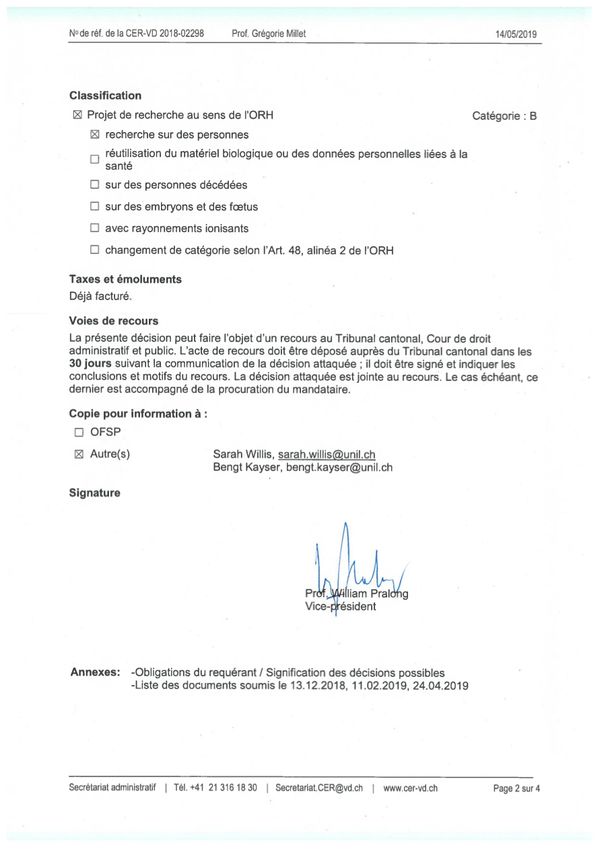
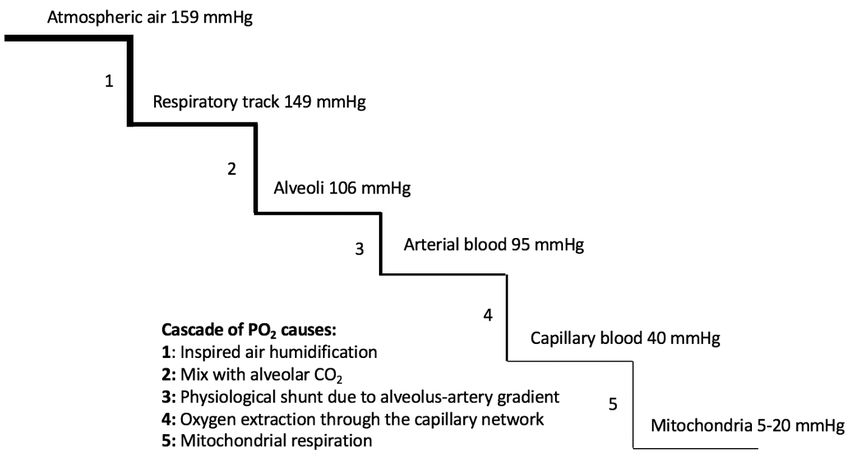
1. Introduction

1.1 Hypoxia

Hypoxia is defined as a discrepancy between the oxygen required by the body tissues and the
insufficient oxygen provided (Schumacker & Cain, 1987). It is possible to distingue two type
of hypoxia: terrestrial hypoxia (hypobaric hypoxia) and artificial hypoxia (normobaric
hypoxia).

1.1.1 Terrestrial hypoxia

The air of the Earth’s atmosphere is composed by 20.93% of O2, 78.08% of N2, 0.03% of CO2,
in addition to others noble gazes, which are negligible due to microscopic volumes (i.e., less
than 30 parts per million). The barometric pressure (Pb) at sea level under normal conditions
(normobaric normoxia, NN) is 760 mmHg (Brimblecombe, 1996).
When the altitude increases, the Pb decreases. However, the air composition does not change.
So, there will be exactly the same quantity of O2, N2, CO2 whether in altitude or at sea level.
According to Dalton’s law (Dalton, 1802) it is known that the partial pressure of oxygen present
in the air (PO2) can be calculated with the following equation: PO2 = FiO2 x Pb, where FiO2 is
the fraction of inspired oxygen present in the air. A lower Pb and PO2 will affect the amount of
oxygen delivered to the cells. In fact, from the entry of the respiratory track all the way down
to the mitochondria in the cells where the oxygen is utilized, a cascade occurs in order to
decrease the oxygen tension to facilitate the exchange. This oxygen cascade declining PO2 is
displayed in Figure 1.
It is important to note that if the altitude is higher, 4000m for instance, the initial PO2 is
diminished up to 97 mmHg (Küpper et al., 2009). Whereas the PO2 decrease, the Pb decreases
likewise which affects the oxygen cascade by delivering a lower quantity of oxygen to the cells
downstream. That is why there is a lack of oxygen for the cells to maintain their functions in
altitude (see Figure 2).

 9
Figure 1. Oxygen cascade decrease in PO2 from atmospheric air to the mitochondria, in
normobaric normoxia, and its causes. Adapted from (Millet & Schmitt, 2011).

Figure 2. Effect of hypoxia on the decrease in PO2 and its effect on the oxygen cascade. Adapted
from (Millet & Schmitt, 2011).

Terrestrial hypoxia is called Hypobaric Hypoxia (HH) type. It is defined once the PO2 attains
less than 150 mmHg.

 10
1.1.2 Artificial hypoxia

It exists different methods to induce artificial hypoxia without the need to be in real altitude. It
is known that training in altitude entails some logistical difficulties such as the obligation to
relocate the training center, which depending on the region may be practically difficult and very
expensive. This is why there has been some interest to develop other facilities to achieve similar
conditions. Whereas the Pb cannot be changed at sea level unless a hypobaric hypoxic (HH)
chamber is set, the FiO2 has to be diminished to affect the PO2. In order to replicate this hypoxic
environment, two different techniques are utilized: Oxygen (O2) extraction or Nitrogen (N2)
dilution. In these cases, where the Pb is not changed but the FiO2 and the PO2 are, the
environment is designated as normobaric hypoxia (NH). Nowadays, this technology is applied
with masks (Altitrainer®), tents, rooms, chambers or even whole lodges or apartments
(CNSNMM Prémanon, France) which allows athletes to train and/or sleep in a simulated
altitude environment controlled and monitored by professionals.

1.2 Training in hypoxia

It all started in the early 1970’s after the dominance of altitude acclimatized athletes during the
Mexico Olympic games (2340 m, PB 580 mmHg). Since this event, altitude/hypoxic training
has become increasingly popular among individual endurance athletes and gained the scientific
interest to investigate the effectiveness of this new training method. At that time, several
altitude training centers (e.g., Font-Romeu in France, Saint-Moritz in Switzerland, Colorado
Spring in USA, Kunming in China) were developed for the exclusive purpose of “Live High
Train High” (LHTH). This extensive exposure, three to four weeks, to hypoxic conditions at
altitude is known to increase erythropoiesis, which is resulting by an augmentation of the red
cells volume and thus also of the hemoglobin ([Hb]) mass. This benefits endurance athletes by
enhancing the O2 carrying capacity and their performance at sea level (Chapman et al., 1998;
Levine & Stray-Gundersen, 1997). However, the major disadvantage of this training method is
that the lack of oxygen affects the training intensity. In fact, the maximal aerobic capacity is
diminished by ~1% every 100 m gained in altitude after 1500 m (Buskirk et al., 1967). That
means that in these constant hypoxic conditions the athletes are enable to maintain their high
intensities, especially during interval-training sessions (i.e., 12-15% slower at 2500 m). Since
early 1970’s and the popularity of LHTH, many training methods in altitude have been
developed such as “Live High Train Low” (LHTL), which allows to have the hematological
benefits from staying at altitude and in addition to that to ensure the high intensities of the

 11
interval trainings (Levine & Stray-Gundersen, 1997; Levine & Stray-Gundersen, 2001). More
recently several “Live Low Train High” (LLTH) methods have emerged with the development
of simulated hypoxic structures updating the panorama (resumed in Figure 3) of means to train
in hypoxia (Faiss et al., 2013; Girard, et al. 2017).

Figure 4. Current panorama of the different hypoxic training methods for a range of athletes
engaged in endurance and team-sports. Adapted from (Millet et al., 2013) and (Girard et al.,
2017). LHTH, live high-train high; LHTHL, live high-train high and low; LHTL live high-train
low; LHTLH live high-train low and high; LLTH live low-train high; BFR blood flow
restriction, CHT continuous hypoxic training; CO2 absorption rebreathing with a mask; HH
hypobaric hypoxia; IHE intermittent hypoxic exposure; IHIT IHE during interval-training; IHT
interval hypoxic training; IPC ischemic preconditioning; NH normobaric hypoxia; RSH
repeated-sprint training in hypoxia; RTH resistance training in hypoxia; VHL voluntary
hypoventilation at low lung volume.

1.2.1 Repeated Sprint training in Hypoxia

Repeated Sprint training in Hypoxia (RSH) is defined by short duration (typically ≤30s) all-out
efforts interspersed with incomplete recovery periods (≤60s) performed in a hypoxic
environment (Faiss et al., 2013). The fundamental difference between Intermittent Hypoxic

 12
Training (IHT) is the all-out sprints that demands a very high recruitment of fast-twitch fibers
in the muscles. Whereas aerobic performance is impacted by altitude, sprint performance (i.e.
for single maximal effort up to 60 s) is in contrary well preserved up to 3500 m or even higher
(Girard et al., 2017). The benefits of IHT in comparison of the same training in normoxia has
struggled to find any significant improvement for performance. Only four out of more than
twenty studies at this time had shown potentially some additional benefits on performance
related variables of IHT (Faiss et al., 2013). For example, the innovative training method of
RSH since 2013 has demonstrated an interesting improvements on performance and a delay of
fatigue when compared to the same training in normoxia (RSN) (Faiss et al., 2013). The high
intensity of repeated sprint (RS) training imposes some physiological challenges. In fact, the
cardiovascular system and the muscles need to make some adaptations such as: increasing
skeletal muscle oxidative capacity, increasing resting glycogen content, increasing capacity for
muscle lipid oxidation and enhancing peripheral vascular structure and function (Burgomaster
et al., 2005; Gibala et al., 2006; Burgomaster et al., 2008; Rakobowchuk et al., 2008). Usually,
exercise leads to an augmentation of blood flow in the cardiovascular system that upregulates
the endothelial nitric oxide synthase, which is an enzyme increasing local NO levels that leads
to smooth muscle relaxation, vasodilation and increased blood flow (Gielen et al., 2001; Tinken
et al., 2009). With high intensity exercises such as RS training, these physiological responses
will be larger than with low intensity exercises (Mortensen et al., 2008; Casey & Joyner, 2012).
It is known that similar vascular mechanisms exist during expositions in a systemic hypoxic
environment but even to a greater extent due to the lack of oxygen availability (Casey & Joyner,
2012). So, the idea of combining the metabolic stress of high-intensity interval exercise with a
systemic hypoxic stress of a lower PO2 is to induce an effective stimulus to maximize
physiological responses and biological reactions. RS training performed at maximal intensity
with a work to rest ratio less than 1:4 induce an early development of fatigue and a power
decrement in normoxic conditions (Bishop et al., 2004). This type of training exercise when
performed to exhaustion leads to a massive accumulation of metabolites in the muscles (Spriet
et al., 1989) as well as an alteration of the neural drive and the muscle recruitment by the motor
cortex (Ross et al., 2001). The main limiting factors at the muscular level as the sprints continue
include muscle excitability due to ionic disturbances (T. Clausen et al., 1998b), energy supply
from the phosphocreatine availability, as well as anaerobic glycolysis, and oxidative
metabolism (Gaitanos et al., 1993). These factors are contributing to a decrement of
performance limiting muscles to work efficiently and furthermore, these reactions are
multiplied when they are combined with another environmental stress like hypoxia (Balsom et

 13
al., 1994; Brosnan et al., 2000). It has been demonstrated that diminishing the oxygen
availability have a detrimental impact on endurance performance as well as on the ability to
repeat maximal sprints without enough recovery (Balsom et al., 1994; Smith & Billaut, 2010;
Girard et al., 2011; Smith & Billaut, 2012; Billaut & Buchheit, 2013). Normally, high intensity
exercise reduces tissue oxygen availability. So, in order to maintain oxygen delivery, the
arteriovenous oxygen difference (oxygen extraction) is increased (Shepherd et al., 1973). The
innovating RSH training method has been developed in line of these principles to maximize the
stimulus applied to the body in order to enhance maximal performance and delay fatigue in
comparison of the same training in normoxia (RSN) (Faiss et al., 2013). Firstly, the energy to
perform repeated maximal sprints comes from anaerobic glycolysis. Secondly, as the exercise
continues, the source of energy shifts towards aerobic metabolism (Gaitanos et al., 1993;
Bogdanis et al., 1995). RSH training method is associated with LHTL protocols to add the
hypoxic stimulus during exercise time as well. By doing so, athletes benefit from both
hematological responses due to the long-time exposure to hypoxia and metabolic/peripheric
adaptations after training at high intensity in hypoxia. Since 2013, RSH proved its capacity to
improve performance in different sports: leg cycling (Faiss et al., 2013), cross-country skiing
(Faiss et al., 2015a), running (Galvin et al., 2013), and team sports (Brocherie et al., 2015;
Brocherie et al., 2018). The large majority of the studies on the subject have shown that there
is a substantial benefit on the power output and the number of sprints that can be performed
after such a training protocol (Millet et al., 2013).

1.2.2 Physiological adaptations of RSH training

There are fundamental different physiological adaptations between acute exercise in hypoxia
and long-time exposure in this environment. Unlike the most known longer-form of hypoxic
exposure or training that aim to enhance the erythropoiesis to improve oxygen (O2) convection
capacity, RSH uses an acute hypoxic exposure with short burst of exercise to maximize
peripheral adaptations. In fact, it should take hundreds of hours of hypoxic exposure to be able
to stimulate optimally the creation of new red cells in the blood (Levine & Stray-Gundersen,
2006) However, RSH training improves blood perfusion in the muscle, particularly in the fast
twitch (FT) fibers. They become more performant thanks to a better O2 extraction rate making
them less fatigable (Faiss et al., 2013). The addition of hypoxia during this kind of very intense
repeated exercise leads to a lower arterial O2 pressure (McDonough et al., 2005) which
generates a greater vasodilation in the muscles and also a higher O2 extraction capacity of the
FT fibers (Lundby et al., 2009; Casey & Joyner, 2012). In addition, RSH has been shown to

 14
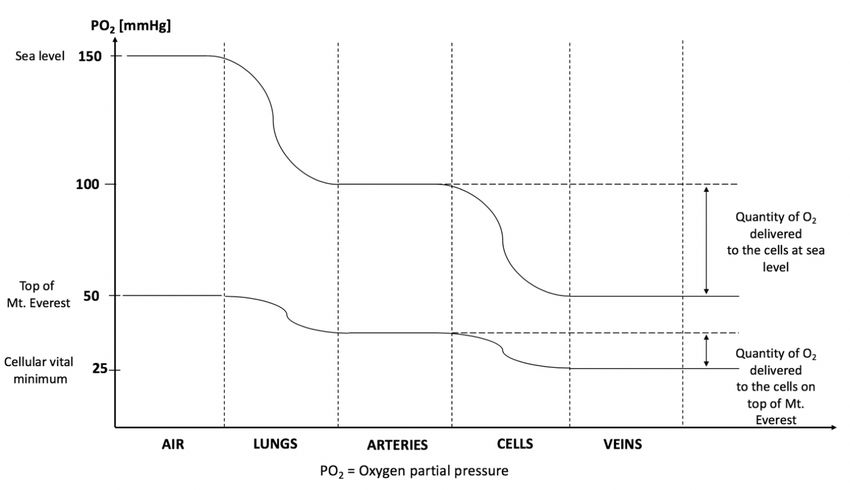
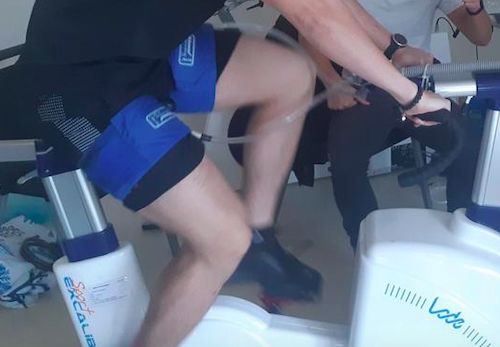
impact at a molecular level as well. In fact, Faiss et al (2013) showed that after eight sessions
of RSH training on a cycling ergometer mRNAs were upregulated. Certainly, the most
important mRNA is HIF-1 which is responsible for the oxygen-sensing pathways. HIF-1
mediates the changes in genes expression so that physiological mechanisms such as
erythropoiesis and angiogenesis (VEGF) are regulated differently after acute or chronic
exposure to hypoxia (Semenza, 2007; Hirota & Semenza, 2006). Recent research also identified
other molecular adaptations concerning the downregulation of genes involved in mitochondrial
biogenesis (TFAM and PGC-1α). Other mRNAs that were also studied by these authors happen
to improve pH regulation capacity (CA3, MCT-1, MCT-4, NOS, prostaglandin, adenosine), to
allow a shift from an aerobic to a glycolytic metabolism in the muscle which explains partly
the modified behavior of the FT muscle fibers and their enhanced resistance to fatigue (Raphael
Faiss et al., 2013). These physiological adaptations are likely to improve anaerobic glycolytic
activity of the muscle and by doing so improving fast twitch fiber recruitment after RS training
in hypoxia (McDonough et al., 2005). The performance enhancement from this kind of training
is due, for the most part, to a compensatory vasodilation and an increased rate of
phosphocreatine (PCr) resynthesis (Hoppeler & Vogt, 2001; Dufour et al., 2006).

1.3 Local hypoxia

1.3.1 Blood Flow Restriction

Blood flow restriction (BFR) training is another way to apply an additional stress during
exercise by creating severe hypoxia locally in the muscle tissue (ischemia) (Scott et al., 2014).
The use of adjustable cuffs on the proximal parts of the limbs create a total or a partial vascular
occlusion when exercising. In this study, the external application of pressure allows the arterial
blood inflow but blocks mostly the venous blood outflow which leads to an accumulation of
blood content in the muscular tissue (Kaijser et al., 1990). The amount of BFR is calculated as
a percentage of resting total vascular occlusion pressure (in this study, 45%) as Reis et al. (2019)
showed that BFR training was effective for increasing deoxygenation and reducing tissue
oxygenation when the relative pressure was above 40% of total occlusion. During these kinds
of conditions, there is a distinct difference on a vascular/endothelial function between systemic
hypoxia and BFR due to specific vascular resistance and vessel diameter adjustments,
accumulation of metabolites (nitric oxide, adenosine, prostaglandins, hydrogen ions, etc.). They
are both unique methods that lead to a decrease of oxygen content in the muscle tissue using
different physiological mechanisms. Although, BFR training induces local hypoxia by

 15
increasing the vascular resistance and reducing blood flow. Systemic hypoxia mechanism work
through a lower FiO2 that leads to a metabolic vasodilation response that increases blood flow
for oxygen delivery.

Figure 5 : Legs BFR cuffs used during repeated sprint cycling trainings.

Performing exercise with reduced blood flow into the muscle dates back to the 1960-70s with
the work of Dr. Yoshiaki Sato in Japan. This technique was invented and used in combination
with resistance training, where it was also known as “Kaatsu training” meaning “training with
added pressure”, to improve vascularization as well as rehabilitate injured limbs (Sato, 2005).
In fact, this training technique has demonstrated evidences to be a viable alternative for
traditional heavy-load strength training in a broad range of populations, such as the elderly and
rehabilitating athletes who are unable to withstand the high mechanical stress placed upon the
joints during heavy resistance training (Hughes et al., 2017). Historically, heavy exercise loads
of approximately 60% to 90% of an individual’s one repetition maximum (1RM) have been
deemed necessary to elicit muscle hypertrophy and strength gains (Ozaki et al., 2015;
« Progression Models in Resistance Training for Healthy Adults », Kraemer et al., 2002).
Recent research has demonstrated that low-load training to exercise failure could stimulate
muscle hypertrophy comparable in magnitude to that observed with heavy-load training after 6
(Ogasawara et al., 2013) and 8 (Schoenfeld et al., 2015) weeks of training three times per week.
However, strength adaptations were maximized with heavy-load training, and cross-sectional

 16
comparisons would suggest that hypertrophy and strength gains observed with low-load
training are not as great as those achieved with heavy-load training (Schoenfeld et al., 2016).
Nevertheless, from a clinical musculoskeletal rehabilitation perspective, training to muscular
failure may provide one strategy to maximize hypertrophy when training using low loads in
situations when using heavy loads is not feasible. Training with low loads may therefore be
useful, as the early addition of muscle mass and function in rehabilitation may be beneficial for
individuals who have suffered from atrophy. In recent years, research has demonstrated that
augmentation of low-load resistance training with blood flow restriction (LL-BFR) to the active
musculature can produce significant hypertrophy and strength gains, using loads as low as 30%
of 1RM (Burgomaster et al., 2003; Takarada et al., 2004; Yasuda et al., 2011). BFR training
has been found to yield hypertrophy responses comparable to that observed with heavy-load
resistance training (Loenneke et al., 2012). However, studies with such findings regarding
muscle hypertrophy are not common among the present literature. Since these primary
researches in the field of BFR training focused on resistance training and the potential effects
on the muscle mass and strength gains (Abe et al., 2006), the utilization of this method is now
performed all over the world and more precisely in this study for the first time with a high
intensity interval training protocol during 3 weeks (Willis et al., 2019).

1.3.2 Physiological responses of BFR training

Physiological adaptations in leg strength (Abe et al., 2010), vascular (Ozaki, Miyachi, et al.,
2011) and pulmonary (Ozaki et al., 2011) components have been reported with low-load aerobic
exercise and BFR. From a mechanistic standpoint, it is hypothesized that an ischemic and
hypoxic muscular environment is generated during BFR to cause high levels of metabolic
stress, alongside mechanical tension when BFR is used in tandem with exercise. Both metabolic
stress and mechanical tension have been described as ‘primary hypertrophy factors’ (Pearson
& Hussain, 2015) and theorized to activate other mechanisms for the induction of muscle
growth. The main mechanisms responsible for physiological adaptations from BFR training
include metabolic stress (increased lactate, PCr depletion, inorganic phosphate, decreased pH),
hormonal responses (increased growth hormone, possible influence of testosterone, IGF-1,
catecholamines, cortisol), intramuscular signaling (increased mTOR signaling, proliferation
and differentiation of satellite cells, possible reactive oxygen species, and myostatin),
intracellular swelling, muscle fiber recruitment (increased activation, greater number of fibers
activated in fatigued state), and reactive hyperemia (increased blood flow to muscle when cuff
is released) (Scott et al., 2014; Takarada et al., 2000).

 17
As the artery is partially occluded while the vein is almost or completely occluded during BFR,
the local blood volume and the vessel resistance is increased leading to less venous return.
These changes affect the cardiovascular system by increasing the cardiac output and the active
vascular bed in the muscle to match a greater oxygen demand with an elevated blood pressure
during exercise (Boushel, 2010). Even if the literature is limited on the vascular responses to
BFR, it is speculated that it affects the muscle fibers perfusion principle due to this increased
resistance in the vessel along with the increased blood volume caused by a limited venous return
(Willis et al., 2019).

BFR training results in an increased metabolic stress due to a metabolite accumulation, a higher
lactate and a decreased level of pH in the muscles and the blood (Abe et al., 2006; Fujita et al.,
2007; Manimmanakorn et al., 2013; Pearson & Hussain, 2015). These physiological responses
lead to a shift in the contribution of the energy systems from aerobic to anaerobic which
increases the production of adenosine triphosphate (ATP) without the presence of enough O2.
Whereas training in hypoxia is known to enhance hypoxia-inducible factor-1a (HIF-1a)
mediated cell signaling through an increase of its mRNA expression (Maxwell, 2005), the same
response with BFR training is measured but not completely understood (Taylor et al., 2016).
Furthermore, BFR has been shown to up regulate the mRNA expression of the vascular
endothelial growth factor and receptor (VEGF and VEGFR-2) along with endothelial nitric
oxide synthase (eNOS), proposing angiogenesis due to the increased stimuli of ischemic shear
stress (occurring after occlusion) during low-load resistance exercise (Scott et al., 2014;
Ferguson et al., 2018). Moreover, the responses to BFR are an increased production of protein
kinases (S6K1, MAPK) and of reactive oxygen species (ROS) along with a decreased
production of myostatin, REDD1, MyoD and MuRF1 (Drummond et al., 2008; Wernbom et
al., 2008; Larkin et al., 2012; Scott et al., 2014). It is evident that with this kind of training the
muscle is exposed to a great oxidative stress that causes cell damage and impairs the NO
pathway signaling, modifies the function of calcium channels, activates transcriptional factors
for pro-inflammatory molecules, and protein kinases (Murphy, 2009; Genova & Lenaz, 2014;
Jackson, 2015). And even if it can have detrimental effects on the cells, it leads to some
interesting structural adaptations. In addition to gains in maximal muscle strength, studies have
reported improved endurance capacity; i.e., increased number of repetitions to fatigue in young
recreational active individuals after 4-week BFR resistance training (Kacin & Strazar, 2011),
as well as improved VO2 max (T. Abe et al., 2010) and power output during incremental all-
out knee extensor testing (Christiansen et al., 2020) in untrained individuals following 6-8

 18
weeks of BFR cycling training. Such endurance effects have been suggested to partly be
attributed to increased O2 delivery to the trained musculature after BFR training (Kacin &
Strazar, 2011). The potential of BFR training to evoke adaptative gains in O2 delivery and/or
local blood flow is directly supported by reports of increased muscle filtration capacity after
short-term (4 weeks) BFR training (Nielsen et al., 2020); (Hunt et al., 2013).

Recently, Willis et al. (2019) showed that in these BFR conditions of restricted vasodilation,
the demand for increased blood flow could not be met with similar mechanisms as RSH. For
example, a recent study with an acute repeated sprint leg cycling test to exhaustion found greater
changes in tissue perfusion in blood flow restriction (BFR) conditions and thus suggested a
possible stimulus for vascular regulation (Willis et al., 2018). It is important to consider globally
that tissue perfusion (volume of blood per unit of time) also involves the amount of active
muscle mass. This circulatory adaptation results in more active muscle vascular beds mediated
by the sympathetic nervous system to regulate blood flow via the muscle metaboreflex (Clausen
et al., 1998a; Boushel, 2010). Furthermore, an important consideration during intense maximal
exercise (large mass of active muscle) is the rise in total vascular conductance which can take
over the capacity of the body to raise cardiac output for the amount of work being performed,
thus causing the active muscle to vasoconstrict in order to maintain blood pressure. These
changes detected in [tHb] in the study of Willis et al. (2018) may thus create a situation for the
body to overcome in order to continue exercise, and therefore, possibly a stimulus for the use
of BFR training as a way to induce fluctuations in blood volume (i.e., tissue perfusion) to elicit
vascular adaptation. Given the important physiological changes after BFR resistance or low
intensity training, it was interesting to investigate this kind of exercise in addition to RS training
and monitor the physiological responses and performance enhancements.

1.4 Aims and hypothesis

To date the existing literature reported findings either on RSH training or BFR training at low
intensity and with resistance exercises. To the best author’s knowledge, no previous study has
been conducted on the effects of a 3-weeks RS training in hypoxia versus with BFR on
recreationally trained male adults yet. In the first place, the main purpose of this study was to
assess the impact of a 3 weeks RS training protocol in hypoxia (RSH), with BFR (RS-BFR)
and in normoxia (RSN) on specific cycling performances (Repeated Sprint Ability; RSA),
Submaximal exercise, Wingate, 10 km time trial (10kTT)). Secondly, it was to measure the

 19
variations in the ventilation and the O2 consumption with gas analysis to see if there is any
correlation with performance data.

With regard of the previous literature on these topics, this study tested the following hypotheses:

 1) Greater performance improvements for RSH compared to RSN.
 2) Better economy and efficiency in cycling performances for RS-BFR compared to RSH
 and RSN.
 3) Greater performance improvements for RS-BFR compared to RSN and RSH.

 20
2. Methods

2.1 Subjects

Twenty-four healthy recreational cyclists volunteered to take part in this study (25.8 ± 5.2 years,
77.2 ± 6.7 kg, 180.9 ± 6.6 cm). Subjects were recruited through ads (Appendix 7.4 and 7.7)
posted in every building of the University of Lausanne as well as emails sent to the local
triathlon and cycling clubs.
Inclusion criterion for participants were as follow:
 1. To be between 18 and 40 years old;
 2. Used to high-intensity training;
 3. To train at least 5 hours a week;
 4. To be sane and healthy.
Exclusion criterion included:
 1. Smoking;
 2. Presence of any diagnosed disease;
 3. To have any bones or muscle injuries within the last 3 months;
 4. Any pain or other health problems that can influence the results of this study;
 5. Problems with blood coagulation;
 6. To consume aspirin or any anticoagulant;
 7. To be allergic to xylocaine;
 8. A positive answer to the PAR-Q questionnaire;
 9. Lack of consent;
 10. Exposure at an altitude superior of 1000 m within the last 2 weeks.

All the participants were healthy and gave their written consent (Apendix 7.5) after having been
exhaustively informed about the whole experimental protocol as well as its inherent possible
risks, prior to the first familiarization session where they also could have their potential
questions answered. The research protocol was approved by the “Commission cantonale (VD)
d’éthique de la recherche sur l’être humain (CER-VD)” on the 24th May 2019.
After meeting the requirements, the subjects were randomly assigned to three groups: a hypoxic
group, an occlusion group and a normoxic group. Each experimental group underwent an
identical repeated-sprint cycling training, one of which was performed in normobaric hypoxia

 21
(RSH), at a simulated altitude of 3’800 m, whilst another one was performed with blood flow
restriction (RS-BFR), at a level of maximal occlusion of 45%, and the last one was in normoxia
(RSN). In order to prevent any placebo/nocebo effect, participants were not aware of the
hypotheses for each training protocol on the cycling performance. Furthermore, participants
from the RSH and the RSN group were not aware which group they belong to, as well as
participants from the BFR group could not say if they were training in hypoxia or not.
The hypoxic group were composed of nine participants (RSH, N=9), the occlusion group, eight
participants (RS-BFR, N=8) and the normoxic group (RSN, N=7). The three groups had similar
characteristics, which are resumed in Table 1.

Table 1. Group characteristics.

 Group Age [years] Height [cm] Weight [kg] BMI [kg/m2]
 RSH (N=9) 25.2 ± 5 183.1 ± 5.8 77.2 ± 7.6 23 ± 2.5
 RS-BFR (N=8) 24.9 ± 3.9 180.5 ± 8.3 78.1 ± 8.4 24 ± 2.1
 RSN (N=7) 27.3 ± 6.8 178.6 ± 5.7 76.1 ± 4.1 23.9 ± 2.5

All three groups were instructed to maintain their usual respective training activities but at low
intensity to prevent any overload due to the heavy training protocol of the study. Furthermore,
participants were not allowed to have any race or competition during the study to prevent any
results bias. A 1 – 10 visual analogic scale (VAS) was used to assess the level of fatigue of the
participants during the whole training protocol at each beginning of the training session.

2.2 Experimental design

This single blind study took place entirely at the University of Lausanne (UNIL) (1015
Lausanne, Suisse). The tests were conducted in the Synathlon while the training protocol were
taking place in two building of the “Institut des Sciences du Sport de l’Université de Lausanne”
(ISSUL), the Synathlon and the “Centre Sport et Santé” (CSS) labs. Prior to the training
protocol, the groups performed 3 days of pre-tests (PRE) during a week. The first (DAY 1) and
the second (DAY 2) test sessions were performed 24h apart and executed at exactly the same
time from PRE to POST training period. The third (DAY 3) test session were performed
randomly from 1 to 4 days after the first sessions. Afterwards, they all underwent a repeated-
sprint training protocol which consisted of nine 1-h sessions spread over 3 weeks. There were
about from 24 h to 72 h between each training session with at least one day of recovery. Another

 22
set of 3 days testing were performed after the training protocol (POST) about 2 to 5 days after
the last training session with the same protocol than at PRE.
The hypoxic chamber of the CSS was used during the whole training protocol of this study for
the three groups. The RSH group trained with hypoxic air at a simulated altitude of 3800 m
while the two other groups RS-BFR and RSN trained with normoxic air at the altitude of the
Léman lake, 372 m.

Figure 6. Study design.

2.3 Familiarization

Prior to the 3 days of pre-testing, participants were sent for a familiarization session in the
Synathlon research lab where the informed consent and health questionnaire [Physical Activity
Readiness Questionnaire, PAR-Q & YOU, (Physiology CSfE, 2002)] were collected along.
Participants concerned were equipped with the BFR cuff (custom-made 4 x 70 cm cuff, 3 × 41
bladder; D.E. Hokansson Inc., Bellevue, WA, USA) for measurement of the pulse elimination
pressure. Pulse elimination pressure was measured seated at rest with the leg flexed with a slight
bend in the knee by gradually inflating the cuff until the point at which no more arterial blood
flow was detected via Doppler ultra-sound (EchoWave II 3.4.4, Telemed Medical Systems,
Telemed Ltd. Lithuania, Milano, Italy) of the femoral artery and was measured 2–3 times for
accuracy in both legs, with 2 min between trials. It continued with the familiarization to the
neuromuscular assessment (MVC), as well as stimulations at different frequencies (100 Hz, 10
Hz, twitch) at rest and during MVC (superimposed 100z) following the protocol described in

 23
detail below. Participants were then seated on an electronically braked cycling ergometer (Lode
Excalibur Sport Ergometer, Lode B.V., Netherlands) and dimensions were recorded and
individualized for standardization during subsequent tests and training sessions. After a 5 min
warm-up at 1.5 W/kg, participants performed two 6-s maximal sprints with 1 min of active
recovery with no BFR or hypoxia. All sprints were performed using the “Wingate mode” form
the manufacturer with an individually fixed torque factor of 0.8 Nm/kg.

2.4 Training protocol

The training protocol was performed in a normobaric hypoxic room in the CSS premises at the
university of Lausanne (UNIL) (ATS Altitude, Australie). Altitude was simulated through O2
extraction by means of a filter and a compressor system. The hypoxic device either simulated
an altitude of 3’800 m above sea level, with a FiO2 of ~13% for the RSH group; or simulated
altitude of 372 m, with a FiO2 of ~20.9% for both RS-BFR and RSN group. Regardless of the
altitude simulated, in both conditions the chamber was ventilated and so produced the same
sound to blind the participants. Fans were used in the chamber as well to have the air within
circulates. Just before the beginning of the session, participants were asked about their general
capacity to perform of the day including psychological and physical fatigue with an analogic
scale between 1, as the lowest, and 20, as the better form they could have.
Trainings lasted ~60 min. After a standardized 10 min warmup at 1.5 W/kg, participants
performed six sets of six repetitions of 6 s sprints interspersed with 24 s of easy spinning
recovery. A 5 min easy spinning recovery at 1.5 W/kg separated each set. (See Figure 7)
Participants were told to cycle as fast as they could for each and every sprint of the training
session. They were strongly encouraged by the experimenters and were told not to pace
themselves throughout the repeated sprints. All the training sessions were conducted with the
cycle ergometer (Lode Excalibur Sport, Groningen, The Netherlands) where the participants
were told to sprint seated. To standardize the beginning of each sprint, the cycling cadence was
imposed to the participants and needed to be at ~80 rpm. This was to prevent them to be able
to be more economic during the sprint without having to spend energy to accelerate the
ergometer without any resistance. The saturation of the participants was measured with an
infrared oximeter on the right index (wristox, Nonin) after the first, the third and the last block
of repeated sprint without them knowing any values. That helped to confuse even more in which
experimental conditions they were in. They completed the training with an active recovery of

 24
easy cycling at 1.5 W/kg during the last 7 min of the session. Participants were allowed and
encouraged to hydrate themselves during recovery phases of the training sessions.

Figure 8. One training session protocol.

2.5 Testing

DAY 1:
Repeated sprint ability (RSA) test, blood sampling, muscle microbiopsies and
electrostimulation before and after the RSA test.
Participants were instructed to come at a fasting state the day of the test. After the health and
consent questionnaires filled and verified, participants were lied down to rest. Then they had
time to complete the food questionnaire where they had to write down precisely everything they
have eaten the last day before this first visit. They took the second food questionnaire at home
to be able to write down what they eat the day after the first visit. After ten minutes of rest,
blood samples and muscle microbiopsies were collected. Then participants were seated and
prepared on an ergometer chair with an isometric leg extension setup fixed at an angle of 90°
on the knee (Universal Load Cell, VPG Revere transducers, Germany) to perform two maximal
voluntary contractions of 5 s in order to measure the maximal isometric force (extension) of
their right leg following the protocol in Figure 9.

 25
Figure 10. The electrostimulation protocol.

The electrostimulation finished, participants took place on the electronic braked cycling
ergometer where their settings were measured and replicated during each subsequent training
and testing session. The NIRS device was installed on the vastus lateralis of the right leg, on
the third of the distance separating the knee from the hip. Tape and elastic straps were used to
ensure that the system do not move during the RSA test. The calibration of the NIRS began by
a 2 min rest were the participants had to stay on the seated position, hands placed on the
handlebar and their foot leaned on a box to standardize the extension of their leg. Then,
participants were told to cycle at 80 rpm during 1 min with a 50 W resistance and for another
minute with a 100 W resistance to finish the calibration of the NIRS.
Following the protocol, participants did a warmup cycling exercise on the ergometer composed
by 1 min at 1.5 W/kg followed by two 6 s sprints with 1 min of recovery. After the warmup
sequence, participants performed the RSA test, made of twenty 6 s all-out sprints with 24 s of
active recovery, to exhaustion or to the end of the test.

 26
Figure 11. The repeated sprint ability test (RSA).

As soon as the RSA test was finished, participants were seated again on the electrostimulation
chair to assess the neuromuscular fatigue. (Time to begin the stim: ~1 min) A Rate of Perceived
Exertion (RPE) scale was used to assess the level of exertion and pain for the legs and the
breathing at the end of the test. The last step of this first day of testing was the post RSA
microbiopsies that were collected about 10 min after the RSA test.

DAY 2:
Microbiopsy and electrostimulation post 24 h and 6 min Submax test at 1.5 W/kg.
Firstly, participants gave their food questionnaires filled with all the food they have eaten the
day before. They also needed to be at a fasting state for this DAY 2 tests. After a 10 min rest
period layed down, participants did the exact same protocol as DAY 1 for the first microbiopsy
and the electrostimulation. The muscle microbiopsy was performed at exactly 24 h post the
RSA test of DAY 1 as the electrostimulation. Participants were then prepared on the cycling
ergometer with their individual settings. The NIRS device was installed on their right leg and
the same calibration protocol as DAY 1 was performed prior to the test.
In addition to that, the measurements of gas exchanges (VO2) were recorded during the
submaximal test and needed to be calibrated as well. So, after a volume and a gas calibration
by the system of the gas analyzer (Medgraphics CPX, Loma Linda, CA, USA), participants put
the mask on and didn’t move in the same seated position as before during 1 min prior to the
test. Finally, participants performed the 6 min submaximal cycling test at 1.5 W/kg and then

 27
informed the experimenters about their perceived exertion concerning their leg and their
breathing on the Borg’s scale (#/20).

DAY 3:
30 s Wingate and 10 km Time Trial test (250 kJ).
Participants were allowed and welcomed to eat preferably a light meal or a collation prior to
these tests. After the same NIRS and the VO2 calibration protocols as DAY 1 and 2, participants
installed on the cycling ergometer, performed firstly the 30 s all-out Wingate test. There was a
1 min free resistance cycling at 80 rpm prior to the beginning of this test. At the end of the 30
s test, the mask was kept on until their breathing was starting to cooldown to make sure to have
the highest values of VO2 possible. Between this first test and the next 10kTT, participants were
instructed to get off the ergometer and be still during 15 min. Before the beginning of the time
trial, participants cycled freely against the 10kTT resistance mode (Wingate mode, 0.8
Nm.kg−1) of the ergometer during 2 min without generating any fatigue. Then the mask was put
on and the participants were prepared on the cycling ergometer for this last test. The goal was
to perform as fast as possible a virtual distance of 10km represented by an amount of energy to
produce of 250 kJ. Participants were free to use their own tactic of pacing throughout the test
as long as they gave their maximal effort. They were only told when they were at 25%, 50%,
75% and 90% of the test completion. Each participant was strongly encouraged during the
whole test in order to maximize their motivation. At the end of the test, participants informed
the experimenters about their perceived exertion concerning their legs and their breathing on
the Borg’s scale.

2.6 Statistical analysis:

Data are presented as mean ± SD or relative changes (%) unless otherwise stated. Normal
distribution of the data was tested using the Shapiro–Wilk test. ANOVA two-way repeated-
measures analysis of variance with 1 between factor (condition; RSN vs RSH vs RS-BFR) and
1 within factor (time; Pre vs Post) were used to compare RSA-related performance variables.
Multiple comparisons were made using the Holm–Sidak post hoc test. For each analysis of
variance, partial eta-squared (η2 p) was calculated as measure of effect size. According to
Cohen, 16 values of 0.01, 0.06, and 0.14 were considered as small, medium, and large,
respectively. All analyses were made using Sigmaplot (version 11.0 software; Systat Software,
Inc, San Jose, CA). Null hypothesis was rejected at P < 0.05.

 28
You can also read