Pain in Human Saliva - Dr Sara ...
←
→
Page content transcription
If your browser does not render page correctly, please read the page content below
Chemical Biomarkers of Acute
 Pain in Human Saliva
 Thesis

 Arisara Amrapala

 14th August 2019

This thesis is submitted in part of fulfilment of the requirements for the
Rehabilitation Engineering and Assistive Technologies MSc at University
 College London, 2019
ACKNOWLEDGEMENTS

I would like to thank my supervisor Dr Sara Ghoreishizadeh for her guidance during the
entire project, Dr Roxaneh Zarnegar for her support on the clinical aspects of the project,
and Prof Helen Birch for giving me advice on the laboratory experiments. I would also
like to thank all the participants who took part in this study for their time and effort.

2
CONTENTS

1. INTRODUCTION ........................................................................................................................................................7
2. SCOPE ............................................................................................................................................................................9
3. LITERATURE REVIEW ........................................................................................................................................ 10
 3.1 THE NATURE OF PAIN ............................................................................................................................................. 10
 3.2 CURRENT PAIN ASSESSMENT METHODS ............................................................................................................. 10
 3.3 POTENTIAL BIOMARKERS OF PAIN: GLUTAMATE, SUBSTANCE P AND CORTISOL ....................................... 11
 3.4 EXISTING RESEARCH ON PAIN BIOMARKERS ...................................................................................................... 13
 3.4.1 Normal Biomolecule Concentrations in Blood and Saliva ........................................................ 13
 3.4.2 Pain-related Changes in Biomarker Concentrations .................................................................. 14
 3.5 SALIVA AS A WINDOW INTO THE HEALTH STATE OF THE BODY .................................................................... 16
 3.6 AIM, HYPOTHESES AND VISION ............................................................................................................................. 17
4. MATERIALS AND METHODS ............................................................................................................................ 18
 4.1 ETHICAL APPROVAL ................................................................................................................................................ 18
 4.2 PARTICIPANTS .......................................................................................................................................................... 18
 4.2.1 Participants – Experiment ..................................................................................................................... 18
 4.2.2 Participants – Data Analysis .................................................................................................................. 18
 4.3 EXPERIMENTAL PAIN INDUCTION ........................................................................................................................ 19
 4.4 EXPERIMENTAL DESIGN AND SETUP .................................................................................................................... 19
 4.5 PROTOCOL ................................................................................................................................................................. 20
 4.6 SALIVA COLLECTION ................................................................................................................................................ 21
 4.7 RATING PAIN INTENSITY ........................................................................................................................................ 21
 4.8 SAMPLE ANALYSIS: ENZYME-LINKED IMMUNOSORBENT ASSAY.................................................................... 22
 4.9 DATA ANALYSIS........................................................................................................................................................ 23
 4.9.1 Normality of the Data ............................................................................................................................... 24
 4.9.2 Comparison between Time Points ..................................................................................................... 24
 4.9.3 Comparison between Variables ........................................................................................................... 24
 4.9.4 Correlation between Biomolecules and Categorical Variables .............................................. 24
5. RESULTS.................................................................................................................................................................... 25
 5.1 PARTICIPANTS .......................................................................................................................................................... 25
 5.2 CHANGE IN NRS ....................................................................................................................................................... 25
 5.3 CHANGES IN SALIVARY CORTISOL ......................................................................................................................... 25
 5.3.1 Mean Cortisol Levels ................................................................................................................................ 25
 5.3.2 Individual Changes in Cortisol Levels ............................................................................................... 26
 5.3.3 Cortisol Changes Categorised by Gender......................................................................................... 27
 5.3.4 Cortisol Concentrations Categorised by NRS ................................................................................. 28
 5.3.5 Cortisol Concentrations Categorised by Age .................................................................................. 29
 5.4 CHANGES IN SALIVARY SP ...................................................................................................................................... 29
 5.4.1 Median SP Levels........................................................................................................................................ 29
 5.4.2 Individual Changes in SP Levels .......................................................................................................... 30
 5.4.3 SP Changes Categorised by Gender .................................................................................................... 31
 5.4.4 SP Concentrations Categorised by NRS ............................................................................................ 32
 5.4.5 SP Concentrations Categorised by Age ............................................................................................. 33
 5.5 CHANGES IN SALIVARY GLUTAMATE .................................................................................................................... 33
 5.5.1 Median Glutamate Levels ....................................................................................................................... 33
 5.5.2 Individual Changes in Glutamate Levels .......................................................................................... 34
 5.5.3 Glutamate Gender Changes ................................................................................................................... 35
 5.5.4 Glutamate Concentrations Categorised by NRS............................................................................ 36

 3
5.5.5 Glutamate Concentrations Categorised by Age ............................................................................ 37
 5.6 CHANGE FROM BASELINE VALUES TO POST +0 AND PAIN INTENSITY RATING.......................................... 38
 5.7 CORRELATION BETWEEN BIOMOLECULES .......................................................................................................... 39
 5.8 CORRELATION BETWEEN CATEGORICAL VARIABLES ........................................................................................ 39
6. DISCUSSION ............................................................................................................................................................. 40
 6.1 HYPOTHESIS .............................................................................................................................................................. 40
 6.2 STATISTICAL SIGNIFICANCES DETECTED ............................................................................................................ 41
 6.3 GENDER...................................................................................................................................................................... 43
 6.4 THE EFFECT OF MOTIVATION ............................................................................................................................... 43
7. LIMITATIONS AND FUTURE WORK.............................................................................................................. 45
8. CONCLUSION ........................................................................................................................................................... 47
REFERENCES ..................................................................................................................................................................... 48
APPENDIX A ....................................................................................................................................................................... 53
APPENDIX B ....................................................................................................................................................................... 57
APPENDIX C ....................................................................................................................................................................... 60

4
ABSTRACT

Pain is an unpleasant sensation that everybody experiences differently, and is affected by
a multitude of biopsychosocial factors. In the clinical setting, ineffective pain
management and prolonged pain can be both physically and psychologically debilitating.
Current pain assessment methods rely on self-reporting, dismissing patients that are
unable to provide their input, such as patients with cognitive disabilities or those who are
unresponsive. Therefore, a reliable, objective, and non-invasive method of quantifying
acute pain intensity is needed. This pilot study explored the relationship between the
salivary concentrations of three pain-associated biomolecules (glutamate, substance P
and cortisol) and the intensity of experimentally induced acute pain (through the cold
pressor task) in twenty healthy volunteers. Due to time constraints, the samples of only
ten participants were analysed for this thesis, whilst the remaining samples will be
further analysed in the upcoming months to complete the investigation. Results from the
study illustrate that there are changes in concentrations of one or more of the three
biomolecules following experimental pain induction, but these concentration changes did
not exhibit any particular trend, and did not return back to baseline after one hour post-
pain. Moreover, participants reporting higher pain scores did not display larger changes
in biomolecule concentrations, and vice versa. Statistically significantly lower salivary
glutamate levels were observed one hour post-pain compared to baseline values, and
significant differences in substance P and glutamate concentrations between certain pain
scores, and substance P concentrations between certain age groups were also detected.
Furthermore, gender differences in pain-related changes in concentrations of certain
biomolecules were noted. Together, the results illustrate that there are changes in
biomolecule concentrations with pain, and there are differences in certain biomolecule
concentrations for particular variables, such as gender, age and pain score. Further
investigation is required to uncover potential trends that may exist, to verify the findings
of this current pilot study, and to evaluate the use of saliva as a diagnostic biofluid.

 5
LIST OF ABBREVIATIONS

ANOVA Analysis of Variance
CPT Cold Pressor Task
ELISA Enzyme-Linked Immunosorbent Assay
HPA Hypothalamic-Pituitary-Adrenal
MAD Median Absolute Deviation
Min Minute(s)
NK1 Neurokinin 1
NRS Numerical Rating Scale
Q-Q Quantile-Quantile
SD Standard Deviation
SP Substance P
VAS Visual Analogue Scale
VDS Verbal Descriptor Scale

6
1. INTRODUCTION

Pain is a part of living. It is a personal experience that is not only a physical sensation, but
also involves emotional and cognitive responses, making pain multidimensional
(Fillingim et al., 2014). In one aspect, pain can be beneficial for our defence systems by
enhancing motivation in the accumulation of resources, inhibiting other unpleasant
experiences, and eliciting social support and empathy (Leknes and Bastian, 2014).
However, generally, pain is an unpleasant experience that, with high intensity and
duration, can hinder activities of daily living and reduce quality of life (Morgan, Conway
and Currie, 2011). Pain can arise from a variety of causes and manifests in each individual
differently depending upon a multitude of factors such as the context, amount of
attention, and the individual’s expectation of pain (Hansen and Streltzer, 2005).

In spite of the distinctive pain experience each individual undergoes, there is a strong
desire to prevent or at least limit pain, particularly in the clinical setting, to enable
appropriate pain management and pain rehabilitation approaches that will effectively
improve the patient’s recovery and increase independence. One element vital to
determining the extent of the patient’s recovery is the ability to accurately and reliably
detect the amount of pain experienced. Presently, all pain assessment tools rely on self-
reporting and come in the form of either a scale (predominantly used for acute pain) or
a questionnaire (predominantly used for chronic pain) (Breivik et al., 2008). Alongside
this, observations of physiological and behavioural indicators using various techniques,
including more advanced methods like neuroimaging, are also usually employed to
provide a more comprehensive pain profile (Cowen et al., 2015). Although these existing
pain assessment methods are well-established and their sensitivity, validity and
reliability have been verified in many studies (Breivik et al., 2008), these methods
become inadequate when the patient is in an unresponsive or disabled state. In these
circumstances, a different reliable way of quantifying pain is necessary.

A promising approach is to look at the biomolecular composition of biofluids such as
saliva, and assess pain-related changes in concentrations of certain biomolecules. Saliva
is a favourable option because it is easily obtained non-invasively and can be produced
in sufficient volumes for testing. Glutamate and substance P (SP) are the primary
neurotransmitters responsible for the transmission of pain information evoked by
noxious stimulus1 (D’Mello and Dickenson, 2008) and are found in saliva (Jasim et al.,
2018), making them suitable non-invasive salivary biomarker candidates for pain. As
well as pain, a slower pain-induced stress response is also usually evoked, producing
elevated levels of cortisol, a major regulatory stress hormone (Li and Hu, 2019) that is
typically measured in saliva (Kalman and Grahn, 2004). Therefore, salivary cortisol is an
additional candidate that may be helpful as a biomarker in acute pain.

Existing research has reported elevated levels of (interstitial) glutamate, (plasma and
salivary) SP and (salivary) cortisol with pain in patients with myofascial
temporomandibular disorders (Shimada et al., 2016), chronic migraine (Jang et al., 2010)
and osteoarthritis (Carlesso, Sturgeon and Zautra, 2016), respectively. Additionally,

1
 Noxious stimulus - harmful, poisonous, or very unpleasant stimulus that can or do cause tissue damage
(Treede, 2018)

 7
there is evidence to suggest that serum and salivary levels of these three biomolecules
are correlated (Jasim et al., 2018; Vanbruggen et al., 2011). Due to its novelty, the
literature regarding pain-associated biomarkers in saliva remains limited. To the best of
our knowledge, no study has directly investigated the connection between
experimentally induced acute pain and the salivary concentrations of these three
biomolecules collectively.

The main aim of this thesis is to carry out an exploratory study on the relationship
between salivary concentrations of glutamate, SP and cortisol, and the intensity of
experimentally induced acute pain on healthy humans. We hypothesise that (i) the
concentration of at least one or more of the three biomolecules will transiently change
because of pain and return back to baseline values after around one hour, and (ii) greater
changes in concentrations will be seen in individuals reporting higher pain ratings.

8
2. SCOPE

To investigate changes in pain-associated biomarkers in the saliva after an episode of
induced cold pain, serving as a proof-of-concept for the feasibility of using biomarkers in
saliva to monitor acute pain intensity.

Here, only experimentally induced acute (short duration) nociceptive pain in healthy
volunteers is considered. Neuropathic (damage to the nervous system) and chronic
(long-lasting) pain are beyond the scope of this study.

The cold pressor task (CPT) was chosen as the pain modality because of the ease of set
up, relatively short delay between nociceptive stimulation and perception, and
participants having full control over when to start and terminate the nociceptive
stimulus.

Only healthy participants with no acute or chronic pain at the time of study were asked
to participate. This enables a more direct observation of the correlation between the pain
induction and change in biomolecule concentration in saliva, avoiding any influences
from additional factors such as central nervous system sensitisation, health state or
medication.

Three biomolecules (glutamate, SP, and cortisol) are considered in this thesis even
though there are several other biomolecules produced from the signalling cascades in the
pain pathway. The number of biomolecules under analysis is constrained by whether
they are known to appear in saliva, the availability of assays for that particular
biomolecules, as well as the cost of assay kits.

Blood samples were not included as this would add venepuncture pain and potentially
stress, which may affect the results and could reduce the number of volunteers.
Moreover, the hiring of a qualified person to take blood samples would be required, and
this was beyond the available resources for this MSc project.

 9
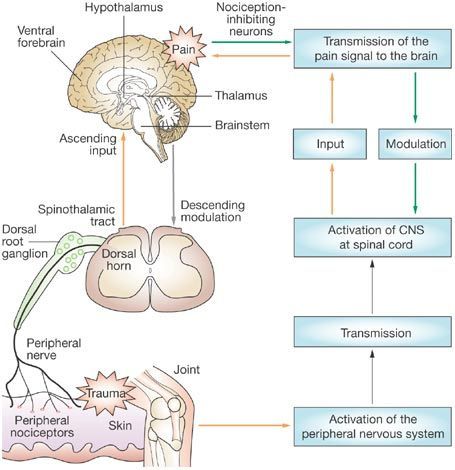
3. LITERATURE REVIEW

3.1 The Nature of Pain
Pain is a universal, yet personal, human experience. It is a complex phenomenon that can
arise from different causes, and varies in location, strength and unpleasantness (McGrath,
1994). At the most basic level, the body detects potential or actual damaging stimuli and
elicits a reflex withdrawal (nociception) through receptors called nociceptors
(Sherrington, 1903). However, the degree of activation of these nociceptors do not
directly translate to the degree of pain experienced by the individual. Nociception and
pain are considered to be two distinct processes, as pain is an experience and nociception
is the physical mechanism that produces that experience. Although pain from injury
cannot occur without nociception (Sneddon, 2018), the manifestation of, perception of,
and reaction to pain in an individual is further influenced by several elements including
physical, genetic, psychological and social factors (McGrath, 1994). Accordingly, pain is a
subjective sensation that is unique with each recurrence within and between individuals.
It is undeniable that pain, regardless of the type, is generally an unpleasant experience,
making it desirable to avoid or limit that pain, especially in the clinical setting. Hence,
objective pain measurement is important for effective personalised pain therapy.

3.2 Current Pain Assessment Methods
Despite the well-established knowledge on the nociceptive pathway that encompasses
nociceptive transduction, transmission, modulation and perception (Figure 1), no
method exists to objectively quantify acute pain intensity. To date, the most conventional
tools for assessing the intensity of acute pain are the visual analogue scale (VAS),
numerical rating scale (NRS), and the verbal descriptor scale (VDS) (Haefeli and Elfering,
2005) (Figure 2). All of these assessments come in the form of a one-dimensional self-
reported scale. They have been demonstrated to be valid, sensitive, reliable, and simple
indicators of pain intensity in both the research and clinical domain (McDowell, 2006;
Jensen et al., 2001), most notably the NRS (Breivik et al., 2000).

However, the self-assessment aspect of those scales is a significant limiting factor
affecting effective administration and accuracy of pain measurement in some clinical
circumstances, for example to determine the dosage of pain killers during anaesthesia,
and for individuals with impaired consciousness and/or cognitive problems (Bendinger
and Plunkett, 2016). Self-reporting also dismisses patients who are unable to provide
their input, such as babies and young children (Breivik et al., 2008). Under these
circumstances, facial expression, and other physiological or behavioural indicators are
normally used to assess acute pain intensity (Puntillo et al., 1997). These are also
subjective measures and suffer from poor reliability.

Therefore, methods to objectively and accurately measure acute pain are needed, as it
has been reported that inadequate pain assessment and management in critical care is
linked to increased morbidity and mortality (Shannon and Bucknall, 2003). Reliable pain
assessment enables more effective management of a patient’s pain, which will improve
their quality of life.

10
Figure 1 – The nociceptive pain pathway (Bingham et al., 2009).

 Figure 2 – Scales for Assessing Pain. Verbal Descriptor Scale (VDS), Numeric Rating Scale
 (NRS) and Visual Analogue Scale (VAS) (Woo et al., 2015).

3.3 Potential Biomarkers of Pain: Glutamate, Substance P and Cortisol
One feasible technique for quantifying acute pain intensity is to assess changes in
concentrations of certain biomolecules associated with the nociceptive pathway, such as
neurotransmitters – small molecules used by the nervous system, responsible for
transmitting information between neurons at chemical synapses (González-Espinosa and
Guzmán-Mejía, 2014). A wide variety of neurotransmitters play a key role in the
sensation and transmission of pain from the periphery to the central nervous system
(Yam et al., 2018). These neurotransmitters bind to nociceptors and trigger their
respective second messenger cascades, eventually eliciting pharmacological effects on
pain regulation (Steeds, 2009). Of all the pain-associated biomolecules, glutamate and

 11
substance P (SP) are the principal neurotransmitters related to nociceptive pain
sensation (Dubin and Patapoutian, 2010).

Aside from being the most ubiquitous excitatory neurotransmitter distributed
throughout practically all circuits within the vertebrate nervous system that is essential
for normal brain function (Purves and Williams, 2001), glutamate has additionally been
found to play a significant role in the perception of nociceptive pain (Bleakman, Alt and
Nisenbaum, 2006). This is due to the fact that glutamate and its receptors are located in
the periphery, spinal cord and brain regions involved in pain sensation and transmission
(Johnson, 1978; Miller et al., 1988), and glutamate is released upon nociceptive
stimulation and nerve or tissue injury (Amaya et al., 2013). In particular, glutamate is the
predominant excitatory neurotransmitter utilised by primary afferent fibres to convey
nociceptive information from the periphery to the dorsal horn of the spinal cord where
this information is integrated and regulated before being sent to higher regions of the
brain for cognitive processing and perception (D’Mello and Dickenson, 2008).
Experiments using animal models have showed that application of glutamate, or specific
glutamate receptor agonists, at the periphery or spinal cord generate nociceptive
behaviours (Wang et al., 2010; Calton, Hargett and Coggeshall, 1995). Similarly, electrical
stimulation of the primary afferent fibres stimulate glutamate release in the spinal cord
(Kangrga and Randic’, 1991). In contrast, inhibition of glutamate release or blockage of
glutamate receptor activation in the periphery or spinal cord of animal models attenuates
acute and chronic pain (Brown and Krupp, 2006; Coderre et al., 2006; Montana and
Gereau, 2011). Currently, there are several glutamate receptor-specific agonists that are
potential therapeutic options for treating neuropathic pain, but further evaluation of
their treatment efficacy is required (Aiyer et al., 2017).

Co-existing with glutamate in a number of primary afferent terminals is SP (De Biasi and
Rustioni, 1998), which is a molecule composed of 11 amino acid residues, and is a
member of the tachykinin neuropeptide family (Van Der Kleij and Bienenstock, 2007). SP
is associated with a large range of processes including wound healing, inflammation and
cell survival (Garcia-Recio and Gascón, 2019). Its co-existence with glutamate implicates
the additional role of SP as another primary neurotransmitter in pain sensation and
perception. This notion is further supported by the evidence that SP and its receptor,
neurokinin 1 (NK1) receptor, is also co-expressed in dorsal horn neurons where here, SP
enhances glutamate-mediated excitatory neurotransmission following afferent fibre
stimulation (Womack, MacDermott and Jessell, 1988; Randić, Hećimović and Ryu, 1990).
Given the expression patterns and anatomical locations of SP and its receptors, SP is a
neuropeptide that acts as both a neurotransmitter and a neuromodulator (Schwarz and
Ackenheil, 2002). Animal models have shown that SP (NK1) receptor antagonists
successfully block peripheral inflammatory responses and inflammatory pain (Henrgy,
1993). Regarding the use of SP (NK1) receptor antagonists as a therapeutic approach to
alleviate pain, their observed analgesic efficacy in preclinical studies did not persist when
tested in the clinical phase, for reasons unknown (Boyce and Hill, 2004).

As pain itself is a potential stressor, a pain-induced stress response may also be elicited
in situations where the perception of pain is magnified to the point of being seen as
catastrophic or threatening, consequently causing fear and avoidance behaviour of pain-
provoking stimuli (Lumley et al., 2011; Crombez et al., 2012). These exaggerated
psychosocial responses to pain are maladaptive in chronic pain states, worsening the

12
pain experience and perpetuate disability. In a typical stress response, the hypothalamic-
pituitary-adrenal (HPA) axis is activated upon perceived stress via the amygdala and,
after a series of biomolecular and hormonal interactions, leads to the release of cortisol
as an end product (Ehlert, Gaab and Heinrichs, 2001). Cortisol is a vital hormone for the
maintenance of blood glucose, suppression of non-vital organ systems (so that highly
active systems such as the brain are provided with more energy), and for the body’s
natural anti-inflammatory response (Heim, Ehlert and Hellhammer, 2000). In addition to
these important functions, cortisol is also a crucial component of the stress response as
it enables the reallocation of necessary energy and substrates required to cope with
stress-provoking stimuli or for evading danger (Blackburn-Munro and Blackburn-Munro,
2003). In the short term, stress-induced increase in cortisol is adaptive, however,
sustained cortisol secretion may be both physically and psychologically debilitating
(McEwen, 2008; Heim, Ehlert and Hellhammer, 2000).

Stress and pain are highly interconnected as they both share significant conceptual and
physiological overlaps (Abdallah and Geha, 2017), indicating a close relationship
between glutamate, cortisol and SP. As well as being a pain-associated neurotransmitter,
SP serves a proinflammatory role (Suvas, 2017) and studies have suggested SP and other
members of the tachykinin family as regulators of emotional processing and
biopsychosocial stress responses (Ebner, Sartori and Singewald, 2009; Felipe et al.,
1998). Furthermore, stress induces the release of glucocorticoids, which rapidly promote
glutamate secretion, affecting glutamate neurotransmission in multiple brain regions
including the hippocampus, amygdala, and prefrontal cortex (Venero and Borrell, 1999;
Groeneweg et al., 2011), implying that stress has the ability to affect cognitive processes.
Collectively, all three biomolecules extensively influence the presence of one another,
working in combination to regulate the physiological response, and emotional and
cognitive processing of stress and pain. Given their respective characteristics and
interactions, glutamate, cortisol and SP are therefore attractive biomarker candidates for
pain that could be used in combination to give a more complete pain profile.

3.4 Existing Research on Pain Biomarkers
3.4.1 Normal Biomolecule Concentrations in Blood and Saliva
Using microdialysis2, animal models have shown that glutamate levels in the brain range
from 0.2 to approximately 20 µM (Dash et al., 2009; De Bundel et al., 2011). In healthy
adults, blood glutamate levels are maintained in a steady state from around 40 to 60 µM
(Bai et al., 2017). From the studies available, normal salivary glutamate baseline
concentrations seem to be lower than those in blood, being about 10 to 30 µmol/L
(Shimada et al., 2016; Nam et al., 2017).

A review of the literature shows considerable variability in the reported control serum
or plasma-derived SP levels that ranges from 12.25 to 397 pg/mL in humans (Campbell
et al., 2006), with each research paper reporting different methods of sample preparation
and analysis. On the other hand, a much higher SP serum range of 402 to 1576 pg/mL
was reported in an SP assay datasheet that looked at the serum of 22 healthy participants
(R&D Systems, 2019). The same source also looked at salivary SP levels in 11 healthy
participants and stated a concentration range starting from a non-detectable range to

2
 Microdialysis – a minimally-invasive sampling technique used for monitoring neurotransmitters and other
molecules in the extracellular environment (Shippenberg and Thompson, 1997)

 13
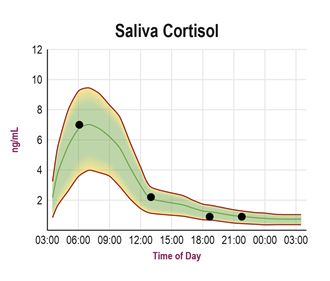
1614 pg/mL. Here, the plasma and saliva SP levels seem to be relatively similar. In
contrast, one study found lower SP levels in the saliva compared to plasma (Jasim et al.,
2018) with salivary levels being around 0 to 600 pg/mL. Yet, several studies have claimed
that SP concentrations appear to be considerably higher in the saliva than in plasma
(Fischer, Eich and Russell, 1998; Jang et al., 2011; Takeyama et al., 1990). Hence, there
does not seem to be a common, consensus range of SP levels in blood and saliva.

The normal, non-stressful secretion of cortisol in adults follow a circadian rhythm,
(Figure 3). This means that there is a distinct, sharp rise in cortisol at the time of
awakening as seen from the figure, followed by a sharp decline by mid-morning, and then
a more gradual decrease across the afternoon and evening (Kirschbaum and
Hellhammer, 2000). Salivary cortisol levels are significantly lower than plasma levels
(Ljubijankić et al., 2008; Jung et al., 2014). According to the referential cortisol values
determined in the Laboratory of Clinical Biochemistry at the Institute for Clinical
Biochemistry and Chemistry at the University of Sarajevo, serum concentrations in the
morning (8 – 9 a.m.) and afternoon (4 – 5 p.m.) are 123.0 to 626.0 nmol/L and 46.2 to
389.0 nmol/L respectively, whilst saliva concentrations are 3.5 to 27.0 nmol/L in the
morning and 1.3 to 6.0 nmol/L in the afternoon (Ljubijankić et al., 2008; Jung et al., 2014).

 Figure 3 – Diurnal Cortisol Curve in Saliva (ZRT Laboratory, 2019).

3.4.2 Pain-related Changes in Biomarker Concentrations
A substantial body of evidence has indicated that cortisol concentrations increase with
pain. One study looking at the circadian rhythms of plasma cortisol in patients suffering
from migraines reported consistently high plasma cortisol levels in 14 of the 25 patients
throughout the day, and an overall higher mean plasma cortisol value in patients than
controls (Ziegler et al., 1979). Moreover, it was noted that within the migraine patients,
the average plasma cortisol levels during the time periods of reported severe pain was
higher than periods of no pain. In a separate study of 40 adult patients with
nonmalignant, painful conditions, 26 patients demonstrated abnormal serum cortisol
concentrations with 12 having higher than normal concentrations, which were reduced
to more normal levels following opioid treatment (Tennant and Hermann, 2002).
Another investigation exploring the effect of stress on pain perception using 46 healthy

14
men found that the rating and threshold of pain, induced by electrical stimulation, was
increased and decreased respectively in response to experimental stress, achieved by
having participants perform a medical test (Choi, Chung and Lee, 2012). Alongside this,
the researchers also reported salivary increase in cortisol and decreased testosterone
levels. From this, it was suggested that acute clinical pain could potentially be relieved by
controlling stress and managing stress-related cortisol and testosterone levels. Similarly,
experimental pain induction of 64 male volunteers receiving either controllable (self-
administered) or uncontrollable (experimenter-administered) painful electrical
stimulation resulted in higher salivary cortisol, subjective helplessness and perceived
pain intensity ratings for the uncontrollable conditions than those in the controllable
condition (Müller, 2011).

Comparison of salivary cortisol levels between patients with chronic pain conditions such
as fibromyalgia, rheumatoid arthritis, and healthy controls in their natural environment
found higher than average cortisol levels in both fibromyalgia and rheumatoid arthritis
patients (Paananen et al., 2015). Contrastingly, a different study looking at patients with
fibromyalgia and controls did not find any significant differences in salivary cortisol
between the two groups, but did report a strong relationship between the levels and
current pain symptoms at the waking time point and one hour after waking (but not at
the later three time points) (McLean et al., 2005). Significant increases in salivary cortisol
from baseline values have also been reported in four-month old infants receiving three
different immunisations either sequentially or simultaneously (two at once, followed by
the third) (Hanson et al., 2010), preterm infants in response to heelstick (Herrington,
Olomu and Geller, 2004), and patients with dental pain (Kanegane et al., 2009). A more
atypical approach looking at cortisol contents of hair samples belonging to patients
suffering from severe chronic pain, receiving opioid treatment for at least one year,
revealed increased cortisol contents in relation to controls and higher perceived stress
scale scores (Van Uum et al., 2008).

Alternatively, it has been theorised that a dysregulation, rather than just an increased
activation, of the HPA axis may actually augment pain perception instead. A study looking
at diurnal variations in cortisol and cold pain sensitivity in female twins found that lower
diurnal variation of cortisol was associated with higher pain ratings (Godfrey et al.,
2013). Another study found that experimentally induced hypocortisolism in healthy
volunteers significantly decreased pain detection thresholds and amplified pain elicited
by inter-digit web pinching (Kuehl et al., 2010).

Taken together, most existing evidence on cortisol seems to suggest a correlation
between pain and elevated cortisol levels in both serum and saliva, but this requires
further investigation as many do not consider the direct relationship between
experimental acute pain induction and cortisol dynamics.

There are fewer studies that consider SP and pain. One study evaluating serum SP levels
in healthy controls and sickle cell disease patients during baseline and acute pain
reported higher patient SP baseline levels compared to controls, with even higher SP
levels in sickle cell disease patients hospitalised for acute pain (Brandow et al., 2016).
The same results were seen in a similar study by a different group of researchers
(Douglas, 2008). Additionally, significantly higher salivary SP concentrations have been
reported in patients with dental pain compared to healthy controls (Ahmad et al., 2014).

 15
Patients with rheumatoid arthritis were also found to have raised serum SP levels, which
were further elevated following critical acute pain in the form of an orthopedic surgery
(Lisowska, Siewruk and Lisowski, 2016). These SP elevations correlated with increased
pain rating. However, it should be noted that the authors did not find any correlation
between SP concentrations in drainage fluid and the severity of postoperative pain, and
a healthy control group was not used. Conflictingly, a more recent study observed no
significant differences between salivary SP concentrations of chronic neuropathic pain
patients and healthy controls (Kallman, Ghafouri and Bäckryd, 2018). The same study
also found no correlation between salivary and plasma SP concentrations. The authors
go on to conclude that salivary SP, along with beta-endorphin, are not biomarkers of
neuropathic chronic pain propensity, and hypothesised that there may be a local
production of SP in the salivary glands. It is clear that the feasibility of using SP as a pain-
associated biomarker remains debatable, and the establishment of a more definite
relationship among SP and pain is desirable.

In parallel, several sources report higher levels of glutamate with the experience of pain.
Saliva samples of patients with temporomandibular disorders contained higher
concentrations of glutamate than controls (Jasim et al., 2014). Likewise, elevated
glutamate levels were seen, via proton magnetic resonance spectroscopy of the posterior
insula in fibromyalgia patients, and these levels were negatively correlated with pressure
pain thresholds (Harris et al., 2009). Moreover, increased glutamate levels have also been
recorded in people who experience chronic migraine compared to those with episodic
migraine and controls (Nam et al., 2017), and in tendon dialysate samples belonging to
patients suffering from painful chronic Achilles tendinosis (Alfredson, Thorsen and
Lorentzon, 1999). Use of time-resolved functional proton magnetic resonance
spectroscopy to look at cortical neurotransmitter concentrations showed an overall
increase in glutamate concentration with experimentally induced short, acute heat pain
in healthy volunteers in relation to the non-stimulus condition (Gusset wet al., 2010). The
same observations with glutamate can be seen in animal models. Rats treated with
oxaliplatin, a chemotherapy medication that causes painful peripheral neuropathy, had
higher baseline glutamate concentrations in the cerebrospinal fluid that were markedly
increased with mechanical stimulation of the hind paw (Yamamoto et al., 2017). The
literature, though small in volume, suggests that there are raised glutamate levels with
pain induction and in painful conditions.

Considering everything as a whole, many gaps exist in the literature concerning pain and
the three potential biomarkers, such as how fast the salivary levels of each biomolecule
change as a result of pain. All of these needs to be addressed and further clarified.

3.5 Saliva as a Window into the Health State of the Body
More recently, saliva has been gaining an increasing amount of attention as a medium for
gaining insight into the health state of the brain and central nervous system of the
individual. This concept arose through the fact that saliva contains over 2000 proteins,
where 27% of those are also found in blood (Loo et al., 2010). It is believed that these
proteins enter the saliva through means of passive diffusion through the spaces between
the cells (Jusko and Milsap, 1993). Hence, saliva can be viewed as functionally equivalent
to serum in the context of reflecting the health status of the human body (Walton, 2018).
Moreover, utilisation of saliva as a diagnostic tool is more advantageous than other
methods due to its easy, non-invasive, cost-effective collection, and unlimited

16
reproducibility. As observed from the mentioned literature, some studies, particularly
newer ones, have already employed the use of saliva to detect and analyse potential pain-
associated biomarkers, though it remains that this method is relatively new and requires
more exploration.

3.6 Aim, Hypotheses and Vision
Currently, there is no study to date that directly investigates experimentally induced
acute cold pain in healthy volunteers and the change in concentrations of a combination
of pain-associated biomolecules in any biofluid. The main aim of this pilot study is to fill
this gap by exploring the relationship between the concentration of three biomolecules –
glutamate, substance P and cortisol – in the saliva and the intensity of acute pain.

Our hypothesis is that: salivary concentrations of one or more of the three biomolecules
will change with the presence of acute pain, compared to baseline values, and revert back
to baseline after a period of time, such as one hour. If this initial hypothesis is true, it is
further hypothesised that those reporting higher pain intensity ratings in the CPT will
exhibit larger changes in biomolecule concentrations compared to those with lower pain
intensity ratings.

The null hypothesis is that salivary concentrations of one or more of the three
biomolecules will remain unaffected by the presence of pain.

This study hopes to pave the way to a better understanding of pain, potential biomarkers
for quantifying acute pain intensity, and the feasibility of using saliva as a non-invasive
diagnostic fluid. If positive outcomes are achieved, the long-term vision is to create a
wearable system for non-invasive monitoring biomarkers of acute pain from saliva. Such
a technology could provide quantifiable data on pain intensity in the clinical setting and
ultimately allow personalised and automated acute pain therapy after surgery and
trauma.

 17
4. MATERIALS AND METHODS

4.1 Ethical Approval
This study was approved by the University College London Research Ethics Committee
(identification number: 15021/001). The Declaration of Helsinki guidelines were
followed. All participants in the study provided both written and verbal consent before
taking part.

4.2 Participants
Participants were recruited via email advertisement (Appendix A) and by word-of-mouth
with the inclusion and exclusion criteria displayed in Table 1. Those expressing their
interest in taking part in the experiment were emailed the consent form and participant
information sheet (Appendix A), and asked to confirm their participation. Once the
participant agreed to take part in the experiment, a convenient date for the participant
was chosen.

 Table 1 – Inclusion and exclusion criteria .
 Inclusion Exclusion
 • Have good general health Anybody with the following:
 • Aged between 18 to 70 years old • Any current pain
 • Can maintain oral hygiene on the day of • Diagnosed with systematic muscular
 the experiment – refrain from consuming joint diseases
 food and drinks (except water) 3 hours • Neurological disorders
 before the experiment, and brush your • Pregnant or lactating
 teeth after the meal, but no later than 1 • Diagnosed with high blood pressure
 hour before the experiment • Uses tobacco
 • Take regular medication (includes
 contraceptives, antidepressants and
 analgesics)
 • Poor oral condition (e.g. has dental or
 oral diseases)

4.2.1 Participants – Experiment
20 healthy participants took part in the study, with equal numbers of males and females.

The mean (± standard deviation (SD)) and median participant age was 27.4 (± 6.8) and
24 years, respectively, with the age range of 21 – 40 years.

From a power calculation, (Kane, 2019) 20 participants were sufficient for detecting a
statistically significant difference of at least 20% in biomarker level between samples,
with 80% power at a significance level of 5%.

All participants received £10 as reasonable expenses for taking part in the study.

4.2.2 Participants – Data Analysis
Due to time constraints, the limited number of wells per microplate, and the cost of
biomolecule detection kits, three to four saliva samples of only 10 participants were

18
analysed in this thesis. The remaining samples will be later analysed to complete the
investigation, but will not be included here.

Saliva samples from 5 males and 5 females were chosen to be analysed. The mean (± SD)
and median participant age was 28.3 (± 7.4) and 25 years, respectively, with the age
range of 22 – 40 years.

4.3 Experimental Pain Induction
Methods for inducing pain can largely be grouped into the following categories:
mechanical, thermal, electrical, chemical, and muscle stimulation (Reddy et al., 2012).
Each approach has its own major shortcomings, such as generating non-specific
activation of receptors, variability in individual responses, and the inability to control
onset and offset time of pain (Reddy et al., 2012).

The cold pressor task (CPT) was used as the experimental pain modality in this
preliminary study as it is a well-established experimental paradigm for experimental
pain induction, and has been used in a wide range of studies such as those investigating
stress, coronary artery disease and pain (Chang, Arendt-Nielsen and Chen, 2002; von
Baeyer et al., 2005; Fulbright et al., 2001). CPT involves submersion of the hand in an ice
bath, consequently inducing pain. The associated sympathetic response causes a
concomitant increase in heart rate, arterial blood pressure, and other sympathetic
physiological responses (Tassorelli et al., 1995). It is known to have high reliability and
validity (Edens and Gil, 1995), and can effectively mimic the effects of pain due to its
unpleasant sensation (Rainville et al., 1992).

In comparison to other pain modalities, the CPT is relatively easy to set up and does not
require specialist equipment, unlike certain types of thermal, mechanical and electrical
stimulation. Furthermore, the whole pain-induction process using CPT does not need to
account for substantial delays between pain induction and pain perception, which is
usually the case for chemical modalities involving injection or topical application of
chemicals. Most importantly, using CPT, participants have full control over when to self-
induce and terminate pain, ensuring greater comfort and well-being throughout the
whole experimental process.

4.4 Experimental Design and Setup
The experiment was carried out at the Aspire Create Centre for Rehabilitation
Engineering and Assistive Technologies (CREATe) in the Royal National Orthopaedic
Hospital, Stanmore.

Three hours prior to coming into the laboratory, participants were requested not to eat
or drink anything besides water to prevent a temporary increase in cortisol level
(Stachowicz and Lebiedzińska, 2016). Additionally, participants were requested to brush
their teeth after having their meal to get rid of any debris in the saliva, but requested to
do this at least one hour before providing any samples as this may generate blood
contamination in the saliva samples. As toothpaste was not standardised (participants
used their own toothpaste) before going into the laboratory, the time window of at least
one hour was also given to reduce any potential effects of the toothpaste on the salivary
biochemical composition and allow both the composition and salivary flow rate to return
back to baseline values (Ligtenberg et al., 2006).

 19
All participants were asked to come into the laboratory between 2 to 3:30 pm on separate
days, and each session lasted for a maximum duration of two hours. The experiments
were run in the afternoon at the indicated timeframe to account for the cortisol diurnal
variation and the fact that cortisol levels remain more stable at a concentration of ~0.1
µg/dL starting from approximately 2pm onwards, two hours after consuming lunch
(Figure 3).

Acute pain was induced by having subjects submerge their forearm and hand into an ice
bath with a temperature maintained between 0 - 5°C for a maximum of 5 minutes (or
until the pain becomes unbearable during those five minutes) (Eren et al., 2018). Five
minutes was chosen as the upper time limit to avoid any adversary effects (e.g. ice burn
or cold stress). The ice bath was comprised of a container with ice, ice packs and cold
water, whilst temperature was monitored using a thermometer.

4.5 Protocol
The protocol is summarised in Figure 4.

Succeeding the participant’s arrival, obtainment of written consent, and experimental set
up, participants were reminded of the procedure and had it emphasised to them that
during the CPT they were allowed to remove their forearm and hand from the ice bath
whenever the pain was unbearable, and five minutes was only a maximum limit. It was
also stressed to them that the removal of their limb from the ice bath will mark the end
of the CPT.

 Submerge forearm and hand into
 ice bath

 Time -2 -1 T=0 T=x + 10 +20 +30 +40 +50 +60
 (min)

 Sample S1 S2 S3 S4 S5 S6 S7 S8 S9
 #

 NRS

 Figure 4 – Experimental Protocol. Two baseline saliva samples were taken before any pain. Then at T = 0, when
participants were ready, the participant’s forearm and hand were submerged into the ice bath. At T = x, which is
 the maximum time of five minutes or when participants removed their limb from the ice bath within those five
minutes, another saliva sample was taken and the pain was rated using the numerical rating scale (NRS) provided.
 Another saliva sample was then obtained every ten minutes afterwards for a total duration of one hour.

After ensuring they understood the instructions, participants were asked to provide two
preliminary saliva samples. These two initial saliva samples served as the baseline
biomarker values before the induction of pain, and allowed the participants to become
familiar with the saliva collection procedure. Then, when participants were comfortable
and ready, they were asked to submerge their forearm and hand into the ice bath. After

20
five minutes, or whenever the participant removed their limb from the ice bath within
those five minutes, participants provided another saliva sample and rated the intensity
of the pain experienced. Subsequently, a saliva sample was collected every ten minutes
for one hour after the termination of the CPT. A total number of nine saliva samples were
collected from each participant.

Participant’s heart rate and blood pressure was periodically monitored every five
minutes throughout the entire experiment to ensure their well-being and to observe the
physiological changes induced by the CPT.

4.6 Saliva Collection
Saliva was collected in cryovials using Salimetrics Collection Aids® (Salimetrics LLC,
State College, PA). During the saliva collection, participants were requested to keep their
eyes open and not to speak.

In this study, whole saliva collected by passive drool was collected as it is considered to
be a gold standard due to the fact that it eliminates any bias that can arise from factors
such as the differentiated contributions of each salivary gland and reflex stimulation
(Capelo-Martínez, 2019). As such, the saliva samples obtained using this method are seen
to be the purest samples possible, and can furthermore be stored in a “biobank” for future
research. Passive drool involves having the participant tilt their head forward whilst
drooling down a collection aid attached to a cryovial.

A 1 mL of volume of saliva was collected per sample. In instances where the participant
was unable to produce enough saliva before the next sampling time, they were instructed
to provide at least 0.5 mL of saliva to ensure that there was enough saliva to test for all
three biomolecules.

During the experiment, the collected saliva samples were kept on ice to prevent
degradation of sensitive peptides. Immediately after the session, the samples were
transported and frozen at -20°C until analysis.

4.7 Rating Pain Intensity
Participants rated the maximum pain intensity experienced during the CPT using the NRS
provided (Figure 5). The maximum pain intensity was requested to determine whether
or not the maximum pain experienced correlated with the changes in biomolecule
concentrations.

The NRS comprised of a line segmented into ten parts each labelled with the number 0 to
10 in increasing order, as well as a short description above the numbers 0, 5, and 10
indicating “no pain”, “moderate pain”, and “worst pain” respectively. Participants were to
indicate the pain intensity on the numerical scale. Faces expressing a gradual transition
from an extremely happy face to crying face at every even number was also included and
displayed underneath the numerical scale to help further illustrate the level of
unpleasantness the numbers on the scale corresponded to.

 21
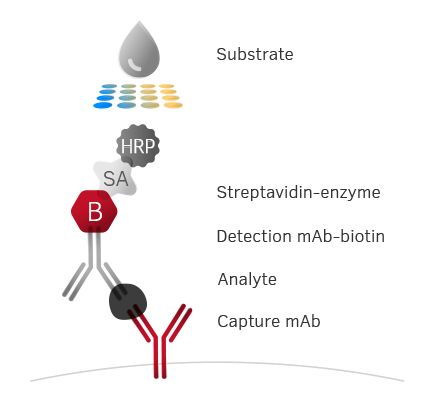
How much pain did you experience?

 Figure 5 – Numerical rating scale (NRS). The NRS provided to the participants to rate the
 maximum pain experienced from the cold pressor task.

4.8 Sample Analysis: Enzyme-Linked Immunosorbent Assay
Glutamate, SP and Cortisol were quantified using enzyme-linked immunosorbent assay
(ELISA) kits purchased from Abcam (ab83389, UK) and Stratech (CSB-E08357H-CSB, UK;
1-3002-SAL, UK), respectively. The minimum and maximum value, sensitivity, and
maximum percentage error amongst standard duplicates for each ELISA kits is displayed
in Table 2. Preparation and analysis of saliva samples were carried out in accordance to
the manufacturer’s recommendations.

 Table 2 – Minimum, maximum, sensitivity and maximum percentage error amongst standard
 duplicates of the glutamate, substance P and cortisol enzyme-linked immunosorbent assay (ELISA) kit
 used
 Minimum Maximum Sensitivity Maximum Percentage
 Error Amongst
 Standard Duplicates
 (%)
 Glutamate (µM) NA 100 NA 41.8
 Substance P
 6.25 400 1.56 80.7
 (pg/mL)
 Cortisol (µg/dL) 0.012 3 0.007 53.3
NA = data not available

ELISA is a plate-based assay technique for detecting and quantifying biological
substances. This technique generally uses the following principle (Figure 6):
 1) Specific antibodies are immobilised on high protein-binding plates that usually
 comes in a 96-well format

22
2) Standard dilutions and samples are added to the wells, and the plate-bound
 antibodies will capture the specific biological substances desired
 3) To enable the detection of the captured protein, specific biotinylated detection
 antibody is added to the wells
 4) Streptavidin conjugated with alkaline phosphatase is added to the wells, which
 binds to the biotinylated antibody
 5) A colourimetric substrate is added to the wells and a coloured solution will form
 when it is catalysed by the enzyme
 6) Absorbance is measured using a compatible plate reader, and the amount of that
 biological substance in the sample is determined

 Figure 6 – The Principles for ELISA. (Mabtech, 2019)

On the day of analysis, the saliva samples were completely thawed, brought to room
temperature, vortexed and centrifuged at 1500 × for 15 minutes to remove mucins and
other particles that would interfere with antibody binding and affect results. The
supernatant (upper, liquid) portion of each sample was then extracted and pipetted into
appropriate microplate wells.

Every assay performed required the use of standards provided in the kit and duplicate
readings for every sample. Thus, each data point (for each participant at each time point),
is the average value of the two values taken from two wells. Additionally, only three to
four saliva samples of the chosen 10 participants could be analysed per 96-well kit. For
SP and glutamate, four time points were analysed: Pre, Post +0 minutes (min), Post +20
min, and Post +60 min. For cortisol, three time points were analysed: Pre, Post +0 min,
and Post +60 min.

4.9 Data Analysis
All data analysis was performed in MATLAB R2018b (The MathWorks, Inc., Natick, MA).

All tests were two-tailed where a p-value of < 0.05 was used as an indicator of statistical
significance, except for the Kruskal-Wallis test where a p-value of < 0.01 was an indicator
of statistical significance instead. One p-value is given as an output as a result of each of

 23
You can also read