A SELF-ORGANIZED SYNTHETIC MORPHOGENIC LIPOSOME RESPONDS WITH SHAPE CHANGES TO LOCAL LIGHT CUES - MPG.PURE
←
→
Page content transcription
If your browser does not render page correctly, please read the page content below
ARTICLE
                  https://doi.org/10.1038/s41467-021-21679-2                 OPEN

                  A self-organized synthetic morphogenic liposome
                  responds with shape changes to local light cues
                  Konstantin Gavriljuk1,4, Bruno Scocozza1,4, Farid Ghasemalizadeh 1,4, Hans Seidel 1,4, Akhilesh P. Nandan1,3,
                  Manuel Campos-Medina1, Malte Schmick1, Aneta Koseska1,3 & Philippe I. H. Bastiaens 1,2 ✉
1234567890():,;

                  Reconstituting artificial proto-cells capable of transducing extracellular signals into cytos-
                  keletal changes can reveal fundamental principles of how non-equilibrium phenomena in
                  cellular signal transduction affect morphogenesis. Here, we generated a Synthetic Morpho-
                  genic Membrane System (SynMMS) by encapsulating a dynamic microtubule (MT) aster and
                  a light-inducible signaling system driven by GTP/ATP chemical potential into cell-sized
                  liposomes. Responding to light cues in analogy to morphogens, this biomimetic design
                  embodies basic principles of localized Rho-GTPase signal transduction that generate an
                  intracellular MT-regulator signaling gradient. Light-induced signaling promotes membrane-
                  deforming growth of MT-filaments by dynamically elevating the membrane-proximal tubulin
                  concentration. The resulting membrane deformations enable recursive coupling of the MT-
                  aster with the signaling system, which generates global self-organized morphologies that
                  reorganize towards local external cues in dependence on prior shape. SynMMS thereby
                  signifies a step towards bio-inspired engineering of self-organized cellular morphogenesis.

                  1 Department of Systemic Cell Biology, Max Planck Institute for Molecular Physiology, Dortmund, Germany. 2 Faculty of Chemistry and Chemical Biology, TU

                  Dortmund, Dortmund, Germany. 3Present address: Cellular Computations and Learning, Center of Advanced European Studies and Research (caesar),
                  Bonn, Germany. 4These authors contributed equally: Konstantin Gavriljuk, Bruno Scocozza, Farid Ghasemalizadeh, Hans Seidel. ✉email: philippe.
                  bastiaens@mpi-dortmund.mpg.de

                  NATURE COMMUNICATIONS | (2021)12:1548 | https://doi.org/10.1038/s41467-021-21679-2 | www.nature.com/naturecommunications                              1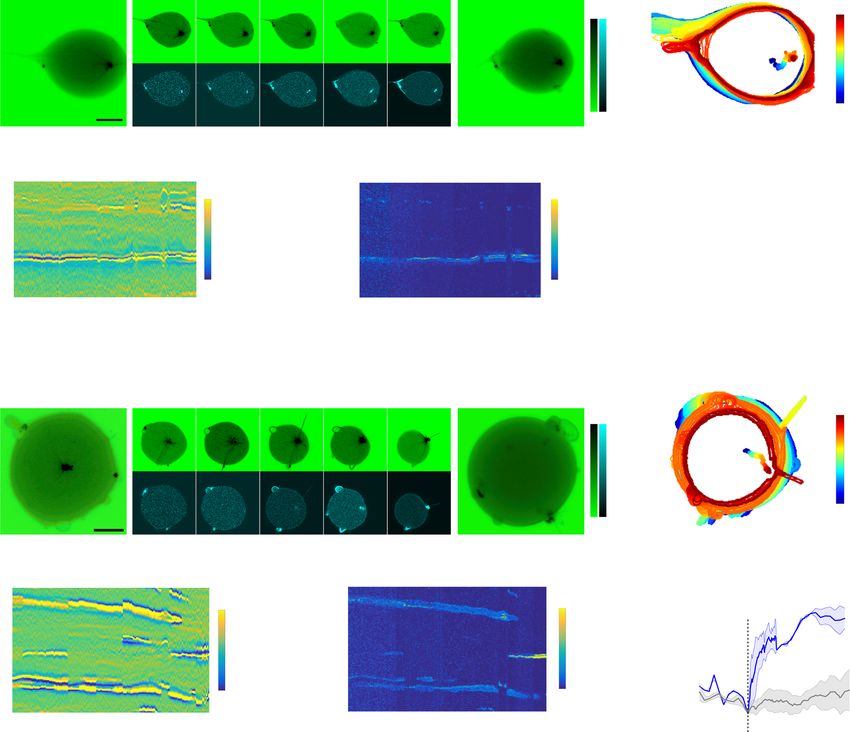
ARTICLE                                                                  NATURE COMMUNICATIONS | https://doi.org/10.1038/s41467-021-21679-2

C
        ells acquire their shape, which is tightly linked to their            Encapsulating higher tubulin568 concentrations (35–40 μM) in
        biological function, by dynamic cytoskeletal systems that             GUVs with rigid membranes led to an average astral-MT length
        deform the plasma membrane. Cell shape changes and                    that was longer than the GUV radius, resulting in cortical MTs
motility are driven by the microtubule (MT) and actin filament                 with peripheral centrosome positioning (Fig. 1a, b)21. When
systems, which operate at different length- and timescales1. Actin            GUVs with high tubulin concentration were, however, formed
filaments dictate the rapid, more local morphological dynamics at              under hyperosmotic conditions, the decreased luminal GUV
the cell periphery, whereas MTs are far more long lived, persist              volume enabled the MTs to deform the membrane with spiking
over longer distances and are globally organized through MT-                  protrusions (SPs) in which several MTs converged. This led to an
organizing centers. The dynamical organization of the MT-                     asymmetric morphology with one or more polar SPs and a
network therefore accounts for both, plasticity in shape formation            decentered centrosome, reflected in an increased GUV eccen-
in undifferentiated cells depending on environmental cues, but                tricity and average MT length (Fig. 1a, b). The bundling of
also shape stabilization after differentiation2–6.                            bending MTs into the protrusions indicated that MT-induced
   Cytoskeletal reorganization is directed by extracellular mor-              membrane deformations can further serve as capture sites for
phogens by inducing localized signaling reactions, generating a               neighboring MTs, which constitutes an amplifying process of self-
polarized cytoplasmic activity of MT-associated proteins. Pre-                induced capture (SIC).
nylated Rho GTPases such as Rac thereby serve as switchable                      The net MT growth of small encapsulated asters was next
recruitment factors that concentrate cytoplasmic kinases e.g.,                induced by raising the temperature from 20 to 34 °C (Supple-
PAK1 at morphogen exposed areas of the plasma membrane                        mentary Fig. 1d). This is analogous to a uniform cytoplasmic
through the principle of dimensionality reduction7–9. The kinase              signal that regulates MT-aster size by globally affecting growth
then phosphorylates the negative MT-regulator stathmin10 and                  kinetics of MTs22,23. In spherical GUVs with high membrane
alleviates its effect on suppressing MT growth resulting in MT                tension, temperature-induced MT growth led to centrosome
growth towards the signal. However, cells do not reorganize their             decentering and the formation of semi-asters21 (Fig. 1c; Supple-
shape solely in response to extracellular signals, but integrate in           mentary Fig. 1e; Supplementary Video 1). In contrast, in GUVs
their response previous sensory experiences in order to commit to             with a deformable membrane, the system reorganized from a
distinct shapes during differentiation11–13. How memory of                    morphology with isotropically distributed microtubules to a
previous morphogen patterns is maintained and how this affects                stable polar protrusion morphology. The centrosome decentered
the signal-induced morphogenesis remains elusive.                             as transient protrusions converged to a single one at the opposite
   In order to study principles of morphogen-induced morpho-                  pole (Fig. 1d; Supplementary Fig. 1f, Supplementary Video 1).
genesis, we reconstituted a minimal out-of-equilibrium system                 This indicated that growing MT bundles in protrusions provided
based on the physicochemical processes of the canonical Rac1-                 an initially random directional push to the centrosome, which
Pak1-stathmin pathway14–17 in cell-sized liposomes with encap-                further polarized the GUV by a recursive process of protrusion
sulated dynamic MT-asters. The system was designed to respond to              coalescence and centrosome decentering. Protrusion coalescence
light cues, while maintaining the basic principles of localized signal        (Fig. 1d, Supplementary Fig. 1f) indicated that this process was
transduction from morphogens that generate intracellular MT-                  driven by SIC, where initial MT-induced membrane deformations
regulator signaling gradients18. Our results show that the signaling          served as capture sites for neighboring MTs (Fig. 1e), thereby
gradient affects astral-MT growth leading to membrane deforma-                enlarging these deformations. Similar filamental organization at
tions, which not only define cell shape, but also constitute a means           the membrane has previously been described for actin24.
by which the MT-cytoskeleton and signaling can recursively                       To investigate the basic rules underlying this dynamical
interact. This interaction causes these proto-cells to self-organize          transition to polar protrusion morphology, we described non-
into shapes that can transform their morphology in response to                equilibrium fluctuations in MT-growth kinetics25,26 and the
localized light cues in dependence on their initial shape.                    cooperative bundling mechanism upon MT-induced membrane
                                                                              protrusions using an agent-based model. The model was
                                                                              implemented for a constant MT number27 using Monte-Carlo
Results                                                                       simulations in a 1D circular geometry (Methods). For a defined
The encapsulated MT-asters system. To investigate the condi-                  number of nucleated MTs that evolve from fixed initial positions,
tions under which centrally organized dynamic MTs generate                    the simulations showed that cooperative attraction of MTs by
vesicle morphologies by deforming the membrane of a giant                     neighboring MTs in protrusions results in global organization of
unilammelar vesicle (GUV), we encapsulated purified centro-                    the MTs into two stable protrusions at opposed poles, as
somes together with tubulin and GTP in GUVs using cDICE19.                    experimentally observed (Supplementary Fig. 1g, top, Supple-
This generated dynamic20 MT-asters inside GUVs of ~25 ± 5 μm                  mentary Video 2, left). This suggested that the self-organization
diameter, which could be monitored by confocal laser scanning                 towards a polar morphology in the MT-membrane subsystem can
microscopy (CLSM) using trace amounts of fluorescently labeled                 be formally abstracted through a stigmergic28–30 substrate-
Alexa568-tubulin (~10%, henceforth referred to as tubulin568,                 depletion model (Fig. 1f), where SIC of MTs into protrusions
Methods). Asters were formed around a single centrosome or a                  depletes free MTs. We calculated the kymograph representing the
centrosome cluster acting as a single MT-organizing center.                   density of SIC-bundled MTs using a reaction–diffusion descrip-
GUVs containing trace amounts of DOPE-biotin (0.05%) were                     tion of this substrate-depletion model in a simplified circular
immobilized to a biotinylated cover slide via biotin-cross-linking            geometry with periodic boundary conditions, representing the
streptavidin (Methods). Aster size relative to the GUVs was                   angular distance along the circular GUV membrane (Fig. 1e,
controlled by encapsulating different concentrations of tubulin               right). The results indeed reflected the formation of a stable polar
(Supplementary Fig. 1a–c) and the membrane tension was con-                   pattern when starting from uniformly distributed free MTs
trolled by the outside osmolarity to generate GUVs with rigid or              (Fig. 1g, Supplementary Fig. 1h). The Monte-Carlo and the
deformable membranes (Methods).                                               reaction–diffusion model additionally showed that formation of a
   Encapsulating tubulin568 concentrations between 15 and                     star-like pattern formation would be possible for increased
25 μM in GUVs with rigid membranes (iso-osmotic conditions)                   number of nucleated MTs (Supplementary Fig. 1g bottom,
resulted in a spherical morphology and asters smaller than the                Supplementary Video 2, right and Supplementary Fig. 1i),
size of the GUV, with a centrally positioned centrosome.                      corroborating the equivalence in the qualitative description of

2                 NATURE COMMUNICATIONS | (2021)12:1548 | https://doi.org/10.1038/s41467-021-21679-2 | www.nature.com/naturecommunications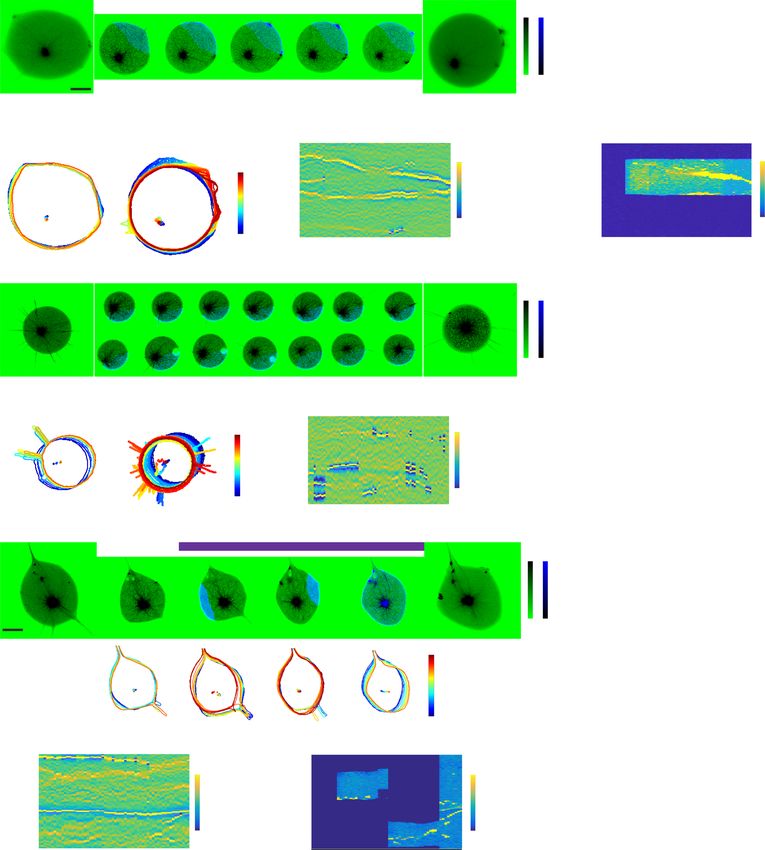
NATURE COMMUNICATIONS | https://doi.org/10.1038/s41467-021-21679-2 ARTICLE
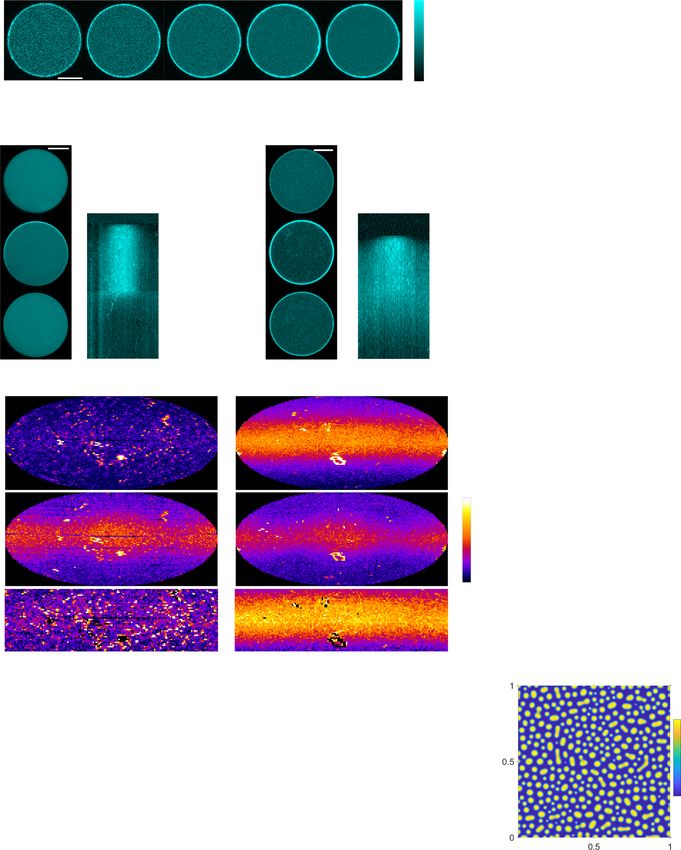
Fig. 1 Self-organized morphologies of liposomes with encapsulated MT-asters. a Representative 3D projections of encapsulated asters imaged by
Confocal Laser Scanning Microscopy (CLSM) of tubulin568 fluorescence (color bar: normalized intensity). Left to right: low tubulin (15–25 μM), rigid
membrane (iso-osmotic, 0 mOsm); high tubulin (35–40 μM), rigid membrane; high tubulin, deformable membrane (hyperosmotic, 160 mOsm).
b Morphometric and average microtubule (MT)-length quantification under conditions represented in a: low (black: 12, 12, 9 GUVs, respectively) or high
tubulin (orange: 30, 30, 24) at iso-osmotic, and high tubulin at hyperosmotic (magenta: 12, 12, 19) conditions. Centrosome position: 0—centered, 1—
membrane proximal, eccentricity: 0—perfect circle, >0—deformed circle (Methods). Boxplots: individual GUV (diamond), 25th and 75th percentile (box),
1.5 interquartile range (whiskers), median (line), and mean (square). p-values from two-sample Kolmogorov–Smirnov test with 95% confidence interval.
c Top: CLSM time-lapse of temperature-change-induced aster growth in a GUV with rigid membrane (color bar: normalized fluorescence intensity).
Bottom left: angular membrane curvature kymograph overlaid with centrosome position (small circle: centered, large circle: membrane proximal). Color
bar: inverse radius (1/µm) of inscribed circle (Methods). Lines indicate times of connected micrographs. Bottom right: GUV contours during time-lapse,
color coded by time (colored dots: corresponding centrosome positions). d CLSM time-lapse of temperature-change-induced aster growth in a GUV with
deformable membrane (color bar: normalized fluorescence intensity). Bottom left: angular membrane curvature kymograph overlaid with centrosome
position as in c. Bottom right: GUV contours during time-lapse, color coded by time progression as in c. See additional examples in Supplementary Fig. 1e, f.
e Left pictogram: self-induced capture (SIC) of MTs (colored lines). MT-induced membrane deformations promote further capture of neighboring MTs
(yellow feedback arrow onto black interconversion arrow), which bundle by sliding into the protrusion (arrowheads). Curved black arrows: MT-dynamic
instability. Right: scheme of angular density of bundled MTs, simplified on a 1D circular geometry. f Pattern-generating MT-depletion model. Horizontal
arrows: conversion between free and bundled MTs. Angled arrow: positive feedback mediated by SIC. g Angular density kymograph (color bar: normalized
density) of MT-bundling described by model in f, simulated in 1D circular geometry (e right). Parameter settings; total amount of MTs: c1 = 1300, SIC
feedback strength: γ1 = 1 (Methods). See also Supplementary Fig. 1h, i. Scale bars: 10 μm.
the MT-membrane subsystem dynamics within both frameworks. αβ-heterodimers available for polymerization17. In response to
These results therefore suggest that the fundamental principle of extracellular stimuli, stathmin becomes phosphorylated on up to
SIC of dynamic MTs into protrusions together with their four residues (pStathmin), which inactivates its inhibitory effect
depletion elsewhere can describe the formation of distinct MT- on MT growth by reducing the affinity for soluble tubulin31. We
induced shape patterns, as experimentally observed. quantified the effects of stathmin phosphorylation on recon-
stituted MT-dynamics by single-filament TIRF assays (Methods).
Regulation of microtubule growth by the microtubule reg- Increase in stathmin concentration linearly decreased MT-growth
ulator stathmin. In cells, the 17-kD cytoplasmic protein stathmin speed and abruptly increased catastrophe frequency that
negatively regulates MT-dynamics by sequestering tubulin could be reversed upon increasing the fraction of pStathmin at
and thereby effectively decreases the concentration of free constant total Stathmin and tubulin concentration (Fig. 2a, b,
NATURE COMMUNICATIONS | (2021)12:1548 | https://doi.org/10.1038/s41467-021-21679-2 | www.nature.com/naturecommunications 3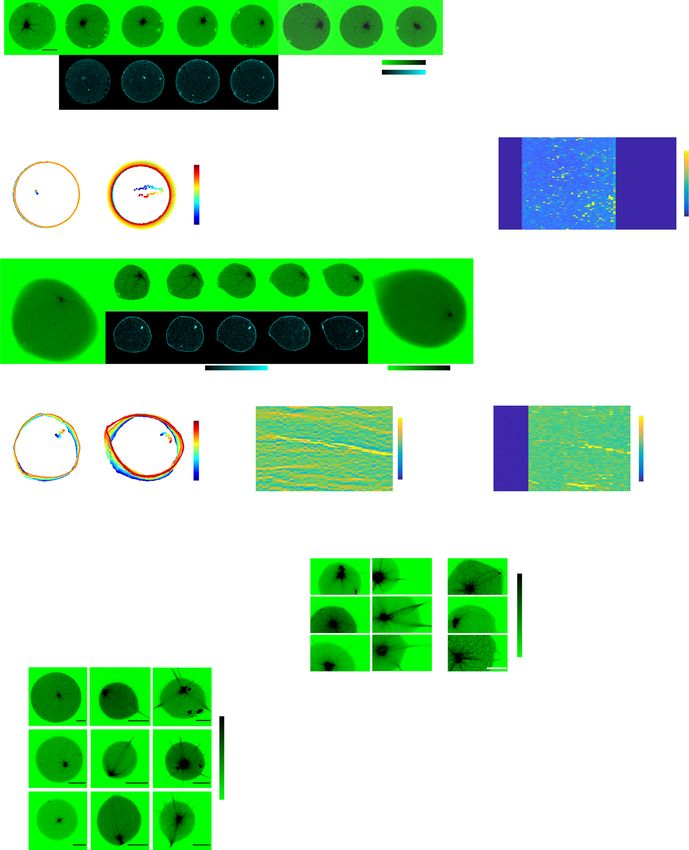
ARTICLE NATURE COMMUNICATIONS | https://doi.org/10.1038/s41467-021-21679-2
a b
Phosphorylated stathmin fraction Phosphorylated stathmin fraction
0 0.25 0.5 0.75 1 0 0.25 0.5 0.75 1
7
tubulin 0.005
6
pStathmin fraction
Catastrophy frequency (s-1)
(20 µM total stathmin, 40 µM tubulin)
Growth velocity (µm/min)
5 0.004
4
0.003
3
0.002
2
1
0.001
0
0.000
0 10 20 30 40 0 10 20 30 40
[tubulin] (µM) [tubulin] (µM)
c d
-5
-4 -6 30 p = 4.21x10
p = 5.49x10 p = 5.01x10
1
Average MT-length (µm)
1.2 0.9
100% 25 100%
Centrosome position
0.8
1.0
Relative aster size
20
Eccentricity
0.7
pStathmin 0.8 0.6 pStathmin
15
0.6 0.5
0.4 10
0.4
0.3
36% 0.2 5 0%
0.2
0.1 0
0.0
stathmin stathmin
0 stathmin pStathmin stathmin pStathmin stathmin pStathmin
2 3 4 5 6 7 8 9
[stathmin] (µM)
Fig. 2 Regulation of MT-dynamics and aster size by phosphorylation of stathmin. a Dependence of MT-growth velocity, and b catastrophe frequency on
tubulin concentration (black squares, black axis on bottom) and fraction of phosphorylated stathmin (pStathmin, red dots, 40 μM tubulin and the fraction
of phosphorylated stathmin was varied keeping a fixed total concentration of 20 μM stathmin, red axis on top) as determined by single-filament TIRF
microscopy assays (mean ± S.E.M, 78 tracked filaments per condition from N = 3 independent experiments). See also Supplementary Fig. 2a, b. c Size of
MT-asters on glass surface as a function of stathmin (blue dots) and pStathmin (red dots) concentration, at 35 μM tubulin. Error bars: Standard Error of the
regression (Methods). Right: examples of multiple overlaid asters on glass surface (33 asters per condition from N = 2 independent experiments, yellow
color bar denotes normalized tubulin568 fluorescence intensity) in the presence of 7 μM pStathmin (top) or stathmin (bottom). d Morphometric and
average MT-length quantification (as in Fig. 1b) of GUVs containing 5 ± 1 μM stathmin (17 GUVs, N = 2) or pStathmin (13 GUVs, N = 3), at 40 ± 7 μM
encapsulated tubulin. Centrosome position: 0—centered, 1—membrane proximal, eccentricity: 0—perfect circle, >0—deviations from circle (Methods).
Boxplots: individual GUV (diamond), 25th and 75th percentile (box), 1.5 interquartile range (whiskers), median (line), and mean (square). p-values from
two-sample Kolmogorov–Smirnov test with 95% confidence interval. Right: examples of 3D confocal stack projections of tubulin568 fluorescence (yellow
color bar denotes normalized intensity) depicting GUV morphologies in the presence of pStathmin (top) or stathmin (bottom). Scale bars: 10 μm.
Supplementary Fig. 2a, b). Interaction of fluorescently tagged Dimensionality reduction by light-induced kinase-transloca-
stathmin with MT-plus ends was not observed, concluding that tion mimics intracellular signal actuation. To capture the
stathmin affects MT-dynamics purely through sequestering free dimensionality reduction principle7–9 of Rho-GTPase-activated
tubulin17,32. In this manner, increasing stathmin decreased the kinase signaling, we encapsulated fusion constructs of improved
average size of reconstituted free asters on glass surfaces, whereas Light-Inducible Dimer/Stringent starvation protein B (iLID/SspB)
pStathmin hardly affected aster size in the same concentration optical dimerizer system33. iLID was associated with the mem-
range (Fig. 2c). Furthermore, encapsulation of 5 ± 1 μM stathmin brane via a fused C2 phosphatidylserine-binding domain (C2-
and 40 ± 7 μM tubulin (final concentration considering encap- iLID), while the SspB domain was fused to stathmin phosphor-
sulation efficiency, Supplementary Fig. 2c, d) in GUVs with a ylating kinase AuroraB34 (SspB-AuroraB). Encapsulation of both
deformable membrane resulted in decreased MT-aster size lead- constructs enables translocation of AuroraB to a GUV membrane
ing to a spherical morphology comparable to that obtained at in response to 488 nm light stimuli. Step-wise increase of the 488
lower tubulin concentrations. However, encapsulation of 5 ± nm light dose induced repartitioning of fluorescent SspB-
1 µM pStathmin and 40 ± 7 µM tubulin resulted in the formation AuroraB488 (Alexa488-SspB-AuroraB) to the membrane, being
of a polar GUV morphology as reflected in the centrosome saturated at moderate light-doses (Fig. 3a). This saturatable
positioning, increased MT length and GUV eccentricity (Fig. 2d). binding to C2-iLID limits maximally achievable SspB-AuroraB
This was analogous to the GUV morphology observed with high activity on the membrane and residual binding in the dark
tubulin (35–40 μM) alone (Fig. 1b). These results show that MT- determines the basal activity as compared to the lumen (Sup-
induced GUV morphology can be biochemically controlled by a plementary Fig. 3a–c). Therefore, low encapsulation efficiency of
signaling system that phosphorylates stathmin and thereby C2-iLID with cDICE was the limiting factor on controlling light-
reduces its capacity for tubulin sequestration. We therefore induced SspB-AuroraB translocation amplitude as well as the
reconstituted a signal actuation system based on light-induced main cause for variance in SspB-AuroraB translocation efficiency
stathmin-kinase translocation to GUV membranes. in different GUVs (Supplementary Fig. 3d, e).
4 NATURE COMMUNICATIONS | (2021)12:1548 | https://doi.org/10.1038/s41467-021-21679-2 | www.nature.com/naturecommunications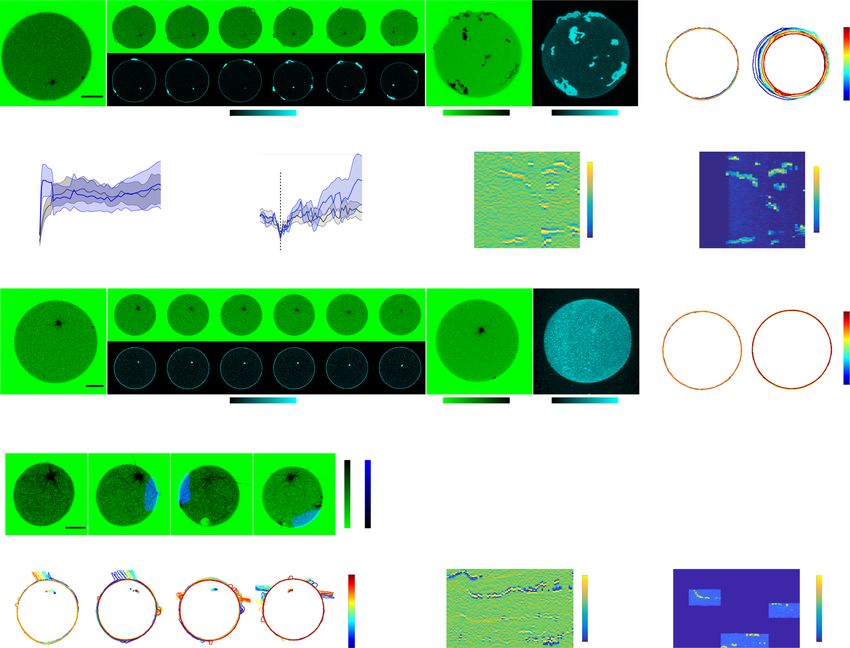
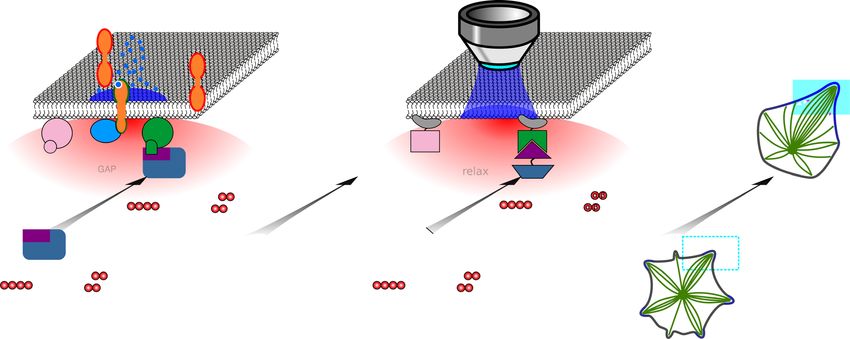
NATURE COMMUNICATIONS | https://doi.org/10.1038/s41467-021-21679-2                                                                 ARTICLE

   We next investigated if SspB-AuroraB translocation could be                  amplitude in the center of the irradiated area and prestimulus
localized to a 488 nm irradiated area on the GUV membrane. In                   levels on the opposite side of the GUV. SspB-AuroraB542 on the
order to also observe translocation outside irradiated membrane                 membrane reverted to prestimulus levels when the illumination
areas, as well as the kinetics of dissociation upon 488 nm light                was stopped (Fig. 3b, d). The ensuing gradient steepness therefore
removal, SspB-AuroraB542 was labeled with Atto542 (Atto542-                     results from a convolution of SspB-AuroraB dissociation rate
SspB-AuroraB, Methods), which could be excited separately from                  from C2-iLID in dark areas, and lateral diffusion of C2-iLID/
C2-iLID with 542 nm light. Continuous 488 nm light irradiation                  SspB-AuroraB on the membrane. These results demonstrate that
in a locally confined area resulted in a pronounced SspB-                        upon light irradiation, the C2-iLID/SspB-AuroraB system can
AuroraB542 translocation to that area within ~10 s. During                      mimic a spatially confined signaling response to a localized
further 488 nm illumination, a gradient became apparent along                   extracellular morphogen signal.
the membrane extending from the irradiated membrane region                         We also fused another protein, protein phosphatase lambda
that reached steady state after ~50 s. This gradient had a maximal              (PPλ), to SspB (SspB-PPλ). In this case, equivalent localized

NATURE COMMUNICATIONS | (2021)12:1548 | https://doi.org/10.1038/s41467-021-21679-2 | www.nature.com/naturecommunications                        5
ARTICLE                                                                   NATURE COMMUNICATIONS | https://doi.org/10.1038/s41467-021-21679-2

Fig. 3 Light-induced control of SspB-AuroraB membrane translocation and patterning. a Light-dose-dependent translocation of encapsulated SspB-
AuroraB488 (4.9 ± 0.9 μM) to C2-iLID (7 ± 4 10−1 pmol/cm2) on the membrane. Relative intensity normalized to 65 mW/cm2. Left: representative CLSM
fluorescence images (color bar: normalized fluorescence intensity), right: quantification (mean ± S.D., n = 5, n = 17 dark-binding: 0 on x-axis, approximated
by initial frame). See also Supplementary Fig. 3a, b. b Locally irradiated GUV (encapsulated: C2-iLID, SspB-AuroraB542). Normalized frames (left)
-connected with lines to fluorescence kymograph (middle, cyan-to-magenta boxes indicate time-averaged frames). X-axis: distance along membrane from
top; y-axis: time, dashed boxes: 488-nm-irradiated duration/position. Profiles top/next to kymograph are averaged time/space slices marked by colored
boxes (time: cyan-to-magenta; space: green-to-red). Fluorescence normalized to average intensity/frame. c Identical to b but with encapsulated C2-iLID
and SspB-PPλ647. d Peak normalized spatial profiles of last photo-recruitment frame for SspB-AuroraB542 (top, 7 GUVs, N = 3) and SspB-PPλ647 (bottom,
4 GUVs, N = 2). Colored horizontal lines: irradiation area. Box-plot: decay/µm of photo-recruitment from linear regression (left flank’s slope); datapoints
(dots), 25th and 75th percentile (blue box), min-max (whiskers), median (red line). e Representative translocated SspB-AuroraB488 (top left) or SspB-
PPλ647 fluorescence map (top right) in GUVs (color bar: normalized intensity). Middle: corresponding Lissamine-RhodamineB-PE fluorescence-
distribution. Bottom: cropped maps (white rectangular areas top row), excluding lipid irregularities apparent in middle row (methods). f Cluster-pattern
recurrence quantified by information entropy as function of luminal-protein-depletion (Supplementary Fig. 4a–d). Dark green: SspB-AuroraB488 with 2 mM
ATP, light green: without ATP, orange: SspB-PPλ647, red: information entropy upon numerical cluster-pattern randomization (n = 50, mean ± S.D.,
connected with dashed lines). g Cooperative clustering (CC) of SspB-AuroraB. Light (hν) induced SspB-AuroraB (blue triangles, red SspB) translocation
(curved black arrow) to C2-iLID (green squares) on membrane drives cluster formation (black arrows), amplified by a positive feedback mechanism (blue
arrow). h Scheme of the depletion model where CC causes depletion of SspB-AuroraB monomers on the membrane thereby generating cluster patterns.
Horizontal arrows: monomer-to-cluster interconversion. Angled arrow: CC mediates positive feedback. i Self-organized SspB-AuroraB pattern in 2D
Euclidean geometry from numerical simulations of the model in h. Color bar: normalized density of clustered SspB-AuroraB. Equations in Methods. See also
Supplementary Fig. 4e–h. Scale bars: 10 μm.

irradiation resulted in a half-as-steep gradient of the encapsulated           decreased the information entropy values above a threshold
SspB-PPλ647 (Alexa647-SspB-PPλ) in comparison to the one of                    translocation, whereas this was not the case for SspB-PPλ647
SspB-AuroraB542 (Fig. 3c, d), reverting to the basal state on the              (Fig. 3f). This shows that a positive feedback on SspB-AuroraB
same timescale upon switching off irradiation. A slow-down of                  cluster formation on the membrane together with monomer
diffusion by AuroraB oligomerization could therefore explain the               depletion underlies the self-organized regularity of the SspB-
steep steady state SspB-AuroraB gradient along the membrane                    AuroraB cluster patterns (Fig. 3g). The positive feedback is likely
upon local irradiation.                                                        a concentration dependent cooperative clustering (CC) mechan-
   We therefore investigated if SspB-AuroraB forms clusters on                 ism based on weak multivalent interactions among SspB-AuroraB
the membrane upon 488 nm irradiation by obtaining fluorescence                  monomers.
intensity membrane surface distributions from 3D confocal                         Simulations of the model of interconversion between clusters
micrographs of GUVs encapsulating iLID/SspB-AuroraB488                         and monomers at the membrane aided by the cooperative
(Fig. 3e). The SspB-AuroraB488 construct enabled simultaneous                  clustering effect on a 2D Euclidean grid with no-flux boundary
C2-iLID activation and SspB-AuroraB488 fluorescence visualiza-                  conditions showed the formation of SspB-AuroraB patterns
tion, thereby liberating spectral windows and was used in all                  (Fig. 3h, i, Methods). These self-organized patterns could be
further experiments. A trace amount of fluorescent Lissamine-                   generated above a threshold concentration of SspB-AuroraB on
RhodamineB-PE lipid was incorporated in the GUVs to verify if                  the membrane through a symmetry-breaking bifurcation (Sup-
lipid irregularities cause SspB-AuroraB clusters on the membrane.              plementary Fig. 4e). Given that a fixed amount of SspB-AuroraB
These irregularities coincided with large SspB-AuroraB patches                 is translocated to the membrane limited by the amount of
and were preferentially formed in the absence of ATP, indicating               available iLID; considering only the membrane-bound SspB-
that these were misfolded, inactive aggregates. However, outside               AuroraB species resulted in an equivalent transition to a
of these irregularities, small SspB-AuroraB488 clusters were                   patterned solution as when explicitly modeling the SspB-
formed on the membrane upon its light-induced translocation,                   AuroraB monomer translocation from the lumen (Supplementary
irrespective of ATP and therefore kinase activity. This clustering             Fig. 4f, g). Similarly as in the experiments, the stable self-
was a specific property of AuroraB and not of the iLID/SspB                     organized SspB-AuroraB cluster pattern (Fig. 3i) was character-
proteins, since it did not occur for encapsulated iLID/SspB-                   ized by high entropy values, which were decreased upon
PPλ647 upon 488 nm irradiation outside areas containing lipid                  randomization of the cluster distributions; in contrast to the
distribution irregularities (Fig. 3e; Supplementary Fig. 4a–c).                randomization at initial timepoints of the simulation, before the
   We next investigated if a self-organized process underlies the              pattern was stabilized (Supplementary Fig. 4h). The simulations
formation of SspB-AuroraB clusters on the membrane by                          thereby corroborate that the measured cluster regularities are
quantifying the regularity in SspB-AuroraB488 cluster distribu-                based on a self-organized process of self-amplified SspB-AuroraB
tions outside of the areas with lipid irregularities (Fig. 3e,                 clustering together with monomer depletion. Thus formally, the
Supplementary Fig. 4a, b). For this, we computed cluster-pattern               basic principle of self-organized dynamical transitions in the MT-
recurrences and quantified these by means of information                        membrane as well as the SspB-AuroraB signaling subsystem
entropy35 (Methods) (Fig. 3f; Supplementary Fig. 4d). The spatial              equivalently relies on self-amplification through substrate-
order of cluster distributions increased for higher SspB-                      depletion.
AuroraB488 recruitment on the membrane (coincident with
depletion from lumen), which did not occur for SspB-PPλ647                     A membrane-proximal stathmin phosphorylation cycle con-
(Fig. 3e, f; Supplementary Fig. 4c). This increase in spatial order            centrates free tubulin. In order to generate a synthetic signaling
was irrespective of ATP, showing that it was not driven by ATP                 system based on a stathmin (de)phosphorylation cycle, we
hydrolysis, but instead by the light-dependent dimerization of                 encapsulated stathmin together with SspB-AuroraB488 and PPλ.
iLID/SspB that determines the steady-state concentration of                    To first determine if this cycle can establish a steady-state
SspB-AuroraB on the membrane. Randomization of the spatial                     of stathmin phosphorylation, we measured kinetics of
localization of the SspB-AuroraB488 clusters significantly                      stathmin phosphorylation in solution by sequential addition of

6                  NATURE COMMUNICATIONS | (2021)12:1548 | https://doi.org/10.1038/s41467-021-21679-2 | www.nature.com/naturecommunications
NATURE COMMUNICATIONS | https://doi.org/10.1038/s41467-021-21679-2                                                                   ARTICLE

SspB-AuroraB488 and PPλ (Supplementary Table 1) in the pre-                     signaling systems as Synthetic Morphogenic Membrane System
sence of soluble tubulin (20 μM). Stathmin phosphorylation was                  (SynMMS). In SynMMS with a rigid membrane (iso-osmotic),
monitored using an organic dye-containing variant of the stath-                 light-induced SspB-AuroraB488 translocation (quantified relative
min phosphorylation FRET-sensor COPY18 (Atto532-stathmin-                       to the lumen: R, Methods), resulted in centrosome decentering
Atto655: COPYo (organic)) (Supplementary Fig. 5a, b). Ratio-                    (Fig. 5a–c, Supplementary Video 3), reflected in the enhanced
metric quantification of COPYo (10 μM) phosphorylation after                     Relative Centrosome Displacement (RCD, Fig. 5d, Methods) as
sequential addition of 2 μM SspB-AuroraB488 and 0.5 μM PPλ,                     compared to before translocation. The centrosome reverted to a
demonstrated that (de)phosphorylation cycles can maintain a                     central positioning upon light removal. Furthermore, quantifi-
steady-state phosphorylation level of stathmin (~20%) in the                    cation of SspB-AuroraB488 fluorescence as function of time in
presence of ATP in solution (Fig. 4a; Supplementary Fig. 5c). This              angular kymographs demonstrated speckles of SspB-AuroraB488
steady-state phosphorylation level of stathmin corresponds well                 fluorescence, which indicated that transient interactions of
with the ~16% as calculated from kinetic parameters obtained                    dynamic MTs with the membrane briefly enhanced SspB-
from stopped-flow experiments (Supplementary Fig. 5d, e, Sup-                    AuroraB488 clustering (Fig. 5e). However, in control SynMMSs
plementary Table 1), which shows that the higher overall                        with a rigid membrane that lacked stathmin (SynMMS-stat),
dephosphorylating activity of PPλ (kcat/KM: 22 103 s−1M−1)                      relative centrosome movement did not change upon light-
with respect to the overall phosphorylating activity (kcat/KM : 11              induced activation of SspB-AuroraB488 (Fig. 5d, Supplementary
102 s−1M−1) of SspB-AuroraB488 tends to maintain a low                          Fig. 7a–c), showing that stathmin is essential for coupling SspB-
pStathmin level in solution.                                                    AuroraB translocation to enhanced MT growth near the
   To next investigate if the SspB-AuroraB488 kinase translocation              membrane.
can increase the steady-state phosphorylation level of stathmin in                 On the other hand, in an osmotically strongly deflated
GUVs, we encapsulated COPYo (4 ± 0.8μM) together with the                       SynMMS (160 mOsm) with polar protrusions from a large aster,
iLID/SspB-AuroraB/PPλ cyclic signaling system ([SspB-Aur-                       light-induced translocation of SspB-AuroraB488 induced a net
oraB] = 5 ± 0.9 µM, [PPλ] = 5 ± 1 10−1 μM, estimated final con-                  astral-MT growth that drastically elongated and reoriented the
centration). FLIM-FRET measurements showed that COPYo was                       liposome (Fig. 5f–i, Supplementary Video 4). In this case
maintained in a mostly dephosphorylated steady state in the                     however, the SspB-AuroraB488 fluorescence kymograph demon-
lumen of GUVs in the presence of PPλ phosphatase activity                       strated that SspB-AuroraB488 accumulated in the main protru-
(Fig. 4b), in agreement with the estimated steady-state pStathmin               sions over time (Fig. 5j). Overall, this shows that the light-induced
level (~33%) obtained from kinetic parameters. Upon light-                      membrane-proximal tubulin concentration can induce MT
induced translocation of SspB-AuroraB488, a steep pStathmin                     growth and thereby induce a change in initial SynMMS
gradient (~0.5 µm decay length) could be observed by ratiometric                morphology.
FRET-imaging that emanated from the GUV membrane. This
gradient only occurred in the presence of PPλ (Fig. 4c, d;
                                                                                Initial morphological states of SynMMS are determined by
Supplementary Fig. 5f–i), showing that it was dynamically
                                                                                MT-density and basal signaling. SynMMS exhibited different
maintained by a (de)phosphorylation cycle (Fig. 4e). Further-
                                                                                initial morphologies, which could be divided in three general
more, 3D projections of ratiometric confocal stacks exhibited
                                                                                classes: in addition to a spherical morphology with small asters
bright spots indicating that stathmin phosphorylation on the
                                                                                and a polar protrusion morphology with large asters, a substantial
membrane is highest in discrete locations that most likely
                                                                                population exhibited a star-like morphology with axially dis-
originate from high-activity SspB-AuroraB clusters (Supplemen-
                                                                                tributed protrusions (Fig. 5k, Supplementary Fig. 7d). All pro-
tary Fig. 5j).
                                                                                trusions were enveloped by membrane without perforating the
   In order to understand how a dynamic (de)phosphorylation
                                                                                bilayer (Supplementary Fig. 7e). In some cases, SynMMSs
cycle of stathmin affects tubulin release from and sequestration
                                                                                incorporated small spherical structures, which were identified as
on stathmin, we simulated the interaction between tubulin and
                                                                                lipid vesicles (Supplementary Fig. 7f). The star morphology
stathmin with a reaction–diffusion model using measured
                                                                                hardly occurred for encapsulated asters alone with equivalent
enzymatic and association/dissociation parameters in a radial
                                                                                tubulin concentration (Fig. 5k, Methods). This indicates that
1D geometry (Supplementary Fig. 6a–k; Supplementary Table 1;
                                                                                basal SspB-AuroraB488 signaling from the membrane has a role in
Methods). This confirmed that recruiting SspB-AuroraB activity
                                                                                stabilizing protrusions such that star-like morphologies can be
to the membrane can locally overcome the luminal PPλ activity to
                                                                                generated. The polar as well as the star SynMMS were char-
yield a pStathmin gradient with a decay length comparable to the
                                                                                acterized by both, thin and large spiking protrusions (SPs) in
experimental observations (Fig. 4f). However, the numerical
                                                                                which several MTs converged into a single protrusion, char-
simulations also revealed that the release of tubulin from
                                                                                acteristic of SIC (Fig. 5l). We also found protrusions within which
phosphorylated stathmin results in a tubulin gradient (Fig. 4f;
                                                                                bundles of strongly bent MTs formed loops, supporting a pair of
Supplementary Fig. 6i, j). This steady-state gradient can only be
                                                                                membrane sheets around them, which we termed membrane
generated if dephosphorylation of stathmin establishes a tubulin
                                                                                sheet protrusions (MSPs, Fig. 5l). MSPs only occurred in
release/sequestration cycle, causing a flux of tubulin to the
                                                                                SynMMS, and not in the system with encapsulated asters alone,
membrane that is countered by its diffusional equilibration into
                                                                                indicating that basal signaling by SspB-AuroraB on the mem-
the lumen of the GUV (Fig. 4g). A signal-induced recruitment of
                                                                                brane is required for their formation. Furthermore, astral-MT
a kinase to the membrane thus leads to a dynamically maintained
                                                                                density as determined by the relative ratio of centrosomal tubulin
enhanced level of pStathmin as well as tubulin near the
                                                                                surface over GUV surface (Relative Centrosome Surface: RCS,
membrane.
                                                                                methods) was related to initial morphological states, increasing
                                                                                from spherical to polar to star (Fig. 5m). Thus, SspB-AuroraB
                                                                                basal signaling together with astral-MT density determines the
A light-responsive encapsulated microtubule aster-signaling
                                                                                type and distribution of protrusions on the membrane surface.
system. To test if the light-induced membrane-proximal tubulin
concentration can induce MT growth, we encapsulated the sig-
naling system together with tubulin647 (10% Alexa647-tubu-                      Light-induced de novo formation of membrane protrusions.
lin) and centrosomes in GUVs. We refer to encapsulated MT-                      To investigate if de novo membrane deformations can be formed by

NATURE COMMUNICATIONS | (2021)12:1548 | https://doi.org/10.1038/s41467-021-21679-2 | www.nature.com/naturecommunications                           7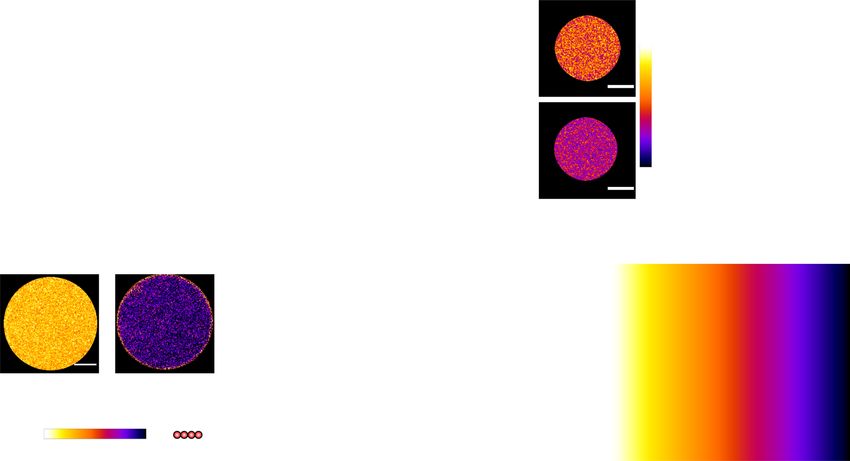
ARTICLE NATURE COMMUNICATIONS | https://doi.org/10.1038/s41467-021-21679-2
a b
SspB-AuroraB
P P
P P
P P
P stathmin P stathmin
PPO
D E D E
stathmin
D E D E D E D E
stathmin stathmin
3.66
+ SspB-AuroraB + PPO
0.42
3.36
3.48
3.34
W (ns)
0.41
3.29
3.32
W (ns)
ratio
3.30 3.10
0.40
3.28
2.91
3.26
0.39
0 10 20 30 40 50 SspB-AuroraB SspB-AuroraB
Time (min) + PPO w/o PPO
c d e
AuroraB
SspB
0.02
iLID
C2
+ PPO
w/o PPO
P
P
P
P stathmin
'ratio
0.01
PPO
SspB-AuroraB SspB-AuroraB D E
a b D b
w/o PPO + PPO stathmin
stathmin
0.00
0.46 0.28
P D E D E 0 1 2 3
P stathmin
P
P Distance (µm)
stathmin ratio
f g
gradient of pStathmin gradient of free tubulin
0.8 0.5 D E
Free tubulin fraction
kinase in lumen P
pStathmin fraction
D E
0.4
P
50 % kinase recruited 0.6 D E P
-1
D E P stathmin
kPPO (s ) 0.3 D E PPO
0.4
0.001 D E
0.005 0.2 D E
0.02 0.2
D E
0.1 0.1 D E D E D E
D E
0
0 1 2 3 4 0 1 2 3 4 stathmin
Distance (µm) Distance (µm)
ATP
Fig. 4 A light-inducible stathmin (de)phosphorylation cycle generates a membrane-proximal tubulin gradient. a Stathmin phosphorylation in solution
(20 µM tubulin, 2 mM ATP) measured by ratiometric imaging of FRET-sensor COPYo (10 µM). Enzyme-addition indicated by arrows (red: 2 µM SspB-
AuroraB; blue: 0.5 µM PPλ, final concentrations). See also Supplementary Fig. 5c. Top: cumulative scheme of establishing the (de)phosphorylation cycle.
Left, COPYo: stathmin conjugated to Atto532 (orange) and Atto655 (violet). Middle: phosphorylation by SspB-AuroraB (red arrow) releases αβ-tubulin
heterodimers (red circles), inducing conformational change that increases FRET efficiency. Right: PPλ dephosphorylates COPYo (blue arrow) closing the
cycle. b Average donor (Atto532) fluorescence lifetimes (τ) of COPYo (4 μM) in GUVs (40 ± 7 µM tubulin, 2 mM ATP, 5 ± 3 10−1 pmol/cm2 C2-iLID, 5 ±
1 μM SspB-AuroraB) with (orange, n = 10, 5 ± 1 10−1 μM) or without PPλ (purple, n = 10). Right: representative images (top: with, bottom: without PPλ,
color bar: τ in ns; lower τ: increased COPYo phosphorylation). Boxplots: individual GUV (diamond), 25th and 75th percentile (box), 1.5 interquartile range
(whiskers), median (line) and mean (square). c Representative COPYo ratiometric fluorescence-emission images after light-induced membrane
translocation of SspB-AuroraB. Maximum-intensity-projections of ratiometric 8-slice-confocal z-stacks; without (left), with PPλ (right). Color bar:
fluorescence-emission ratio with corresponding open and closed COPYo conformations. d Corresponding baseline-subtracted COPYo ratiometric profiles
(Δratio; mean ± S.E.M, with PPλ orange, n = 4; without: black, n = 6; Supplementary Fig. 5h–j). e Scheme of spatially segregated (de)phosphorylation cycle.
Translocated SspB-AuroraB (red-blue triangles) overcomes cytosolic PPλ (red circle) dephosphorylating activity. Phosphorylated stathmin diffuses away
from the membrane establishing a steady-state phospho-stathmin gradient (warm-to-cold colors) by homogenous PPλ activity. f 1D reaction–diffusion
simulations of stathmin phosphorylation (left) and free tubulin (right) yield gradients upon rebalancing (de)phosphorylation cycles by kinase translocation.
Profiles plotted before (kkin = 4 10−3 s−1, dashed lines) and after kinase-recruitment (50% translocation, kkin = 1 s−1, solid lines) for varying kPPλ
(Methods). g Stathmin (de)phosphorylation cycle maintains enhanced membrane-proximal tubulin concentration by SspB-AuroraB (red-blue triangles)
mediated release of tubulin (red circles) from pStathmin (dark gray arrow towards membrane), countered by tubulin diffusion (wavy arrows). Luminal PPλ
dephosphorylates pStathmin to rebind tubulin heterodimers, closing the ATP-driven tubulin-deposition cycle. Scale bars: 10 µm.
light-induced SspB-AuroraB488 translocation, spherical SynMMS SspB-AuroraB488 fluorescence signals (Fig. 6a, b, Supplementary
with low astral-MT density (RCS = 0.2–0.9) that were smaller than Video 5). The occurrence of MSPs and not SPs indicated that MT
the GUV were globally irradiated by 488 nm light. These asters were growth of single MTs or small bundles was strongly accelerated near
poorly visible against the background signal of fluorescent tubulin the membrane upon strong light-induced signaling. Although the
(Fig. 6a). Upon strong light-induced translocation of SspB- connection between astral-MTs and these MSPs was hardly visible
AuroraB488 (Fig. 6a, c), multiple isotropically distributed MSPs due to the high background of free tubulin (Fig. 6a), the enhanced
appeared at the membrane, exhibiting both tubulin647 as well as RCD after light-induced activation further demonstrated that these
8 NATURE COMMUNICATIONS | (2021)12:1548 | https://doi.org/10.1038/s41467-021-21679-2 | www.nature.com/naturecommunications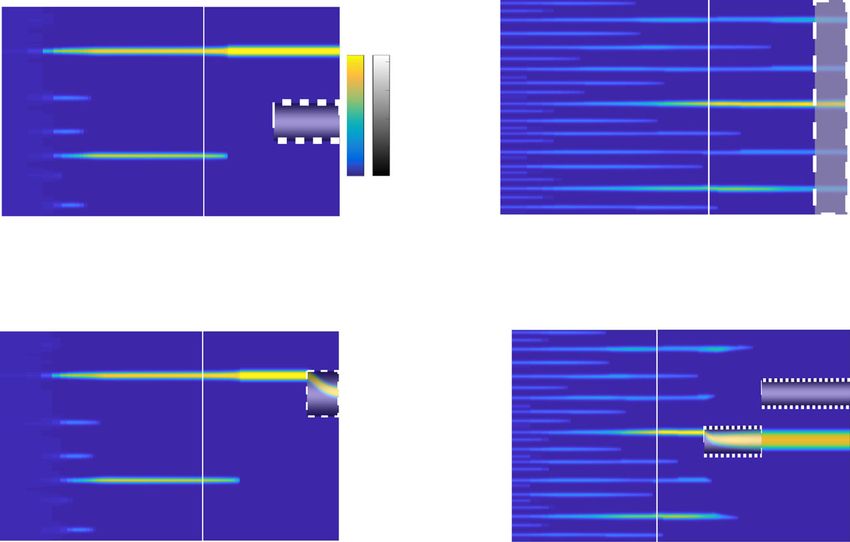
NATURE COMMUNICATIONS | https://doi.org/10.1038/s41467-021-21679-2 ARTICLE
a b
Before activation Activation Relaxation
-100 s 0s 80 s 180 s 270 s 410 s 510 s 630 s 0.5
0.4
R
0.3
7% 100%
0 51
0.2
0 150 300 450
Time (s)
c d e
488
Activation Relaxation SspB-AuroraB membrane intensity
0.6
Before activation Activation and Relaxation -150 100%
SynMMS
-90° -100
SynMMS-stat
0.4
Angle (°)
-50
RCD
0
time
+
0° 0.2 50
100
150 0%
0.0
90° 0 150 300 450 600 750 -100 0 150 300 450 600
Time (s) Time (s)
f 0s 24 s 80 s 130 s 230 s
g
0.11
0.10
0.09
R
0.08
0.07
0.06
0 50 100 150 200 250
0 21 2% 100% Time (s)
h i j
488
Before activation During activation Local membrane curvature SspB-AuroraB membrane intensity
0 0
270° 0.3 100%
90 90
Angle (°)
Angle (°)
1/µm
0°
time
180 180
270 270
90° -0.4 0%
360 360
-100 0 40 100 160 230 -100 0 40 100 160 230
Time (s) Time (s)
k l
Protrusion Types
100 1
Spherical
6 Polar Spiking Protrusion Membrane Sheet Protrusion
80 10 Star (SP) (MSP)
% of population
2
60 100%
5
37
40
14
2
20 8
2
0
SynMMS Enc. MT-aster SynMMS Enc. MT-aster
35±2 µM free Tub. 41±3 µM free Tub.
Small aster Polar Star 0%
m
-4
100% p = 3.07 x 10
p = 0.040
p = 0.244
4
RCS
2
0%
0
Spherical Polar Star
originated from astral-MTs (Fig. 6d). Quantification of membrane the membrane surface, which was coupled to centrosome move-
deformations as function of time in angular kymographs (Fig. 6e), ment (Fig. 6e). They strongly accumulated SspB-AuroraB488 as
as well as the analysis of the trajectory of these protrusions from the apparent from angular kymographs of SspB-AuroraB488 fluores-
corresponding overlay of fluorescence and transmission images cence and the 3D reconstruction of SynMMS after light-induced
(Supplementary Fig. 8a), showed that MSPs, once formed, were SspB-AuroraB488 translocation (Fig. 6a, f). Furthermore, the pre-
stable. These protrusions also exhibited directional movement on sence of MSPs was neither detected in SynMMS-stat (Fig. 6g, h,
NATURE COMMUNICATIONS | (2021)12:1548 | https://doi.org/10.1038/s41467-021-21679-2 | www.nature.com/naturecommunications 9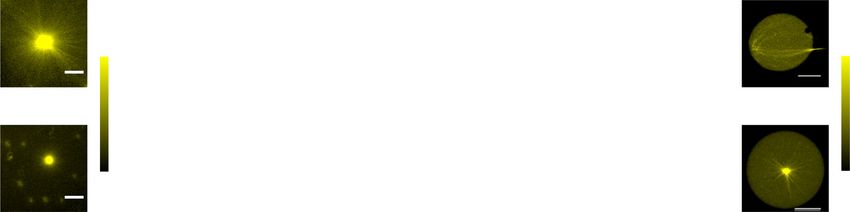
ARTICLE NATURE COMMUNICATIONS | https://doi.org/10.1038/s41467-021-21679-2
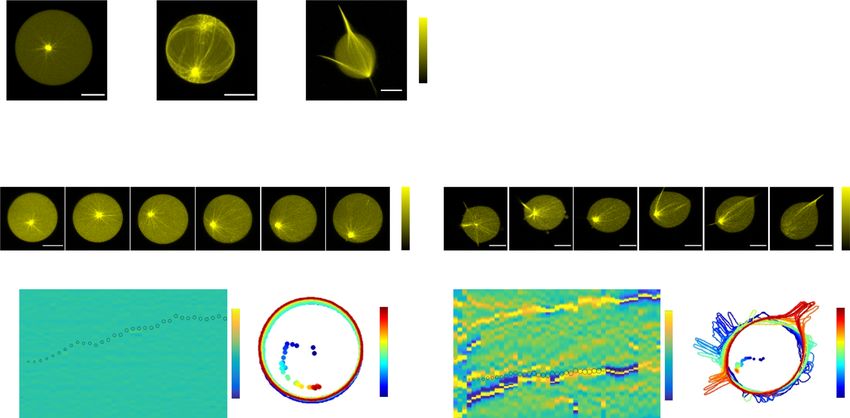
Fig. 5 Light-responsive encapsulated signaling system affects morphological states by regulating astral microtubule growth. a Selected images at
indicated times of CLSM time-lapse of normalized tubulin647 fluorescence (upper row, inverted green color bar) and corresponding SspB-AuroraB488
translocation (lower row, cyan color bar) of a SynMMS with a rigid membrane, before, during and after global 488 nm irradiation. b Corresponding SspB-
AuroraB488 translocation (R) during irradiation, and c SynMMS-contours and centrosome positions (dots), color coded by time. d Relative Centrosome
Displacement RCD (blue) of time-lapse represented in a compared to controls without stathmin (gray, mean ± S.E., 6 GUVs, N = 3; Supplementary
Fig. 7a–c). e Angular kymograph of SspB-AuroraB488 membrane fluorescence (color bar: normalized intensity) for SynMMS in a. f Selected images of
CLSM time-lapse of normalized tubulin647 fluorescence (upper row, inverted green color bar) and SspB-AuroraB488 translocation (lower row, cyan color
bar) of a SynMMS with a deformable membrane during global 488 nm irradiation. Maximum-intensity-projections of tubulin647 fluorescence z-stack
before (left), and after (right) 488 nm irradiation. g Corresponding SspB-AuroraB488 translocation (R) and, h contours and centrosome positions (dots),
color coded by time. i Angular membrane curvature kymograph overlaid with centrosome position (small circle: centered, large circle: membrane
proximal). Color bar: inverse radius (1/µm) of an inscribed circle (Methods). Global 488 nm irradiation starts at t = 0 s (dashed box). j Corresponding
angular kymograph of SspB-AuroraB488 membrane fluorescence (color bar: normalized intensity). k Occurrence frequency of three stable morphologies
(Spherical, Polar, Star; number of GUVs given in the bars) for SynMMS and encapsulated microtubule (MT)-asters with a deformable membrane for two
estimated free-tubulin concentrations (methods). Representative morphologies shown below (inverted green color bar: normalized tubulin647 fluorescence
intensity). l Representative MT-induced protrusion types in SynMMS (inverted green color bar: normalized fluorescence intensity). m Relative centrosome
surface (RCS) distributions for the three stable morphologies. Boxplots: RCS of individual GUV (diamond), 25th and 75th percentile (box), min-max
(whiskers), median (line) and mean (square). p-values from two-sample Kolmogorov–Smirnov test with 95% confidence interval. Tubulin647 fluorescence
images were enhanced by histogram equalization, directional filtering and unsharp masking (methods). SspB-AuroraB488 translocation images were
corrected for luminal fluorescence contribution (methods). Scale bars: 10 μm.
Supplementary Fig. 8b, Supplementary Video 5), nor was there as well as the star SynMMS (Fig. 7e, g, h). Step-wise increasing
an increase in the RCD after light-induced translocation of the light dose further enhanced this recruitment in the pre-
SspB-AuroraB488 (Fig. 6d), which confirms that stathmin is essen- formed protrusions, visibly coinciding with increased astral-MT
tial for enhancing astral-MT growth near the membrane. In growth (Fig. 7a, e). The resulting net force on the centrosome
SynMMS-stat SspB-AuroraB cluster patterns could be observed, pushed it to the periphery in both SynMMS (Fig. 7a, b, e, f), also
exhibiting little or no aggregation (Supplementary Fig. 8c). reflected in the enhanced RCD as compared to control
To investigate if membrane protrusions could be specifically SynMMS-stat (Fig. 7i). This light-induced MT growth induced a
generated in locally irradiated areas, we consecutively irradiated global morphological change from a star to a spherical
opposed areas of a slightly elliptical SynMMS with a sparsely SynMMS shape with cortical MT bundles (Fig. 7e, f), whereas
populated aster (RCS = 0.90) (Fig. 6i). Local irradiation on the the growth of MTs in the main protrusion of the polar SynMMS
right side resulted in strong SspB-AuroraB488 translocation did not change its morphology (Fig. 7a, b). A gradual broad-
(Fig. 6k) that triggered amplified growth of astral-MTs that bent ening of the main protrusion due to the enhanced signaling by
as they deformed the membrane and caused a stable MSP (Fig. 6i, SspB-AuroraB488 was observed that occurred mostly from the
j, l) that accumulated SspB-AuroraB488 (Fig. 6m). The resulting neck of the protrusion in which the membrane has a negative
membrane deformation eventually enabled the capture of other curvature (Fig. 7a) and unlimited diffusional access to the
dynamic MTs that evolved to a spiking protrusion after the lumen. Such geometry transiently increases membrane
irradiation was switched to the other side. The irradiation on the recruitment upon irradiation8,36. In addition, increased mem-
opposite side also induced the formation of MSPs that similarly brane recruitment inside protrusions (Fig. 7e, SspB-AuroraB488
enabled the subsequent capture of astral-MTs resulting in a long panel) likely relies on weak interactions between MTs and
dynamic SP after switching the irradiated area to the lower SspB-AuroraB on the membrane, causing an effective slow-
part (Fig. 6i, j). In this third area, no stable protrusions were down of its lateral diffusion. The resulting increase in clustering
visible, indicating that most MTs were already redirected to the combined with the limited amount of stathmin and PPλ within
previously irradiated areas (Supplementary Video 6). In con- the protrusions, further strengthen the amplitude of the tubulin
trast, a morphologically analogous control without stathmin gradient (Supplementary Fig. 8i). Taken together, a positive
(SynMMS-stat) did not form protrusions in any of the sequentially feedback between MT-induced membrane deformation and
irradiated areas (Supplementary Fig. 8d–h). SspB-AuroraB recruitment occurs at the membrane that rein-
These experiments show that de novo protrusions can be forces and stabilizes the growth of otherwise dynamically
formed from low density MT-asters upon strong light-induced instable MTs within protrusions (Fig. 8a).
translocation of SspB-AuroraB. However, the low density of
astral-MTs together with their accelerated growth near the A generic theoretical description of the bidirectional interac-
membrane, favors MSP over SIC-mediated SP formation. tion between signaling and MT-membrane systems. To inves-
tigate which of the experimentally identified inter- and
Reciprocal coupling of SspB-AuroraB signaling and MT self- intrasystem links (Fig. 8a) dictate the formation of initial star or
induced capture in membrane deformations. Since we observed polar morphologies and to which extent these determine the
that SspB-AuroraB was recruited to de novo generated MT- response to morphogen signals, we numerically analyzed the
induced membrane deformations, we next addressed if SspB- dynamics of the coupled MT-membrane/SspB-AuroraB system
AuroraB recruitment preferentially occurs in preformed pro- (Eq. 24, Methods). As discussed above, the behavior of each
trusions. For this, we measured SspB-AuroraB488 recruitment subsystem could be equivalently described through a
as function of light dose in both, a polar SynMMS with a strong reaction–diffusion model, where self-amplification of local
SIC protrusion (Fig. 7a–d), as well as a star-like SynMMS with structures (SIC: Fig. 1f; CC: Fig. 3h) causes the depletion of their
preformed MSPs and SPs (Fig. 7e–h). In addition to the light- constituents (free MTs or AuroraB monomers) (Fig. 8a). An
induced recruitment of SspB-AuroraB488 to the membrane, a important intersystem link between membrane deformation and
stronger recruitment to the preformed protrusions could be SspB-AuroraB clustering (Fig. 8a, lower arrow) was revealed by
observed at the lowest light dose in both the polar (Fig. 7a, c, d) the enhanced SspB-AuroraB cluster formation in preformed
10 NATURE COMMUNICATIONS | (2021)12:1548 | https://doi.org/10.1038/s41467-021-21679-2 | www.nature.com/naturecommunicationsNATURE COMMUNICATIONS | https://doi.org/10.1038/s41467-021-21679-2 ARTICLE
a b
32 s 36 s 60 s 120 s 140s 250 s
Before activation During activation
-90°
time
0°
0 60 0% 100% 0% 100% 90°
c d e f
0.4 -stat Local membrane curvature SspB-AuroraB488 membrane intensity
Control (SynMMS
-stat
) Control (SynMMS )
0.3
SynMMS SynMMS -150 -150 100%
0.6
-100 -100
Angle (°)
Angle (°)
-50 -50
0.2
RCD
1/µm
0.4
R
0 0
50 50
100 100
0.2
0.0 150 150 0%
-0.4
0 100 200 300 0 200 400 -100 0 40 140 240 -100 0 40 140 240
Time (s) Time (s) Time (s) Time (s)
g h
0s 36 s 120 s 210 s 300 s 390 s Before activation During activation
-90°
(SynMMS-stat)
Control
time
0°
90°
0 60 0% 100% 0% 100%
i k
SynMMS 0.45
Before activation During activation 0.40
-100 s 20 s 270 s 412 s 100% 22.5 0.35
0.30
0.25
R
0.20
0.15
0.10
0.05
0 100 200 300 400 500 600 700
0% 0 Time (s)
j l Local membrane curvature m SspB-AuroraB488 membrane intensity
-90° -100 0.3 -100 100%
-50 -50
Angle (°)
Angle (°)
0 0
1/µm
time
0° 50 50
100 100
150 150
200 200
-0.4 0%
90°
-100 0 40 140 180 280 380 420 520 -100 0 40 140 180 280 380 420 520
Time (s) Time (s)
Fig. 6 Light-induced de novo formation of astral-MT-membrane protrusions. a Selected images at indicated times of CLSM time-lapse of normalized
tubulin647 fluorescence (upper row, inverted green color bar) and SspB-AuroraB488 translocation (lower row, cyan color bar) of SynMMS with a small MT-
aster during global 488 nm irradiation. Maximum-intensity projections of tubulin647 and SspB-AuroraB488 fluorescence z-stack before (left), and after
(right) irradiation. b Corresponding contours and centrosome positions (dots), color coded by time. c SspB-AuroraB488 translocation (R) for SynMMS with
small asters as in a (blue, mean ± S.E.M, 3 GUVs, N = 3) compared to SynMMS-stat (gray, mean ± S.E.M., 13 GUVs, N = 5), during 488 nm irradiation.
d Corresponding Relative Centrosome Displacement (RCD). e Angular membrane curvature kymograph overlaid with centrosome position (small circle:
centered, large circle: membrane proximal). Color bar: inverse radius (1/µm) of an inscribed circle (Methods). Irradiation starts at t = 0 s (dashed box).
f Corresponding angular kymograph of SspB-AuroraB488 membrane fluorescence (color bar: normalized intensity). Red and magenta arrowheads: initial
position of protrusions that migrate (dashed lines) over the GUV surface (Supplementary Fig. 8a). g Images of CLSM time-lapse as in a for a SynMMS-stat
control, and h corresponding contours and centrosome positions, before and during activation (Supplementary Fig. 8b, c). i Selected images at indicated
times of CLSM time-lapse of normalized tubulin647 fluorescence (inverted green color bar) overlaid with SspB-AuroraB488 translocation (blue color bar)
before and during multiple local irradiation phases with 488 nm light of a SynMMS with a sparse aster. j Corresponding contours and centrosome position
for each phase color coded by time (rectangles: irradiation areas), and k SspB-AuroraB488 translocation (R) (dashed lines: change of irradiation phase).
l Angular membrane curvature kymographs overlaid with centrosome position as in e. Local irradiation (dashed rectangles) starts at t = 0, arrowheads:
protrusions marked in i. m Corresponding angular kymograph of SspB-AuroraB488 membrane fluorescence (color bar: normalized intensity). See also
Supplementary Fig. 8d-h. Tubulin647 fluorescence images were enhanced by histogram equalization, directional filtering and unsharp masking (methods).
SspB-AuroraB488 translocation images were corrected for luminal fluorescence contribution (methods). Scale bars: 10 μm.
MT-induced membrane deformations (Fig. 7). The reverse generated, depending on which intrasystem feedbacks are
intersystem link between SspB-AuroraB clusters and protrusion dominant.
growth (Fig. 8a, upper arrow) is given by the tubulin gradient The numerical simulations demonstrated that strong SIC
induced MT growth (Fig. 5a–j). These interacting subsystems (γ1) relative to CC (γ2) generated a self-organized polar state
thereby form a single dynamical system that can be analyzed (Fig. 8b, top, Supplementary Fig. 9d, f). In contrast, if CC is
with a reaction–diffusion model in a simplified 1D circular dominant over SIC, a pattern with multiple MT bundles (star-
geometry (as in Fig. 1g). The coupled system formally breaks like) was stabilized (Fig. 8c, top, Supplementary Fig. 9e). This
symmetry above a threshold of total SspB-AuroraB for a given could not be obtained under weak CC, even for a strong
MT amount (Supplementary Fig. 9a, b), and the symmetry- intersystem link of MT-induced membrane deformation
broken solution is stable in a wide parameter range (Supple- promoting SspB-AuroraB clustering (Supplementary Fig. 9g).
mentary Fig. 9c). Different initial states of the full system can be This corroborates the role of basal SspB-AuroraB recruitment
NATURE COMMUNICATIONS | (2021)12:1548 | https://doi.org/10.1038/s41467-021-21679-2 | www.nature.com/naturecommunications 11You can also read