Mid-Holocene Antarctic sea-ice increase driven by marine ice sheet retreat - CP
←
→
Page content transcription
If your browser does not render page correctly, please read the page content below
Clim. Past, 17, 1–19, 2021
https://doi.org/10.5194/cp-17-1-2021
© Author(s) 2021. This work is distributed under
the Creative Commons Attribution 4.0 License.

Mid-Holocene Antarctic sea-ice increase driven by
marine ice sheet retreat
Kate E. Ashley1 , Robert McKay2 , Johan Etourneau3,6 , Francisco J. Jimenez-Espejo3,4 , Alan Condron5 , Anna Albot2 ,
Xavier Crosta6 , Christina Riesselman7,8 , Osamu Seki9 , Guillaume Massé10 , Nicholas R. Golledge2,11 ,
Edward Gasson12 , Daniel P. Lowry2,11 , Nicholas E. Barrand1 , Katelyn Johnson2,11 , Nancy Bertler2,11 ,
Carlota Escutia3 , Robert Dunbar13 , and James A. Bendle1
1 School   of Geography, Earth and Environmental Sciences, University of Birmingham, Edgbaston, Birmingham, B15 2TT, UK
2 Antarctic   Research Centre, Victoria University of Wellington, Wellington 6140, New Zealand
3 EPHE/PSL Research University, 4-14 rue Ferrus, 75014 Paris, France
4 Department of Biogeochemistry, Japan Agency for Marine-Earth Science and Technology (JAMSTEC),

Yokosuka 237-0061, Japan
5 Department of Geology and Geophysics, Woods Hole Oceanographic Institution, Woods Hole, MA 02543, USA
6 UMR 5805 EPOC, Université de Bordeaux, CNRS, EPHE, 33615 Pessac, France
7 Department of Geology, University of Otago, Dunedin 9016, New Zealand
8 Department of Marine Science, University of Otago, Dunedin 9016, New Zealand
9 Institite of Low Temperature Science, Hokkaido University, Sapporo 060-0819, Hokkaido, Japan
10 TAKUVIK, UMI 3376 UL/CNRS, Université Laval, 1045 avenue de la Médecine, Quebec City, Quebec, G1V 0A6, Canada
11 GNS Science, Avalon, Lower Hutt 5011, New Zealand
12 School of Geographical Sciences, University of Bristol, Bristol, BS8 1RL, UK
13 Department of Environmental Earth Systems Science, Stanford University, Stanford, A 94305, California, USA

Correspondence: James A. Bendle (j.bendle@bham.ac.uk)

Received: 16 January 2020 – Discussion started: 26 February 2020
Revised: 15 October 2020 – Accepted: 16 October 2020 – Published: 5 January 2021

Abstract. Over recent decades Antarctic sea-ice extent has           waters and sea-ice growth that slowed basal ice shelf melting.
increased, alongside widespread ice shelf thinning and fresh-        Incorporating this feedback mechanism into global climate
ening of waters along the Antarctic margin. In contrast, Earth       models will be important for future projections of Antarctic
system models generally simulate a decrease in sea ice. Cir-         changes.
culation of water masses beneath large-cavity ice shelves is
not included in current Earth System models and may be a
driver of this phenomena. We examine a Holocene sediment
core off East Antarctica that records the Neoglacial transi-         1   Introduction
tion, the last major baseline shift of Antarctic sea ice, and part
of a late-Holocene global cooling trend. We provide a multi-         Ice shelves and sea ice are intrinsically linked and repre-
proxy record of Holocene glacial meltwater input, sediment           sent fundamental components of the global climate system,
transport, and sea-ice variability. Our record, supported by         impacting ice sheet dynamics, large-scale ocean circulation,
high-resolution ocean modelling, shows that a rapid Antarc-          and the Southern Ocean biosphere. Antarctic ice shelves with
tic sea-ice increase during the mid-Holocene (∼ 4.5 ka) oc-          large sub-shelf cavities (e.g. Ross, Filchner–Ronne) play a
curred against a backdrop of increasing glacial meltwater            key role in regional sea-ice variations, by cooling and fresh-
input and gradual climate warming. We suggest that mid-              ening surface ocean waters for hundreds of kilometres be-
Holocene ice shelf cavity expansion led to cooling of surface        yond the ice shelf edge (Hellmer, 2004; Hughes et al., 2014).
                                                                     Antarctic sea ice has expanded over the past few decades,

Published by Copernicus Publications on behalf of the European Geosciences Union.
2                                                                   K. E. Ashley et al.: Mid-Holocene Antarctic sea-ice increase

particularly in the western Ross Sea region (Turner et al.,
2016), alongside widespread thinning of ice shelves (Paolo et
al., 2015) and freshening along the Antarctic margin (Jacobs
et al., 2002; Aoki et al., 2013). The drivers and feedbacks
involved in these decadal trends are still poorly understood,
hampered by the sparse and short-term nature of meteorolog-
ical, oceanographic and glaciological observations (Jones et
al., 2016), and thus establishing the long-term trajectory for
East Antarctic sea ice on the background of accelerated ice
sheet loss remains a challenge. Marine sediment cores pro-
vide a longer-term perspective and highlight a major base-
line shift in coastal sea ice at ∼ 4.5 ka (Steig et al., 1998;
Crosta et al., 2008; Denis et al., 2010), which characterizes
the mid-Holocene “Neoglacial” transition in the Antarctic. A
mechanistic driver for this climate shift currently remains un-
resolved, but we propose that two interrelated aspects of the
last deglaciation are significantly underrepresented in cur-
rent models of this transition: (i) the retreat of grounded ice
sheets from the continental shelves of Antarctica, and (ii) the
subsequent development of large ice shelf cavities during            Figure 1. Location of sites U1357 and MD03-2601 (blue dots). The
the Holocene. Both factors would significantly alter water           ice sheet grounding line formed a calving-bay environment (dashed
mass formation on Antarctica’s continental shelves, which            white line) prior to 11.4 ka, but since at least 8.2 ka Antarctic Sur-
today are major source regions of Antarctic Bottom Water             face Water flow is largely advected from the Ross Sea (blue line).
(AABW) and Antarctic Surface Water (AASW). These in-                 The inset map shows the pathway of freshwater (dark blue) after
terrelated processes are underrepresented in coupled ocean–          1 year of 1 Sv meltwater released from along the edge of the Ross
                                                                     Ice Shelf in a model simulation.
atmosphere models, which currently do not simulate the tim-
ing, magnitude, and rapid onset of the Neoglacial (see the
Supplement).
                                                                     2     Materials and methods
   Integrated Ocean Drilling Program (IODP) Expedition
318 cored a 171 m thick deposit of laminated diatomaceous
                                                                     2.1     Organic geochemical analyses
ooze at Site U1357 offshore Adélie Land (Fig. 1) deposited
over the past 11 400 years. Here, we present a new Holocene          2.1.1    Fatty acid extraction
record of glacial meltwater, sedimentary input, and local sea-
ice concentrations from Site U1357 using compound-specific           Lipid extraction of sediment samples was performed at
hydrogen isotopes of fatty acid biomarkers (δ 2 HFA ), terrige-      the Royal Netherlands Institute for Sea Research (NIOZ).
nous grain size (mud percent, sorting), natural gamma ra-            Freeze-dried and homogenized samples were extracted by
diation, biogenic silica accumulation, highly-branched iso-          Dionex™ accelerated solvent extraction (DIONEX ASE
prenoid alkenes (HBIs), and Ba/Ti ratios (Figs. 4 and 5).            200) using a mixture of dichloromethane (DCM)/methanol
   We interpret δ 2 HFA (Fig. 4a) fluctuations in Adélie Drift       (MeOH) (9 : 1, v/v) at a temperature of 100 ◦ C and a pres-
sediments as a record of meltwater input from isotopically-          sure of 7.6 × 10⁶ Pa (Kim et al., 2010).
depleted glacial ice. Antarctic glacial ice is highly depleted in        Compound separation was undertaken at University of
2 H compared to ocean water, thus creating highly contrasting        Glasgow, UK. The total lipid extract was separated over an
endmember values for the two major H source pools. Grain             aminopropyl silica gel column and the total acid fraction
size, natural gamma radiation (NGR), and terrigenous and             was eluted into an 8 mL vial with 4 % acetic acid in ethyl-
biosiliceous mass accumulation rates (MARs) reflect chang-           ether solution (Huang et al., 1999). Derivatization to fatty
ing sediment delivery either driven via local glacial meltwa-        acid methyl esters was achieved by adding 200 µL of MeOH
ter discharge or advection of suspended sediment by oceanic          containing 14 % v/v boron trifluoride to the 8 mL vial con-
currents. The diene/triene HBI ratio is used as a proxy for          taining the total acid fraction (TAF). Fatty acid methyl esther
coastal sea-ice presence (Massé et al., 2011). Ba/Ti enrich-         (FAMES) were recovered and cleaned up by eluting through
ment is considered to reflect enhanced primary productivity.         a pre-cleaned 3 cm silica gel column (60 A; 35–70) with
These records allow a unique opportunity to reconstruct the          4 mL of hexane and 4ml of DCM (containing the FAMES).
magnitude of the coupled response of the ocean and ice sheet         δ 2 H values indicate depletion against the international stan-
during the Neoglacial transition. Details on all proxies and         dards: Vienna Pee Dee Belemnite (V-PDB) is the standard for
associated uncertainties can be found in Sect. S2 of the Sup-        δ13C, and Vienna Standard Mean Ocean Water (V-SMOW)
plement.                                                             is the standard for δ 2 H.

Clim. Past, 17, 1–19, 2021                                                                    https://doi.org/10.5194/cp-17-1-2021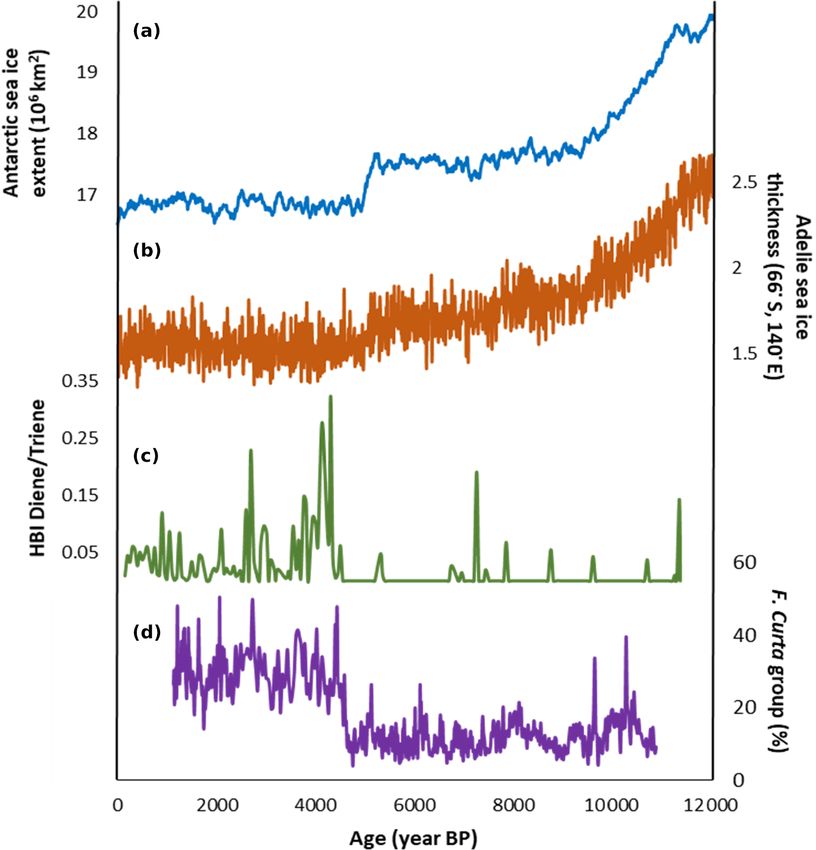
K. E. Ashley et al.: Mid-Holocene Antarctic sea-ice increase                                                                  3

2.1.2    Fatty acid hydrogen isotope analysis                     over undisturbed sediment sections. The bulk major ele-
                                                                  ment composition included in this study was measured be-
Compound-specific hydrogen isotope analyses of FAMES
                                                                  tween sections U1357B-1H-2 to U1357-19H-5 continuously
were performed at the Institute of Low Temperature Sci-
                                                                  each 50 cm. We used an Avaatech X-ray fluorescence (XRF-
ence, Hokkaido University. δ 2 H values were obtained using
                                                                  Scanner) core scanner at the IODP-Core Repository/Texas
a CS-IRMS system with a HP 6890 gas chromatograph and a
                                                                  A&M University laboratories (USA) during December 2010.
ThermoQuest Finnigan MAT Delta Plus XL mass spectrom-
                                                                  Non-destructive XRF core-scanning measurements were per-
eter (MS). Separation of the FAMES was achieved with a
                                                                  formed over a 1 cm2 area with slit size of 10 mm, a current of
HP-5 MS fused silica capillary column (30 m × 0.32 mm i.d.,
                                                                  0.8 mA, and sampling time of 45 s at 10 kV in order to mea-
film thickness of 0.25 µm) with a cooled on-column injec-
                                                                  sure the relative content of titanium (Ti) and barium (Ba).
tor. An n-alkane and a reference gas whose isotopic values
                                                                     Field emission scanning electron microscopy (FESEM)
were known was co-injected with the samples as an inter-
                                                                  images and corresponding spectrum were obtained with an
nal isotopic standard for δ 2 H. A laboratory-standard (Mix
                                                                  AURIGA FIB-FESEM Carl Zeiss SMT at Centro de Instru-
F8 of FAMES from Indiana University) containing C10 –
                                                                  mentación Científica, Granada University, Spain
C30 FAMES was analysed daily to check the accuracy and
the drift of the instrument and to normalize the data to the
SMOW-SLAP isotopic scale. The H3+ factor was measured             2.3   Grain size analyses
every 3 d.                                                        A total of 341 samples were prepared for grain size analy-
                                                                  sis. Samples were treated for removal of biogenic opal with
2.1.3    HBIs                                                     a 1 M sodium hydroxide NaOH solution and incubated in a
                                                                  water bath at 80 ◦ C for 24 h. This procedure was repeated
Highly branched isoprenoid (HBI) alkenes were extracted
                                                                  twice due to an incomplete dissolution of diatoms observed
at Laboratoire d’Océanographie et du Climat: Experimenta-
                                                                  in smear slides. The samples were then treated with H2 O2
tions et Approches Numériques (LOCEAN), separately from
                                                                  to remove organic material at 80 ◦ C for 24 h. Samples were
the fatty acids, using a mixture of 9 mL CH2 Cl2 /MeOH
                                                                  measured using a Beckman Coulter LS 13 320 Laser Diffrac-
(2 : 1, v : v) to which 7 hexyl nonadecane (m/z 266) was
                                                                  tion Particle Size Analyser (LPSA). Prior to grain size analy-
added as an internal standard, following the Belt et al. (2007)
                                                                  sis, ∼ 30 mL of 0.5 g/L Calgon (sodium hexametaphosphate)
and Massé et al. (2011) protocols. Several sonication and
                                                                  was added to the samples and sonicated and stirred in order
centrifugation steps were applied in order to properly extract
                                                                  to disperse the grains and prevent clumping.
the selected compounds (Etourneau et al., 2013). After dry-
ing with N2 at 35 ◦ C, the total lipid extract was fractionated
over a silica column into an apolar and a polar fraction us-      2.4   Biogenic silica
ing 3 mL hexane and 6 mL CH2 Cl2 /MeOH (1 : 1, v : v), re-        Biogenic silica concentrations (wt % BSi) were measured on
spectively. HBIs were obtained from the apolar fraction by        349 discrete samples using a molybdate blue spectrophoto-
the fractionation over a silica column using hexane as elu-       metric method modified from (Strickland and Parsons, 1970;
ent following the procedures reported by Belt et al. (2007)       DeMaster, 1981). Analytical runs included replicates from
and Massé et al. (2011). After removing the solvent with          the previous sample group and from within the run, and each
N2 at 35 ◦ C, elemental sulfur was removed using the TBA          run was controlled by 10 standards and a blank with dis-
(Tetrabutylammonium) sulfite method (Jensen et al., 1977;         solved silica concentrations ranging from 0 to 1200 µM. For
Riis and Babel, 1999). The obtained hydrocarbon fraction          each analysis, ∼ 7 mg of dry, homogenized sediment was
was analysed within an Agilent 7890A gas chromatograph            leached in 0.1M NaOH at 85 ◦ C, and sequential aliquots were
(GC) fitted with 30 m fused silica Agilent J&C GC column          collected after 2, 3, and 4 h. Following addition of reagents,
(0.25 mm i.d., 0.25 µm film thickness), coupled to an Agilent     absorbance of the 812 nm wavelength was measured using a
5975C Series mass selective detector (MSD). Spectra were          Shimadzu UV-1800 spectrophotometer. Dissolved silica con-
collected using the Agilent MS-Chemstation software. Indi-        centration of each unknown was calculated using the stan-
vidual HBIs were identified on the basis of comparison be-        dard curve, and data from the three sampling hours were
tween their GC retention times and mass spectra with those        regressed following the method of DeMaster (1981) to cal-
of previously authenticated HBIs (Johns et al., 1999) using       culate wt % BSi. In our U1357B samples, wt % BSi ranges
the Mass Hunter software. Values are expressed as concen-         from maximum of ∼ 60 % in early and mid-Holocene light
tration relative to the internal standard.                        laminae to a minimum of 31 % in late Holocene dark lam-
                                                                  inae. The average standard deviation of replicate measure-
2.2     Inorganic geochemical analysis and electronic             ments is 0.5 %.
        microscopy
Major element concentrations were obtained using X-Ray
Fluorescence Scanner on 412 analyses measured directly

https://doi.org/10.5194/cp-17-1-2021                                                               Clim. Past, 17, 1–19, 2021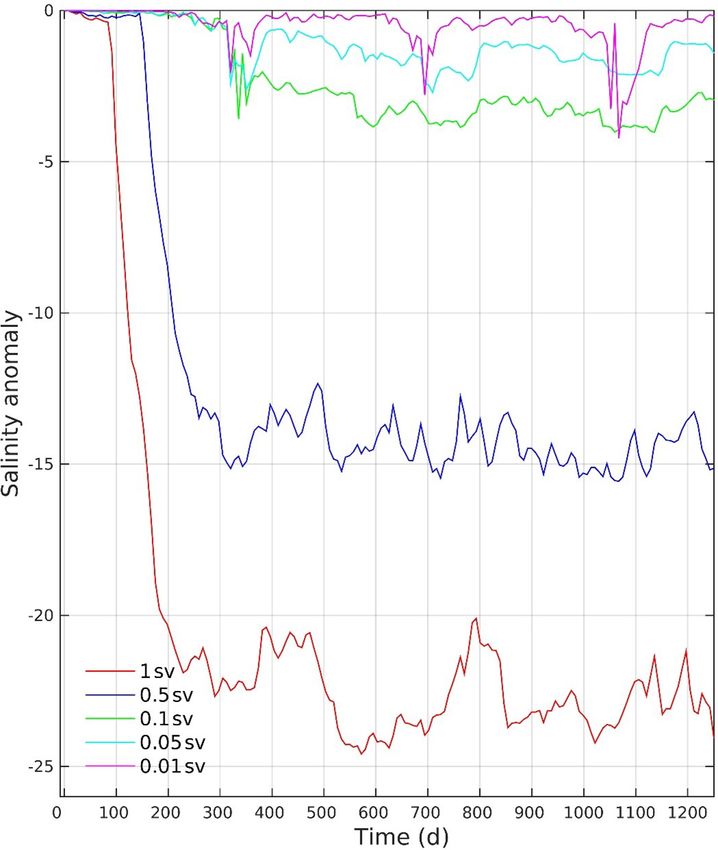
4                                                                   K. E. Ashley et al.: Mid-Holocene Antarctic sea-ice increase

2.5    Model simulations                                             ther east lays the Adélie Depression and the Mertz Bank, the
                                                                     latter located north of the Mertz Glacier floating ice tongue.
All numerical calculations were performed using the Mas-             The Adélie Land region is dissected by several glaciers that
sachusetts Institute of Technology general circulation model         could potentially contribute terrigenous sediment into the
(MITgcm) (Marshall et al., 1997): a three-dimensional,               coastal zone with the core site located 40 km to the north
ocean sea ice, hydrostatic, primitive equation model. The            of the Astrolabe Glacier and ca. 75 and 300 km northwest of
experiments presented here were integrated on a global do-           the Zélée and Mertz glaciers, respectively.
main projected onto a cube–sphere grid to permit a relatively           The site itself is located within the Dumont d’Urville
even grid spacing and to avoid polar singularities (Adcroft          polynya (DDUP), which has a summer (winter) extent of
et al., 2004; Condron and Winsor, 2012). The ocean grid              13 020 km2 (920 km2 ) but is also directly downwind and
has a mean, eddy-permitting, horizontal grid spacing of 1/6◦         downcurrent of the much larger and highly productive Mertz
(18 km) with 50 vertical levels ranging in thickness from            Glacier polynya (MGP) to the east, with a summer (win-
10 m near the surface to approximately 450 m at the max-             ter) extent of 26 600 km2 (591 km2 ) (Arrigo and van Dijken,
imum model depth. The ocean model is coupled to a sea-               2003). The MGP forms as a result of reduced sea-ice west-
ice model in which ice motion is driven by forces gener-             ward advection due to the presence of the Mertz Glacier
ated by the wind, ocean, Coriolis force, and surface eleva-          Tongue (Massom et al., 2001) and strong katabatic winds
tion of the ocean, while internal ice stresses are calculated        that blow off the Antarctic ice sheet with temperatures be-
using a viscous-plastic (VP) rheology, as described in Zhang         low −30 ◦ C (Bindoff et al., 2000). Katabatic winds freeze
and Hibler (1997). In all experiments, the numerical model is        the surface waters and blow newly formed ice away from
configured to simulate present-day (modern) conditions: at-          the coast, making the polynya an efficient sea-ice “factory”,
mospheric forcings (wind, radiation, rain, humidity, etc.) are       with higher rates of sea-ice formation in comparison to non-
prescribed using 6-hourly climatological (1979–2000) data            polynya ocean areas that undergo seasonal sea-ice formation
from the ERA-40 reanalysis product produced by the Euro-             (Kusahara et al., 2010). The MGP produces 1.3 % of the total
pean Centre for Medium-range Weather Forecasts and back-             Southern Ocean sea-ice volume despite occupying less than
ground rates of runoff from the ice sheet to the ocean are           0.1 % of total Antarctic sea-ice extent (Marsland et al., 2004).
based on the numerical ice sheet model of Pollard and De-               As a result of the upwelling polynya environments, the
conto (2016) integrated over the same period (1979–2000).            area along the Adélie Coast is characterized by extremely
To study the pathway of meltwater in the ocean, additional           high primary productivity, with the water column known to
fresh (i.e. 0 psu) water was released into the surface layer         host significant amounts of phytoplankton, dominated by di-
of the ocean model at the grid points closest to the front of        atoms (Beans et al., 2008). The Mertz Glacier zone is gen-
the Ross Ice Shelf. Five different discharge experiments were        erally characterized by stratified waters in the summer, due
performed by releasing meltwater into this region at rates of        to seasonal ice melt, with these conditions corresponding to
0.01 Sv (Sv = 106 m3 /s), 0.05, 0.1, 0.5, and 1 Sv for the entire    the highest phytoplankton biomass. The lack of ice cover
duration of each experiment (∼ 3.5 years).                           means polynyas are the first polar marine systems exposed
                                                                     to spring solar radiation, making them regions of enhanced
3     Environmental setting and interpretation of proxy              biological productivity compared to adjacent waters. A con-
      data                                                           siderable amount of resultant sedimentation is focused via
                                                                     the westward-flowing currents from both of these polynyas
We utilize a 180 m thick sediment core that was recovered            within the deep, protected Adélie Basin, resulting in a re-
from the Wilkes Land Margin continental shelf in the Adélie          markably high sedimentation rate of ca. 1.5–2 cm yr−1 at Site
Basin (IODP Site U1357). This core targeted an expanded              U1357 (Escutia et al., 2011).
sediment drift (Adélie Drift) and provides a high-resolution            Although biogenic and terrigenous sediment is interpreted
Holocene record of climate variability. Below we provide             to be sourced locally in the Adélie Land region, the mass
pertinent details on this unique site and on our application of      accumulation rate of these sediments in this drift is as-
compound-specific δ 2 H measurements on algal biomarkers             sociated with the intensity of westward-flowing currents
as a novel meltwater proxy. Further details on proxy interpre-       (Sect. S2.2). Critically, these westward currents also act to
tation (Ba/Ti, grain size, HBIs) are given in the Supplement.        transport water masses from further afield, and Site U1357
                                                                     is directly oceanographically downstream of the Ross Sea,
3.1    The Adélie Drift
                                                                     meaning the continental shelf in this region receives signif-
                                                                     icant Antarctic Surface Water (ASSW) transported by the
Site U1357 is located in the Dumont d’Urville Trough of              Antarctic Slope Current (ASC) and Antarctic Coastal Cur-
the Adélie Basin, ca. 35 km offshore from Adélie Land                rent from the Ross Sea embayment . Thus, changes in the
(66◦ 24.79900 S, 140◦ 25.57050 E; Fig. 1). This is a > 1000 m        surface waters of the Ross Sea influence Site U1357. Whit-
deep, glacially scoured depression on the East Antarctic con-        worth et al. (1998) confirm the continuity of the westward-
tinental shelf, bounded to the east by the Adélie Bank. Fur-         flowing ASC between the Ross Sea and the Wilkes Land

Clim. Past, 17, 1–19, 2021                                                                  https://doi.org/10.5194/cp-17-1-2021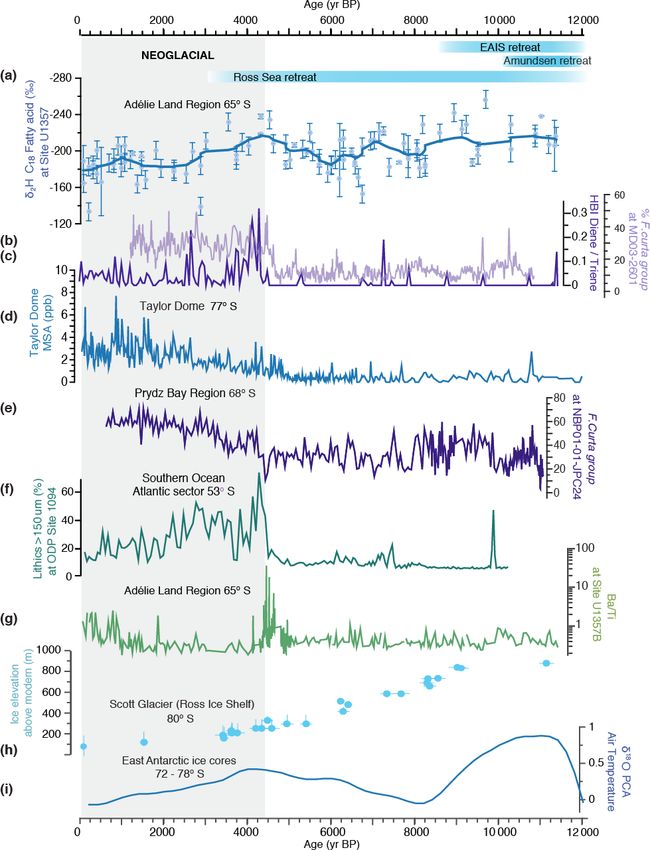
K. E. Ashley et al.: Mid-Holocene Antarctic sea-ice increase                                                                   5

margin. This flow is largely associated with the Antarctic           To investigate this further, we measured compound-
Slope Front, which reflects the strong density contrast be-       specific carbon isotopes of the C18 FAs in U1357B samples,
tween AASW and Circumpolar Deep Water (CDW). Mc-                  which gives an average δ 13 C value of −29.8 ‰±1.0 ‰ (n =
Cartney and Donohue (2007) estimate that the transport in         85). Budge et al. (2008) measured a similar δ 13 C value of
the westward ASC, which links the Ross Sea to the Wilkes          −30.7 ‰ ± 0.8 ‰ from C16 FAs derived from Arctic pelagic
Land margin, reaches 76 Sv (Sv = 106 m3 s−1 ). However,           phytoplankton, while sea-ice algae and higher trophic level
Peña-Molino et al. (2016) measured a highly variable ASC          organisms all had much higher δ 13 C values (sea-ice algae
flow at 113◦ E ranging from 0 to 100 Sv with a mean of            having values of −24.0 ‰ ± 2.4 ‰). Assuming similar val-
21.2 Sv. This contributes to a cyclonic gyre, which together      ues apply for the C18 FA and for organisms within the water
with the ASC dominate the circulation at Site U1357. The          column at our site, this suggests that our C18 FA is predomi-
gyre transport is around 35 Sv and comes mainly from the          nantly derived from pelagic phytoplankton.
Ross Sea region, with a lesser contribution from a westward          Furthermore, δ 13 C measurements of suspended particulate
flow associated with the Antarctic Circumpolar Current (Mc-       organic matter (SPOM) near Prydz Bay, East Antarctica by
Cartney and Donohue, 2007).                                       Kopczynska et al. (1995) showed that sites with high δ 13 C
                                                                  SPOM values (−20.1 ‰ to −22.4 ‰) were characterized by
3.2     Site-specific interpretation of δ 2 HFA as a glacial      diatoms and large heterotrophic dinoflagellates, whereas the
        meltwater proxy                                           lowest δ 13 C SPOM values (−29.7 ‰ to −31.85 ‰) were as-
                                                                  sociated with Phaeocystis, naked flagellates and autotrophic
3.2.1     Source of fatty acids                                   dinoflagellates. Wong and Sackett (1978) measured the car-
To best interpret the hydrogen isotope signal recorded by the     bon isotope fractionation of 17 species of marine phytoplank-
C18 FA, it is important to determine the most likely source       ton and showed that Haptophyceae (of which Phaeocystis be-
these compounds are derived from, and thus the habitat in         longs) had the largest fractionation of −35.5 ‰.
which they are produced. The C18 FA, however, is known to            Therefore, based on the known producers of C18 FAs, ob-
be produced by a wide range of organisms and so we can-           served phytoplankton assemblages within modern surface
not preclude the possibility of multiple sources, especially in   waters offshore Adélie Land, and the δ 13 C value of C18
a highly diverse and productive region such as the surface        FAs in U1357B samples, as discussed above, we argue that
waters of offshore Adélie Land. However, we can attempt to        the C18 FA here is predominantly produced by Phaeocystis
determine the most dominant producer(s), which will help us       (most likely P. antarctica) but with potential minor inputs
understand the main signal being recorded by the isotopes.        from other algal species such as Cryptophytes or diatoms.
   An analysis of the FAs within eight classes of microalgae         Phaeocystis antarctica is a major phytoplankton species
by Dalsgaard et al. (2003) (compiling results from multiple       within the Antarctic, dominating spring phytoplankton
studies) showed Cryptophyceae, Chlorophyceae, Prasino-            blooms, particularly in the Ross Sea (DiTullio et al., 2000;
phyceae, and Prymnesiophyceae to be the most dominant             Schoemann et al., 2005). It is known to exist both within
producers of total C18 FAs. The Bacillariophyceae class, on       sea ice and in open water (Riaux-Gobin et al., 2013) and has
the other hand, which includes the diatoms, were found to         been observed in surface waters in great abundance follow-
produce only minor amounts of C18 FA, instead synthesizing        ing spring sea-ice break-up, at both coastal and offshore sites
abundant C16:1 FAs. Thus, despite the water column offshore       in Adélie Land (Riaux-Gobin et al., 2011).
Adélie Land being dominated by diatoms, these are unlikely           Although a large proportion of organic matter produced in
to be a major source of the C18 FA within U1357B (Beans et        the surface water is recycled in the upper water column, the
al., 2008; Riaux-Gobin et al., 2011).                             small fraction which is deposited in the sediment reaches the
   Of the four microalgae classes dominating C18 production       sea floor through large particles sinking from above as “ma-
(Dalsgaard et al., 2003), species from the Chlorophyceae and      rine snow”. This export production includes large algal cells,
Prymnesiophyceae classes have been observed within sur-           fecal pellets, zooplankton carcasses and molts, and amor-
face waters offshore Adélie Land after spring sea-ice break-      phous aggregates (Mayer, 1993). In the Ross Sea, aggregates
up (Riaux-Gobin et al., 2011). Here, Phaeocystis antarc-          of P. antarctica, have been observed to sink at speeds of more
tica of the Prymnesiophytes was found to dominate the sur-        than 200 m d−1 , meaning they could reach deep water very
face water phytoplankton community (representing 16 % of          quickly (Asper and Smith, 1999). In this way, a proportion
the phytoplankton assemblage), whereas Cryptophyceae spp.         of the lipid content of P. antarctica and other algae is trans-
were found in only minor abundances (Riaux-Gobin et al.,          ported and sequestered in the sediments.
2011). In the Antarctic, Phaeocystis is thought to be the most       Initial diagenesis is characterized by the preferential
dominant producer of C18 FAs (Dalsgaard et al., 2003), and        degradation of more labile organic compounds, e.g. sugars,
thus is likely to be a key producer of the C18 FA in U1357B       proteins, and amino acids. Proportionally, lipids are rela-
samples.                                                          tively recalcitrant compared to other compounds (e.g. amino
                                                                  acids, proteins) and thus are more likely to be preserved as
                                                                  molecular biomarkers on geological timescales, even where

https://doi.org/10.5194/cp-17-1-2021                                                               Clim. Past, 17, 1–19, 2021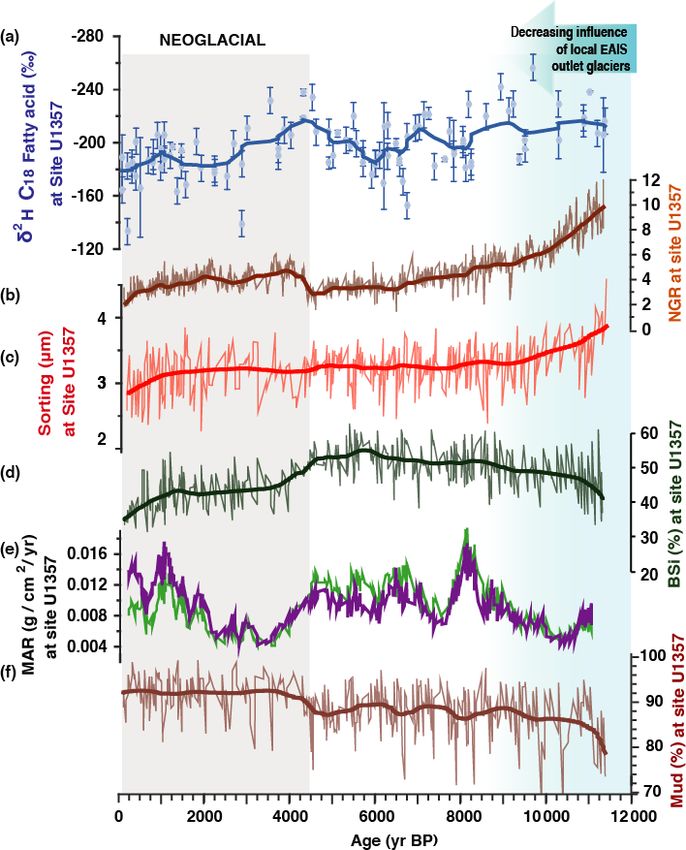
6                                                                    K. E. Ashley et al.: Mid-Holocene Antarctic sea-ice increase

the rest of the organism may be completely degraded (Peters           temperature estimates from nearby Site MD03-2601 (about
and Moldowan, 1993). The final proportion of lipids that are          50 km west of Site U1357) range from −0.17 to 5.35 ◦ C
preserved within sediments are affected by factors includ-            over the Holocene (Kim et al., 2010). Therefore, fractiona-
ing the export production, O2 content, residence time in the          tion changes driven by temperature or salinity cannot be in-
water column and at the sediment–water interface before de-           voked as a major control on δ 2 HFA in the Holocene.
position, molecular reactivity, formation of macromolecular               Thus, the most parsimonious explanation relates to
complexes, adsorption to mineral surfaces, and bioturbation           changes in δ 2 HFA of the water source (Sachse et al., 2012).
(Meyers and Ishiwatari, 1993; Killops and Killops, 2004).             In the Adélie Basin, the most apparent controls on this
Within lacustrine sediments, a significant shift in FA distri-        are advection, upwelling, or inputs of isotopically depleted
butions has been shown to occur within 100 years due to               glacial meltwater. The δ 2 HFA value within Antarctic glaciers
early diagenesis, after which the FA distribution remains rel-        is highly depleted relative to sea water due to the Rayleigh
atively unaffected by diagenesis (Matsuda, 1978), thus major          distillation process, leading to highly negative isotope values
changes are assumed to reflect primary environmental signals          for precipitation over the continent.
on longer timescales, such as in our Holocene record. Due to              The glacial meltwater originating from the Ross Ice Shelf
the hyperproductivity of the surface waters offshore Adélie           is likely to combine ice precipitated throughout the Holocene
land, we assume the dominant inputs of the C18 FA are from            and glacial period, and from both the East and West Antarc-
algal sources in overlying waters and up-current regions. Al-         tic Ice Sheets. However, as noted by Shackleton and Ken-
lochthonous inputs, e.g. long-range aeolian transport of plant        nett (1975) in their first oxygen isotope record of the Ceno-
material, are assumed to be minimal.                                  zoic (see their Fig. 6), most of the ice that melts around the
                                                                      margin has been coastally precipitated (due to higher accu-
3.2.2   Interpretation of hydrogen isotopes
                                                                      mulation rates). Since ice precipitated further inland has a
                                                                      greater residence time (Shackleton and Kennett, 1975) and
Compound-specific H isotopes of algal biomarkers are a                significantly lower accumulation rates it will contribute sig-
well-used climate proxy in sediments throughout the Ceno-             nificantly less to this signal. Thus, the ice that was melt-
zoic (e.g. Pagani et al., 2006; Feakins et al., 2012). Al-            ing along this margin is best represented by average val-
though diagenetic alteration, including H-exchange, is pos-           ues of coastal ice dome records at a similar latitude to that
sible within sedimentary archives, this has been shown to be          which melted since the LGM (such as TALDICE and Siple
minimal in sediments younger than 20 Ma (Sessions et al.,             Dome) than more southerly locations. Glacial to Holocene
2004). Furthermore, if H-exchange had occurred, we would              δ 2 HFA values from TALDICE, located on the western edge
expect δ 2 H values between different FA chain lengths and            of the Ross Sea in the East Antarctic, for example, vary be-
closely spaced samples to be driven towards homogeneity,              tween −276.2 ‰ and −330.3 ‰ (Steig et al., 1998) (con-
yet large variability remains, suggesting this is not the case.       verted from δ 18 O values following the global meteoric wa-
Thus, we are confident that our measured H isotopes are in-           ter line (GMWL): δ 2 HFA = 8.13 (δ 18 O) + 10.8), while val-
dicating a primary signal throughout the Holocene.                    ues from Siple Dome on the eastern edge of the Ross Sea in
   The δ 2 H value preserved in biomarkers is known to be cor-        the West Antarctic vary from ca. −200 ‰ to −293 ‰ (Brook
related but offset with the δ 2 H of the water from which the         et al., 2005). Taking the average of these values as a rough
hydrogen was derived. Measured δ 2 H can therefore be de-             estimate for the meltwater gives a δ 2 H value of ca. −275 ‰.
scribed as a function of either the δ 2 H of the water source,        We note our calculations are based on averages of set time
or the fractionation occurring between source water and the           periods, which we expect would integrate ice of various ages,
lipid (εl/w ) (i.e. vital effects), in which various environmental    rather than extreme values that could relate to specific melt
factors play a part (Sachse et al., 2012).                            events of ice or biases to certain ages and regions. This seems
   The main environmental factors controlling εl/w are salin-         reasonable, as the isotopic signal of coastal surface waters
ity and temperature, with which δ 2 H increases by 1 ‰–4 ‰            masses advected from the RIS to the Adélie land (as illus-
per increase in practical salinity unit (psu) (Schouten et al.,       trated in Figs. 3 and 4) must integrate a range of source areas
2006; Sachse et al., 2012) and decreases by 2 ‰–4 ‰ per de-           across the RIS and from the coast around to Adélie Land.
gree C increase (Zhang et al., 2009), respectively. The δ 2 HFA           In comparison to the highly negative glacial ice isotope
record from Site U1357 displays an absolute range of ca.              composition, sea surface water δ 18 O measurements taken
123 ‰, and millennial- to centennial-scale variability with           near the Mertz Glacier offshore Adélie Land (140–150◦ E)
an amplitude of ca. 50 ‰, throughout the core. This would             in summer 2000–2001 ranged between −0.47 ‰ and 0.05 ‰
imply extremely large and pervasive variations in tempera-            (Jacobs et al., 2004), equivalent to δ 2 H values of 6.9 ‰ to
ture (up to ca. 60 ◦ C) and salinity (up to 123 psu) if fraction-     11.2 ‰ (average = 9 ‰) following the GMWL. Thus, the
ation driven by either of these factors were the main con-            two major hydrogen source pools (RIS glacial ice and ocean
trol. One study has shown the salinity of present day Adélie          water) have highly contrasting isotope values, meaning in-
shelf waters to vary between 34 and 34.8 psu (Bindoff et al.,         puts of upstream glacial ice could have a large effect on sur-
2000), while tetraether-lipid based subsurface (50–200 m)             face water δ 2 H values in the Adélie Land region.

Clim. Past, 17, 1–19, 2021                                                                  https://doi.org/10.5194/cp-17-1-2021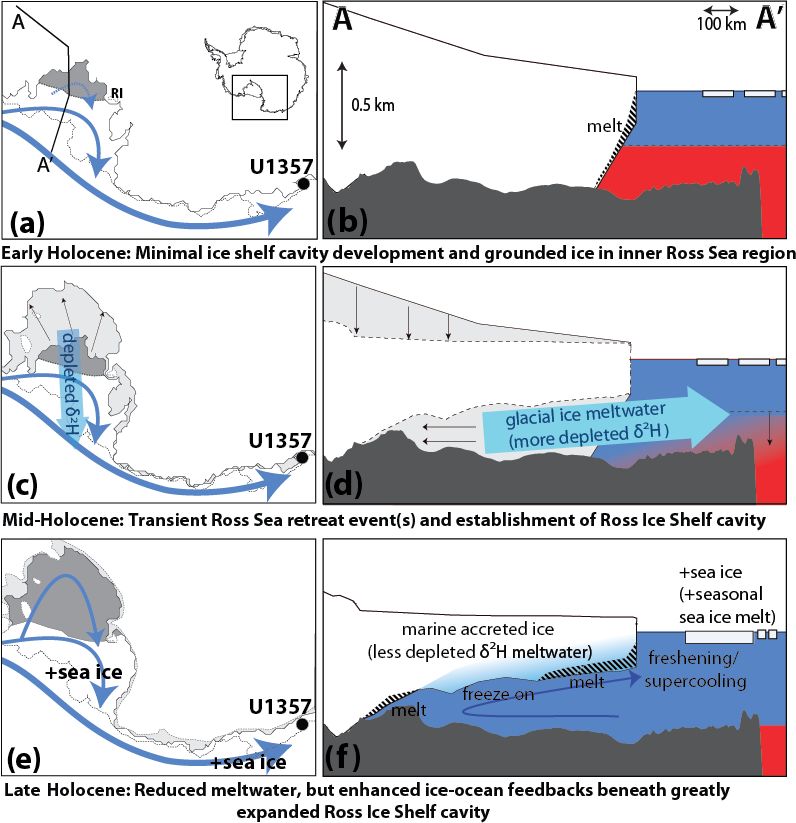
K. E. Ashley et al.: Mid-Holocene Antarctic sea-ice increase                                                                      7

    Taking the average glacial meltwater δ 2 H value as             recent decades. This seems plausible based on geological ev-
−275 ‰ and the average modern Adélie surface water δ 2 H            idence that indicates large glacial retreat and ice mass loss
value of 9 ‰ as endmembers, and assuming a biosynthetic             occurred from the Ross Sea sector during the Holocene (An-
offset between the FA and sea water of 173 ‰ (see below),           derson et al., 2014; McKay et al., 2016; Spector et al., 2017),
we can use a simple mixing model to estimate the percentage         meaning resultant changes in surface water are likely to be
of glacial meltwater required in the surface waters to change       greater in magnitude than observed around the Antarctic in
the δ 2 H FA value to those recorded in U1357B samples. The         recent decades. This assumes a relatively constant value for
most negative values occur during the early Holocene, 11.4–         the isotopic composition of glacial meltwater, however, there
8.2 ka, averaging −214.2 ‰ (n = 18) which, converted to a           is likely to be some variability due to the possibility of melt-
surface water value of −41 ‰, requires 17.6 % of the sur-           ing ice of different δ 2 H values. But, as discussed above, the
face water to be comprised of glacial meltwater. During this        meltwater is best represented by the average values of the
time, we argue that large volumes of meltwater were reach-          ice sheet, rather than extreme values, since it must (over the
ing the core site as local glaciers retreated, leading to intense   broad expanse of the RIS) include an integrated signal, and
surface water stratification. Thus, a relatively high percent-      thus the actual variation in meltwater δ 2 H will be signifi-
age of meltwater in the Adélie Land surface waters seems            cantly within the range of the endmembers.
reasonable. During the mid-Holocene (5–4 ka), the average              Although the biosynthetic fractionation of the C18 FAs in
δ 2 HFA is very similar (−213.9 ‰, n = 7), requiring 17.2 %         U1357B is unknown, we assume that the offset with surface
of the surface water to be derived from glacial meltwater.          water remains relatively constant throughout the record. Ses-
During this time, we argue for the dominant meltwater source        sions et al. (1999) showed the biosynthetic fractionation of
as coming from the Ross Sea and interpret this as a major           hydrogen isotopes in the C18 FA from four different marine
period of glacial retreat (see Sect. 5.2), during which large       algae to range from −189 ‰ to −157 ‰. If we take the av-
volumes of meltwater are injected into the surface water and        erage of these values of 173 ‰ and apply this as a biosyn-
transported to the Adélie coast. In contrast, the most recent       thetic offset to the youngest samples in U1357B (last 0.5 ka,
samples (last 0.5 ka, n = 7), which includes the most pos-          n = 7), which includes the most positive value of the record,
itive value of the record, has an average δ 2 H FA value of         gives an average δ 2 HFA value of −174.5 ‰. This brings the
−174.5 ‰. This brings the surface water value up to −1.5 ‰,         surface water value up to −1.5 ‰, which approaches modern
which approaches modern measured values, and requires just          measured values (Jacobs et al., 2004).
3.7 % (e.g. well within uncertainties) of the surface waters in        Furthermore, it is interesting to note that the biosynthetic
the Adélie Land to be glacial meltwater. However, it is also        offsets measured by Sessions et al. (1999) for the C18 FA
possible that the meltwater was dominated by more LGM-              from different algal species have a total δ 2 H range of 32 ‰.
aged ice. In either case, perturbation of the exact isotopic        Although we cannot dismiss changes in the relative con-
values still indicate only significant changes in the flux of       tribution of C18 from different species in U1357B samples
glacial meltwater can account for this signal. For example,         (and thus different biosynthetic fractionations), we argue
the use of −330 ‰ (LGM values) for the ice input gives              this would only be a minor control on δ 2 H compared to
an estimate of 3 % of the surface water being comprised of          other influences. As a thought experiment, taking the above
glacial meltwater for latest Holocene values, and 14.7 % for        endmembers for biosynthetic fractionation from Sessions et
values prior to 8 ka. Taking −240 ‰ (Holocene values) for           al. (1999), even with a 100 % change in C18 producer to a
the ice input gives an estimate of 4 % for latest Holocene          different algal source, this could only explain a quarter of the
values, and 20 % for values prior to 8 ka). Thus even with          observed δ 2 H change (i.e. 32 ‰ of 123 ‰).
changing isotopic values though the deglacial, this signal of          Therefore, we interpret the first-order control on δ 2 HFA at
changing meltwater flux would still dominate. We note these         Site U1357 as inputs of isotopically depleted glacial meltwa-
are semi-quantitative estimates, as the salinity and tempera-       ter. Such inputs are, in turn, influenced by the mass balance
ture fractionation could reduce these estimates further (but        of the proximal or up-current glaciers and ice shelves.
cannot account for the whole signal).
    Surface water δ 18 O values around Antarctica (below            3.3   Other proxies
60◦ S), measured between 1964 and 2006, ranged from
−8.52 ‰ to 0.42 ‰ (Schmidt et al., 1999), the most negative         Grain size, natural gamma radiation (NGR) and terrigenous
value having been measured proximal to the George VI Ice            and biosiliceous mass accumulation rates (MARs) reflect
Shelf edge, where high melt rates have been observed (Potter        changing sediment delivery either driven via local glacial
and Paren, 1985). If converted to δ 2 H using the global me-        meltwater discharge or advection of suspended sediment by
teoric water line, these values give a δ 2 H range of 83.4 ‰.       oceanic currents. The diene/triene HBI ratio is used as a
Thus, our absolute δ 2 HFA range of 123 ‰ over the Holocene         proxy for coastal sea-ice presence (Massé et al., 2011), in
suggests a range of isotopically depleted meltwater inputs to       which high values indicate greater sea-ice extent over the
our core site over this time that are 1.5 times greater than        core site. The HBI diene, also known as Ice Proxy for the
that occurring in different locations around the Antarctic in       Southern Ocean with 25 carbon atoms (IPSO25), has been

https://doi.org/10.5194/cp-17-1-2021                                                                  Clim. Past, 17, 1–19, 2021
8 K. E. Ashley et al.: Mid-Holocene Antarctic sea-ice increase
shown to derive from a sea-ice-associated diatom (Belt et al.,
2016), whereas the HBI triene is produced in the marginal ice
zone (Smik et al., 2016). Ba/Ti enrichment is considered to
reflect enhanced primary productivity. Interpretation of these
proxies is discussed in more detail in Sect. S2.
4 Results
4.1 Model simulations
We employed a series of sensitivity tests from a high-
resolution numerical ocean model by releasing a range of
meltwater volumes (0.01 to 1 Sv) from along the front of the
Ross Ice Shelf (RIS) to determine its pathway. This demon-
strates that, even under the lowest flux scenarios, freshwater
is transported anticlockwise, entrained within the coastal cur-
rent (Figs. 2 and 3), and reaches Site U1357 within a year.
Moreover, although the higher-input scenarios are not real-
istic values for the release of meltwater since the LGM, the
full range of simulations show a strong linear relationship
between meltwater flux and salinity change at the core site
(Fig. 3), suggesting the magnitude of the signal recorded at
Site U1357 is directly related to the magnitude of meltwater
released. Thus, we argue that any changes in Ross Sea water
mass properties (salinity and temperature) would have a di-
rect influence on surface water mass properties at Site U1357
during the Holocene.
4.2 Geochemical data
Figure 2. MITgcm simulations of meltwater release from along
The main datasets from Core U1357 are displayed in Figs. 2 the edge of the Ross Ice Shelf. The top two images show sea sur-
and S2. FA δ 2 H (Fig. 4a) shows and overall trend towards face salinity difference (in practical salinity units) after 3.5 model
more positive values over the course of the Holocene, indi- years resulting from meltwater release volumes of (a) 0.1 Sv (2 ×
1013 m3 total ice volume equivalent) and (b) 0.5 Sv (1 × 10¹⁴ m3
cating a decline in glacial meltwater input. There is a no-
total ice volume equivalent). The red star indicates the position
table deviation from this trend in the mid-Holocene involving of Site U1357 (this study), and red dots show positions of other
a sustained period of more negative δ 2 H values, suggesting core sites mentioned in this study where a mid-Holocene increase
a peak in meltwater input, centred on ca. 4.4 ka. This mid- in sea ice and/or cooling is recorded: Taylor Dome (Steig et al.,
Holocene deviation in FA δ 2 H coincides with an increase in 1998; Baggenstos et al., 2018), JPC24 (Denis et al., 2010) and
the HBI diene/triene ratio (Fig. 4c), indicating a baseline shift ODP 1094 (Nielsen et al., 2007). AL stands for Adélie Land, RS
in sea-ice conditions whereby greater sea-ice concentrations stands for Ross Sea, WS stands for Weddell Sea, EAIS stands for
are sustained for the rest of the Holocene. This is a similar East Antarctic Ice Sheet, and WAIS stands for West Antarctic Ice
pattern to the relative abundance of the Fragilariopsis curta Sheet. (c) Scatterplot of simulated meltwater flux (Sv) against mean
group (Fig. 4b), a sea-ice diatom group in core MD03-2601 salinity difference at U1357 core site. The grey band indicates the
that also indicates a shift in sea-ice concentrations. Along the range of plausible Holocene to deglacial Ross Sea meltwater inputs.
The dotted line indicates maximum Antarctic meltwater during the
entire record, Ba/Ti ratios show persistent periodic fluctua-
Holocene.
tions in marine productivity, with values between 0.1 and 2.7
(Fig. 4g). A marked enrichment can be observed at ca. 4.4 ka
reaching Ba/Ti ratio values over 36.1, suggesting a peak in
primary productivity, before declining to background levels till (Unit III), overlain by 15 m of laminated mud-rich diatom
again (Fig. 4g). oozes with ice-rafted debris (IRD) (Unit II), and the upper-
most 171 m (Unit I) consists of laminated diatom ooze with a
4.3 Sedimentological data
general lack of IRD and a significant reduction in terrigenous
sediment (Escutia et al., 2011).
The stratigraphy of U1357B is divided into three units: the Between ca. 11.4 and 8 ka, U1357B has a relatively high
lowermost 10 cm recovered Last Glacial Maximum (LGM) terrigenous component (i.e. high Natural Gamma Radiation
Clim. Past, 17, 1–19, 2021 https://doi.org/10.5194/cp-17-1-2021K. E. Ashley et al.: Mid-Holocene Antarctic sea-ice increase 9
entrant model (Domack et al., 2006; Leventer et al., 2006)
(Figs. 1 and S4; Supplement), whereby LGM ice retreated in
the deeper troughs while remaining grounded on shallower
banks and ridges. Sediment-laden meltwater and IRD con-
tent in Unit II (> 11.4 ka) is thus likely derived from local
outlet glaciers. However, anomalously old radiocarbon ages
due to glacial reworking precludes development of a reliable
age model prior to the Holocene (Supplement).
The results of model simulations (Sect. 5.1) indicate that,
although several small glaciers within Adélie Land may con-
tribute meltwater to the site, the region is also likely to be in-
fluenced significantly by changes in Ross Sea waters. Fresh-
water release simulations from the Ross Ice Shelf (RIS) con-
firm this oceanographic continuity between the Ross Sea and
the Wilkes region (Fig. 2). All five simulations indicate that
meltwater released from the edge of the RIS is almost com-
pletely entrained within the westward coastal surface current
and reaches Site U1357 within 4 months to 1 year (Fig. 3).
These fluxes cover a wide range of meltwater inputs and
show a strong linear relationship with salinity at the core
site (Fig. 4a). This suggests that the magnitude of the signal
recorded at Site U1357 is directly related to the magnitude of
the meltwater input.
Local processes also play a critical role in this region.
For example, episodic calving events of the Mertz Glacier
Figure 3. Simulated salinity anomalies over time at Site U1357 for tongue release fast ice over the drill site and create strong sur-
the five meltwater release experiments. face water stratification, cutting off local AABW production
(Campagne et al., 2015). Although appearing to be only a lo-
cal process, there is still a regional (Ross Sea) influence, as
(NGR) content and low BSi %; Fig. S4). The grain size distri- this fast ice that builds up behind the Mertz Glacier is formed
bution contains coarse tails of fine (125–250 µm) to medium by the freezing of fresher AASW transported from the Ross
sands (250–500 µm), but only one sample contains coarse Sea (Fig. 2). Thus, conditions in the Ross Sea, such as the
sands (> 500 µm) that may represent iceberg-rafted debris melting of isotopically depleted glacial ice, would influence
(IBRD). However, terrigenous content and IBRD is more both the isotopic composition and amount of this sea ice.
common in the underlying Unit II. The fine-grained sands
and muds have a distribution with similar modes to overlying
intervals, albeit with an increase in the size of the coarse silt 5.1 Early Holocene
and very fine sand modes. There is a subtle increase in sort- The base of the drift deposit shows downlapping of material,
ing up core between ca. 11.4 and ca. 8 ka (from very poorly suggesting a supply from the south, indicating local focus-
to poorly sorted, Fig. 5c). ing of meltwater and terrigenous material was the dominat-
Between 9 and 4.5 ka, mass accumulation rates (MARs) ing influence until 11.4 ka (Sect. S2.2 and Fig. S4). This is
(both biogenic and terrigenous; Fig. 5e) are relatively high, overlain by onlapping strata (Unit I) with the drift forming
albeit with millennial scale variability. However, the mean an east–west elongation on the northern flank of the Dumont
grain size and sorting of the terrigenous material is relatively d’Urville Trough, which is more consistent with advection
stable throughout the entire interval, and as with the rest of of material from the east than with delivery from local outlet
Unit I there is an almost complete lack of IBRD. There is a glaciers to the south. Thus, an increased meltwater influence
rapid increase in mud content at 4.5 ka coincident with a re- from the Ross Sea is likely since this time.
duction in both the biogenic and terrigenous MARs, although Due to the potential for competing sources of glacial melt-
the terrigenous MAR curve shows higher accumulation rates water in the earliest Holocene, we focus our study on Unit
than the biogenic MAR curve (Fig. 5e and f). I, where there is less influence of calving bay processes (Es-
cutia et al., 2011). However, the earliest part of Unit I (11.4
5 Discussion to 8 ka), which includes the most negative δ 2 HFA values, is
characterized by a very gradual up-core increase of sorting in
The sedimentology and geometry of the drift prior to the terrigenous sediment supply, decreasing natural gamma
∼ 11.4 ka (Unit II) is consistent with the calving bay re- ray (NGR) values (Fig. 5b and c), and a general lack of IRD
https://doi.org/10.5194/cp-17-1-2021 Clim. Past, 17, 1–19, 202110 K. E. Ashley et al.: Mid-Holocene Antarctic sea-ice increase Figure 4. Holocene Adélie Land proxy records from IODP Site U1357 and other circum-Antarctic sites. Glacial retreat chronologies are shown as bars at the top, as discussed in the text. (a) δ 2 H C18 fatty acid at Site U1357 (errors bars based on replicates), with robust locally weighted smoothing (rlowss). (b) Fragilariopsis curta group (F. curta and F. cylindrus) relative abundance at MD03-2601, as a proxy of sea- ice conditions (Crosta et al., 2008). (c) Di-unsaturated HBI (C25:2 ; Diene)/tri-unsaturated HBI isomer (C25:3 ; Triene) ratio at Site U1357. (d) Methanesulfonate (MSA) concentrations (ppb) from Taylor Dome ice core. (e) F. curta group relative abundances in core NBP-01- JPC24. (f) Coarse lithic (ice-rafted) content at TTN057-13-PC4 (Hodell et al., 2001). (g) Ba/Ti (logarithmic scale) at Site U1357. (h) 10 Be cosmogenic nuclide ages from Scott Glacier in the southwestern Ross Ice Shelf region (Spector et al., 2017). (i) Temperature signal from principal component analyses of five δ 18 O records in five East Antarctic ice cores (Vostok, EPICA Dome C, EPICA Dronning Maud Land, Dome Fuji, and Talos Dome) (Masson-Delmotte et al., 2011). Clim. Past, 17, 1–19, 2021 https://doi.org/10.5194/cp-17-1-2021
K. E. Ashley et al.: Mid-Holocene Antarctic sea-ice increase                                                                               11

Figure 5. Holocene Adélie Land proxy records from IODP Site U1357 (a) C18 fatty acid δ 2 H (errors bars based on replicate analyses); the
heavy line is a robust locally weighted scatterplot smoothing (rlowss). (b) Natural Gamma Radiation; the heavy line is a rlowss .(c) Grain
sorting (µm) calculated following Folk and Ward (1957); the heavy line is a rlowss. (d) Percentage of biogenic silica (BSi); the heavy line is
a rlowss. (e) Mass accumulation rates of biogenic (green line) and terrigenous (purple line) material (f) Percentage of mud; the heavy line is
a rlowss.

(Escutia et al., 2011). We conservatively interpret this as po-          the Ross sea is relatively well-constrained, particularly in the
tentially maintaining some local glacial meltwater input from            western Ross Sea, and the loss of residual ice caps appears
local outlet glaciers in the lowermost interval of Unit I. Nev-          to be largely complete by ca. 7 ka to the immediate north of
ertheless, this process was probably greatly reduced relative            Ross Island, near the present-day calving line front of the
to Unit II deposition and it is likely much of this signal be-           Ross Ice Shelf (Anderson et al., 2014; McKay et al., 2016).
tween 11.4 and 8 ka could still be derived from water masses             Indeed, the phase of isotopically depleted glacial meltwa-
advecting to the site from the east (e.g. the Ross Sea).                 ter is apparent at Site U1357 between 8 and 7 ka could be
   This is supported by geological and cosmogenic evidence               sourced from the Ross Sea, reconciling our data with these
which demonstrates that the majority of the margin of the                chronologies. Prior to 8 ka, any meltwater signal in U1357B
East Antarctic, and also the Amundsen Sea margins, had re-               is potentially influenced by local glacier retreat, based on
treated to their modern-day positions by ∼ 10 ka (Bentley et             the caveats noted earlier in the grain size and geophysical
al., 2014; Mackintosh et al., 2014; Hillenbrand et al., 2017).           datasets (Sect. S2.2), although we note a dominant Ross Sea
Thus, these margins are unlikely to contribute large scale               contribution to this signal is possible.
shifts in meltwater fluxes to the Adélie Coast during most                  Glacial retreat, however, persisted in the Ross Sea until at
of the Holocene. The history of grounding line retreat in                least 3 ka (Anderson et al., 2014; Spector et al., 2017) pro-

https://doi.org/10.5194/cp-17-1-2021                                                                          Clim. Past, 17, 1–19, 2021
12                                                                K. E. Ashley et al.: Mid-Holocene Antarctic sea-ice increase

viding a large upstream source of meltwater feeding into the       Glacier experiences a second phase of rapid thinning of ca.
Adélie Coast. We therefore interpret our meltwater signal as       200 m between 6.8 and 5.3 ka (Fig. 2h), followed by a slower
being dominated by Ross Sea inputs since at least 8 ka, but        rate of thinning of between 5.3 and 3.5 ka of ca. 100 m. Ages
potentially as early as 11.4 ka. Furthermore, the retreat of       younger than this, near the modern surface, are thought to
grounded ice from the outer Ross Sea continental shelf was         be related to surface ablation rather than dynamic thinning.
accompanied by the growth of a significant floating ice shelf      This suggests that the grounding line was at its modern loca-
(which was not the case in the Amundsen Sea or proximal            tion by ca. 3.5 ka (Spector et al., 2017), although it may have
East Antarctic coast) (Bentley et al., 2014).                      potentially retreated further south, followed by a short dura-
   An overall trend to more positive δ 2 HFA values, from the      tion readvance of the grounding line (Kingslake, et al., 2018).
most negative value of the record at ∼ 9.6 ka, to ∼ 8 ka indi-     Glaciological evidence from radar profiles suggests the de-
cates decreasing meltwater (Fig. 4a), thus suggesting a grad-      velopment of divide flow on Roosevelt Island occurred some-
ually diminished input from either local outlet glaciers or the    time between 3 and 4 ka, suggesting that the ice sheet thick-
Ross Sea. This is associated with an increase in MARs, be-         ness was at least 500 m thicker until this time (Conway et al.,
tween 10 and 8 ka, and is tentatively interpreted to represent     1999). Combined, these lines of evidence suggest the ma-
the final retreat of residual ice from local bathymetric highs     jority of grounding line retreat south of Ross Island occurred
allowing more material to advect into the drift (Fig. 5e). Al-     after 8 ka, with a sustained retreat occurring after 6.8 ka, con-
though there is millennial-scale variability, MARs remain          sistent with the timing of the largest inputs of glacial meltwa-
relatively high until 4.5 ka. However, δ 2 HFA and MARs show       ter feeding the U1357 site. However, a younger age (e.g. 3–
greater coherence at the millennial-scale after 7 ka, suggest-     3.5 ka) for final establishment of the modern grounding line
ing that increased fluxes of glacial meltwater broadly corre-      position is consistent with our interpretation, as although the
sponded to stronger easterly currents, which advected bio-         meltwater signal in δ 2 HFA peaks at 4.5 ka, it does not stabi-
genic and terrigenous material into the drift.                     lize at lower levels until 3 ka.
                                                                      The δ 2 HFA peak at 4.5 ka in U1357 coincides directly with
5.2   Middle Holocene
                                                                   a rapid shift in HBI biomarker ratios at the site (Fig. 4a and
                                                                   c), as well as sea-ice proxies recorded in nearby site MD03-
A negative excursion in δ 2 HFA starting from 6 ka and cul-        2601 (Fig. 4b), in the Ross embayment (Taylor Dome ice
minating at 4.5 ka is interpreted to record a period of en-        core on a revised age model) (Steig et al., 1998; Baggenstos
hanced glacial meltwater flux to the site relating to a fi-        et al., 2018) (Fig. 4d) and other sectors of the East Antarctic
nal retreat phase of the major ice sheet grounding line in         margin in Prydz Bay (JPC24) (Denis et al., 2010) (Fig. 4e),
the Ross Sea embayment (Fig. 6). A marked enrichment of            reflecting a widespread increase in coastal sea-ice concentra-
Ba/Ti ratios also occurs at 4.5 ka, reaching values of 36.1,       tion and duration. We interpret decreasing MAR and finer-
on a background of baseline fluctuations between 0.1 and 2.7       grained terrigenous content (e.g. increased mud percent) at
(Fig. 2g), which suggests enhanced primary productivity, po-       Site U1357 after 4.5 ka (Fig. 5e and f) to also be a conse-
tentially driven by meltwater-induced stratification. Ongoing      quence of increased coastal sea ice, reducing wind stress on
Holocene retreat in the Ross Sea is interpreted to be primar-      the ocean surface and limiting the easterly advection of de-
ily the consequence of marine ice sheet instability processes      tritus to the drift deposit.
resulting from the overdeepened continental shelf in that sec-        Coastal sea-ice concentration and duration remain high
tor (McKay et al., 2016). We use the model presented by            throughout the rest of the Holocene as recorded by our HBI
Lowry et al. (2019) to help constrain the pattern and rate of      data (Fig. 4c), sea-ice diatoms in core MD03-2601 (Crosta
retreat of the grounding line to the south of Ross Island. This    et al., 2008), methanesulfonic acid concentration in Taylor
model compares geological data with ice sheet model exper-         dome ice core(Steig et al., 1998), and sea-ice diatoms in core
iments that were forced by a range of environmental con-           JPC24 (Denis et al., 2010), compared to the period before
ditions. These experiments indicate that the Ross Ice shelf        4.5 ka, despite a decrease in glacial meltwater flux to the
cavity only started to expand once the grounding line re-          U1357 site. In addition, meltwater input prior to 4.5 ka does
treated to the south of Ross Island. Furthermore, to recon-        not have a major influence on sea-ice extent. Thus, an in-
cile these model experiments with geological datasets, the         crease in meltwater flux cannot explain the Neoglacial inten-
cavity expansion was not completed until the mid-Holocene          sification of sea ice at ∼ 4.5 ka. Here, we propose that greater
(ca. 5 ka). This reconciles well with 10 Be exposure ages of       coastal sea-ice cover since 4.5 ka is related to the develop-
erratics in coastal nunataks at the confluence of the Mercer       ment of a large ice shelf cavity in the Ross Sea as the ice
Ice Stream, and Reedy Glacier indicate 105 m of ice sheet          sheet retreats (Fig. 6), which pervasively modified ice shelf–
deflation since 6.8 ka, with 40 m of this after 4.9 ka (Todd et    ocean interactions and increased sea-ice production. Mod-
al., 2010), indicating the most rapid phase of retreat occurred    els suggest a large cavity on the continental shelf increases
between 6.8 and 4.9 ka. More recent deflation profiles for the     contact between basal-ice and circulating ocean water, driv-
Beardmore Glacier (84◦ S) and Scott Glacier (86◦ S) regions        ing the formation of a cool, freshwater mass feeding into the
show sustained thinning between ca. 9 and 8 ka, but Scott          AASW, stabilizing the water column and enhancing the pro-

Clim. Past, 17, 1–19, 2021                                                                https://doi.org/10.5194/cp-17-1-2021
You can also read