Glacial sedimentation, fluxes and erosion rates associated with ice retreat in Petermann Fjord and Nares Strait, north-west Greenland - The Cryosphere
←
→
Page content transcription
If your browser does not render page correctly, please read the page content below
The Cryosphere, 14, 261–286, 2020
https://doi.org/10.5194/tc-14-261-2020
© Author(s) 2020. This work is distributed under
the Creative Commons Attribution 4.0 License.

Glacial sedimentation, fluxes and erosion rates associated with ice
retreat in Petermann Fjord and Nares Strait, north-west Greenland
Kelly A. Hogan1,2 , Martin Jakobsson3,4 , Larry Mayer2 , Brendan T. Reilly5 , Anne E. Jennings6 , Joseph S. Stoner5 ,
Tove Nielsen7 , Katrine J. Andresen8 , Egon Nørmark8 , Katrien A. Heirman7,9 , Elina Kamla7,10 , Kevin Jerram2 ,
Christian Stranne3,4 , and Alan Mix5
1 British Antarctic Survey, Natural Environment Research Council, High Cross, Madingley Road, Cambridge, CB3 0ET, UK
2 Center  for Coastal and Ocean Mapping, University of New Hampshire, Durham, NH 03824, USA
3 Department of Geological Sciences, Stockholm University, 106 91 Stockholm, Sweden
4 Bolin Centre for Climate Research, Stockholm University, 106 91 Stockholm, Sweden
5 College of Earth, Ocean, and Atmospheric Sciences, Oregon State University, Corvallis, OR 97331, USA
6 Institute of Arctic and Alpine Research, University of Colorado, Boulder, CO 80309-0450, USA
7 Geological Survey of Denmark and Greenland, Øster Voldgade 10, 1350 Copenhagen K, Denmark
8 Department of Geoscience, Aarhus University, Hoegh-Guldbergs Gade 2, 8000, Aarhus C, Denmark
9 TNO, Geological Survey of the Netherlands, Princetonlaan 6, 3584 CB Utrecht, the Netherlands
10 Rambøll Management Consulting, Hannemanns Allé 53, 2300 Copenhagen S, Denmark

Correspondence: Kelly A. Hogan (kelgan@bas.ac.uk)

Received: 18 July 2019 – Discussion started: 1 August 2019
Revised: 24 November 2019 – Accepted: 29 November 2019 – Published: 28 January 2020

Abstract. Petermann Fjord is a deep ( > 1000 m) fjord that         glacial sediment flux for the former Petermann ice stream as
incises the coastline of north-west Greenland and was carved       1080–1420 m3 a−1 per metre of ice stream width and an aver-
by an expanded Petermann Glacier, one of the six largest out-      age deglacial erosion rate for the basin of 0.29–0.34 mm a−1 .
let glaciers draining the modern Greenland Ice Sheet (GrIS).       Our deglacial erosion rates are consistent with results from
Between 5 and 70 m of unconsolidated glacigenic material           Antarctic Peninsula fjord systems but are several times lower
infills in the fjord and adjacent Nares Strait, deposited as the   than values for other modern GrIS catchments. This differ-
Petermann and Nares Strait ice streams retreated through the       ence is attributed to fact that large volumes of surface wa-
area after the Last Glacial Maximum. We have investigated          ter do not access the bed in the Petermann system, and we
the deglacial deposits using seismic stratigraphic techniques      conclude that glacial erosion is limited to areas overridden
and have correlated our results with high-resolution bathy-        by streaming ice in this large outlet glacier setting. Erosion
metric data and core lithofacies. We identify six seismo-          rates are also presented for two phases of ice retreat and con-
acoustic facies in more than 3500 line kilometres of sub-          firm that there is significant variation in rates over a glacial–
bottom and seismic-reflection profiles throughout the fjord,       deglacial transition. Our new glacial sediment fluxes and ero-
Hall Basin and Kennedy Channel. Seismo-acoustic facies re-         sion rates show that the Petermann ice stream was approxi-
late to bedrock or till surfaces (Facies I), subglacial deposi-    mately as efficient as the palaeo-Jakobshavn Isbræ at erod-
tion (Facies II), deposition from meltwater plumes and ice-        ing, transporting and delivering sediment to its margin during
bergs in quiescent glacimarine conditions (Facies III, IV), de-    early deglaciation.
position at grounded ice margins during stillstands in retreat
(grounding-zone wedges; Facies V) and the redeposition of
material downslope (Facies IV). These sediment units rep-
resent the total volume of glacial sediment delivered to the
mapped marine environment during retreat. We calculate a

Published by Copernicus Publications on behalf of the European Geosciences Union.
262                         K. A. Hogan et al.: Glacial sedimentation, fluxes and erosion rates associated with ice retreat

1   Introduction                                                  and/or have not mapped the sediment stratigraphy in detail.
                                                                  This data gap was addressed by the Petermann 2015 Expe-
The volume and distribution of glacial sediment in fjords is      dition, which collected, in addition to terrestrial, biological
largely a function of the retreat behaviour of the marine-        and oceanographic datasets (Münchow et al., 2016; Heuzé
terminating glaciers that occupy them. This sediment infill       et al., 2017; Lomac-MacNair et al., 2018), a comprehensive
is the final product of material eroded across the catchment      suite of marine geophysical and geological data from Peter-
area, transported to the ice margin by glacial processes and      mann Fjord and the adjacent part of Nares Strait, north-west
ultimately released into fjord basins as grounded ice decays.     Greenland (Figs. 1b, 2) (Jakobsson et al., 2018). Combining
As a result, these sedimentary archives can provide informa-      systematic classification and mapping of the seismic (acous-
tion about both (i) ice-retreat dynamics and (ii) glacial ero-    tic) datasets with seafloor geomorphology provides a means
sion rates and sediment fluxes, that relate to periods of past    to correlate sediment infill with glacidynamic processes lead-
climatic warming and associated glacier retreat. The present      ing to an improved understanding of the Holocene retreat
decay of the Greenland Ice Sheet (GrIS), and its accelerat-       of the Petermann and Nares Strait ice streams (see England,
ing contribution to sea level rise (Chen et al., 2017), is oc-    1999; Jakobsson et al., 2018).
curring predominantly through mass loss from its marine-             This study reconstructs de- and post-glacial sedimentary
terminating outlet glaciers (Mouginot et al., 2019). This will    processes and fluxes in Petermann Fjord and the adjacent
likely enhance glacial erosion rates and, therefore, sediment     stretch of Nares Strait (Fig. 1b) using seismic stratigraphy
influx to the global ocean. This has implications for ma-         and seismo-acoustic facies. The objectives are (1) to map
rine biogeochemical cycles (e.g. Hawkings et al., 2015) and       glacimarine sediment units, interpret their seismic stratigra-
ultimately organic carbon sequestration in fjord sediments,       phy and calculate their volumes; (2) to derive deglacial sed-
which are a known hotspot for carbon burial (Smith et al.,        iment fluxes and erosion rates; (3) to compare our results
2015). Yet we have very few estimates of glacial erosion or       with other high-latitude fjord settings (Northern and South-
sediment fluxes for either the present-day GrIS or for past       ern Hemisphere) considering regional variations; and (4) to
configurations of the ice sheet (Hallet et al., 1996; Overeem     provide geological boundary conditions for numerical glacier
et al., 2017). Obtaining in situ observations of sediment         modelling exercises. This is the first study to employ high-
fluxes close to the margins of Greenland’s major marine-          resolution seismo-acoustic methods with such a high density
terminating glaciers remains logistically difficult. Thus, in-    of survey lines, meaning that the sediment stratigraphy of a
vestigations of the sediment infill of fjords provide an im-      fjord beyond a major Greenland outlet glacier has been re-
portant tool for quantifying rates of glacial erosion and sedi-   vealed and mapped in unprecedented detail. It is also the first
ment transport to the global ocean, as well as for reconstruct-   dataset from the northern part of the landmass. It sheds new
ing glacier behaviour and its drivers beyond the observational    light on glacial erosion rates for Greenland over millennial
record.                                                           timescales and provides quantitative estimates of the sedi-
   Many studies of fjord infill exist for Norwegian, Svalbard     ment flux to the ocean from a major Greenland glacier.
and Alaskan fjords; however, in Greenland, ship-based re-
search is hampered by difficult ice conditions and relatively
remote locations, issues that generally increase in complex-      2     Regional setting
ity further north. Fjords housing major outlet glaciers are of-
ten choked by an ice mélange – a dense pack of calved ice-        2.1    Physiography and hydrography
bergs and sea ice (see Amundsen et al., 2010) – that ren-
ders some fjords almost inaccessible to research vessels. This    Nares Strait is the narrow body of water between north-west
situation is augmented in northern Greenland by persistent        Greenland and Ellesmere Island that opens out northwards
sea-ice cover cementing icebergs together in winter and ex-       in to the Lincoln Sea and Arctic Ocean (Fig. 1). The north-
tending far beyond the coast for up to 11 months of the year      ern part of the strait consists of Robeson Channel, Hall Basin
(DMI, 2018). As a result, there are only a few previous stud-     and Kennedy Channel and is typically around 30 km wide,
ies of marine sediments from northern Greenland that are          400–800 m deep. The Kennedy and Robeson channels have
based on sediment cores (e.g. Jennings et al., 2011, 2019;        generally smooth seafloors, whereas Hall Basin is somewhat
Madaj, 2016; Reilly et al., 2019) and none with extensive or      wider (∼ 40–60 km) and has a notably rougher or fractured
detailed geophysical mapping of the glacial sediment infill       seafloor beyond the mouth of Petermann Fjord (Jakobsson
in fjords. For comparison, some geophysical surveys do ex-        et al., 2018; Fig. 2). The bedrock geology in the area con-
ist from central and southern Greenland fjords that tend to       sists of Precambrian basement rocks capped by Palaeozoic
be ice-free more often (e.g. Uenzelmann-Neben et al., 1991;       platform limestones that have been dissected by two sets of
Andrews et al., 1994; Gilbert et al., 1998, 2002; Ó Cofaigh       approximately orthogonal faults trending NNE–SSW and N–
et al., 2001, 2016; Evans et al., 2002). However, these typi-     S. The Wegener Transform Fault, crossing from Judge Daly
cally have only a small number of survey lines to represent       Promontory to Kap Lupton (Fig. 2) in the study area and ex-
an entire fjord system, show only a few profiles as exemplars     tending northwards in Nares Strait (Dawes, 2004; Tessen-

The Cryosphere, 14, 261–286, 2020                                                      www.the-cryosphere.net/14/261/2020/
K. A. Hogan et al.: Glacial sedimentation, fluxes and erosion rates associated with ice retreat                                    263

Figure 1. Maps of Greenland and the study area. (a) Location of Petermann Glacier and Nares Strait. (b) Location of the study area (red
box; Fig. 2) in Petermann Fjord and the adjacent Nares Strait including Hall Basin (HB), Kennedy Channel (KC) and Robeson Channel
(RC); JDP is Judge Daly Promontory. Ice flow in marine areas (black arrows) and deglacial ice-sheet margins for the early Holocene (9.3,
∼ 8.7 and ∼ 7.6 ka cal BP) are also shown for Nares Strait and were compiled from England (1999), Georgiadis et al. (2018) and Jakobsson
et al. (2018). Dashed lines outside of this area are from Young and Briner (2015) and references therein.

sohn et al., 2006), provides a strong structural control on           gins and enhances frontal melting (Holland et al., 2008; Rig-
seafloor morphology in Hall Basin (Jakobsson et al., 2018).           not et al., 2010; Johnson et al., 2011; Straneo et al., 2012;
   Petermann Fjord is a deep (> 1000 m), relatively flat-             Heuzé et al., 2017; Cai et al., 2017). Furthermore, AW was
bottomed fjord with a straight planform shape that is 15–             present in Hall Basin during deglaciation and may have pro-
20 km wide. The fjord walls have steep gradients (> 70◦ )             moted grounded ice retreat during deglaciation (Jennings et
resulting in a box-like cross section. The most prominent             al., 2011).
bathymetric feature of the fjord is a sill at the fjord mouth
rising to between 350 and 450 m water depth but with its              2.2   Late Weichselian to Holocene glacial history
deepest part (443 m) about 2 km west of the midline of the
fjord mouth (Jakobsson et al., 2018). Modified Atlantic Wa-           During the Last Glacial Maximum (LGM), the ice sheet in
ter (AW) flows into both Nares Strait and Petermann Fjord             northern Greenland was coalescent with the Innuitian Ice
from the Lincoln Sea (Münchow et al., 2016; Johnson et al.,           Sheet over Ellesmere Island (England, 1999; England et al.,
2011) but is overlain by a cooler, fresher water mass (Arc-           2006), and grounded ice occupied Nares Strait. The distri-
tic Water) that is also advected into the fjord (Straneo et al.,      bution and magnitude of isostatic rebound in the area sug-
2012). Oceanographic results from the Petermann 2015 Ex-              gests that ice was at least 1 km thick in the strait, and terres-
pedition have shown that water in the fjord is dominated by           trial landforms indicate that Greenland ice extended across
Atlantic Water at depth (450–600 m) which does not inter-             to the eastern side of Ellesmere Island (England, 1999). Ice
act with the 40 km long floating ice tongue over the fjord            is thought to have been distributed northward and south-
but is thought to reach the grounding line and contribute to          ward from Kane Basin in the central Nares Strait (Fig. 1b),
melting there (Münchow et al., 2016; Heuzé et al., 2017).             with deglaciation of the strait occurring from its northern
Meltwater from Petermann Glacier was also recorded in all             and southern ends from 11.3 and 11.7–11.2 ka cal BP, re-
46 hydrographic casts collected in 2015 in the fjord and in           spectively (recalibrated from England, 1999; Jennings et al.,
Nares Strait, with meltwater exiting the fjord on its north-          2019). A sediment core from the north-eastern Hall Basin in-
ern side at water depths of 100–300 m (Heuzé et al., 2017).           dicates that this area, in front of Petermann Fjord, was free
The present-day retreat of Greenland’s marine-terminating             from grounded ice by 9.7 ka cal BP and was experiencing dis-
glaciers, including Petermann Glacier, has been partly at-            tal glacimarine conditions by 8.9 ka cal BP (Jennings et al.,
tributed to warming of the AW that reaches the ice mar-               2011). Further south, dates from a core in Kane Basin show
                                                                      that it had deglaciated around 9.0 ka cal BP (Georgiadis et

www.the-cryosphere.net/14/261/2020/                                                            The Cryosphere, 14, 261–286, 2020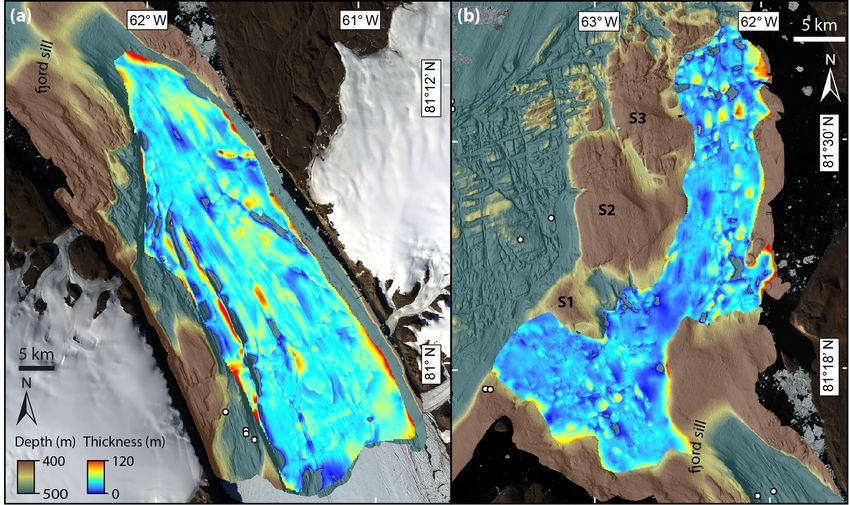
264                           K. A. Hogan et al.: Glacial sedimentation, fluxes and erosion rates associated with ice retreat

Figure 2. The locations of SBP profiles (red dashed), 2015 AG profiles (black) and 2001 legacy AG profiles (grey) shown over the gridded
multibeam bathymetry for the area. S1–S4 are the bathymetric highs described by Jakobsson et al. (2018) and referred to in the text. UN
is unnamed glacier; BGl is Belgrade Glacier. Glacial lineations denoting the former directions of ice flow are shown as black arrows (after
Jakobsson et al., 2018). Sediment cores used to correlate seismo-acoustic facies with sediment lithofacies are also shown.

al., 2018) (Fig. 1b). Owing to uncertainties in the reservoir           striae and erratics, probably resulted in an ice stream in Nares
corrections for the area and differences in the material dated          Strait (England et al., 2006). This flow pattern is supported
for deglacial ages, there is still some debate as to when the           by recent mapping of submarine landforms including mega-
ice saddle between north-west Greenland and Ellesmere Is-               scale glacial lineations (MSGL) in the Kennedy and Robeson
land disintegrated. However, a recent study by Jennings et              channels which indicate northward movement of fast-flowing
al. (2019) discussed this issue in detail and concluded that            grounded ice in the strait, most likely representing the late
the strait could have opened as early as 9.0 ka cal BP or as            deglacial imprint of grounded ice activity (Jakobsson et al.,
late as 8.3 ka cal BP.                                                  2018). A change in lineation orientation close to the mouth of
   Reconstructions of full-glacial ice flow in the area include         Petermann Fjord was interpreted as a signature of ice exiting
north-eastward flow out of Nares Strait contributing to east-           the fjord and merging with ice flow in Nares Strait causing a
ward flow of ice along the north Greenland coastal plain                slight deflection in the flow pattern (Jakobsson et al., 2018).
(Möller et al., 2010; Larsen et al., 2010; Funder et al., 2011).           By combining terrestrial evidence with the submarine
North of Kane Basin, strong convergent flow from the In-                landform record, Jakobsson et al. (2018) suggested the fol-
nuitian and Greenland ice sheets, as evidenced by glacial               lowing sequence of events for the deglaciation of the north-

The Cryosphere, 14, 261–286, 2020                                                              www.the-cryosphere.net/14/261/2020/
K. A. Hogan et al.: Glacial sedimentation, fluxes and erosion rates associated with ice retreat                                265

ern Nares Strait and Petermann Fjord (see Fig. 1b for lo-          side echoes and the scattering of acoustic energy resulted
cation). All ages were inferred by correlating the mapped          in returned reflections being diffuse; and (ii) a rugged and
marine landforms to dated ice margins on land by Eng-              hard seafloor generated numerous sidewall echoes and hy-
land (1999). Since the ice margins on land were presented as       perbolae. Line spacing was generally as low as 600 m and
uncalibrated 14 C years BP (England, 1999), the calibration        rarely exceeded 2.5 km. The multidisciplinary nature of the
to calendar years was made by Jakobsson et al. (2018) using        expedition required an abundance of sampling stations and,
the Marine13 radiocarbon age calibration curve (Reimer et          in turn, resulted in numerous crossing lines and multiple
al., 2013) and a 1R = 268 ± 82 years.                              transects of key areas (Fig. 2). The nature of deeper sedi-
   At 9.3 ka cal BP (1σ range: 9440–9140 cal BP) the retreat-      ments and bedrock structure was studied using 10 AG pro-
ing ice margin was grounded between Kap Lupton and the             files (Fig. 2) acquired with a single airgun source (210 in.3
Judge Daly Promontory (Fig. 1b) along a prominent bathy-           (3.4 L) generator injection (GI) gun with a firing interval of
metric shoaling (S4 on Fig. 2). At this time, there is evidence    5 s and a record length of 3 s). The streamer had a total active
for abundant meltwater release and ice stagnation on the east-     length of 300 m with 48 hydrophone groups (8 hydrophones
ern side of Hall Basin. By 8.7 ka cal BP (1σ range: 8835–          each) and was towed at depths of 7–16 m. Navigation for the
8459 cal BP) the ice margin is thought to have retreated to the    SBP profiles was taken directly from the ship’s Seatex Sea-
mouth of Petermann Fjord where it rested on the prominent          path 320 GPS feed. Motion correction of the SBP data was
fjord-mouth sill (Fig. 1b) and was probably fronted by an ice      applied using information provided by the installed Seatex
tongue. A significant sedimentary wedge – a grounding-zone         MRU5 motion reference unit. For the AG profiles, a separate
wedge (GZW) – built up on the sill and reinforced ice-margin       Thales DG16 GPS system was used to calculate positions
stability at this location (see Alley et al., 2007; Dowdeswell     and offset geometries for the ship, source and hydrophones.
and Fugelli, 2012). The ice margin subsequently lost its ice       Heritage seismic-reflection profiles acquired in 2001 were
shelf and retreated down the backside of the sill as a tide-       also available and were used to investigate the character of
water glacier cliff, possibly due to catastrophic calving by       key glacial landforms. These data were acquired by Bunde-
a process termed marine ice cliff instability (Pollard et al.,     sanstalt für Geowissenschaften und Rohstoffe (BGR) using
2015). Based on terrestrial dates this is inferred to have oc-     six GI guns and a 48-channel array (24 hydrophones each) in
curred around 7.6 ka cal BP (1σ range: 7740–7495 cal BP),          a 100 m long streamer (shortened due to ice conditions). De-
after which the retreat of grounded ice through the remainder      tails of the acquisition and processing of this dataset (2001
of the fjord was rapid. Recent sedimentological work sug-          BGR lines on Fig. 2) are provided in Jackson et al. (2006).
gests that the fjord was probably not covered by a floating            Processing of the SBP data involved calculation of in-
ice tongue directly after this rapid retreat of the grounded Pe-   stantaneous amplitudes from the correlated SBP 120 output
termann ice stream (which became Petermann Glacier), for           which were then visualized as variable density traces in open-
around 5000 years in the mid-Holocene (Reilly et al., 2019).       source software (dGB Earth Sciences OpendTect v6.4.0).
The modern glaciologic setting, which includes a 40 km long        The 2015 AG profiles were processed using standard pro-
floating tongue, did not develop until ca. 2.2 ka cal BP (Reilly   cessing techniques including geometry definition, amplitude
et al., 2019).                                                     correction and bandpass filtering preserving data in the fre-
                                                                   quency range of 40–350 Hz. Frequency–wavenumber (FK)
                                                                   filtering was applied in order to remove propeller noise. After
3     Data and methods                                             CDP (common depth point) stacking and migration, a gentle
                                                                   trace mix and automatic scaling was also applied. The out-
3.1    Geophysical datasets                                        put AG data were interpreted in Petrel 2015 and OpendTect.
                                                                   The seismic datasets were analysed alongside a gridded 3-D
Two primary geophysical datasets were used in this                 surface of the seafloor produced from high-resolution bathy-
study: high-resolution, sub-bottom profiles (SBP) and air-         metric data also acquired during the Petermann 2015 Expedi-
gun seismic-reflection profiles (AG), both collected during        tion. The bathymetric data were collected using a Kongsberg
the Petermann 2015 Expedition to the Petermann Fjord and           EM122 (12 kHz) multibeam echosounder with a 1◦ (TX)
Nares Strait area in 2015 on the Icebreaker (IB) Oden. More        ×1◦ (RX) array. Data coverage and water depths in the area
than 3100 line kilometres of SBP were acquired using the           resulted in the final grid having 15 m square grid cells. De-
hull-mounted parametric Kongsberg SBP 120, which trans-            tailed information and interpretation of the multibeam bathy-
mits a low-frequency (2.5–7 kHz) chirp pulse with a narrow         metric dataset is presented in Jakobsson et al. (2018).
(3◦ ) main beam. Vertical resolution of the SBP profiles is ap-
proximately 0.35 ms (∼ 70 cm using a sediment velocity of          3.2   Seismic data interpretation
1500 m s−1 ). Penetration was up to 60 m in unlithified sedi-
ments, and the quality of the SBP data was generally good,         All output profiles are in two-way travel time (TWT).
although frequently influenced by noise from ice breaking.         Seismo-acoustic facies were identified primarily from SBP
Two artefacts are prominent in the data: (i) on steep slopes,      profiles based on reflection geometry, reflection strength and

www.the-cryosphere.net/14/261/2020/                                                        The Cryosphere, 14, 261–286, 2020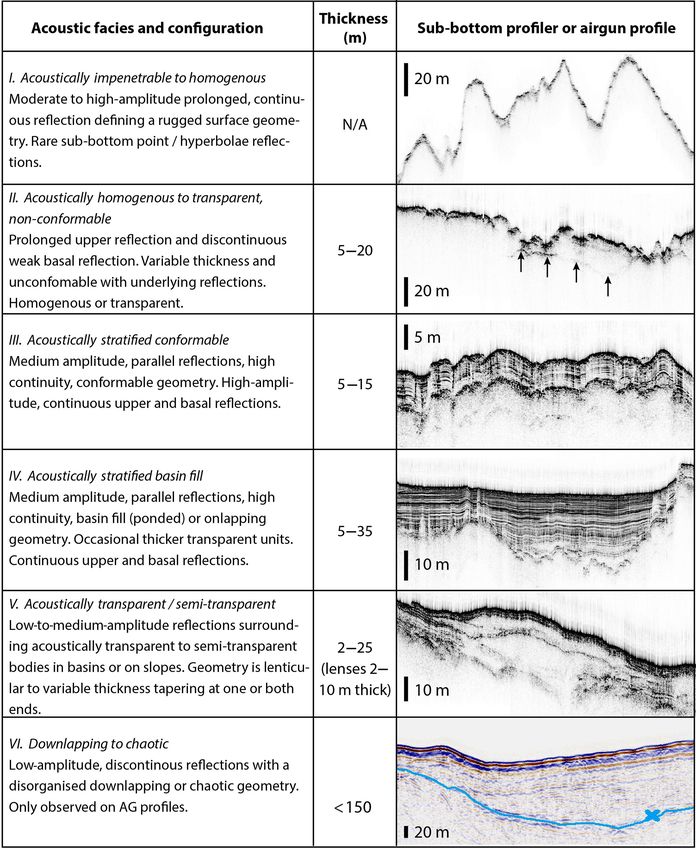
266                         K. A. Hogan et al.: Glacial sedimentation, fluxes and erosion rates associated with ice retreat

continuity; these were cross-checked on AG profiles and one       3.3   Glacial volumes, fluxes and erosion rates
additional facies (IV) was identified only on AG profiles.
For the SBP data, the profiles were inspected and a coherent      In high-latitude fjords and glacial troughs beyond the coast-
and continuous, high-amplitude reflection (R1) at the base of     line, the unlithified sediment accumulation may be taken to
the uppermost unlithified sediment package (often marking         represent material deposited since these areas were last occu-
the acoustic basement) was identified and digitized (Fig. 3a,     pied by grounded ice, during ice retreat following the LGM
c). In general, this reflection was picked manually because       (e.g. Aarseth, 1997; Gilbert et al., 1998; Hjelstuen et al.,
auto-tracking methods in OpendTect could not be used due          2009; Hogan et al., 2012; Bellwald et al., 2016; Callard et al.,
to the variable penetration of the SBP 120, the rugged na-        2018; Neilsen and Rasmussen, 2018). This glacimarine sedi-
ture of the reflection, the noise artefacts noted above and       mentation has two components (Fig. 4). The first component
some limitations with the 2-D picking algorithm. R1 picks on      is coarse or mixed material delivered to the grounding zone
SBP profiles were supplemented and verified by the deeper-        subglacially but deposited seaward of there by gravity-flow
penetrating AG lines (Fig. 3b, d). R1 picks were gridded to       processes (dark grey on Fig. 4); the second is predominantly
make separate 3-D surfaces for Petermann Fjord and Nares          fine-grained units (with some coarser particles) that settle
Strait, based on the separation of these areas by the shallow     out from meltwater plumes within several tens of kilome-
sill at the fjord mouth (over which the unlithified sediments     tres from the grounding line (“plumites”; Hesse et al., 1997;
disappear on SBP profiles) and the known glacial history          yellow on Fig. 4) and as ice-rafted debris (IRD). Here, we
of the area (see Sect. 2.2). Isopach maps for the unlithified     have mapped total glacimarine sediment volumes for the Pe-
sediment package were produced by subtracting the depth-          termann Fjord–Nares Strait system and then used these vol-
converted R1 surface from the multibeam bathymetric digi-         umes to calculate glacial sediment fluxes and erosion rates.
tal elevation model of the seafloor; in general, stratigraphic       We make two adjustments to the mapped volumes before
thicknesses in metres in this study have been calculated using    calculating sediment fluxes and erosion rates. First, we as-
a sediment sound velocity of 1500 m s−1 (see Nygård et al.,       sume that our marine study areas were fully excavated (to
2007; Hjelstuen et al., 2009; Hogan et al., 2012). Key glacial    bedrock) by grounded ice during the previous glacial event.
landforms, predominantly GZWs in this case, were also iden-       This assumption is required because we are not able to dis-
tified and mapped on the AG and SBP profiles because these        tinguish pre-LGM sediments in our data even though we
landforms indicate former grounding-line locations. Signif-       acknowledge that older (pre-LGM) sediment is sometimes
icantly, when they are tied with deglacial chronology, these      preserved in these settings (e.g. Hooke and Elverhøi, 1996;
landforms can be used to calculate sedimentary processes as-      Aarseth, 1997; O’Regan et al., 2017; Jennings et al., 2019).
sociated with specific time periods and stillstand events (e.g.   This assumption is justified by theoretical studies of glacial
Callard et al., 2018; Nielsen and Rasmussen, 2018). Base          erosion/sediment transport, which are based on observations,
GZW reflections were digitized where AG profiles exist over       that most often suggest that fjords are rapidly and fully exca-
these features and where they were visible on SBP profiles.       vated during glacial advances (Powell, 1984; Aarseth, 1997;
These were gridded using the surface splines in the tension       Hjelstuen et al., 2009). Likewise, this assumption is usually
algorithm in GMT (Smith and Wessel, 1990), converted to           applied to studies of fjord sediment volumes used to calculate
depth below the seafloor, and used to calculate GZW vol-          glacial erosion rates (e.g. Powell et al., 1991; Hunter, 1994;
umes. For the GZWs, volumes were calculated with sediment         Hallet et al., 1996). We derive some support for this assump-
velocities of 1500 m s−1 but also with the higher value of        tion from the seafloor morphology of Petermann Fjord and
1800 m s−1 . The latter value is based on previous estimates      Hall Basin. Ice-sculpted bedrock surfaces of probably LGM
of velocities in subglacial tills from (over-ice) seismic data    age are clearly visible across much of the area (Jakobsson
(e.g. Smith, 1997; Tulaczyk et al., 1998; King et al., 2004),     et al., 2018), indicating that significant pre-LGM sediments
including recent measurements from Greenland (Hofstede et         most likely do not remain in the fjord. We also note that, al-
al., 2018) and on the measured physical properties of coarse      though it is possible for pre-LGM sediments to be present,
shelf sediments including diamictons (e.g. Hamilton, 1969;        if they are too deep to be resolved on our SBP profiles then
Cochrane et al., 1995). Thus, for GZW thicknesses and vol-        they have not been included in our volume estimates. Fur-
umes, a range of values is given.                                 thermore, if they are preserved as the lowermost part of the
    Three sediment cores acquired during the Petermann 2015       stratigraphy (i.e. most likely in basins), they are probably
Expedition and one previously published core (Table 1; lo-        not volumetrically significant because there are relatively few
cations in Fig. 2) were used to correlate seismo-acoustic fa-     basins containing thick sediments in the area (e.g. Fig. 12).
cies with lithofacies. The correlation was based on compar-       Still, we acknowledge this potential source of error in our
ing SBP profiles at individual core sites with core CT scans,     estimations. Second, we elect to remove 0.5 m of sediment
photographs and descriptions. Full descriptions of the meth-      cover for all mapped areas because dates from nearby sedi-
ods used to acquire the cores and the CT scans can be found       ment cores reveal that the upper ∼ 0.5 m of the stratigraphy
in Reilly et al. (2017, 2019).                                    was deposited after the ice margin had retreated into the fjord
                                                                  (Jennings et al., 2011, 2018); essentially, these uppermost

The Cryosphere, 14, 261–286, 2020                                                      www.the-cryosphere.net/14/261/2020/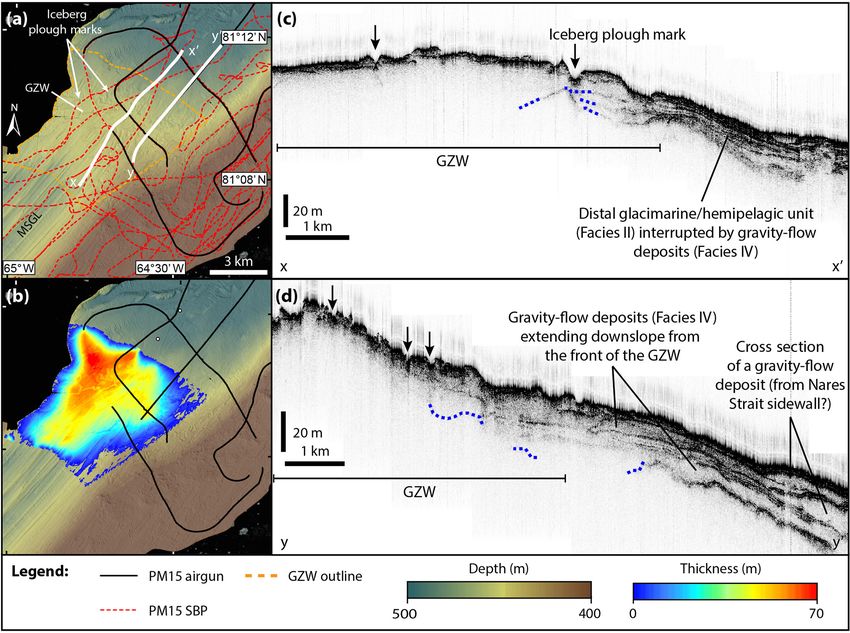
K. A. Hogan et al.: Glacial sedimentation, fluxes and erosion rates associated with ice retreat 267
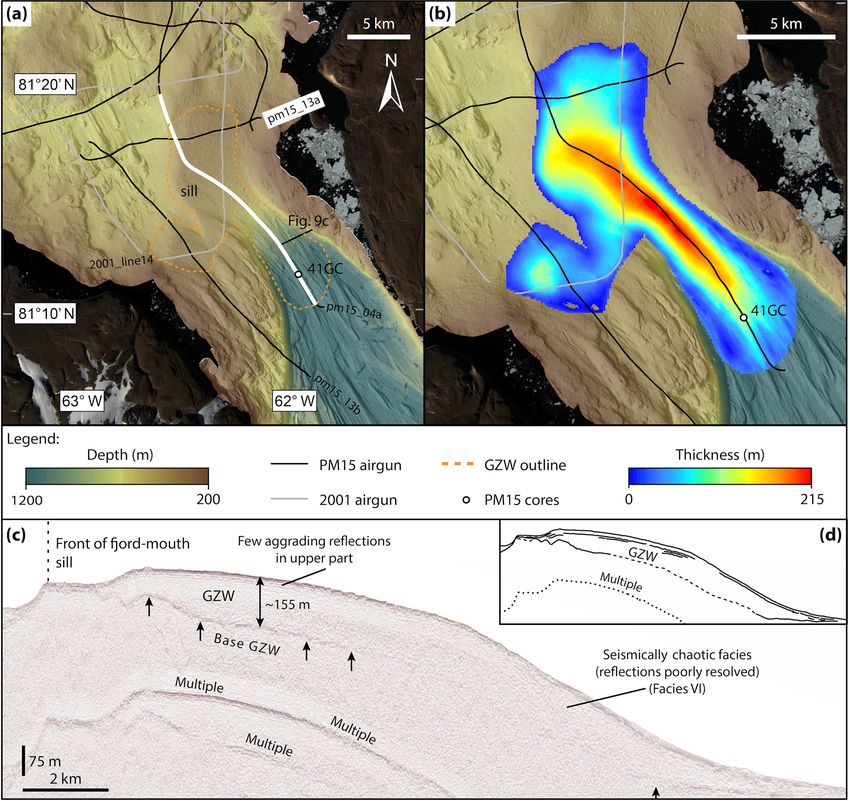
Figure 3. Comparison of SBP profiles with coincident AG profiles showing the mapped basal reflector (R1) on SBP profiles and the cor-
responding reflector (green) on AG profiles. Dotted lines mark the lowermost reflections on each profile; dotted lines and question marks
indicate the uncertainty in mapping of the unlithified sediment package over basement. Sub-bottom reflections may be geological boundaries
in sedimentary bedrock in Hall Basin. (a) SBP profile acquired on 11 August 2015 in Hall Basin, coincident with AG profile pm15_07 (b).
(c) SBP profile from 18 August 2015 also in Hall Basin, coincident with AG profile pm15_12 (d). The location of profiles is shown in Fig. 2;
the intersection of Fig. 6b with panels (c) and (d) is shown as vertical grey dashed line.
Table 1. Core locations and acquisition information for cores used in seismo-acoustic facies and lithofacies correlations.
Core name Latitude Longitude Water depth Length Cruise/reference
(◦ N) (◦ W) (m) (cm)
OD1507-37PC 80.96575 60.95450 1041 847.6 Petermann 2015 Expedition
OD1507-41GC 81.19378 61.97715 991 440 Petermann 2015 Expedition
OD1507-52PC 81.24183 63.99833 517 541 Petermann 2015 Expedition
HLY0301-05GC 81.62143 63.25778 797 371 HLY0301/Jennings et al. (2011)
www.the-cryosphere.net/14/261/2020/ The Cryosphere, 14, 261–286, 2020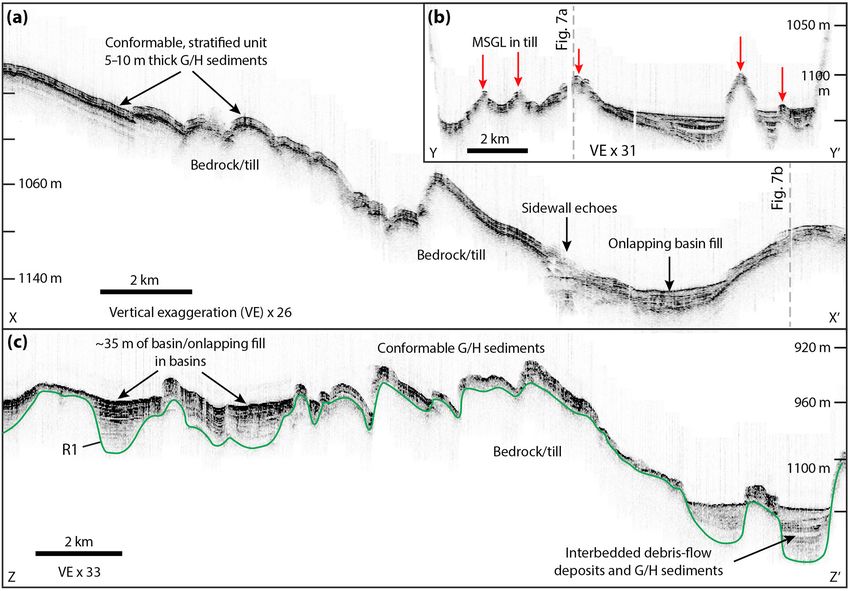
268                           K. A. Hogan et al.: Glacial sedimentation, fluxes and erosion rates associated with ice retreat

Figure 4. Processes of glacimarine sedimentation at the marine-terminating margin of a Greenland outlet glacier (no ice shelf/tongue). The
related seismo-acoustic facies as mapped in the Petermann–Nares Strait system are shown at the bottom of the figure.

sediments are not associated with a nearby ice margin. We
also assume that other sediment sources (biogenic, aeolian,
sidewall erosion) are volumetrically insignificant, which is           E = VolRx / (Adr × T ) ,                                       (1)
typically the case in polar fjord settings (Powell, 2005). This
is supported by total organic carbon (TOC) measurements                where VolRx is the volume of (dry) rock; Adr is the effec-
on core tops from the area that return extremely low percent-          tive drainage basin area (in km2 ); and T is the time for sedi-
ages of TOC ( 0.5 %) (Anne Jennings, personal commu-                  ment accumulation (in years), in effect the time since ice was
nication, 2019), as well as by the lack of widespread flow             near enough to supply sediment to the area concerned. Ero-
deposits in the fjord or in Hall Basin (e.g. Figs. 7–9).               sion rates are calculated for the erosion of lithified rock and,
   Ultimately, glacial sediment fluxes are calculated simply           therefore, our wet sediment volumes had to be converted to
by dividing the total glacial sediment volume by the time that         dry rock volumes (VolRx ). This was done using a wet density
the ice margin was supplying sediment to the area, which is            (ρsed ) of 1850 kg m−3 for the sediments (based on measured
taken from existing deglacial chronologies. In order to com-           density values from Petermann 2015 Expedition cores) and a
pare to previous estimates of glacial sediment flux, this num-         density (ρsource ) of 2700 kg m−3 for the source rocks (a com-
ber is further divided by the ice stream width to return a             monly used density for parental rock types gneiss and lime-
sediment flux per ice stream width (see Alley et al., 1989).           stones, following Andrews et al., 1994 and Fernandez et al.,
Grounding-line lengths, which are the same as the ice stream           2016).
width, were measured along the fronts of the Petermann
GZW from the multibeam bathymetric surface. Chronologi-
                                                                       4     Results and interpretation
cal information follows the deglacial reconstructions of Eng-
land (1999) and Jakobsson et al. (2018); 1σ uncertainties in
                                                                       4.1    Seismo-acoustic facies and depositional
the ages for the Jakobsson et al. (2018) ice margin positions
                                                                              environments in Petermann Fjord and Nares Strait
are used to provide an error bar on the calculated fluxes (see
Sect. 4.5).                                                            We identify six seismo-acoustic facies in Petermann Fjord
   Glacial erosion rates were calculated by applying the               and the adjacent area of Nares Strait (Fig. 5) and correlate
methodology outlined in Fernandez et al. (2016) to our vol-            these with core lithologies where possible. Seismo-acoustic
umetric results to calculate the average basin- and time-              Facies I (bedrock), II (subglacial till) and VI (GZW units),
averaged erosion rates (E) through                                     as defined below, were not recovered by either piston or
                                                                       gravity cores, generally because they were too deep in the

The Cryosphere, 14, 261–286, 2020                                                             www.the-cryosphere.net/14/261/2020/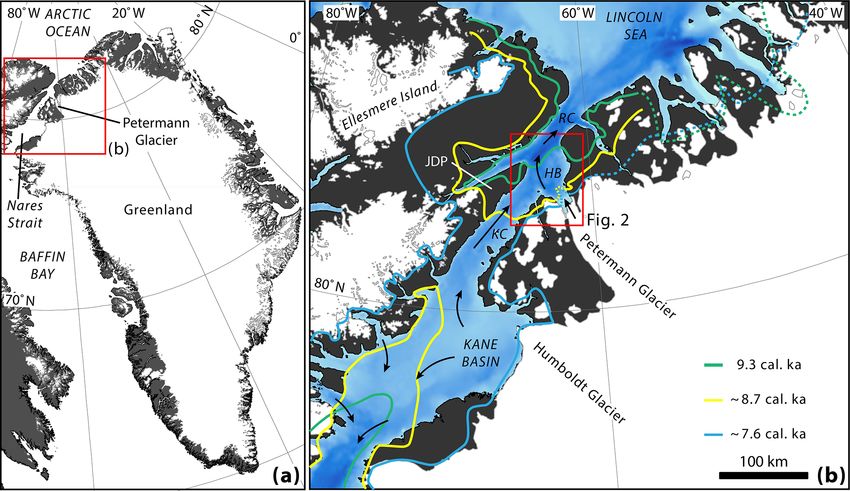
K. A. Hogan et al.: Glacial sedimentation, fluxes and erosion rates associated with ice retreat                                269

stratigraphy to be sampled or are not able to be sampled by             interpreted as distal glacimarine sediments with the
these types of coring devices (i.e. bedrock). Therefore, only           transitional unit reflecting the breakup of ice in Nares
seismo-acoustic Facies III, IV and V were correlated with               Strait and Kennedy Channel (Jennings et al., 2011).
sediment lithofacies (Fig. 6). The seismo-acoustic facies are
described as follows.                                               IV. Acoustically stratified basin or onlapping fill. This fa-
                                                                        cies also comprises parallel to sub-parallel, continu-
  I. Acoustically impenetrable to homogenous facies. This               ous, high- to medium-amplitude reflections either in
     facies is represented by a high-amplitude, prolonged re-           a ponded basin-fill geometry (reflections terminate at
     flection defining a rugged surface with rare sub-bottom            basin sides) or in an onlapping fill geometry (reflec-
     point and diffraction hyperbolae on slopes. It marks the           tions curve up the flanks of basins). It can include
     base of the acoustic stratigraphy on SBP profiles, and             acoustically transparent bodies, usually several metres
     we interpret it to be bedrock or a till surface. The SBP           thick that pinch out laterally. This facies is interpreted
     data alone do not allow us to differentiate between these          as a combination of suspension settling of glacima-
     two types, but by correlating with AG lines where the              rine and hemipelagic sediments and gravity-flow de-
     seismic basement is reached we can identify this fa-               posits (GFDs) forming the acoustically transparent bod-
     cies as bedrock in Hall Basin. However, in areas where             ies (see Facies V) made up of material redeposited into
     glacial lineations (which are formed subglacially in de-           basins from nearby slopes. Core OD1507-37PC pene-
     forming till) are present, the upper reflection of this unit       trated Facies IV (Fig. 6g) in Petermann Fjord in a basin
     is interpreted to be a till surface (e.g. Fig. 7b).                around 2 km from the ice-tongue margin as it was in
                                                                        2015 (Fig. 2). It sampled grey-brown clay with dis-
 II. Acoustically homogenous, non-conformable facies.                   persed clasts interrupted by multiple coarse, sand units
     This unit has a strong, prolonged upper reflection and a           (typically < 10 cm thick) that are normally graded and
     lower-amplitude basal reflection that can be discontinu-           have sharp basal contacts (Fig. 6c). The clay with clasts
     ous. It is acoustically homogenous and shows a varying             is interpreted as glacimarine sediments with IRD, and
     thickness that is not conformable with the basal reflec-           the individual sand units have properties consistent with
     tion or underlying units. In areas where this unit is cor-         gravity-flow deposits (i.e. erosive at their base and grad-
     related with MSGL it is interpreted as a subglacial till           ing upwards; e.g. Bøe et al., 2004; Gilbert et al., 2002).
     layer (see Ó Cofaigh et al., 2005); where this unit oc-            Although such thin sand units may not be resolved in
     curs on seafloor highs in Nares Strait it is interpreted as        the acoustic SBP data over the core site, this lithofacies
     an iceberg-ploughed or current-reworked facies based               supports our interpretation of the seismo-acoustic facies
     on correlation with iceberg plough marks on the multi-             as glacimarine units with interbedded GFDs.
     beam bathymetric data.
                                                                     V. Acoustically transparent facies. Multiple reflectors in
III. Acoustically stratified, conformable facies. This is char-         Kennedy Channel comprise this facies in lens-shaped
     acterized by parallel to sub-parallel, continuous, high-           or tapered bodies on slopes. This facies is also present
     to medium-amplitude reflections with conformable ge-               in local basins where it often pinches out towards the
     ometries. It is typically 5–15 m thick. We interpret this          basin flanks, both in Petermann Fjord and Hall Basin.
     facies as glacimarine and/or hemipelagic sediments pri-            The lensoid and pinching-out geometries of these units,
     marily deposited via suspension settling (with variable            their erosion of underlying sediments and their acousti-
     IRD) in an ice-distal setting. Support for this inter-             cally transparent nature are characteristic of GFDs (see
     pretation comes from lithofacies correlation with the              Laberg and Vorren, 2000; Hjelstuen et al., 2009). Core
     upper part of core OD1507-41GC from Petermann                      OD1507-52PC (Fig. 6d) was recovered from a stratig-
     Fjord and core HLY03-05GC which samples the fa-                    raphy that included discrete lenticular bodies (Fig. 6h),
     cies from Robeson Channel just beyond the S4 ridge                 and it sampled laminated muds interbedded with di-
     (Fig. 2). The upper part of core OD1507-41GC recov-                amictic units with sharp contacts consistent with sedi-
     ered a brown, homogeneous clay with dispersed sand                 ment flow deposits consisting of glacigenic debris (see
     and clasts (Fig. 6a, e) consistent with distal glacimarine         Laberg and Vorren, 2000). Note that the individual di-
     sediments deposited largely from suspension with dis-              amictic units in the core are not resolved in the SBP data
     persed IRD (see Elverhøi et al., 1989; Powell and Do-              as discrete reflections.
     mack, 2002) and also described in cores from the fjord
     by Reilly et al. (2019). The sedimentology of HLY03-           VI. Downlapping to chaotic facies. This facies is only seen
     05GC was described by Jennings et al. (2011), who                  on the AG profiles over the GZWs in the area. It con-
     identified bioturbated muds from the core top to 112 cm,           sists of low-amplitude chaotic point reflections and rare
     a transitional laminated pebbly mud unit from 112 to               discontinuous, sub-parallel reflections forming either a
     125 cm, and a laminated mud unit from 125 cm to the                layered or downlapping pattern. The location of this
     base of the core (Fig. 6b, f). The laminated units were            facies at a known GZW location (Jakobsson et al.,

www.the-cryosphere.net/14/261/2020/                                                        The Cryosphere, 14, 261–286, 2020
270 K. A. Hogan et al.: Glacial sedimentation, fluxes and erosion rates associated with ice retreat
Figure 5. Seismo-acoustic facies identified from SBP profiles and AG profiles in Petermann Fjord and Nares Strait. Seismo-acoustic Facies
I–V mapped primarily on SBP profiles and checked with AG profiles; Facies VI mapped only from AG profiles.
2018) and its seismic character are consistent with its 4.2 Glacimarine sediment infill in Petermann Fjord
interpretation as subglacial till forming a GZW on a and Nares Strait
bathymetric high (e.g. Anderson, 1999; Dowdeswell
and Fugelli, 2012). Deposition most likely occurred via The deepest part of Petermann Fjord, lying inside of (SE of)
subglacial plastering (aggradation) on the ice-proximal the mouth sill within the steep sidewalls (up to 70◦ slopes),
slope of the wedge and proglacially (i.e. seaward of is generally draped by a 5–15 m unit of Facies III (Figs. 5,
the grounding line) via small gravity flows on the ice- 7). This unit conformably overlies the rugged surface of Fa-
distal slope (progradation). These processes probably cies I (Fig. 5). The seafloor morphology of the fjord bottom,
occurred asynchronously with aggradation during ad- which comprises relatively flat-lying parts separated by steep
vance of the grounding line over the sill and prograda- steps and has been strongly sculpted by ice (Jakobsson et al.,
tion only occurring when the grounding zone was on the 2018), suggests that the basal reflection here usually repre-
sill. Thus, the GZW on the sill may be more of a com- sents bedrock. In the few small areas where glacial lineations
bined morainal bank with GZW on its upper part, rather have been identified (e.g. around 61◦ 390 W, 81◦ 03.50 N), the
than a wedge-shaped GZW in its traditional form. basal reflection on SBP profiles represents a subglacial till
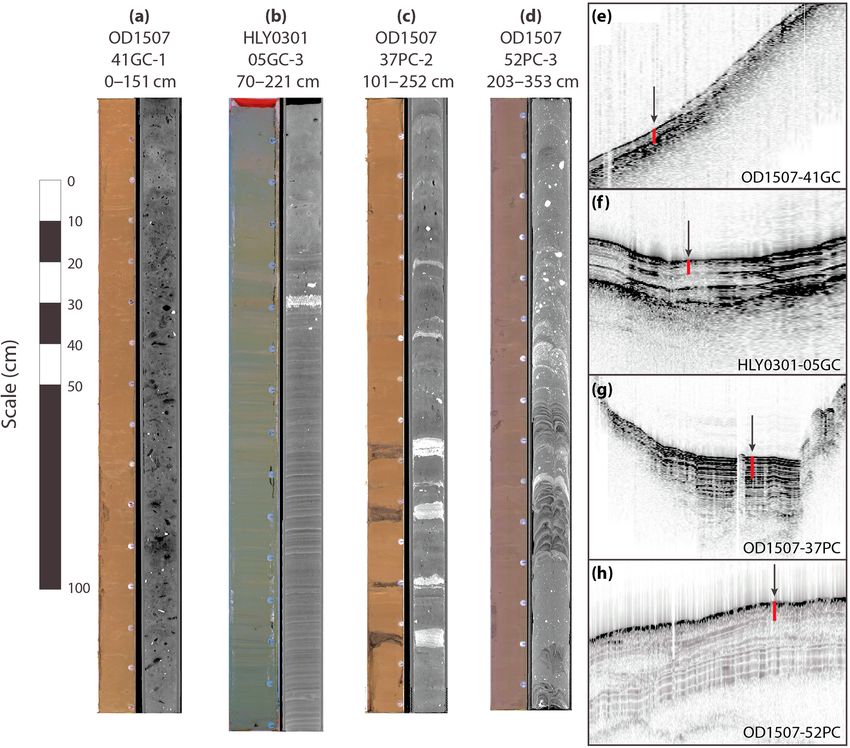
The Cryosphere, 14, 261–286, 2020 www.the-cryosphere.net/14/261/2020/K. A. Hogan et al.: Glacial sedimentation, fluxes and erosion rates associated with ice retreat 271 Figure 6. Correlation of core lithofacies with seismo-acoustic Facies III (a, b, e, f), IV (c, g) and V (d, h). Core lithofacies are shown using CT scans (dark: lower density; light: higher density) and core photographs; seismo-acoustic facies at each core site are shown in panels (e)– (h). Note the coring artefact in core OD1507-52PC with layers bent down at the sides. The red bars in panels (e)–(h) represent the total core length for each core (using a velocity through sediment of 1500 m s−1 ); core locations are shown on Fig. 2. surface (Fig. 7b). On the terraces on the western side of the the SBP profiles do not penetrate the fan deposits and we do fjord, bedrock is covered by about 5 m of draped Facies III not have AG profiles in this area. overlying a thin unit of Facies II; these are interpreted as In the Hall Basin area of Nares Strait, between the Peter- glacimarine and/or hemipelagic sediments overlying a plas- mann fjord-mouth sill and the S2 high (Fig. 2), the seafloor tered till unit. deepens to 500–620 m and includes several small basins (1 to On the eastern side of the fjord and in some places in the > 10 km2 ), sometimes interconnected and expressed as flat mid-fjord area, about 25 km from the 2015 ice tongue mar- areas of seafloor interrupted by rugged seafloor highs. The gin, local basins in the bedrock surface are filled with at least highs comprise Facies I, are variously ice sculpted (Jakob- 35 m of stratified sediments (Fig. 7c). This basin fill is typ- sson et al., 2018) and are easily interpreted as bedrock. In ically ponded in basins in the central part of the fjord and the basins, the unlithified sediment package consists of strat- has an onlapping geometry with relatively more transpar- ified basin fill with GFDs (Facies IV) up to 45 m thick. Be- ent subunits in basins on the eastern side of the fjord (Fa- tween basins, bedrock is mantled by 10–15 m of Facies III. cies IV; Fig. 6g). We interpret these both as glacimarine and Together these units are interpreted to be the product of rain- hemipelagic sediments with the onlapping fill including in- out of glacimarine and hemipelagic material that forms con- terbedded GFDs promoted by increased sediment input from formable layers over bedrock where slopes are relatively gen- two small glaciers entering the fjord there (Belgrade Glacier tle but is focused into basins by redeposition from nearby and unnamed glacier; Fig. 2). Some basins in the central fjord slopes (gradients up to 20◦ ). The largest flow deposits are also contain sediment gravity-flow deposits (Fig. 5b) pre- apparent as thick (> 10 m) acoustically transparent bodies sumably representing material redeposited from local slopes. (Fig. 8) and indicate that redeposition from the basin sides From the seafloor morphology, we note that there are two is an important process locally. They are correlated with clear fan-shaped deposits in the fjord immediately seaward the flattest basin floors with sharp, well-defined basin edges of the margins of Belgrade and unnamed glaciers, which are showing that sediment has run in to the basin and then been interpreted as ice-proximal fans (e.g. Fig. 12). Unfortunately, dammed by a bedrock high (Fig. 8a). On the most prominent www.the-cryosphere.net/14/261/2020/ The Cryosphere, 14, 261–286, 2020
272                            K. A. Hogan et al.: Glacial sedimentation, fluxes and erosion rates associated with ice retreat

Figure 7. Typical SBP profiles from Petermann Fjord (see Fig. 2 for locations) showing the acoustic stratigraphy of the glacimarine sediment
package. (a) Fjord-parallel line showing conformable units (Facies III) overlying R1 reflection. (b) Outer fjord profile running approximately
SW–NE showing conformable fill (Facies III) over subglacial till deposits (Facies II) mapped as MSGL (red arrows) and basin fill with GFDs
(Facies IV) in local depressions. (c) Fjord-parallel line on the eastern side of the fjord showing basin fill in local depressions and conformable
fill elsewhere. G/H is glacimarine and/or hemipelagic sediments.

bedrock highs (S2–S4; Fig. 2), unlithified sediments consist               fied character on AG lines (see Fig. 3). We interpret this as
of Facies II and are usually < 8 m thick (Fig. 8b). However,               reflection of the SBP acoustic signal at R1 and, therefore,
in deeper areas (> 350 m water depth) the rugged bedrock                   poor penetration of acoustic energy in to the bottom unit.
surface is mantled with 7–15 m of Facies III (Fig. 8). We in-              MSGL in Kennedy Channel are formed in Facies II and in-
terpret this pattern to reflect a dominance of rainout processes           terpreted as a subglacial till. A similar interpretation is made
that uniformly draped bedrock/till with up to 15 m of layered              for MSGL in Robeson Channel where the MSGL are also
sediments unless (i) material was redeposited downslope and                formed in Facies II but underlie 5–10 m of Facies III as de-
into basins or (ii) strong currents in Nares Strait (e.g. Mudie            scribed above.
et al., 2006; Münchow et al., 2006) prevented the deposition
of fine-grained material on the highest seafloor areas. Iceberg            4.3    Large subglacial landforms: grounding-zone
ploughing also probably helped to homogenize sediment lay-                        wedges (GZWs)
ers deposited on the highs (see iceberg plough marks on S2
in Jakobsson et al., 2018).                                                There are two large discrete sedimentary deposits in the study
   In the > 500 m deep and relatively flat Kennedy and Robe-               area that must be accounted for here because they represent
son channels (Figs. 1, 2), unconsolidated sediment comprises               direct glacial sediment delivery to the grounding line and so
a two-layer conformable stratigraphy of Facies III. The upper              should be included in any glacial flux and erosion calcula-
unit is acoustically stratified and is typically 5–10 m thick.             tions. These are the two GZWs in the study area, one on the
The lower unit, which is separated from the upper unit by a                Petermann fjord-mouth sill that was identified by Jakobsson
high-amplitude reflection (R1 in Fig. 3), is also 5–10 m thick             et al. (2018) and one in Kennedy Channel around 64◦ 390 W,
and conformable but can be either acoustically homogenous                  81◦ 090 N identified in this work from the SBP data (Figs. 9,
or acoustically stratified (e.g. Facies III on Fig. 5). Where the          10). Both of these features are well covered by SBP line, and
bottom unit is homogenous on SBP profiles it has a strati-                 the Petermann GZW is also crossed by four AG profiles.

The Cryosphere, 14, 261–286, 2020                                                                  www.the-cryosphere.net/14/261/2020/
K. A. Hogan et al.: Glacial sedimentation, fluxes and erosion rates associated with ice retreat                                       273

Figure 8. Examples of SBP profiles from Hall Basin, Nares Strait (see Fig. 2 for locations). (a) NW–SE profile in Hall Basin showing
bedrock topography (Facies I) mantled with conformable sediment (Facies III) and ponded basin fill, sometimes with significant GFDs in
local depressions (Facies IV). (b) A SW–NE profile between the Petermann sill and S1 high showing a similar stratigraphy but including
non-conformable, homogenous sediment on steep slopes (Facies II). Intersections with Fig. 3a–d are marked with vertical grey dashed lines.

   SBP profiles across the Petermann GZW show very lim-                1995; Anderson, 1999; Dowdeswell and Fugelli, 2012); we
ited penetration through this deposit. It has a high-amplitude         attribute this to its position on the back slope and upper ridge
reflection at its top and is otherwise acoustically impenetra-         of the fjord-mouth sill. In this setting, it is difficult to see how
ble (Facies I). Only small mounds of acoustically homoge-              a wedge would be built up by progradation up a slope (i.e. on
nous material occur above this reflection; these were inter-           the back slope of the sill). The deposit has instead been built
preted as recessional moraines based on their coincidence              by plastering of layers of material on the back slope and pos-
with small, sinuous ridges in the multibeam dataset (Sup-              sibly through progradation on the top of the sill.
plement Fig. 3 in Jakobsson et al., 2018). AG profiles over               The Kennedy Channel GZW has a different geometry, po-
the GZW provide some more information about its inter-                 sition and architecture (Fig. 10). The GZW rises 10–15 m
nal character (Fig. 9c). The GZW appears to contain several            from the surrounding seafloor and is at least 5 km wide (along
conformable reflections in its upper 50 ms (∼ 37–45 m) that            Kennedy Channel) and 7 km long (across Kennedy Chan-
down-lap at the base of the slope (Figs. 5, 9c, d); however, the       nel). Although the multibeam echosounder coverage extends
reflections have low amplitudes and are discontinuous. Be-             only to the midline of the strait, we note that the bathymetry
low these reflections the seismic character is poorly defined          shallows towards Ellesmere Island in this area (based on our
and chaotic (Facies VI), presumably because the deposit con-           multibeam dataset and IBCAO regional bathymetry; Jakobs-
sists of a similar lithology throughout and, therefore, contains       son et al., 2012), meaning that the GZW persists across the
few acoustic impedance contrasts. However, the base of the             deepest part of the strait. It has a convex-up expression in the
deposit can be mapped along about 50 % of its length (e.g.             bathymetry that is clearly marked by iceberg plough marks
Fig. 9c, d) and defines a surprisingly thick deposit (200 ms           (Fig. 10a) and is situated in current water depths of ∼ 450 m
TWT; ∼ 150–180 m) that is continuous down the back slope               just south of a marked slope to deeper waters (∼ 530 m)
of the fjord-mouth sill. We interpret this seismo-acoustic fa-         to the north (Fig. 10a). SBP profiles reveal that the deposit
cies to be a diamictic deposit probably consisting of sub-             comprises 1–3 acoustically transparent units with variable
glacial till plastered on to the sill by a formerly expanded           thicknesses demarked by weak sub-bottom reflections (Fa-
Petermann Glacier. Coarse grains in the till deposit result in         cies V; Fig. 10c, d). AG lines in this area, which do not extend
strong scattering of acoustic energy, making this deposit ef-          across the mapped GZW and do not fully image the deposit
fectively impenetrable with the SBP source. It is notable that         (Fig. 10a), reveal a chaotic seismic character (Facies VI)
the GZW does not appear to contain the prograding reflec-              sometimes forming lenticular bodies. However, the deposit
tions described from some GZWs (e.g. Larter and Vanneste,              thins and eventually pinches out to the north (Fig. 10c, d).

www.the-cryosphere.net/14/261/2020/                                                              The Cryosphere, 14, 261–286, 2020
274 K. A. Hogan et al.: Glacial sedimentation, fluxes and erosion rates associated with ice retreat
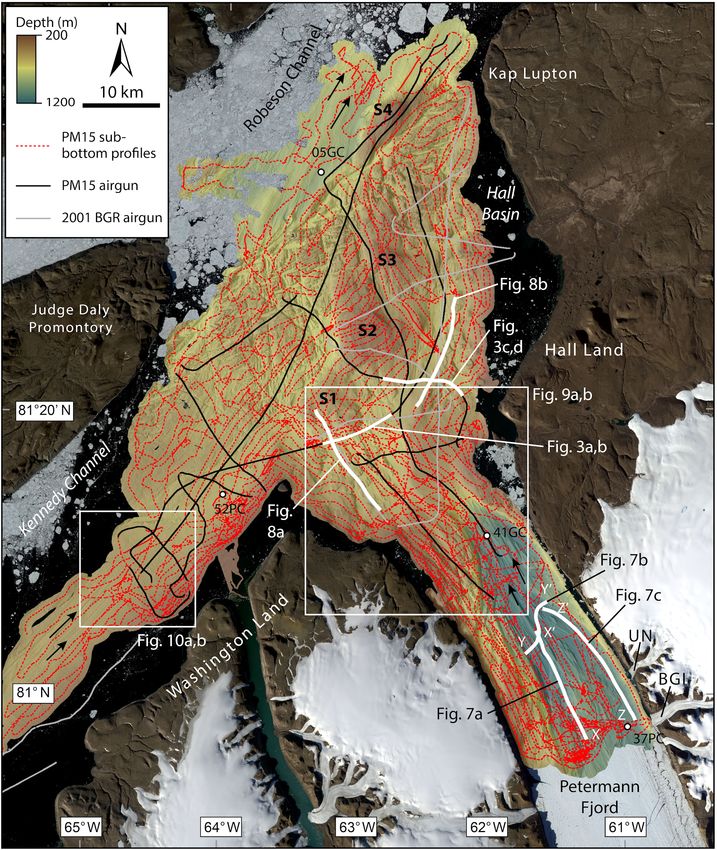
Figure 9. Mapping of the Petermann sill grounding-zone wedge (GZW). (a) AG profiles over the GZW and outline used in volume calcula-
tions. (b) Isopach map of the GZW based on mapping from AG lines. (c) AG profile pm15_04a showing the seismic stratigraphy (Facies VI)
of the GZW. (d) Line drawing of AG profile pm15_04a.
We interpret this acoustic signature as layers of till deliv- shelf instability interpreted from core records (Jennings et
ered to the grounding line and then deposited just seaward al., 2018) prior to further grounding-zone retreat.
of it (probably by gravity flows) at the temporarily stabilized
grounding zone of the Nares Strait ice stream. The ice margin 4.4 Unlithified sediment volumes
stabilized at a bathymetric shallowing and narrowing of the
deepest channel in this area. Subglacial till extruded from the Total sediment thicknesses (to acoustic basement) were
grounding line as GFDs formed the acoustically homogenous mapped from SBP profiles in two areas: Petermann Fjord
units (Facies V) extending and tapering downslope in front and the inner Hall Basin (Fig. 11). The isopach map for Pe-
of the GZW (Fig. 10d). Where such flow deposits are prolific termann Fjord indicates that sediment thicknesses, typically
and occur at the seafloor, they are easily identified as smooth, 20–40 m, are relatively consistent on the fjord bottom with
lobate features in front of known grounding-zone positions a few depressions holding 70 m of sediment (Fig. 11a). The
marked by terminal moraines (e.g. Ottesen and Dowdeswell, total mapped sediment volume in the fjord was 14.2 km3 . In
2006; Flink et al., 2015) or GZWs (e.g. Bjarnardóttir et al., Hall Basin, mapping was confined to the area in front of the
2013; Esteves et al., 2017). Here, they may reflect local shifts Petermann sill and south of ridges S1–S3. This was primarily
in the location of the grounding zone during a phase of ice because the sill is a known grounding-zone location during
ice retreat (Jakobsson et al., 2018) and because that area con-
The Cryosphere, 14, 261–286, 2020 www.the-cryosphere.net/14/261/2020/K. A. Hogan et al.: Glacial sedimentation, fluxes and erosion rates associated with ice retreat 275 Figure 10. Mapping of the Kennedy Channel GZW. (a) AG and SBP profiles over the GZW and outline used for volume calculations. (b) Isopach map for the Kennedy Channel GZW (using a sound velocity of 1500 m s−1 ). (c) SBP profile over the GZW showing the acoustically semi-transparent lenticular bodies (Facies IV) interfingered with acoustically stratified conformable units downslope (Facies III); location shown in panel (a). (d) SBP profile of the frontal part of the GZW showing semi-transparent units tapering downslope (Facies IV); location shown in panel (a). Black arrows point to iceberg plough marks; blue dashed lines show the deepest sub-bottom reflections in the GZW interpreted as the base of the GZW. tains the majority of the sediment-filled basins in front of the single line in the central part of the fjord (line 04a; Fig. 9a) sill and up to the topographic barrier at S2–S4. Secondary to and probably leads to an underestimation in sediment thick- this, the area beyond the S1–S3 ridges has a heavily fractured nesses for the GZW. However, a second line across the south- morphology with many small, isolated basins and trenches; ern part of the sill (line 13b) confirms that the GZW does these features complicate calculations of sediment thickness not extend off the top part of the sill in this area (Fig. 9b). when survey lines have irregular spacing that is often greater Sediment thicknesses on the top of the sill are generally be- than the distance between individual basins. However, map- tween 30 and 120 m and reach 160–190 m in its northern ping and the resultant isopach map for this area indicates part. The shape of the GZW is defined by a zero-thickness sediment thicknesses are typically less than 30 m but up to contour as mapped on AG profiles joined by tracing along 50 m in basins, which become more irregular in shape fur- the front scarp of the wedge and extending down the deep- ther northwards (Fig. 11b). The strong correlation of sedi- est channel into Petermann Fjord. A volume calculation for ment thickness with seafloor morphology confirms that to- the isopach map representing the GZW at the mouth of the pography is a strong control on accumulation in this area. Petermann Fjord gives a total volume of 7.7–15.1 km3 (using The total mapped sediment volume between the fjord mouth sound speeds of 1500 and 1800 m s−1 ). In Kennedy Channel, and the S1–S3 ridges is 16.3 km3 (using a sound velocity of AG profiles do not fully cover the GZW (Fig. 10a); however, 1500 m s−1 ). its volume has been estimated based on AG profiles and from The isopach map for the Petermann GZW shows a maxi- SBP profiles that image the base of the deposit near its edges. mum sediment thickness of 215–260 m on the upper part of The deposit here is more classically wedge-shaped (see Al- the back slope of the fjord-mouth sill (Fig. 9b). The thickest ley et al., 1989; Dowdeswell and Fugelli, 2012) compared to part of the deposit appears to be confined to a central fjord- the deposits of the GZW at the Petermann Fjord mouth. The parallel line, which is likely a function of gridding from a Kennedy Channel wedge has the greatest thickness toward www.the-cryosphere.net/14/261/2020/ The Cryosphere, 14, 261–286, 2020
You can also read