EVERYDAY PLACES CREATING STR NG LOCATIONS TO SUPPORT DAILY LIFE IN BRITAIN - KITTY USSHER MONIQUE ROTIK MAIYORAA JEYABRABA - Demos
←
→
Page content transcription
If your browser does not render page correctly, please read the page content below
EVERYDAY
PLACES
CREATING STR NG
LOCATIONS TO SUPPORT
DAILY LIFE IN BRITAIN
KITTY USSHER
MONIQUE ROTIK
MAIYORAA JEYABRABA

APRIL 2021
Open Access. Some rights reserved.

Open Access. Some rights reserved. As the
publisher of this work, Demos wants to encourage
the circulation of our work as widely as possible
while retaining the copyright. We therefore have an
open access policy which enables anyone to access
our content online without charge. Anyone can
download, save, perform or distribute this
work in any format, including translation, without
written permission. This is subject to the terms
of the Creative Commons By Share Alike licence.
The main conditions are:

• Demos and the author(s) are credited including
  our web address www.demos.co.uk

• If you use our work, you share the results
  under a similar licence

A full copy of the licence can be found at
https://creativecommons.org/licenses/
by-sa/3.0/legalcode

You are welcome to ask for permission to use this
work for purposes other than those covered by the
licence. Demos gratefully acknowledges the work
of Creative Commons in inspiring our approach to
copyright. To find out more go to
www.creativecommons.org

This project is kindly sponsored by:

Published by Demos April 2021
© Demos. Some rights reserved.
15 Whitehall, London, SW1A 2DD
T: 020 3878 3955
hello@demos.co.uk
www.demos.co.uk

                                                      2
C NTENTS
ACKNOWLEDGEMENTS                                                 PAGE 4

FOREWORD                                                         PAGE 5

EXECUTIVE SUMMARY                                                PAGE 6

LIST OF RECOMMENDATIONS                                          PAGE 9

INTRODUCTION: A NEW WAY OF MEASURING PLACE                       PAGE 10

CHAPTER 1: THE HEADLINE VIEW                                     PAGE 14

CHAPTER 2: WHAT DO PEOPLE WANT FROM THEIR LOCATION?              PAGE 21

CHAPTER 3: SHOPS AS A SOURCE OF COMMUNITY PRIDE                  PAGE 30

CHAPTER 4: IS SUBURBIA FIT FOR PURPOSE?                          PAGE 33

CHAPTER 5: THE EVERYDAY NEEDS OF RURAL BRITAIN                   PAGE 40

CHAPTER 6: UNDERSTANDING THE URBANITES                           PAGE 44

CHAPTER 7: HOW TO REDUCE NEGATIVITY                              PAGE 50

CONCLUSION                                                       PAGE 59

APPENDIX: PROCESS FOR CALCULATING THE PLACE SATISFACTION INDEX   PAGE 63

                                            3
ACKNOWLEDGEMENTS
This project was designed with primary research at its heart so our first thanks go to
the tens of thousands of people in Britain who told us their opinions and preferences
during the polling and focus groups undertaken for this project.
We are particularly grateful to Legal & General for sponsoring this research, for
providing wide-ranging expert insight on early drafts and for chairing our events.
Thanks are also due to those who attended our three seminar roundtables in late
January 2021, all of whom are experts in their respective fields of business, academia,
regeneration, civil service, local authorities and wider civil society who gave freely and
generously of their time, perspectives and advice.
Thanks also to our partners at Focaldata who conducted the poll on our behalf and
undertook the statistical analysis to obtain the MRP results by constituency. Focaldata
is a research data company headquartered in London.
Within Demos, particular thanks go to Harry Carr, Ben Glover, Alex Krasodomski-
Jones, Stephanie Lenz, Toby O’Brien, Maeve Thompson, Josh Tapper, Josh Smith,
Maria Olanipekun, Ciaran Cummins, James Sweetland and of course Polly Mackenzie.
All errors and omissions are the authors’ own.
Kitty Ussher
Monique Rotik
Maiyoraa Jeyabraba
4FOREWORD
Covid-19 has driven major change to people’s lives of local and national needs. It has looked at how to
and global economies. Perceptions have been boost jobs, reinvigorate our retail sector, re-evaluate
altered, and our ideas around what we need from office requirements, re-think place-making, support
our homes, work, and communities have been growth businesses and digital infrastructure and
challenged. What is less clear is which dynamics are tackle the ever-growing crises in housing and climate
here to stay and which are temporary, becoming the change. The findings show that major changes in
new war-stories we tell our grandchildren of how we daily routine have resulted in a new focus on local
lived during an exceptional and unique time. areas, with more people wanting to spend time and
money in their locality. Long-term working from
As business and government look to respond home remains popular and support for new local
to these new challenges, and support the UK in shops and local desk space is widespread. Lack of
Building Back Better, we will need to be increasingly affordable housing remains a key issue.
creative. Regions need to evaluate how they
successfully deliver ‘place’ through a new lens, Our built environments, especially in our great towns
meeting evolving social needs and the very real and cities, are complex, and over-simplification
impacts of the climate crisis. of changing needs and dynamics may amplify
inequalities further. Our experience from investing
At Legal & General, we have practiced Inclusive £29 billion across the UK tells us that rapid
Capitalism for well over a decade now, but we progress will require a new approach that mobilises
know that our long-held mission to ‘level up’ communities through partnerships between local
and ‘building back better’ has never been more government, universities, schools, health trusts,
important. The consequence of the pandemic has employers, and property developers. City and
been more inequality and an increased probability of regional deals play an important role in fostering
a K-shaped recovery. This has added new urgency. localism: levelling up cannot be organised top-down
With the prospect of economic uncertainty, it is now from Whitehall alone. Local communities need to
imperative not just to set out a clear vision and policy be given the right powers and necessary funding to
framework, to support areas and sectors which could ensure that investment is being put to use where it is
be left further behind, but also to deliver it for our most required.
towns and cities.
In the 1850s and 1860s, significant investments in
As one of the UK’s leading financial services groups, the built environment dragged millions of people
stewarding over £1.2 trillion of society’s pensions out of poverty. From railways, to the Manchester
and savings, Legal & General is dedicated to playing Ship Canal and the London sewerage system; these
our part in supporting the UK bounce back. As a inventions changed the way we lived and propelled
business, we are investing to deliver positive social the UK into a global leadership position. We now
impact through some of the UK’s most strategically have a once-in-a-life-time opportunity to do this
important regeneration schemes, such as those in again, taking advantage of the new urban and
Cardiff, Sunderland, Newcastle, Oxford, and Salford. suburban landscape, changes in living and migration
These are fast transforming and reshaping Britain’s patterns and the opportunities around digital
landscape; bringing jobs and housing back into transformation which have accelerated overnight.
the centre of cities and better utilising our existing With the roadmap set for our emergence from
infrastructure. Covid-19, we are committed to playing our role in
Good quality places that are intra- and inter- creating this economic and social resurgence. We
connected are critical to supporting the UK’s trust that this research will provide valuable insights
economic position, fuelling future growth and to help inform this vision.
making sure that it’s inclusive. This research, which
has surveyed over 20,000 people across the country, Nigel Wilson
seeks to establish a clear people-centred benchmark Chief Executive of Legal & General Group
5EXECUTIVE
SUMMARY
KEY FINDINGS
• Town and city suburbs have more in common with each other than town suburbs have with their
centres, or city suburbs with city centres. Government should define expectations for suburban
communities and task local councils to achieve them.
• Perception of the retail offer is strongly linked to people’s sense of ‘place’. The overriding
purpose of business rates reform should be to align the local retail experience to what local
residents say that they want.
• Feeling negative about ‘place’ is strongly linked to dissatisfaction with public transport, and
lower engagement with work. Immediate policies are needed to help ensure some people do
not feel ‘stuck’: we recommend that people on jobseekers benefits be automatically given free
travel within a wide commuting area.
• When asked about the most urgent thing that needs improving in their local area, the most
popular answer in urban areas is ‘good local shops’; rural areas are more likely to cite transport.
Overall, people feel that decent shops and access to fresh air and nature are the most
important things to have in their location.
Our place satisfaction index uses polling and More built-up areas in general perform better than
modelling to capture the mismatch between more rural and remote areas, where transport is a
individual people’s everyday priorities and particular problem. Across Britain, satisfaction is
requirements for their area, and their rating of what’s highest with internet access and the shopping offer,
actually on offer. On this measure we find that the and lowest with housing, transport and ‘premises to
index value at the end of 2020 was +26 for Britain as support jobs’.
a whole, on a scale of -100 to +100.
People who voted ‘Leave’ in the 2016 referendum
The themes and items that are included in the index are more likely to feel that the local provision of the
are practical and prosaic including, for example, things they prioritise as important is nearer ‘bad’
supermarkets, parks, office premises, playgrounds than ‘good’. Full constituency results are available at
and homes with gardens. A score of -100 equates places.demos.co.uk
to ‘very bad’ provision of the items people think
are important and a score of +100 equates to ‘very
good’ provision of these items. WHAT DO WE WANT FROM OUR
LOCATION?
The highest place satisfaction index scores are
recorded in London, Scotland, the West Midlands Drilling into more detailed subcategories shows
and the North of England, driven by strong scores for we are a nation of supermarket shoppers - across
the most popular themes of ‘good local shops’ and the country we prioritise supermarkets over other
‘access to fresh air and nature’. Lower satisfaction types of shops; local independent shops are second,
with housing drives lower scores in the South of valued more highly than national chain stores. We
England. like going out to local places to eat and drink - but
not with younger children!
6We love our local parks, and they are particularly THE EVERYDAY NEEDS OF RURAL BRITAIN
valued in suburban areas. When thinking about The rural population is also older than the national
exercise facilities, older people prefer swimming average and the highest socioeconomic group (AB)
pools, younger people prefer gyms. is disproportionately represented. They greatly
Crime prevention measures are prioritised above appreciate their access to fresh air and nature,
neighbourliness. Understandably, public transport regardless of income, although for those without
is a particular necessity for those on lower incomes a vehicle, transport and access to shops are top-
who are less likely to have access to a vehicle. Desk of-mind. Unlike the rest of the country, they cite
spaces for remote workers are most popular among transport (not shops) as the thing that most urgently
younger adults, workers required to work from home needs improving. People in rural areas also buck the
during the pandemic and people with larger families. national trend by ranking local independent shops
more highly than supermarkets. For those with
urgent housing needs, affordable homes feel in short
SHOPS AS A SOURCE OF COMMUNITY supply.
PRIDE
Local shops are valued for a variety of reasons UNDERSTANDING THE URBANITES
beyond just fulfilling people’s own retail needs,
People living in urban centres are younger and
and are treated as a kind of proxy for the overall
are more likely to be from an ethnic minority than
socioeconomic health of a place.
people living elsewhere, with a wider range of leisure
There is widespread regret about the perceived interests and greater emphasis on activity. They are
decline of the high street as well as desire to see more likely to be in work and to value workspaces for
it revitalised in order to support local businesses, entrepreneurs, local desk space and home offices.
provide jobs, act as catalyst for wider regeneration
There is unmet demand for better housing, both at
and engender pride in place. A high street that is
the bottom and top of the market, and urbanites
fit for purpose is defined as having a mix of shops
are more likely to have moved, or be considering
in order to fulfil a variety of needs. People are not
moving, as a direct result of the pandemic. Car
averse to some repurposing of empty shops from
ownership is lower, cycling is a higher priority,
retail to offices and/or housing as long as it does not
and there is more desire for traffic-free zones than
compromise the integrity of the high street.
elsewhere in the country.
Online shopping has become further entrenched
during the pandemic and it may be that people’s
needs from physical shopping become less about HOW TO REDUCE NEGATIVITY
the transactions and more about the experience. The highest proportion of people with negative
place satisfaction index scores - that is, those who
rate the provision of items that are important to
IS SUBURBIA FIT FOR PURPOSE? them as nearer ‘bad’ than ‘good’ - are to be found in
More than half (57%) of the total population lives in Wales and the South and East of England. Generally,
a suburban setting, be it as part of a town or a city. higher negativity according to our metric is found in
Suburbanites are slightly older than the national less built-up areas.
average, and were more likely to vote Leave in 2016
People with negative place satisfaction scores
and Conservative in 2019. They are also less likely
are more likely to prioritise crime prevention and
to have had their working patterns disrupted by the
improving the feel of the area. Affordable housing
pandemic.
is also particularly important, suggesting they are
Suburban dwellers attach a high priority to parks having difficulty meeting basic needs. Almost by
and green spaces but are more critical about the definition they are also more likely to be seeking to
provision of both than people living in urban centres. move (for reasons unrelated to the pandemic).
They are particularly likely to cite ‘good local shops’
Poor transport is strongly linked to place negativity,
as the issue that most needs improving in their
suggesting some people may feel ‘stuck’ in places
local area, followed by transport and ‘premises for
that are not meeting their needs. Negativity is
jobs’. There is a strong demand for more affordable
partially linked to personal characteristics, including
housing to buy in suburban areas in the South of
working status, but there is also a strong connection
England. with place.
7CONCLUSIONS
The place satisfaction index that lies at the heart of
this research is a useful public policy experiment,
producing results that pass the common sense test.
It has also produced some additional insights - for
example around people’s relationship with the retail
offering, the everyday lived experience of suburbia,
and variables that affect a person’s negative
relationship with place - that were not previously
central to the public policy debate. Our policy
recommendations that arise from these results are
listed on the next page.
8LIST OF
RECOMMENDATIONS
1. Our innovation of a subjective satisfaction 4. The overriding aim of the forthcoming business
index, measuring the difference between rates reform should be to align the local retail
people’s priorities and how they view provision, experience to what residents in a particular
should be adopted across Government as a tool area demonstrably say that they want. Local
to gauge the relative priorities of competing authorities should be given both the policy
priorities in specific geographic areas. flexibility (local taxation and grants) and the
incentives (a formal duty to consult, retaining a
2. Government should launch a policy greater proportion of rates receipts for higher
workstream specifically to consider whether the local satisfaction) to achieve this. The key is that
characteristics and quality of Britain’s suburbs local leaders should be able to demonstrate
are fit for purpose in a new post-pandemic local support for change, and then have the
world. As part of this, Government should set tools to deliver it.
out what facilities and amenities it expects
should be easily available to all citizens in all 5. Greater investment in public transport is
types of urban areas. We would like to see a required in more remote areas. In addition,
redefining of suburbs away from places where everyone eligible for jobseekers benefits,
commuters return to, towards places where including Jobseekers Allowance, Employment
communities live and work. Support Allowance, and the equivalent
components of new Universal Credit, should
3. Demos has previously argued that future automatically be granted a ‘jobseekers travel
housing developments should aim to build local pass’ that gives free travel within a wide
communities at their core and that this should commuting area.
be reflected in planning guidance.1 For existing
residential areas we additionally suggest that
local authorities consciously define and seek
to create micro communities, drawing on the
concept of the ‘15-minute neighbourhood’.
As part of this, local authorities should be
required to ensure that the facilities and
amenities laid out by Government as part of
our Recommendation 2 are available in all such
communities.
1 Glover, B. Future Homes. Demos.2019. Available at: https://demos.co.uk/wp-content/uploads/2019/06/J460233_AXA-Demos_Future-of-
UK-Housing-Report-FINAL_web.pdf [date accessed: 21 March 2021]
9INTRODUCTION:
A NEW WAY OF
MEASURING PLACE
“There has been no serious politician in Britain in recent
years capable of speaking effectively about the everyday,
let alone capable of reflecting a deep concern with the
rhythms of actual people’s ordinary lives...we need a
public policy programme underpinned by a concern for
the everyday”2
If we have learnt anything from our experience Rather, this is an attempt to measure the extent
of the pandemic, it’s that our immediate location to which people feel that their local area provides
matters. With usual routines disrupted and mobility what it is that they personally consider to be
constrained, we have all been forced to consider most important in terms of their own practical
afresh the area we live in, and how it measures up requirements. We do this through the construction
against the particular day-to-day needs and priorities of a new ‘place satisfaction index’ that measures the
of our own households. collective mismatch - if any - between the facilities,
amenities, and services people want to have nearby
It is with this thought in mind that, in late 2020, and their perception of the actual provision that is on
we set out to explore a different way of measuring offer.
people’s relationship with ‘place’. We put to one side
the familiar socioeconomic measurements, refined In this way it enables data to be gathered not
over the last 70 years or so, that use the language only on the relative importance of different types
of incomes, deprivation, regional house prices of investment in different types of location, but
and - depending on your political framework - their also seeks to help policymakers, regeneration and
subsequent link to class, levelling up and the Brexit business leaders understand what the priorities for
referendum result. action are to ensure that as many people as possible
get what they need from their ‘place’.
We also deliberately did not try purely to quantify
the softer measures of place, such as local pride, There are a couple of things to note from the
wellbeing, social cohesion or community strength. outset about this overall type of approach. First,
These have been admirably explored elsewhere in the rankings that we obtain within and between the
recent years and during the pandemic itself.3 different themes - shops, fresh air, places to go out,
housing, transport and so on - are entirely subjective.
The point of the exercise is an attempt to capture
and aggregate people’s own priorities and consider
2 Sears, M. Out of the Ordinary. How Everyday Life Inspired a Nation and How It Can Again. Harvard University Press. 2021. pp172-3.
3 Centre for Thriving Places. Thriving Places Index. 2020. Available at: https://www.thrivingplacesindex.org/ [date accessed: 26/03/21];
Tanner, W. O’Shaughnessy, J. Krasniqi, F. Blagden, J. The State of Our Social Fabric. Onward. 2020. Available at: https://www.ukonward.com/
wp-content/uploads/2020/09/The-State-of-our-Social-Fabric.pdf [date accessed: 26/03/21]; ONS. Well-being workstream. 2021. Available at:
https://www.ons.gov.uk/peoplepopulationandcommunity/wellbeing [date accessed: 26/03/21]
10the extent to which local provision is perceived - on which different types of location will recover once
average - to measure up against those priorities. the restrictions are lifted. This was published as a
It’s the mismatch that is as important as the relative stand-alone output as part of our Renew Normal
importance of the items. Commission in March 2021.5
Second, the data is only as interesting as the list of Combined with our hope that it will be possible to
items that are plugged into the model in the first repeat the place satisfaction index in future, our aim
place. Our choice is primarily to focus on practical for both parts of the project is to ensure that, as
facilities and amenities that households would we consider the wider implications of the Covid-19
typically use as part of their everyday routines. In crisis, the individuals and teams making decisions
this respect, although we have tried to be exhaustive that affect local communities, as well as different
within each broad theme, a deliberate effort has segments of the labour market, are able to do so in
been made to focus on items where there are real the full knowledge of what the people affected say
choices for delivery partners and policy makers, and they need, and how those requirements change over
a multitude of different ways in which solutions could time.
be delivered.
For this reason the core ‘top down’ public services METHODS AND STAGES OF THE
of health and education provision are out of scope
RESEARCH
(although a subcategory of ‘easy access to public
services’ is an option within the theme of ‘streets and Data collection
community’). This omission is not a reflection of any The project kicked off with a bespoke analysis of the
discounting on our part of the importance of health large-scale qualitative dataset that we had collected
and education to people where they live. Instead it is as part of the initial phase of the Demos Renew
because, compared to other items at least, there is a Normal workstream, where around 12,000 people
broad acceptance of the role of central government submitted their own experiences and observations
to ensure provision of these services is fit for purpose of the first lockdown. In parallel, we conducted a
and of a uniformly high quality regardless of location. brief literature review to help scope out the first
drafts of our polling questionnaire, and the specific
Instead this project is more interested in areas themes, and their subcategories, that we would be
where local priorities may differ, and change can exploring. At the same time we experimented with
be delivered through partnership - be it developers different models for the construction of the index to
with planning authorities, retailers with communities ensure that it would give us the information that was
or elected politicians seeking funding for what they required.
perceive to be the regeneration priorities of their
areas. We then finalised the questionnaire and deployed
the poll to just over 20,000 people across Britain
In fact, one of the aims of our project is to help over the course of December 2020, with the data
inform communities and Members of Parliament of weighted to be nationally representative according to
the likely regeneration priorities of their constituents standard demographic variables.
so that the bids to the £4bn ‘levelling up’ fund,
and equivalent programmes for the devolved Our results therefore represent views in the run up to,
administrations, are as well targeted as possible to and over, Christmas 2020, a time when the country
investments that will have the greatest impact on was not experiencing a national lockdown and the
people’s satisfaction with their local areas.4 immunisation process was just beginning but there
were nevertheless significant Covid-19 restrictions in
At the same time as ranking people’s priorities place.
for their area, and exploring ways to quantify the
mismatch between priorities and actual provision, Creation of the index
we conducted a parallel workstream to explore how At the core of our research is a list of 35 items
people’s relationship with ‘place’ has been affected (sometimes referred to as subcategories) that
by the pandemic, how this varies across the country, all places have to a greater or lesser extent. It is
how people will want to work and travel in future a prosaic, everyday list including things such as
and what the implications are for the pace with supermarkets, parks, office premises, playgrounds
and homes with gardens. These are grouped into
eight broad themes - going out, shopping, fresh air
and so on.
4 Woodcock, A. Spending review: Labour denounces £4bn Levelling Up Fund for local projects as ‘pork barrel politics’. Independent. 2021.
Available at: https://www.independent.co.uk/news/uk/politics/levelling-up-fund-pot-rishi-sunak-b1761672.html [date accessed: 26/03/21]
5 Ussher, K. Rotik, M. Jeyabraba, M. Post Pandemic Places. Demos. 2021. Available at: https://demos.co.uk/project/post-pandemic-places/
[date accessed: 26/03/21]
11We used opinion polling to obtain a measure of the person views as most important is “very bad”
the extent to which people’s personal priorities and the highest positive result indicates that the
for these various items are aligned with what they availability of the items the person views as most
perceive to actually be on offer in their local area. important is “very good”. The methodology used is
For each person, their results were summarised on a summarised in Figure 1 with a full description in the
scale from -100 to +100 where the lowest negative Appendix.
result indicated that the availability of the items that
FIGURE 1
CREATION OF THE
INDEX
12By comparing the average index values between Targeted qualitative insights
different population groups and locations we then Finally, we conducted four focus groups over Zoom
explored how this sense of place satisfaction varies on 8-9th February 2021. Drawing on our preliminary
both geographically and according to standard analysis of the data, and the feedback from the
demographic variables. roundtable seminars, we used these sessions to
explore, in particular, themes around people’s
In terms of location, this was undertaken in four main
relationship with their local shops and the differing
ways. First we asked respondents to select their type
experiences of people who were more likely to have
of location from a list of: ‘city centre’, ‘city (not in the
a negative overall view of their local place. We held
centre)’, ‘town centre’, ‘town (not in the centre)’ and
two focus groups comprising people from towns
‘rural/countryside village’; these location types then
in the north of England, and two from towns in the
formed the backbone of our place-based analysis.
south of England. Within each location type, one
Second, for those who live in towns we used the first group consisted of people who had been required
four digits of their postcode to categorise the type of to work from home because of the pandemic, and
town they live in according to Demos’s existing town the other of people of working age but either out of
typology (hub-and-spoke, affluent, industrial, rural work or with lower household incomes.
and coastal) and segmented results accordingly.6
We used the working from home groups to explore
Third, we looked at results by the nine English
how this forced change of working location had
regions plus Scotland and Wales.
affected people’s sense of place. We chose to
In some cases, depending on the sample size we conduct sessions with people out of work or with
can report against more than one of these location- lower household incomes because the preliminary
based variables at the same time. For example, to results suggested these groups were most likely to
identify people in living in towns in the North of have a negative perception of their location, and
England (sample size 2,600) or in rural areas in the we wanted to explore what this felt like. We chose
south of England (sample size 1,168). participants in towns (and where possible, on the
outskirts of towns) because of the policy interest
Finally, we used the statistical technique of multilevel in regeneration towns, and the link it gave to the
regression with post stratification (MRP), that infers towns typology that was used to analyse the polling.
results by grouping people of similar demographic We separated North and South England because
characteristics, to estimate the proportion of the of the differences in place satisfaction index scores
population in each Westminster constituency whose between the two parts of the country that had
priorities and perceptions meant that they had emerged from the polling.
a negative place satisfaction index. That is, the
proportion of the population who thought that the Finalisation
provision of those items they personally considered The final analysis and write-up took place over
most important was nearer ‘bad’ than ‘good’. February and March 2021 and, in addition to the two
published reports, our more detailed regional and
Stakeholder input via roundtables constituency-level results are also made available on
Once the raw data were obtained we constructed the a dedicated microsite via the Demos website:
index and presented the headline results and interim places.demos.co.uk
poll findings at three roundtable seminars that were
held in late January 2021, with attendees from In the next chapter we explore the main index
academia, industry, NGOs and government including and place priority results for Britain as a whole;
national civil servants and professionals working in subsequent chapters then explore how priorities vary
local and regional development. We are very grateful according to location and demography.
to all those who gave freely of their time to help
us place this project in context and provide useful
feedback as to which themes would be most fruitful
to explore in the next stage. We used these insights
to help prioritise a more detailed analysis of the
data, as well as the issues that were most useful to
explore in more depth at the qualitative stage, and
the structure of this final report.
6 Glover, B. Carr, H. Smith, J. Brown, S.P. The Future of Towns. 2020. Demos. Available at: https://demos.co.uk/project/the-future-of-towns
[date accessed: 09/02/21]
13CHAPTER 1
THE HEADLINE VIEW
As of December 2020, the weighted average place THE NORTH DOES BETTER THAN THE
satisfaction index value for the entire population of SOUTH
Great Britain was +26 on a scale of -100 to +100.
Aside from London, the headline index value broadly
Our interpretation of this score is that, on average,
decreases moving from North to South, although the
people think the provision of those facilities and
differences are slight, with the highest satisfaction
amenities that are most important to them are
scores recorded in Scotland, and lowest in the South
somewhere between ‘neither good or bad’ (zero)
of England and Wales (Chart 2).
and ‘good’ (+50).7
This means that, excluding London, there is a greater
Provision is most in line with people’s priorities for
mismatch in the South of the country as compared to
internet access and the shopping offer, and least for
the North between what people say they want from
housing, premises to support jobs, and transport.
the facilities and amenities on offer in their areas and
how they perceive that provision in reality.
7 A score of +100 would be obtained if everyone thought the provision of their personal priorities was ‘very good’ and -100 if they thought
they were ‘very bad’.
14The driving factors for these differences are relatively ACCESS TO GOOD LOCAL SHOPS AND
lower satisfaction with transport and shopping in the FRESH AIR AND NATURE ARE BRITAIN’S
South of England and Wales. The North of England
TOP PRIORITIES FOR THEIR LOCAL AREAS
and Scotland perform better on these measures
and also on housing. London scores better on all As part of the process of constructing the index
measures apart from housing and fresh air, while described in the previous chapter, we asked people
Scotland, Wales and the South West of England to rank their four most important local priorities,
perform particularly strongly in the ‘fresh air’ forcing trade-offs between the high level themes.
category.
15When the answers were weighted according to people living in city centres than they are to their
the priority given to each theme, we found that counterparts residing in town suburbs (see Chart 5).
the most important priority overall is ‘good local Similarly, characteristics of those living in city suburbs
shops’ followed by ‘access to fresh air and nature’ were closer to those in town suburbs than they
with ‘exercise and sports facilities’ and ‘premises to were to people living in city centres. It seems that
support local jobs’ attracting the lowest support. residents of urban centres share more in common
with each other regardless of whether they live in
However, when looking only at first priority choices, towns or cities. Similarly residents of suburbs share
the most popular answer was ‘access to fresh air more in common with each other regardless of
and nature’ suggesting that this is more of a top-of- whether they live on the outskirts of towns or cities.
mind response for many people, but that a higher
proportion of the population overall includes shops Adding the next level of detail shows that cities
in their top four. Households on the lowest incomes perform well on all metrics apart from housing, and
(under £20,000) emphasised the importance of that all measures decline in less urban areas with the
housing, transport and shops more than ‘access to transport index becoming negative in rural areas.
fresh air and nature’. Chapter 7 discusses how these
relative priorities alter for those who have a negative A similar pattern emerges when we look at the
overall perception of their local place. variations between different types of towns. Using
the existing Demos town typology we find that the
lowest index scores are recorded in ‘rural and coastal
PLACE SATISFACTION DECREASES WITH towns’, and the highest in the more urban ‘hub &
spoke’ (commuter) town category.8
RURAL-NESS
Overall, our findings show that satisfaction decreases Lower satisfaction with the provision of ‘transport’
as locations become more rural, and that the services is a particular issue that drags the index
experience of people living in city suburbs (place down for less built up areas, alongside ‘premises for
satisfaction index score +27) is the closest to the jobs’. These differences between different location
national average (+26). types are discussed in more detail in the following
chapters.
An associated finding is that the satisfaction levels of
people living in town centres are closer to those of
8 Glover, B. Carr, H. Smith, J. Brown, S.P. The Future of Towns. 2020. Demos. Available at: https://demos.co.uk/project/the-future-of-towns/
[date accessed: 09/02/21]. Our town types are: Affluent, Hub-and-Spoke (commuter towns), Industrial (including some ex-industrial towns), Rural
and Coastal.
1617
FIGURE 2
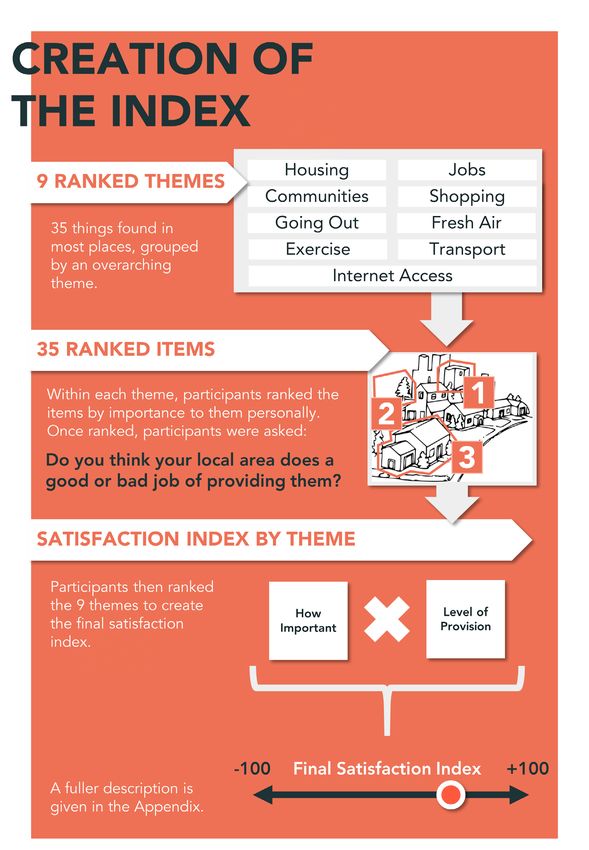
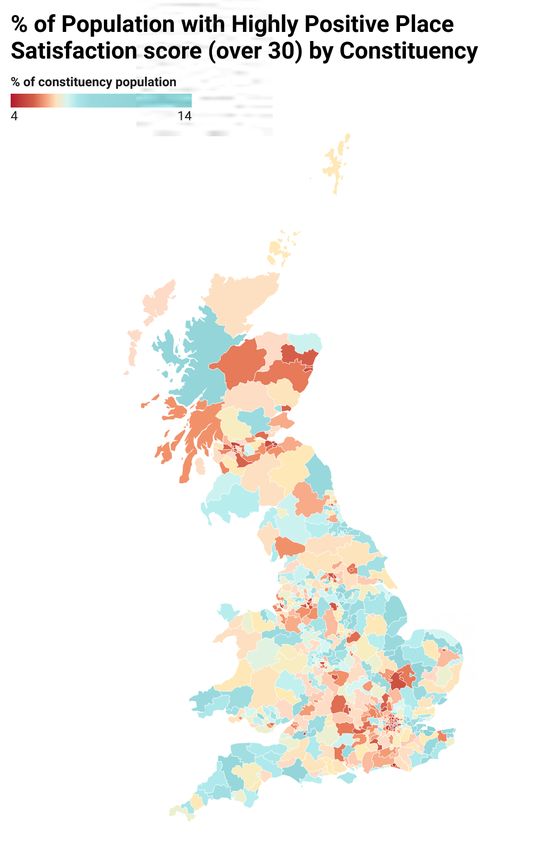
CONSTITUENCY RESULTS As Chart 7 below shows, we could not find a
The MRP results by constituency estimated the connection between having a negative place
proportion of the population in each constituency satisfaction score and having high indices of multiple
that lay within each 10-point bucket of the index deprivation. This result seems to be connected to
scale. So, for example, it estimated the proportion the fact that areas with dense urban housing tend to
that had a place satisfaction score of between 0 score poorly in the index of multiple deprivation, but
and +10, between +10 and +20 and so on. We more positively in our place satisfaction index due
aggregated these results to estimate the proportion to the relative proximity of the wider range of things
of the population in each constituency that had that people prioritise as important.
a negative place satisfaction index score and, In fact, the constituencies that score most highly on
separately, the proportion of the population that our place satisfaction index (in that they have the
had a high (over +30) place satisfaction index score. lowest proportion of the population with negative
We found a strong connection between living in an scores) are all in London. The constituency with the
urban area and having a high place satisfaction index highest proportion of the population with negative
score,with the weakest scores in the eastern coastal place satisfaction index scores is Sittingbourne and
areas of England, and South West Wales. However Sheppey in Kent, followed by Ealing North in North
some coastal areas are divided, containing smaller West London and Hemsworth in West Yorkshire.
minorities with strongly positive results (Figure 2). Individual constituency results can be obtained
We then explored the dataset to see if it correlated through our interactive microsite at places.demos.
with the index of multiple deprivation which is also co.uk
available by constituency.9, 10
9 House of Commons Library. Constituency data: Indices of deprivation Data Dashboard. 2020. Available at: https://commonslibrary.
parliament.uk/constituency-data-indices-of-deprivation/ [date accessed: 26/03/21]
10 The MRP results produced the proportion of the total population in each constituency that lay within different 10% bands of the index. We
then used this to estimate what proportion of the population in each constituency had an overall negative place satisfaction score and compared
this to the national average.
18NEGATIVE PLACE SATISFACTION SCORES
ARE LINKED TO VOTING ‘LEAVE’
TOP (LOWEST % OF THE Finally, we looked at whether there was a connection
POPULATION WITH NEGATIVE between place satisfaction index scores and how
SCORES) people voted in the 2016 referendum and the 2019
general election.
1. Hackney North & Stoke Newington
In general, people who voted Liberal Democrat in
2. Islington North 2019 had higher average index scores (+34) than
those who voted Conservative (+28), SNP (+27) or
3. Islington South and Finsbury
Labour (+24). The small proportion of the population
4. Hackney South and Shoreditch who voted for the Brexit party in 2019 had far lower
place satisfaction index scores on average (+13).11
5. Streatham
Exploring the results by how people voted in the
2016 referendum did not give a strong result when
BOTTOM (HIGHEST % OF THE looking at overall or thematic place satisfaction index
POPULATION WITH NEGATIVE scores, however there did seem to be a suggestion
SCORES) that people who had a negative score - that is,
people who rated provision of things that were
1. Sittingbourne and Sheppey important to them as nearer bad than good - were
more likely to have voted Leave, as Chart 8 shows.
2. Ealing North
This suggests that some people who voted in favour
3. Hemsworth of leaving the EU may have felt that it would help
improve their local area, or conversely that their
4. North East Cambridgeshire
frustration with the ‘local offer’ led them to vote
5. Gravesham Leave; the issues that are particularly relevant for the
cohort with negative place satisfaction index scores
are explored in Chapter 7.
11 1.7% of our weighted sample (348 people).
19In the sections that follow we first paint a portrait
of the relative priorities of British people across all
categories, then explore the particularly complex
relationship that people have with the provision of
local shopping opportunities. Chapter 4 conducts
a deep-dive into the desires of the large group
of people who live in town and city suburbs,
and considers the extent to which provision of
local amenities and services are fit for purpose,
with implications for policymakers, planners and
developers alike. We then look at the very different
results obtained in rural areas, provide an insight
into the differing preferences of the people who live
in urban centres and conclude by exploring what
policymakers need to do to reduce negative place
satisfaction scores. The implications of these results
are then presented in the final chapter.
20CHAPTER 2
WHAT DO PEOPLE
WANT FROM THEIR
LOCATION?
In this chapter, we focus on one aspect of the WE ARE A NATION OF SUPERMARKET
research that was undertaken to construct the place SHOPPERS
satisfaction index, namely the relative priorities of
We have already seen that access to good local
different items within the broad themes.12 By looking
shops is seen as a high priority. Delving a little
at these in turn we can paint a picture of everyday
deeper shows that within the broad shopping
life in early 21st century Britain.
theme, supermarkets are the most favoured type of
shopping outlet, with around half of the population
12 These subcategories are listed in the Appendix.
21(48%) picking them as their top priority, followed by WE LIKE GOING OUT TO EAT AND DRINK
local independent shops (28%).13 By comparison, (BUT NOT WITH YOUNG CHILDREN)
other shopping facilities are regarded as less
Within the broad category of ‘going out’, the highest
important, including high streets with national chain
priority is given to ‘local places to eat and drink’
stores (10%), shopping malls (8%) and places to
which receives an overall majority (52%) of first
deliver and pick up parcels (6%).
preference rankings. This is particularly so for people
This popularity of supermarkets is uniform across all living outside city centres and in rural areas.
regions and nations of Britain and all demographic
However, amongst those on lower household
types. However they are particularly popular among
incomes (under £20,000) this support is slightly
people over 50 and, as we will see in Chapter 4,
more muted (48%) in favour of ‘local culture’ and
those living in suburbs. Younger people (under 30)
‘places designed for children’; a factor to bear in
were more likely to prefer large shopping malls than
mind when ensuring that communities contain leisure
other population groups but supermarkets were still
opportunities for everyone, including households
their most popular shopping outlet.
with lower disposable incomes. And only 35% of
Access to local independent shops also becomes people with exclusively young children (under 12)
more important as people get older: 20% of people rated ‘local places to eat and drink’ as their top
aged 18-24 cite local independent shops as their priority, with 41% choosing ‘places designed for
top priority rising to 34% for those aged 65 or over. children’ instead. For those living with older children,
Younger people find high streets with national chain restaurants and cafes start to become more popular
stores and shopping malls more of a draw. City again as Chart 11 shows.
centre dwellers and people from ethnic minority
backgrounds also give a slightly higher weight than
other population groups to high street national
chain stores and shopping malls, although they still
prioritise supermarkets overall.
13 During the research we asked people to rank their top three items within each theme. However, for ease of presentation, we describe
our results as in terms of the percentage who chose each item as their first priority. Unless otherwise stated, using weighted rankings does not
change the main finding.
22OUR PARKS ARE HUGELY VALUED
Within our ‘fresh air and nature’ theme, we found very
strong support for ‘clean, green spaces within towns
and cities such as parks’, which received 49% of first
preference responses, more than safe levels of air
pollution (19%), guidance for local walks and nature
spots (17%) and reducing or banning traffic in areas
within towns and cities (14%).
23Priorities are, however, affected by the type of preference for local ‘swimming pools’, with 32%
location. Parks are particularly valued in suburban ranking it above other types of exercise facilities.
settings; urban centres place more priority than However, there was also significant support for
elsewhere on reducing or banning traffic (19%) and, ‘gyms with equipment for individual workouts’ (21%),
possibly unsurprisingly, guidance for local walks and ‘pitches or courts for group sport’ (19%), and ‘venues
nature spots was particularly valued in rural areas for exercise classes’ (17%). By contrast, despite the
(26%). The under-35s attach slightly greater priority surge in popularity for jogging during the pandemic
to issues affecting air pollution and walking, while just 10% of people we surveyed ranked ‘signed
older people are even more likely to prioritise parks. running routes’ as their top priority.14
Priorities for local exercise vary considerably across
OLDER PEOPLE LIKE SWIMMING POOLS, different age groups, with younger people generally
YOUNGER PEOPLE LIKE GYMS less concerned about the provision of swimming
Within the high-level theme of places to take pools and more in favour of gyms, a trend that
exercise, participants in general expressed a reverses as ages rise.
14 Macmillan Cancer Support. Keep calm and jog on: millions turn to running to relieve lockdown stresses. 2021. Available at: https://
londonmarathon.macmillan.org.uk/about/news/keep-calm-and-jog-on [date accessed: 26/03/21]
24CRIME PREVENTION IS CITED GARDENS ARE PARTICULARLY
AS A HIGHER PRIORITY THAN IMPORTANT FOR OLDER PEOPLE
NEIGHBOURLINESS
Within the broad category of suitable housing,
At the time that the survey was undertaken - in we asked people to rank their preferences around
between lockdowns two and three - neighbours housing tenure, affordability, gardens and places
knowing each other and working to help each for home offices. We also included an option for
other, whilst viewed positively, was rated as a lower aspirational housing which we phrased as ‘higher
priority for the population as a whole than local quality, more expensive housing that will improve the
crime prevention measures and easy access to feel of the area’.
public services. This is likely to be a hierarchy of
needs: meaningful engagement with neighbours For Britain as a whole, ‘affordable housing to buy’
may be easier to pursue when fear of crime in a and ‘homes with gardens’ are the most popular
neighbourhood is reduced. housing choices, each commanding 30% of
first preference choices. The next most popular
25category was ‘affordable housing to rent’ (25% of be prioritised by people with larger families: 42%
first preferences) while lower order priorities overall of people living with both younger children (under
included ‘higher quality, more expensive housing’ 12) and older children (between 12-17) included it in
(9%) and ‘homes with space for a home office’ (6%). their top three choices.
Given that the tenure of ‘homes with gardens’ is not
specified, this is a particularly strong result, perhaps Demand for homes with gardens and affordable
reflecting the importance that people attach to housing to rent are connected - in opposite ways - to
having their own private outdoor space during the socioeconomic group, as the chart below shows. In
pandemic. Chapter 7 we discuss in more detail the priorities of
people who are more income constrained.
In city centres, ‘affordable housing to rent’ was the
most popular category (30% of first preferences)
whereas in rural areas ‘homes with gardens’ was the PUBLIC TRANSPORT IS A NECESSITY FOR
most important category (38% of first preferences). THOSE ON LOW INCOMES
Separately, there is a clear connection between Of the population as a whole, the strongest support
wanting homes with gardens and age: 16% of those - 45% of first preferences - went to the public
under 24 ranked it as their top priority, rising in a transport option of ‘affordable and regular buses and
linear fashion to 43% of the over-70s. trains’, which was prioritised over the private vehicles
option of ‘good roads, convenient parking and
electric vehicle charge points’ (39%), with ‘investment
PEOPLE FORCED TO WORK FROM HOME in cycling’ coming in a distant third at 16%.
SEE THE VALUE IN HOME OFFICES
Although the priority placed on home offices is However, socioeconomic group also plays a large
low overall, it is more likely to be important to part in people’s priorities when it comes to transport
those required to work from home because of the services with those on lower incomes understandably
pandemic than to other working people, or those placing an even greater priority on public transport,
not working. Of those required to work from home while those on higher incomes give a higher priority
because of the pandemic, 43% included it in their to the car-based option. In our sample 40% of those
top three housing priorities, compared to 29% of on incomes of less than £20,000 did not own or have
working people who were not required to work access to a vehicle, compared to 24% for the country
from home because of the pandemic and 32% of as a whole.
the population as a whole. It is also more likely to
26THERE IS A MARKET FOR LOCAL DESK As we discussed in our parallel project around how
SPACE people’s relationship with place has been affected
by the pandemic, personal experience seems to be
Finally we explored what types of premises people
relevant. Local desk spaces for remote office workers
thought were most important in order to support
are more likely to be the top priority in this for
jobs in the area.
working people who had been required to work from
The results perhaps reflect the differing historic home (17%), than those who hadn’t (11%), and also
investment patterns and employment structures by working people living with young children under
in different parts of the country, with premises the age of 12 (16%) compared to working people
for small and medium sized businesses receiving with no children (14%).
the most support, particularly outside urban
Possibly also because they welcome space outside
centres. Self-employed people are more likely to
the home to work, people earlier in their careers
prioritise workspaces for entrepreneurs and start-
are also more likely to prioritise local desk space for
up companies, with 28% of self-employed people
office workers: across the whole country nearly one
choosing this as their top priority of all the options
in five (19%) of people in their 20s ranked it as their
provided regarding premises for jobs compared to
top priority in the jobs category.
20% of the population as a whole.
27SHOPS ARE THE MOST URGENT
REGENERATION PRIORITY
Bringing all this together, we asked those surveyed
to select the one high level theme from the nine
being measured that they felt most urgently needed
improving in their local area. This is the ‘call to
action’ question that is designed to give a derived
measure of which aspect of regeneration would be
most welcome.
As the chart below shows, for the country as a whole
responses were fairly evenly spread but the top
priority was ‘good local shops’ (17%) followed by
‘good transport’ (15%).
When comparing this to the results of the place
satisfaction index, which compares people’s priorities
with how they rate actual provision, the priority given
to transport is to be expected: as we saw in the last
chapter this is prioritised highly and people tend to
think provision is less good than other amenities and
services.
More surprising, therefore, is the result around shops
given that, as we saw in the previous chapter, people
on the whole rate the provision of shops in their area
relatively highly. Why is it that people cite ‘good
local shops’ as their top regeneration priority, while
at the same time reporting that provision is already
reasonably good? This is the question that we
explore in the next section.
2829
CHAPTER 3
SHOPS AS A SOURCE
OF COMMUNITY
PRIDE
We saw in the previous chapters that despite being              In addition, when considering our town typology, we
more satisfied with the shopping offer than other               found that a slightly higher proportion regard local
aspects of what was available in their localities, there        shops as a regeneration priority in rural towns (19%)
is also - perhaps paradoxically - a sense of urgency            than the commuter ‘hub and spoke towns’ (15%).
around improving local shops as a regeneration
priority.                                                       Politically, support for improving the shopping offer
                                                                is greater among Leave (19%) and Conservative
In this section we explore in more detail the                   (20%) voters. On the other hand, those on the
relationship that people have with shops and what               highest household incomes (above £100,000) are
it means for planning and policy in the future. As              less likely to regard better local shops as their most
well as drawing on the poll we also explored the                urgent priority (14%). Geographically, support for
issue in more depth during focus groups that were               shops as a regeneration priority is lower in London
undertaken in February 2021 with people who live in             and the South East and Wales and higher in the
towns in the North and South of England.                        North East and Scotland.

IMPROVING THE SHOPPING OFFER IS                                 LOCAL SHOPS ARE A SYMBOL OF THE
PARTICULARLY IMPORTANT FOR OLDER                                HEALTH OF A PLACE
PEOPLE, AND THOSE ON THE OUTSKIRTS                              We explored the relationship that people had
OF TOWNS.                                                       with their local shops and high streets in the focus
The need to improve the local shopping offer is                 groups and found a widely held sense of regret
a popular view across all population groups and                 about what people perceive to be the demise of
locations. However, it is felt particularly strongly by         the local high street. It was one of the main aspects
older people (22% for those 55 and over compared                that participants referred to when they were asked
to 17% for the country as a whole) and people living            to describe the area in which they live and it was
in towns, but outside the town centres (20%).                   evident from their feedback that local shops are a
                                                                kind of visual symbol of the overall socioeconomic
At the finest level of granularity, our data show               health – and prestige - of a place.
particular support for improving the shopping offer
among people living outside the centre of towns in                    A lot of high street shops have now closed.
the East Midlands (23%), East of England (22%) and                    And so the high street itself is kind of bare
in particular Scotland (27%).                                         compared to how it was perhaps 5-10 years
                                                                      ago. So yeah, it’s becoming quite derelict
                                                                      [Group of workers, North]

                                                           30
There is some appreciation of the challenge faced
by independent shops to compete with chains
The high street has gone now. People used and, particularly, with the convenience of one-stop-
to work for banks, insurance companies shopping at big brand supermarkets. However, the
but they’ve all gone. Now it’s just charity prevailing feeling is that the two should be able to
and takeaway shops and pubs. There is no co-exist locally.
community spirit.
[Group of non-workers, North] I think having your own independent
greengrocers, and butchers and things like
The Highstreet is under-invested. There are that, get them on your high street along
lots of empty shops, lots of charity shops and with chains, and have them all mixing and
barbers. It needs more variety to match the co-existing together. Certainly, I think there’s
new builds. High street is somewhere that room for it where I live, people do want it.
could help the area thrive. And I think if they can coexist with the chains,
it will help the high street, because for your
[Group of workers, South] independent shops, they’re only going to
employ a set amount of people before when
Apart from the cinema complex, there’s not they start to employ the big people, that’s
very much to do. And because the high street when they become big chains. And so I
is just full of charity shops and, because the think we need a mixture of both, one for the
area really isn’t terribly affluent any more, the economy, two for people’s jobs and three to
charity shops aren’t that good, you know? keep it vibrant.
[Group of non-workers, South] [Group of workers, North]
A FIT-FOR-PURPOSE HIGH STREET SHOPPING AREAS SHOULD ENCOURAGE
REQUIRES A MIX OF SHOPS PEOPLE TO GO THERE
People are looking for a mix of shops to be However, a successful high street is perceived to
represented on their high streets to ensure they be about more than just the shops. It also requires
don’t have to go out of the area to meet their local shopping areas to be accessible and for people
everyday shopping needs. This includes having both to want to go there. A number in the focus groups
brands and independent outlets, different categories
of retail, and not just ‘low end’ shops (e.g. charity,
betting and money lending shops).
31You can also read