Potential Structural Solutions to Mitigate Flooding in the Lake Champlain-Richelieu River Basin - International Joint ...
←
→
Page content transcription
If your browser does not render page correctly, please read the page content below

Potential Structural
Solutions to Mitigate
Flooding in the Lake
Champlain-Richelieu
River Basin
International Lake Champlain - Richelieu River Study

A REPORT TO THE INTERNATIONAL JOINT COMMISSION

 Submitted by
 Flood Management and Mitigation Measures
 Technical Working Group

 AND
 Hydrology, Hydraulics, and Mapping
 Technical Working Group

 March 2021
 1

2
ACKNOWLEDGMENTS

This report has been a collaborative effort between the Flood Management and
Mitigation Measures (FMMM) and Hydrology, Hydraulics and Mapping (HHM)
Technical Working Groups (TWGs).

The report benefitted from the contributions of Marianne Bachand, Mathieu Roy,
Bernard Doyon, and Rose Paul of the Resource Response TWG. The report received
valuable review and comments from the Study Board members, study managers, all
Technical Working Groups and Social, Political, Economic Advisory Group. A
comprehensive review of the report was conducted by the Independent Review Group
(IRG). We also would like to thank Kathy Hall for her thorough editing of the report.
The report was significantly improved because of all these reviews.

TECHNICAL WORKING GROUPS

FMMM, Canada FMMM study co-lead, Canada
 HHM, Canada
Jan Adamowski Olivier Champoux Ted Yuzyk

Pascal Marceau Milena Dimitrijevic
Syed Moin Simon Lachance-Cloutier FMMM study co-lead, United States

 Dominic Roussel Bill Werick

FMMM, United States

Ben Rose HHM, United States HHM study co-lead, Canada

 Tim Calappi Jean Morin

 Chris Gazoorian

 Blaine Hasting HHM study co-lead, United States

 Bill Saunders Jesse Feyen

 i
2
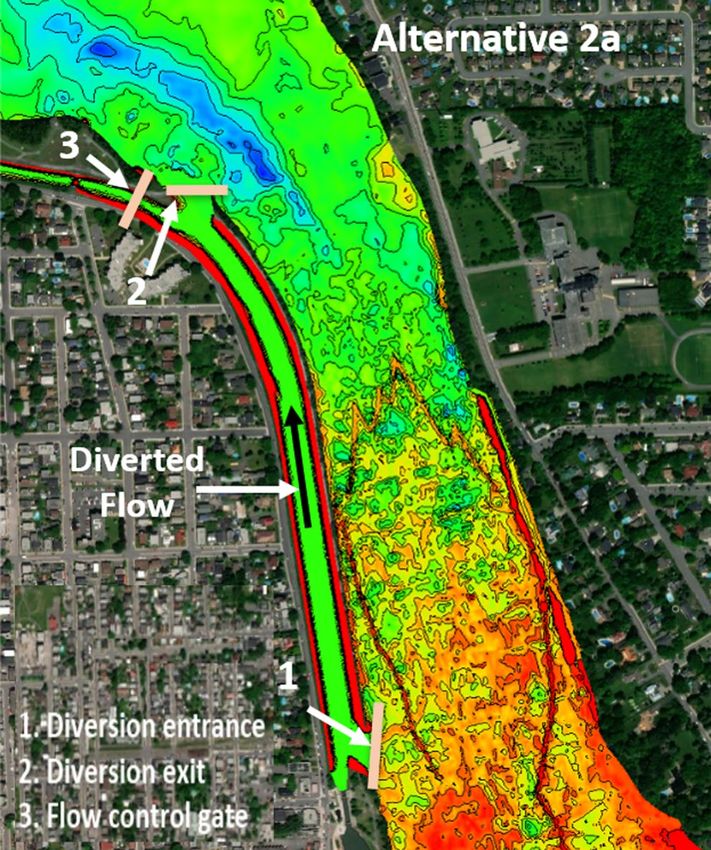
EXECUTIVE SUMMARY

This report documents the formulation and preliminary evaluation of a wide range of
structural solutions to reduce extreme water levels in the Lake Champlain-Richelieu
River system. The alternatives identified in this report include structural solutions from
the 1973 International Joint Commission reference study, ideas for potential structural
solutions provided by stakeholders during the current study, and potential solutions
identified from a literature scan.

STRUCTURAL SOLUTIONS DECISION CRITERIA
Seven potential structural solutions were identified and The information compiled by the study to date was used
subjected to a preliminary assessment of their by the Study Board to determine which alternatives
effectiveness in reducing extremely high water levels, warrant a more comprehensive analysis; this will require
while not exacerbating drought water levels; the number further significant resources and time to complete. The
of residential buildings that would potentially be spared data and results of analyses presented in this report are
from flooding; and some economic and environmental those that were available as of July 2020. The decision
implications associated with their implementation. The criteria that were applied are:
alternatives are as follows:
 1 Within study scope and mandate
1 Excavating of human interventions on Saint-Jean-
 sur-Richelieu shoal (eel trap, submerged dikes). 2 Implementable

2 a. Diverting moderate flow through the Chambly 3 Technically viable
 Canal with a conservative diversion scheme.
 4 Economically viable
 b. Diverting significant flow through the Chambly
 Canal with an optimized diversion scheme. 5 Equitable and fair

3 Alternative 2a combined with Alternative 1. 6 Environmentally sound

4 Moving the control by installing a fixed weir 7 Robustness to climate change.
 upstream of Saint-Jean-sur-Richelieu and dredging
 the channel.

5 Installing an inflatable weir or bladder upstream of
 Saint-Jean-sur-Richelieu and dredging the channel.

6 Installing an inflatable weir or bladder at the Saint-
 Jean-sur-Richelieu shoal and dredging the channel.

 iii
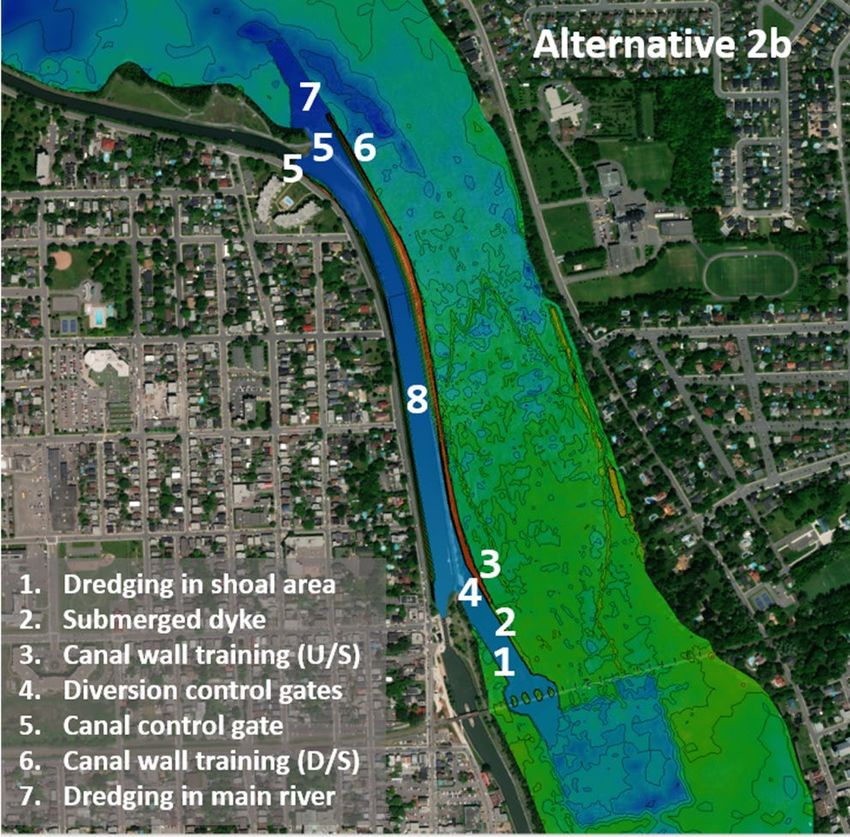
STUDY FOCUS the most promising solution. The Study Board decided
 that Alternative 2b particularly warranted the study’s
The Study Board debated the utility, effectiveness in further attention, as Alternative 2a was a less effective
reducing floods, potential impact on drought levels, utilization of the canal.
number of residential buildings that would be spared
from flooding and some of the economic and This alternative has the potential to provide significant
environmental implications of implementing each flood relief, negligible impact on low water levels, and
alternative. Central to the discussions was the need to potentially limited environmental implications.
adhere to the U.S. and Canadian Governments’ request Alternatives 1 and 3 were less appealing to the Study
to focus on “moderate structural works” as the Study Board, as they would result in permanent water level
Board aids the International Joint Commission in fulfilling lowering, which could be problematic if climate change
the terms of that reference from the two governments. reduces net basin supplies, as some early climate work is
The Study Board interpreted that Alternatives 4, 5 and 6 predicting. Alternatives 1 and 3 are still in consideration
were major structural solutions, as they involved the pending the results of the Alternative 2b evaluation.
damming of the river with significant effect on the flow
regime and the environment. The unsuccessful history of The Study Board has directed the study team to continue
trying to implement a dam further indicated to the Study the analysis of the diversion (with a focus on Alternative
Board that there still may be little political and social 2b), provide thorough cost estimates and explore various
appetite to pursue such a flood control structure. The potential operating plans. The appropriate hydraulic
Study Board determined that no further study resources simulations, evaluations, and a benefit/cost analysis also
should be committed to Alternatives 4-6. will be done. Moving forward, the Study Board will be
 working closely with Parks Canada to further evaluate
The Study Board therefore focused its attention on modifying the Chambly Canal as a potentially
Alternatives 1, 2 and 3, as these could be considered to acceptable diversion scheme.
be moderate structural solutions. It was concluded that
the diversion of water through the Chambly Canal was

 iv
v
STAY CONNECTED, BE ENGAGED

Want more information on the Lake Champlain-Richelieu River Study? Have a question
for the Study Board?

Email the Study at lcrr@ijc.org

Sign up to receive Study news, such as notices of public meetings, consultations, reports, fact sheets, and other publications

Follow the Study on social media
 @IJCsharedwaters

 www.facebook.com/internationaljointcommission/

 www.linkedin.com/company/international-joint-commission/

 vi
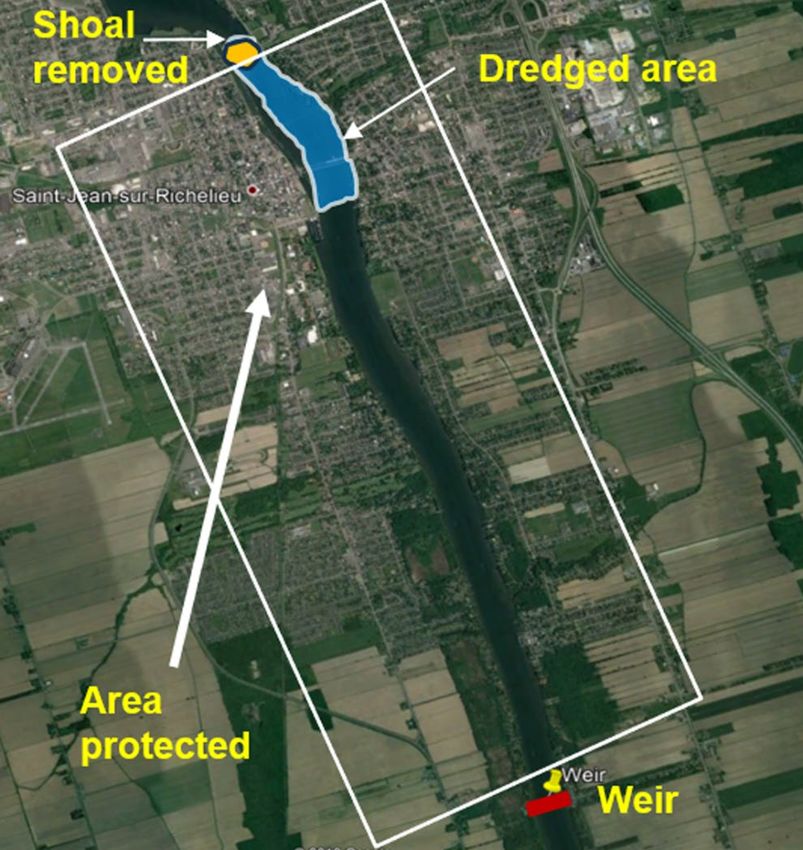
TABLE OF CONTENTS
Acknowledgments i
Executive Summary iii
Stay Connected, Be Engaged vi

1 INTRODUCTION TO THE REPORT 1

 1.1 A CALL TO ACTION 1

 1.2 REPORT SCOPE AND STRUCTURE 1

2 LAKE CHAMPLAIN-RICHELIEU RIVER BASIN 3

 2.1 PHYSICAL SETTING 3
 2.1.1 Lake Champlain 3
 2.1.2 Richelieu River 4

 2.2 LAKE CHAMPLAIN HYDROLOGY 5
 2.2.1 Data Sources 5
 2.2.2 Lake Champlain Water Levels 5
 2.2.3 Designation of Lake Floods 7

 2.3 RICHELIEU RIVER HYDROLOGY 8
 2.3.1 Richelieu River Peak Discharges 8
 2.3.2 2011 Historic Flood 9

 2.4 FREQUENCY ANALYSIS OF HYDROLOGICAL DATA 11
 2.4.1 Quantiles Corresponding to Return Periods of Interest 11

 2.5 CLIMATE CHANGE IMPLICATIONS 14
 2.5.1 IJC’s Climate Change Guidance 14
 2.5.2 Climate Change Studies 15
 2.5.3 Study’s Climate Change Work 15
 2.5.4 Extension of Forecasts for 50 Years 18
 2.5.5 Assessment of Climate Change using the IJC Planning Guidance 19

 vii
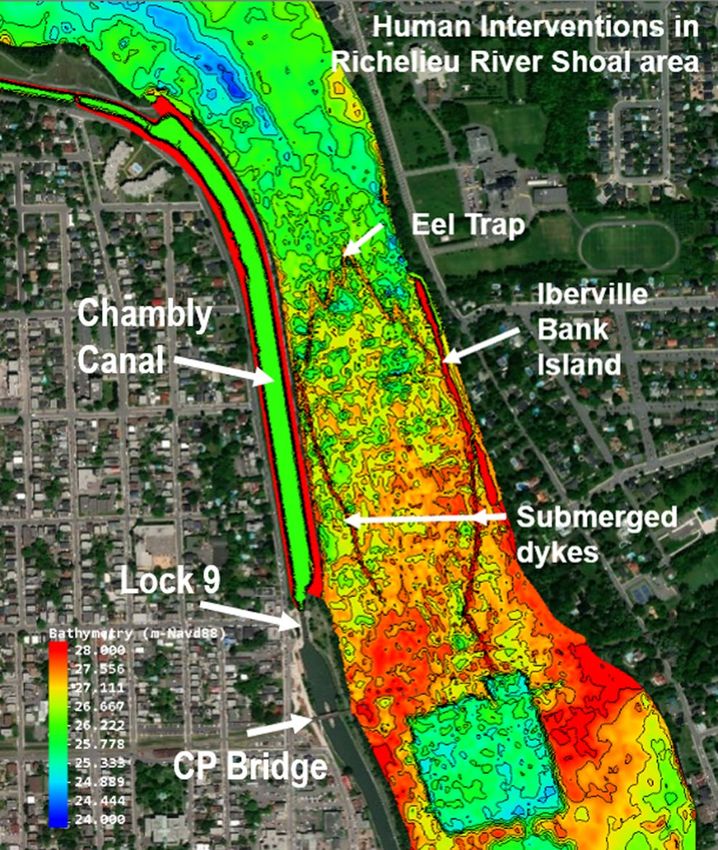
3 THE RICHELIEU RIVER 20

 3.1 HYDRAULIC CONTROL SECTION 20

 3.2 HUMAN INTERVENTIONS IN THE RIVER 22

 3.3 HYDRAULIC IMPLICATIONS OF THE HUMAN INTERVENTIONS 24

4 HISTORY OF PROPOSED STRUCTURAL MITIGATION MEASURES 25

 4.1 1930S IJC REFERENCE 25

 4.2 1970S IJC REFERENCE 26
 4.2.1 International Champlain- Richelieu Board 27
 4.2.2 Chambly Canal Issue 29
 4.2.3 IJC Perspective on Regulation and Advice to the Governments 30
 4.2.4 Response to IJC 1981 report 31

 4.3 STRUCTURAL MITIGATION LEGACY 31

5 STRUCTURAL FLOOD MITIGATION MEASURES 32

 5.1 STUDY FLOOD MITIGATION FRAMEWORK 32

 5.2 SCAN OF INNOVATIVE STRUCTURAL SOLUTIONS TO ADDRESS FLOODING 33

 5.3 POTENTIAL STRUCTURAL ALTERNATIVES 34
 5.3.1 Addressing Human Interventions in the Richelieu River 34
 5.3.2 Application of Instream Flow Modification Structures 35
 5.3.3 Water Diversion Schemes 36
 5.3.4 Flood-related Engineering Modifications on the Floodplain 38

6 MODELLING OF STRUCTURAL ALTERNATIVE IMPACTS 39

 6.1 EVALUATION FRAMEWORK 39

 6.2 CALIBRATED WATER BALANCE MODEL 40

 6.3 2-D HYDRODYNAMIC MODEL 42

 viii
6.4 INTEGRATED SOCIAL ECONOMIC AND ENVIRONMENTAL (GIS) SYSTEM 43

 6.5 COLLABORATIVE DECISION SUPPORT TOOL 45

7 PRELIMINARY EVALUATION OF PROPOSED STRUCTURAL ALTERNATIVES 46

 7.1 CONTEXT FOR SELECTIONS 46

 7.2 ALTERNATIVE 1: EXCAVATING OF HUMAN INTERVENTIONS ON THE
 SAINT-JEAN-SUR-RICHELIEU SHOAL 46
 7.2.1 Description 46
 7.2.2 Hydraulic Implications (river, lake, based on 2011 flood and 1964 drought) 47
 7.2.3 Considerations 47

 7.3 ALTERNATIVE 2A: DIVERTING MODERATE FLOW THROUGH THE
 CHAMBLY CANAL WITH A CONSERVATIVE DIVERSION SCHEME 48
 7.3.1 Description 48
 7.3.2 Hydraulic Implications (river, lake, based on 2011 flood and 1964 drought) 48
 7.3.3 Considerations 48

 7.4 ALTERNATIVE 2B: DIVERTING SIGNIFICANT FLOW THROUGH THE
 CHAMBLY CANAL WITH AN OPTIMIZED DIVERSION SCHEME 49
 7.4.1 Description 49
 7.4.2 Hydraulic Implications (river, lake, based on 2011 flood and 1964 drought) 49
 7.4.3 Considerations 50

 7.5 ALTERNATIVE 3: ALTERNATIVE 2A COMBINED WITH ALTERNATIVE 1 50
 7.5.1 Description 50
 7.5.2 Hydraulic Implications (river, lake, based on 2011 flood and 1964 drought) 50
 7.5.3 Considerations 50

 7.6 ALTERNATIVE 4: FIXED WEIR UPSTREAM OF SAINT-JEAN-SUR-RICHELIEU 51
 7.6.1 Description 51
 7.6.2 Hydraulic Implications (river, lake, based on 2011 flood and 1964 drought) 51
 7.6.3 Considerations 51

 7.7 ALTERNATIVE 5: INFLATABLE WEIR OR BLADDER UPSTREAM OF
 SAINT-JEAN-SUR-RICHELIEU 51

 ix
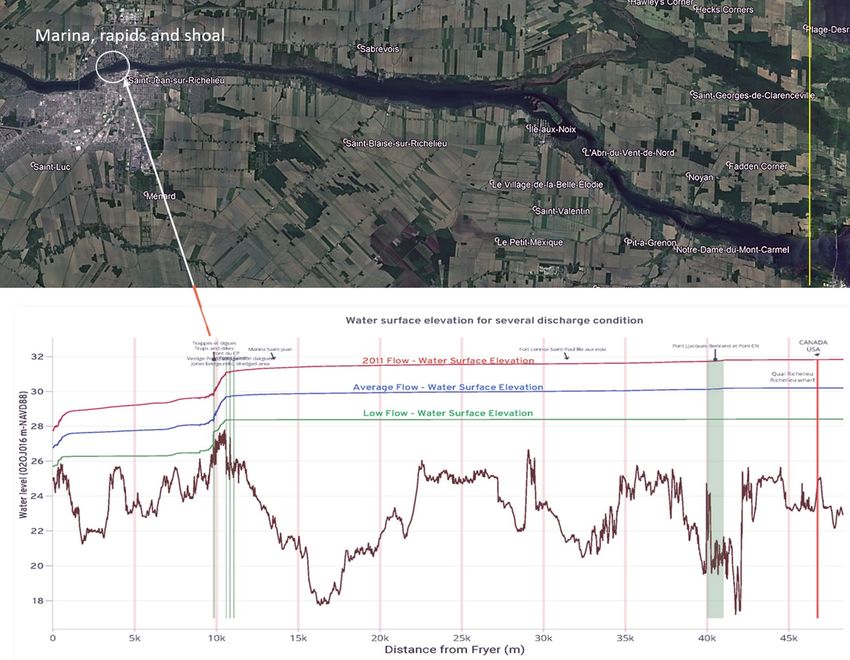
7.7.1 Description 51
 7.7.2 Hydraulic Implications (river, lake, based on 2011 flood and 1964 drought) 52
 7.7.3 Considerations 52

 7.8 ALTERNATIVE 6: INFLATABLE WEIR OR BLADDER AT SAINT-JEAN-SUR- RICHELIEU 52
 7.8.1 Description 52
 7.8.2 Hydraulic implications (river, lake, based on 2011 flood and 1964 drought) 52
 7.8.3 Considerations 53

 7.9 STUDY BOARD EVALUATION AND RANKING OF THEME 1 ALTERNATIVES 53
 7.9.1 Decision Criteria 53
 7.9.2 Alternatives 4, 5, and 6 57
 7.9.3 Alternatives 1, 2a, 2b, and 3 57
 7.9.4 Board Direction on Theme 1 Alternatives 58

8 SUMMARY 59

List of Figures
Figure 2-1 │ Lake Champlain - Richelieu River Basin 3

Figure 2-2 │ Key features of the Richelieu River (note: the vertical scale on the cross-sectional view is not linear) 5

Figure 2-3 │ Peak and average Lake Champlain water levels 6

Figure 2-4│ Major floods of the 1990s and 2011 Event 8

Figure 2-5│ Peak annual Lake Champlain inflows and outflows into the Richelieu River 8

Figure 2-6│ Average annual outflows in Richelieu River, showing a step function and a shift in average flows 8

Figure 2-7 │ NBS inflows and outflows into Richelieu River for 2011 flood 10

Figure 2-8 │ Climate change guidance framework 14

Figure 2-9 │ Climate simulations of the mean annual flow in Richelieu River 16

Figure 2-10 │ Climate simulations of the peak annual flow in Richelieu River 17

Figure 2-11 │ Extension of the time series forecast for 50 years 18

Figure 3-1 │ Longitudinal profile for Richelieu River, Rouses Point to Fryer Island Dam 21

Figure 3-2 │ Human intervention on the shoal 22

 x
Figure 3-3 │ Eel trap located on the shoal 22

Figure 4-1 │ Fryer Island Dam
(https://www.pc.gc.ca/en/lhn-nhs/qc/chambly/culture/ingenierie-engineering/barrage-fryer-dam) 25

Figure 4-2 │ Fixed crest weir at Saint-Jean-sur-Richelieu 27

Figure 4-3 │ Six-gated structure near Saint-Jean-sur-Richelieu 28

Figure 4-4 │ Chambly Canal widening 29

Figure 5-1 │ Study flood mitigation framework 32

Figure 5-2 │ Inflatable weir or bladder used to regulate flow 33

Figure 5-3 │ One section of an inflatable dam, not inflated 34

Figure 5-4 │ Hudson and Yamaska proposed diversions 37

Figure 6-1 │ Models used to generate alternative evaluations 39

Figure 6-2 │ Iterative process in the Water Balance Model 42

Figure 6-3 │ Integrated Social Economic and Environmental System 44

Figure 6-4 │ A visualization of the flood layer in ISEE showing Burlington, VT near the corner of
Maple Street and Island Line Trail 44

Figure 6-5 │ Collaborative Decision Support Tool (CDST) 45

Figure 7-1 │ Human interventions removed from Saint-Jean-sur-Richelieu Shoal under Alternative 1 47

Figure 7-2 │ Alternative 2a - Diversion below Lock 9 of Chambly Canal 48

Figure 7-3 │ Alternative 2b - Modified and optimized configuration of diversion 49

Figure 7-4 │ Dredging of human interventions and Chambly Canal diversion 50

Figure 7-5 │ Fixed submerged weir in the Richelieu River upstream of Saint-Jean-sur-Richelieu 51

Figure 7-6 │ Inflatable weir or bladder 52

Figure 7-7 │ Decision criteria scoring template for Theme 1 alternatives 56

Figure 7-8 │ Summary of the Study Board's scores 56

 xi
List of Tables
Table 2-1 │Highest events since 1925, ranked by NBS 7

Table 2-2 │ US National Weather Service’s flood classification criteria
(https://water.weather.gov/ahps2/hydrograph.php?gage=roun6&wfo=btv) 7

Table 2-3 │ Precipitation in Burlington, Vermont, Spring 2011 (Causes and Impacts Report, LCRR 2020) 9

Table 2-4 │ Lake Champlain water levels - quantiles corresponding to specific return periods (Ouarda, et al., 2019) 12

Table 2-5 │ Richelieu River discharge - quantiles corresponding to specific return periods 13

Table 2-6 │ Net Basin Supplies - quantiles corresponding to specific return periods 13

Table 2-7 │ Potential for a 2011 like flood in Lake Champlain Richelieu River under climate projections 17

Table 3-1 │ Selected human interventions in the Richelieu River 23

Table 3-2 │ Estimated hydraulic impacts of human interventions on 2011 flood (discharge of 1,537 m3/s) 24

Table 4-1 │ Estimated water level changes in Lake Champlain due to the widening of the Chambly Canal
(Ad Hoc Committee, ICRB, 1979) 29

Table 7-1 │ Study Board decision criteria 54

Table 7-2 │ Data presented to the Study Board for evaluating the seven alternatives 55

 xii
List of Acronyms
The following is a list of acronyms used in the report:

 BWT Boundary Water Treaty

 CAWG Climate Adaptation Working Group

 CDST Collaborative Decision Support Tool

 CLIMEX Climate Extremes

 CMIP Coupled Model Inter-comparison Project

 CORDEX Coordinated Regional Downscaling Experiment

 COVABAR le Comité de concertation et de valorisation du bassin de la rivière Richelieu

 CPR Canadian Pacific Railway

 CRCM Canadian Regional Climate Model

 ECCC Environment and Climate Change Canada

 FMMM Flood Management and Mitigation Measures

 GCM General Circulation Model

 GIS Geographic Information System

 GSC Geodetic Survey of Canada

 H2D2 Two-Dimensional Hydraulic and Dispersion Simulation

 HHM Hydrology, Hydraulics and Mapping

 ICRB International Champlain-Richelieu Board

 ICREB International Champlain-Richelieu Engineering Board

 IJC International Joint Commission

 xiii
List of Acronyms (continued)
 ILCRRSB International Lake Champlain-Richelieu River Study Board

 INRS Institut national de la recherche scientifique

 Fifth Assessment Report of the United Nations Intergovernmental
 IPCC5
 Panel on Climate Change

 ISEE Integrated Social Economic and Environmental

 IUGLS International Upper Great Lakes Study

 LCBP Lake Champlain Basin Program

 LCRR Lake Champlain-Richelieu River

 LOSLR International Lake Ontario - St. Lawrence River Study

 NAVD88 North American Vertical Datum of 1988

 NBS Net Basin Supplies

 NGVD29 National Geodetic Vertical Datum of 1929

 NOAA National Oceanic and Atmospheric Administration

 PI Performance Indicator

 PMF Probable Maximum Flood

 QM Quarter-month

 RCM Regional Climate Model

 SJSR Saint-Jean-sur-Richelieu

 SPE Social, Political, Economics Advisory Group

 TWG Technical Working Group

 xiv
List of Acronyms (continued)
USACE United States Army Corps of Engineers

USGS United States Geological Survey

USWRC United States Water Resources Council

WBM Water Balance Model

WRF Weather Research and Forecasting

 xv
Measurement Units and Datum Conversion Factors
Metric System – United States Customary Measurement System Units
(With abbreviations)

Length
1 millimetre (mm) = 0.0394 inch (in)
1 in = 25.4 mm
1 centimetre (cm) = 0.3937 in
1 in = 2.54 cm
1 metre (m) = 3.2808 feet (ft)
1 ft = 0.3048 m
1 kilometre (km) = 0.6214 mile (mi)
1 mi = 1.6093 km

Area
1 square kilometre (km²) = 0.3861 square mile (mile²)
1 mile² = 2.59 km²
1 hectare (ha) = 2.47 acres
1 acre = 0.405 ha

Volume
1 cubic metre (m3) = 35.315 cubic ft (ft³)
1 ft3 = 0.02832 m³
1 cubic decametre (dam3) = 1000 m3
1 dam3 = 0.810714 acre-foot (ac-ft)
1 ac-ft = 1.233481 dam3

Flow rate
1 cubic metre per second (m³/s) = 35.315 cubic ft per second (ft³/s)
1 ft3/s = 0.02832 m³/s

 xvi
NAVD88 – NGVD29 Datum Conversion Factor at Rouses Point
Datums are the basis for all geodetic survey work. A geodetic datum is an abstract coordinate system with a reference
surface (such as sea level) that provides known locations from which to begin surveys and create maps.

For this report, example of conversion between National Geodetic Vertical Datum of 1929 (NGVD 29) and North American
Vertical Datum of 1988 (NAVD 88), which is specific for a given location specified by the latitude and longitude, will be
given for Rouses Point that is the geographical outlet of Lake Champlain.

NAVD88 (ft) = NGVD29 (ft) – 0.43 (ft)

NGVD29 (ft) = NAVD88 (ft) + 0.43 (ft)

NAVD88 (m) = NGVD29 (m) – 0.131 (m)

NGVD29 (m) = NAVD88 (m) + 0.131 (m)

 xvii
1 INTRODUCTION TO THE REPORT

This report documents the formulation and preliminary evaluation of a wide range of
structural solutions to reduce extreme water levels in the Lake Champlain-Richelieu River
system.

 For Quebec, however, the 2011 flood was particularly
1.1 A CALL TO ACTION devastating as flooding extended beyond the regulated
 floodplain.
Periodically there are extreme floods in the Lake
Champlain-Richelieu River (LCRR) Basin. Extreme As the basin is a transboundary basin, addressing this
flooding in the 1930s, 1970s, and more recently in 2011, risk will require a binational approach. It is therefore in
have resulted in the governments of Canada and the both countries’ interests to identify and implement
United States giving a reference 1 to the IJC to provide effective solutions to address the flooding issue that are
recommendations on what should be done to mitigate commensurate with each nation’s respective risks.
the flooding issue. Lack of implementation of the
recommendations from past references, and limited 1.2 REPORT SCOPE AND
actions being undertaken to reduce flooding, means the STRUCTURE
issue has yet to be effectively addressed. This general
lack of decisive action, along with the record severity of There is a broad range of actions that can be taken to
the 2011 flood, has led to a renewed sense of urgency to address flooding; these can be structural or non-
address the flooding issue. structural. This report primarily focuses on the various
 structural solutions that could be implemented to reduce
The economic impacts from these floods have grown
 extreme water levels in Lake Champlain and the
over time and are more pronounced in Canada. The
 Richelieu River. The study is addressing non-structural
economic damages2 of the 2011 flood were calculated to
 solutions in various other reports.
be approximately $89 M, 79% occurring in Québec, 11%
in New York, and 10% in Vermont (IJC, 2013). There are Chapter 2 begins with a brief overview of the basin
ongoing concerns that the magnitude, frequency, and setting and then describes the current Lake Champlain
economic severity of flooding could increase over time and Richelieu River hydraulic regimes and the
due to: a changing climate, encroachment in the river, implications that a changing climate may have on future
and development in the floodplain. Some preliminary water levels.
work by the study suggests that the flooding issue may be
of less concern in the United States as a result of the Chapter 3 explains the importance of the Saint-Jean-
mitigation measures that have been undertaken. sur-Richelieu shoal in controlling water levels and then
 goes on to elucidate how human interventions in the river

1
 Formal request from both governments to the International Joint Commission (IJC) to provide recommendations on addressing a specific issue.
2 All monetary values in this report are in Canadian dollars, reflecting the location of the proposed capital works.

 1
have impacted water levels over time and further Environmental (GIS) System, and Collaborative Decision
exacerbated flood levels. Support Tool developed by the study to determine the
 hydraulic and other impacts associated with each of the
Chapter 4 provides a history of structural mitigation proposed structural alternatives.
efforts associated with previous IJC references and
provides an understanding of what transpired regarding Chapter 7 of the report focusses on seven proposed
the implementation of these structural structural alternatives, assesses their hydraulic
recommendations. Some insight into the political and effectiveness, and identifies some limited economic and
social acceptability of proposed structural solutions is environmental implications associated with
highlighted to better understand how this might impact implementing each of them. It also identifies the decision
acceptability of any currently proposed structural criteria that the Study Board used to evaluate the
solutions. structural alternatives and determine whether any
 warrant further consideration.
Chapter 5 examines a broad range of structural
alternatives, and a limited number are identified for Finally, Chapter 8 provides a brief summary culminating
consideration by the Study Board. in the Study Board’s decision to further investigate the
 most promising structural solutions.
Chapter 6 describes the study’s modelling framework
and the application of the Water Balance Model, 2-D
Hydrodynamic Model, Integrated Social Economic and

THE INTERNATIONAL JOINT COMMISSION

Under the Boundary Waters Treaty of 1909 (the Treaty), the governments of the
United States and Canada established the basic principles for managing many water-
related issues along their shared international boundary. The Treaty established the
IJC as a permanent international organization to advise and assist the governments
on a range of water management issues. The IJC has two main responsibilities:
regulating shared water uses; and investigating transboundary issues and
recommending solutions.

 2
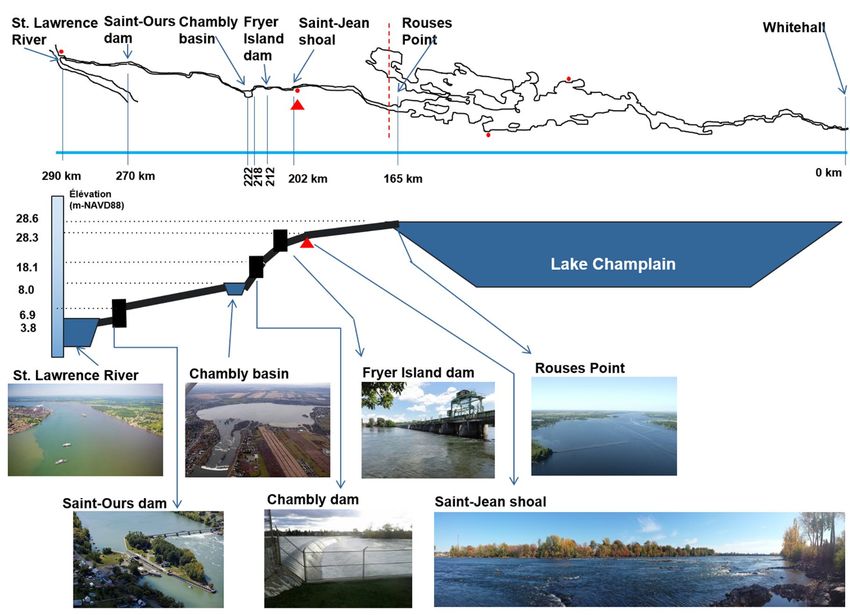
2 LAKE CHAMPLAIN-RICHELIEU RIVER BASIN

2.1 PHYSICAL SETTING

The Lake Champlain-Richelieu River basin is shown in
Figure 2-1. The Lake Champlain and Richelieu River
system is composed of two interconnected sub-basins:
the Richelieu River watershed (downstream of the shoal)
and the Lake Champlain watershed (upstream of the
shoal). Over the two sub-basins, the average annual
precipitation varies from approximately 760 mm (30 in)
near the lake and in the valleys to more than 1,020 mm
(40 in) in the mountains; snowfall averages 1,020 (40
in) to 1,520 mm (59.8 in). The population of the basin is
over one million, with the Lake Champlain sub-basin
accounting for 60%. In the area upstream of Rouses
Point, New York, about 50% of the basin population
depends on the lake for drinking water. Only 5.6% of the
basin is occupied by developed areas, and 16% is used
for agricultural purposes. The remaining areas are
mostly forested land (LCBP 2008, 2015; Stager and
Thill, 2010).

For the purposes of this report, the sub-basins will be
described separately because, though inter-related, the
hydraulic and hydrological responses for the two sub-
basins are quite different.

2.1.1 Lake Champlain
 Figure 2-1 │ Lake Champlain - Richelieu River Basin
Lake Champlain is one of the largest lakes in North
America, and is a binational waterbody shared by Lake Champlain is in the St. Lawrence River drainage
Vermont, New York, and the province of Québec. Lake basin. The lake sits in the low point of a valley between
Champlain extends from Whitehall, New York, north to the Adirondack Mountains of New York and the Green
its outlet at the Richelieu River in Québec. The lake, Mountains of Vermont, with the border between New
carved out during the last glacial advance, is 193 km (120 York and Vermont following the deepest part of the lake.
mi) long and 20 km (12.5 mi) at its widest point. The A small portion of the lake resides in Québec. The land
21,325 km2 (8,233 mi2) watershed drains nearly half the use in the basin is 64.3% forest, 16% agriculture, and
land area of Vermont and portions of northeastern New 5.6% developed land, with the remainder being wetlands
York and southern Québec. About 56% of the basin is in and open water (LCBP 2004). The relatively flat, fertile
Vermont, 37% in New York, and 7% in Québec (LCBP lands that extend to the east between the lake and the
2004, 2015). Green Mountains contain the highest concentration of
 agricultural lands. To the west, the Adirondacks are

 3
much closer to the lake’s shore. The mean monthly mainly dependent on the Lake Champlain level, and to a
temperatures range from 4° to 24° C (39° to 75° F), and lesser extent on wind surge. The Richelieu River flows
the growing season generally lasts about 160 days. over a flat valley, dropping by only 28 m (92 ft) between
 Rouses Point and Sorel, where it meets the St. Lawrence
Physically, there are seven physiographic regions that River. The elevation of the Richelieu River at Rouses Point
define the sources and delivery of water to the lake. From is 34 m (111 ft) and at its outlet in Sorel is 6 m (19 ft). A
west to east these regions are Adirondack, Champlain, longitudinal profile with pictures of key features is shown
Hudson Valley, Taconic, Valley of Vermont, Green in Figure 2-2. The key information on the hydraulic
Mountain, and Vermont Piedmont. Similarly, Lake features of the Richelieu was drawn from earlier efforts
Champlain is often divided into 13 segments for analysis on hydrodynamic modelling by the International Lake
and simplified into five major lake segments: Missisquoi Champlain – Richelieu River Technical Working Group
Bay, Northeast Arm, Mallets Bay, Main Lake, and South (ILCRR TWG 2015a, 2015b).
Lake. When compared to the other lake segments,
Missisquoi Bay and South Lake have the highest One of the key morphological features of the Richelieu
watershed to lake area ratios. The Lake Champlain River is a rock shoal at Saint-Jean-sur-Richelieu some 30
watershed is composed of smaller sub-watersheds with km (18.6 mi) downstream of Rouses Point. The rock
surface areas varying between 115 km2 (44.4 mi2) and shoal is the hydraulic control that regulates the water
2,704 km2 (1,044 mi2). The major tributaries feeding into level of Lake Champlain. From a hydraulic perspective,
the system are: Missisquoi River, Chazy River, Lamoille the outlet of the lake should be considered the Saint-
River, Saranac River, Winooski River, Ausable River, and Jean-sur-Richelieu shoal, rather than Rouses Point, which
Otter Creek. The Lake Champlain Basin has a relief of is commonly considered to be the lake outlet. This upper
over 1,500 m (4,921 ft) between the Adirondack reach of the river therefore can be considered an
Mountains in New York and Rouses Point, the extension of Lake Champlain. The gradient of the river is
geographical outlet of the lake. low for the upper reach of the river, with a drop of only
 0.3 m (about 1 ft).
Lake Champlain is the striking water feature of the basin.
With a surface area of 1,263 km2 (488 mi2), the lake The shoal section is about 210 m (689 ft) wide and
occupies roughly 5% of the total area of the watershed. extends for about 3.2 km (2 mi). In this reach of the river,
The lake thus acts as a natural reservoir that dampens the river drops about 25 m over 12 km (about 82 ft over
the flood wave entering the Richelieu River (Shanley and 7.5 mi). The Chambly Canal passes along the west side
Denner, 1999). of the river to facilitate navigation past the rapids caused
 by the rock shoal. The canal consists of nine locks over a
2.1.2 Richelieu River length of nearly 19 km (12 mi).
Lake Champlain outflows and four streams form the five
 In Chambly, the river widens again and its velocity
main tributaries that drain into the Richelieu River;
 decreases, forming the Chambly Basin. Water levels in
additionally, there are 14 smaller streams that are part of
 the river channel below the Chambly Basin are controlled
Richelieu River along with municipal drains that
 by a dam about 50 km (31 mi) downstream, at Saint-
discharge into the Richelieu River directly. The local
 Ours, Québec.
streams have a drainage area of 2,546 km2 (968 mi2).
The four sub-basins with drainage areas larger than 100
km2 include: the Acadie River (530 km2 or 205 mi2), the
Huron River (334 km2 or 129 mi2), the South River (145
km2 or 56 mi2) and the Lacolle River (126 km2 or 49 mi2)
(COVABAR, 2011). The Richelieu River discharge is

 4
Figure 2-2 │ Key features of the Richelieu River (note: the vertical scale on the cross-sectional view is not linear)

 Technical Working Group (TWG) for use in analysis and
 were used for this report (Boudreau et al. 2019). All the
2.2 LAKE CHAMPLAIN HYDROLOGY graphics in this section are drawn from these three data
 sets.
The dynamics of Lake Champlain water levels are the
result of several factors. The key factors are the inflows 2.2.2 Lake Champlain Water Levels
into the lake, termed “Net Basin Supplies (NBS)”, both in Figure 2-3 captures two essential features of the peak
volume and temporal distribution; peak intensity of and average water levels of Lake Champlain for the
inflow; and the starting lake water levels before a freshet period of 1925 to 2017. The bar graph depicts the yearly
event. averages of water levels, and the line graphs the
 maximum observed water levels in the year. The graph
2.2.1 Data Sources
 also shows the flooding threshold of 30.35 m (99.57 ft)
At the outset of the study, it was agreed that all NAVD88 (see section 2.2.3 for flood level designations).
participants and consultants would use standardized
and verified data sets. Three of these data sets were the As shown on the graph, both peak (green dashed line in
synthesized Net Basin Supplies (NBS) into Lake Figure 2-3) and average annual water level (dark blue
Champlain, recorded lake-wide averaged Lake dashed line in Figure 2-3) exhibit upward trends. The
Champlain water levels, and recorded Richelieu River peak water levels demonstrate a negligible trend of 1
discharge at Fryer Dam. All three variables were certified mm/decade, whereas the annual water level trend is
by the Hydrology, Hydraulics and Mapping (HHM) more dramatic at 30 mm/decade (1.2 in/decade), some

 5
Figure 2-3 │ Peak and average Lake Champlain water levels

thirty times higher for the annual water levels series. 1. Wetter water supply regime in the shoulder seasons 3;
Furthermore, if the trend evaluation is split between pre-
and post-Chambly Canal widening in the early 1970s 2. Widening of the Chambly Canal (1970 to 1974); and,
(the red and light blue trend lines, respectively), an
 3. Increased weed growth in the Richelieu River causing
upward shift of about 26 cm (10.2 in) is observed for
averaged annual water levels in the post 1971 period. additional friction and associated higher water levels
While the widening of the Chambly Canal undoubtedly from late spring to fall.
contributed to this significant shift, the change cannot be
 When examining the historical record for NBS into the
completely attributable to the canal widening.
 lake, while 2011 provided the highest flood levels, the
Coincidently around 1970, the hydrological regimes in
 peak NBS into Lake Champlain for the 2011 flooding
basins throughout north-eastern continental North
 event was just 2,201 m3/s (77,728 ft3/s). This was not the
America faced an increase in precipitation. For Lake
 highest NBS in the historical series; five other events
Champlain, post-1971 NBS values were almost 24%
 exceeded the 2011 event. Of these five events, only one
higher than pre-1971, as will be discussed in Section 2.3.
 event was in the fall; the rest were in the spring season
Based on the hydrodynamic modelling conducted by
 (Table 2-1). The highest NBS occurred in 1936 and was
HHM TWG, the shift in averaged annual water levels
 2,721 m3/s (96,091 ft3/s).
can be attributed to three factors:

3
 For the purposes of the report, the shoulder seasons are defined as months outside of the traditional spring flood months. It was observed, since 1971, that higher
volumes of runoff from summer storms and snowmelt in the late winter period contributed to Lake Champlain staying at higher than average water levels for longer
periods.

 6
Table 2-1 also provides relevant information on the flows, the peak inflow. In 2011, the basin received inflows into
volumes, and the initial level of Lake Champlain. A the lake from an early freshet which brought the water
comparison of this information confirms that a levels up. The starting water level of 30.5 m (100.06 ft)
combination of causative factors contributes to flooding. was already above the flooding threshold of 30.35 m
These data also demonstrate the self-regulating and (99.57 ft) at the onset of the combination of extended
storage capacity of Lake Champlain. If a flood event precipitation, above average snow depth, and warmer
begins at a lower Lake Champlain water level, there is than normal temperatures; this event had the highest
greater storage available within the usual lakebed to 60-day NBS volume of 7.64 x 10⁶ dam3 (6.19 x 10⁶ acre-
absorb the volume of inflow, resulting in smaller feet), resulting in record water levels and outflows.
immediate increases in outflows.
 2.2.3 Designation of Lake Floods
Two annual flood events reflected in Table 2-1
 For Lake Champlain, water level forecasts are provided
demonstrate the regulating capacity of the lake. The first
 by the US National Weather Service (NWS), which is
is the flood of 1936; the peak outflow was 45.4%
 part of the US National Oceanic and Atmospheric
(1,235/2,721 as percent) of inflow peak. The starting lake
 Administration (NOAA). The NWS has established
level was relatively low at 28.73 m (94.26 ft), while the
 target water levels that classify the severity of a flood.
60-day NBS volume was the third largest in the table, a
 They are described in Table 2-2.
volume of 5.14 x10⁶ dam3 (4.16 x10⁶ acre-feet). For the
2011 flood event, the peak outflow was 32.3% less than
Table 2-1 │Highest events since 1925, ranked by NBS

 Peak NBS, Peak Outflow, Starting Lake Level, 60-Day Volume,
 Date of Event
 m3/s (ft3/s) m3/s (ft3/s) m (ft), NAVD88 dam3 (ac-ft) x106

 March 1936 2,721 (96,091) 1,235 (43,614) 28.73 (94.26) 5.14 (4.16)

 April 1960 2,443 (86,271) 1,018 (35,950) 28.95 (94.98) 4.14 (3.35)

 April 1933 2,437 (86,059) 1,187 (41,919) 30.69 (100.69) 5.48 (4.44)

 April 2001 2,397 (84,646) 1,058 (37,363) 28.92 (94.88) 4.70 (3.81)

 November 1927 2,352 (83,057) 963 (34,008) 28.74 (94.29) 4.46 (3.61)

 April 2011 2,201 (77,725) 1,550 (54,736) 30.50 (100.06) 7.64 (6.19)

Table 2-2 │ US National Weather Service’s flood classification criteria (https://water.weather.gov/ahps2/hydrograph.php?gage=roun6&wfo=btv)

 Lake Champlain Target Elevation
 Flood Severity Expected Flooding Impacts
 (m/ft) NGVD29 (m/ft) NAVD88
 Minor Flood 30.48/100.0 30.35/99.57 Minimal or no property damage, but possibly some public threat.
 Some inundation of structures and roads near stream. Some
 Moderate Flood 30.78/101.0 30.65/100.57 evacuations of people and/or transfer of property to higher
 elevations.
 Extensive inundation of structures and roads. Significant
 Major Flood 30.94/101.5 30.81/101.07 evacuations of people and/or transfer of property to higher
 elevations.

 7
function of the volume of spring runoff and the starting
 water level in the lake.

 Both time series do not exhibit any apparent trend in
 both inflow and outflow peak flow series. By estimating
 the linear regression of peak flows over time as noted in
 Figure 2-5, the observation of a very slight downward
 trend is verified. The lack of a substantial trend suggests
 that T-year (return period) estimates based on frequency
 analysis are appropriate.

Figure 2-4│ Major floods of the 1990s and 2011 Event

 Figure 2-4 shows the significant floods since 1990,
 including the 2011 flood water level during freshet for a
 three-month duration. The graph shows the duration of
 higher lake levels that can be classified in the moderate
 to major flooding category. When compared to the
 events in the 1990s, the enormity of the 2011 flood can be
 visualized by the duration of 41 days it stayed in the
 major flood zone, meaning above an elevation of 30.81
 m (101.08 ft) NAVD88. Figure 2-5│ Peak annual Lake Champlain inflows and outflows into
 the Richelieu River
 2.3 RICHELIEU RIVER HYDROLOGY

 The discharge in the Richelieu River is related to the
 water levels in Lake Champlain. The common
 understanding is that the outlet of the lake is at Rouses
 Point. However, the outflow from Lake Champlain is
 dependent on the physical influence of the shoal at Saint-
 Jean-sur-Richelieu, so from a hydraulic perspective the
 outlet is at Saint-Jean-sur-Richelieu.

 2.3.1 Richelieu River Peak Discharges
 Figure 2-5 shows the peak annual outflows from Lake
 Champlain into the Richelieu River. The graph also
 Figure 2-6│ Average annual outflows in Richelieu River, showing a
 captures the inflows into the lake. The important step function and a shift in average flows
 observation from this graph is that the peak outflows are
 For the average annual Richelieu River flow series, Figure
 significantly smaller than the peak inflows into the lake,
 2-6 shows an upward trend when the full time series of
 demonstrating the self-regulating feature of this large
 1925 to 2017 is considered. This upward trend is
 lake. The degree of peak flow reduction in the Richelieu
 misleading, however. As noted in Section 2.2.2, the total
 River, in the absence of anthropogenic regulation, is a
 time series consist of two sub-series, one from 1925 to

 8
1970 and the other from 1971 to 2017. Linear regression Richelieu River (Saad et al. 2016). While spring flooding
of pre-1971 records for annual discharge shows a is common along the shores of Lake Champlain, the
downward trend, while the post-1971 data show no trend. duration of the 2011 flood period was unprecedented.
 Lake levels remained above NWS’s minor flood elevation
When the time series is split based on the Chambly of 30.35 m (99.57 ft) NAVD88 for 67 days at Rouses
Canal widening, along with higher NBS that forced Point, from April 13, 2011 to June 19, 2011.
higher annual water levels and associated outflows
beginning in 1970, a step function becomes clear (Figure Over the 2010-2011 winter, snowfall in Burlington,
2-6). After 1971, the average discharge showed a shift Vermont, measured 326.14 cm (128.4 in), the third
from 317 m3/s (11,195ft3/s) to 393 m3/s (13,879 ft3/s). highest total since 1883 (NOAA 2011). In addition, no
This is an increase of 76 m3/s (2,684 ft3/s), translating major thaw occurred mid-winter. The mean monthly
into a 24% increase in post-1971 discharges. This also temperatures from February to June were at or above
implies that the long-term trend when using all the data mean temperatures. Total precipitation in the basin in
can be misleading as to what the future may be with March was 46 percent above average, while April
regard to average annual discharges. experienced 174 percent and May 213 percent above
 average. The three-month spring total was also a
2.3.2 2011 Historic Flood record, higher than the previous record by 113.8 mm
The confluence of warm temperatures, record (4.5 in) (NOAA 2011). Table 2-3 shows the
precipitation, and rapid melting of a near-record precipitation statistics for spring 2011 as recorded
snowpack caused historically high flood levels in the in Burlington, Vermont.
basin tributaries and in Lake Champlain and the

Table 2-3 │ Precipitation in Burlington, Vermont, Spring 2011 (Causes and Impacts Report, LCRR 2020)

 2011 Normal Amount > Normal
 Percent increase
 Month (2011)
 over normal
 cm in cm in cm in

 March 8.59 3.38 5.89 2.32 2.72 1.07 46 %
 April 20.02 7.88 7.32 2.88 12.70 5.00 174 %
 May 22.02 8.67 7.04 2.77 14.99 5.90 213 %

 Three Month
 50.65 19.94 20.24 7.97 30.40 11.97 105 %
 Total

 9
An examination of the 2011 flows into Lake Champlain The record flood of 2011 was further exacerbated, at
and the Richelieu River is shown in Figure 2-7. The times, by wind set-up, due to persistent winds from the
extended period of high lake levels resulted in a flow into south. Historical observations of Lake Champlain
the Richelieu River of 1,490 m3/s (52,619 ft3/s) over a elevations at the Rouses Point gauge have shown that
quarter-month period, or a maximum daily value of water levels there can increase by 15.2 to 30.5 cm (6-12
1,550 m3/s (54,736 ft3/s). Figure 2-7 shows the lake’s in) when average south wind speeds over the lake range
capacity to reduce the peak outflow. For the period of between 46.3 to 64.8 km/hr (25 to 35 knots) for
high spring inflows, the lake received 7.64 x 10⁶ dam3 durations of six hours or more. During the spring of 2011,
(6.19 x 10⁶ acre-feet) of water and utilized 1.34 x 10⁶ Lake Champlain was in flood status for 67 days. Over
dam3 (1.09 x 10⁶ acre-feet) of storage space in the lake. that period, there were eight separate wind set-up events
The capacity of the lake to provide this storage greatly that pushed the nominal lake elevation up by between
reduced the flooding potential, notably along the 7.6 and 21.3 cm (3 to 8.4 in). The most dramatic of these
Richelieu River corridor around Saint-Jean-sur-Richelieu. events occurred on April 23, 2011, when the lake was in
As presented in the graph, for the period where the minor flood status, just below the moderate flood level of
inflows (blue line) into the lake are greater than the 30.78 m (101 ft). The ensuing 21.3 cm (8.4 in) rise
outflows (red line), the excess volumes are stored in Lake pushed the Rouses Point elevation into moderate flood
Champlain. This happened from start of March to late and then past the 30.94 m (101.5 ft) major flood
May. The lake is drained when outflows exceed the threshold. The wind event ended the next day and lake
inflows. This happened from late May until late August elevations were back down into the minor flood range.
when Hurricane Irene caused high inflows. (Causes and Impacts Report, LCRR 2020)

 The Richelieu River at Fryer Rapids exceeded flood flows
 of 1,064 m3/s (37,575 ft3/s) from April 20 to until June
 28, a total of 69 days. This flow at Fryers Rapids
 corresponds to Rouses Point water level of 30.5 m
 (100.04 ft) NAVD88, which is slightly more than the
 flooding trigger of 30.35 m (99.55 ft). Increases in the
 elevation of Lake Champlain during the flood were
 translated downstream on the river and the same south
 winds amplified river stages.

 A recent analysis conducted by Riboust and Brissette
 (2015b) determined that the return period of the 2011
Figure 2-7 │ NBS inflows and outflows into Richelieu River spring flood exceeded 700 years and can be attributed
for 2011 flood to the combination of extreme precipitation over the
The flood resulted in a period of record maximum lake spring season (500 years recurrence) and an important
levels recorded at all lake gauges on Lake Champlain. snowpack (15 years recurrence). Their modelling results
The maximum recorded stage at Rouses Point, New show that if the snowpack that was recorded in 2008
York, was 31.32 m (102.77 ft) on May 6, 2011. Before the occurred in 2011, the flood would have been even greater.
2011 flooding, the highest lake level elevation recorded at
the Rouses Point, New York, gauge was 30.90 m (101.35
ft) on May 4, 1869.

 10
2.4 FREQUENCY ANALYSIS OF
 HYDROLOGICAL DATA 2.4.1 Quantiles Corresponding to Return
 Periods of Interest
The study contracted INRS (Ouarda, et al. 2019) to The project explored a variety of estimation methods
investigate the hydrological and statistical properties of using combinations of Probability Density Functions
the key variables driving water levels and flows in the (PDF), domains, and estimation methods. A total of 11
Lake Champlain – Richelieu River system. The project different PDF, their associated domains, and four sample
included evaluating: statistics estimation methods were employed. The
 goodness of fit was examined by five different methods,
1. Annual mean and maximum flows on the Richelieu
 using a combination of PDF and estimation method. This
 River for given return periods.
 resulted in a total of 180 different combinations of PDF
2. Annual mean and maximum water levels for Lake and estimation statistics. By comparing the sample and
 Champlain for given return periods. PDF-based statistics and using established goodness of
 fit criteria, the most favourable PDF and associated
3. Annual mean and maximum net basin supplies estimation were recorded. For the purposes of this report,
 (NBS) for the Richelieu River basin for given return the full data set was sliced into four distinct periods to
 periods. evaluate the impact of various anthropogenic and
 natural variations on the quantiles in comparison to the
4. Presence of trends and change points in the observed water levels and flows for the 2011 flood. The
 hydrological time series, including determining the four time slices and their rationale are:
 links with anthropogenic modifications, natural
 evolutions, or climate changes; and considering the 1. Full record, 110 years for water level and 93 years for
 presence of potential change points and trends in flow – 1908 or 1925 to 2017.
 the frequency analysis to remove their effects.
 2. Pre-widening and pre-wet period start –1908 or
5. Future trends in the hydrological variables of 1925 to 1971.
 interest.
 3. Period used for delineating flood areas on Richelieu
6. Comparisons with neighboring watersheds. River – 1971 to 2000.

7. Teleconnection analysis to identify climatic indices 4. Post-widening and wetter climate, 46 years of
 that affect the variables of interest and explain the record – 1972 to 2017.
 inter-annual variability in these variables.
 The statistics and quantiles are captured for five different
Some pertinent findings from the project are highlighted return periods, as shown in Tables 2-4, 2-5, and 2-6. The
for this report. The first are the quantiles or return period current regulation of flood risk areas along the Richelieu
estimates of water levels and flows for various time slices River are shown for three return period floods; three of
as per the report and augmented through personnel these quantiles, 2-year, 20-year, and 100-year, are
communications. The second is the generation of depicted on the maps. The 20-year flood limits define the
variables of interest for the next 50 years. As this has floodway zone, and the 100-year shows the flood hazard
climate change signals embedded, this is discussed in area (Dubé, 2006). This information will play an
Section 2.5. important role in determining the level of hazard that is

 11
most appropriate for recommended mapping. A that for the Richelieu River flow (Table 2-5), the 2011
comparison of the key statistics of water level and flows event was close to the 100-year event, and nearer to a
for the 2011 event, shown in the right-most columns of 200-year event for the Lake Champlain water levels
Tables 2-4 to 2-6, with the estimated quantiles provides (Table 2-4).
an insight into the return period estimates.
 Interestingly, comparisons of quantiles with the peak
A cursory analysis shows that for the variables attributed NBS series suggest a return period for the 2011 event of
on an annual basis, the 2011 flood was close to the 150- no more than 20 years (Table 2-6). The annual volume
year event for the time window of post-Chambly Canal analysis, while useful on its own, does not reflect the
widening and a rarer return period for other time high quarter-month volumes and resulting quantiles. If
windows analyzed and shown in Tables 2-4 to 2-6. this NBS is further characterized to reflect a 60-day
 volume analysis, rather than an annual basis, a longer
For the post-Chambly Canal time period, similar return period may be revealed. This analysis was not
comparisons of quantiles with the maximum series show carried out.

Table 2-4 │ Lake Champlain water levels - quantiles corresponding to specific return periods (Ouarda, et al., 2019)
 Lake Champlain in Water Levels
 Quantiles corresponding to return periods of interest
 Observed
 Return T-year WL T-year WL T-year WL T-year WL
 Variable m
 period m NAVD88 m NAVD88 m NAVD88 m NAVD88
 NAVD88
 1908-2017 1908-1971 1908-2000 1972-2017
 Distribution/Estimate 2011
 GEV/ML GEV/ML GEV/ML GEV/ML
 2 29.11 29.02 29.08 29.25
 20 29.49 29.29 29.44 29.59
 Mean
 50 29.59 29.35 29.53 29.67
 water level
 100 29.65 29.38 29.58 29.72 29.70
 200 29.71 29.41 29.63 29.77
 Distribution/Estimate N/ML N/ML N/ML N/ML
 2 30.19 30.15 30.19 30.25
 20 30.82 30.76 30.81 30.91
 Maximum
 50 30.98 30.91 30.97 31.07
 water level
 100 31.08 31.01 31.07 31.17 31.25
 200 31.18 31.10 31.17 31.27
 Post-widening
 Pre-widening & Period used for
 Full 110 years & wetter
 pre-wet period - floodplain
 of record climate - 46
 64 years of record delineation in SJSR
 years of record
GEV - Generalized Extreme Value, N - Normal, ML - Maximum likelihood

 12
Table 2-5 │ Richelieu River discharge - quantiles corresponding to specific return periods
 Richelieu River Discharge
 Quantiles corresponding to return periods of interest
 Return T-year Q, T-year Q, T-year Q, T-year Q, Observed
 Variable
 period m3/s m3/s m3/s m3/s m3/s
 1925-2017 1925-1971 1925-2000 1972-2017
 Distribution/Estimate 2011
 LN2/ML LN2/ML LN2/ML LN2/ML
 2 347 312 336 386
 Mean 20 504 433 485 540
 Richelieu
 50 553 470 531 588
 River
 streamflow 100 588 496 564 621 626
 200 623 521 596 654
 Distribution/Estimate GG/MM GG/MM GG/MM GG/MM
 2 937 972 958 910
 Maximum 20 1270 1224 1246 1301
 Richelieu
 50 1350 1270 1306 1411
 River
 streamflow 100 1402 1298 1343 1487 1550
 200 1449 1323 1376 1558

 Pre-widening & Period used for Post-widening &
 Full 93 years
 pre- wet period - floodplain wetter climate - 46
 of record
 47 years of record delineation in SJSR years of record

LN2 - 2 Parameter Log-Normal, GG - Generalized Gamma, MM - Method of moments, ML - Maximum likelihood

Table 2-6 │ Net Basin Supplies - quantiles corresponding to specific return periods
 Net Basin Supplies
 Quantiles corresponding to return periods of interest
 Return T-year NBS, Estimated,
 Variable T-year NBS, m3/s T-year NBS, m3/s T-year NBS, m3/s
 period m3/s m3/s
 1925-2017 1925-1971 1925-2000 1972-2017
 Distribution/Estimate 2011
 GEV/MM GEV/MM GEV/MM GEV/MM
 2 346 314 336 387
 20 504 422 485 543
 Mean
 50 551 450 528 584
 water level
 100 583 468 558 611 610
 200 613 484 585 634
 Distribution/Estimate G/ML G/ML G/ML G/ML
 2 1485 1480 1479 1489
 20 2199 2236 2186 2159
 Maximum
 50 2406 2456 2391 2352
 water level
 100 2551 2611 2534 2486 2201
 200 2688 2757 2670 2613

 Pre-widening & Period used for Post-widening &
 Fulf 93 years
 pre-wet period - 47 floodpfain wetter climate - 46
 of record
 years of record delineation in SJSR years of record

GEV - Generalized Extreme Value, G - Gamma, MM - Method of moments, ML - Maximum likelihood

 13
planning. Many approaches have been used for climate
2.5 CLIMATE CHANGE change impact evaluation and adaptation planning in
 IMPLICATIONS the last twenty years. An initial emphasis on projecting
 future climate has given way to approaches that focus on
In the IJC directive, the Study Board was directed to first understanding the responsiveness of the system to
examine the implications of a changing climate on future climate change, describing the context with regard to the
floods in the basin. To meet this requirement, the Study full spectrum of possible future uncertainties, and using
Board has adopted the IJC framework that includes using climate science to inform the analysis, rather than serving
a broad range of approaches to determine potential as the starting point and focus. The contrast between the
future climate change water supplies. It is important to early and later approaches is captured in the
note that any structural alternatives that are proposed terminology. Downscaling focused on developing local
by the study will require a performance evaluation based climate projections from global models; decision scaling
on future climate change water supplies, to determine starts with an assessment of how climate change might
their robustness. affect outcomes and then considers the plausibility of
 those changes occurring.
2.5.1 IJC’s Climate Change Guidance
The IJC has developed a climate change guidance
framework for use in the international basins (Figure 2-
8). The purpose of the framework is to provide a process
for the IJC to maintain, to the extent reasonably possible,
the resilience of the ecosystems, economic and social
benefits, and impacts of its managed systems despite the
uncertainty about future change. The goal of the
framework is to provide clear guidance to the boards for
addressing climate change using the best available
institutional and organizational science and stakeholder
input to the boards. The framework prescribes four steps,
repeated iteratively: organize, analyze, act, and update.
The framework was developed collaboratively by the
Climate Adaptation Working Group (CAWG), climate
change experts, and IJC Board members from several
basins, many of whom are also climate change experts
(IJC, 2017). The framework has three major elements:

1. A recommended planning guidance method;
 Figure 2-8 │ Climate change guidance framework
2. A shared information pool; and
 Downscaling was used in the study of the regulation of
3. Assistance in establishing adaptive management. Lake Ontario releases (LOSLR 2006). Decision scaling
 was first used in the IJC study of the regulation of Lake
The recommended planning method is central to the Superior (IUGLS 2012) after its Study Board considered
framework; the other two elements (i.e., a shared and rejected the use of downscaling.
information pool and assistance in establishing adaptive
management) will support each board’s successful

 14
In this study, the decision scaling approach will be scaling methods. The major conclusion from the paper
employed considering the impacts and plausibility of was that future extreme events may be quite different
different Net Basin Supplies (NBS) generated using from the historic mean values, with the spring floods
climate models, stochastic analysis, and a Probable following a decreasing trend in lake levels. The study
Maximum Flood (PMF). highlighted the challenges with uncertainty in modelling.

2.5.2 Climate Change Studies A more recent study by Huang et al. (2020) uses the
 Advanced Weather Research and Forecasting (WRF)
Numerous climate change analyses have been done for
 model in predicting hydrological variables under climate
the basin in recent years and the study will build on these
 change in the basin. The paper captured three five-year
analyses. Stager and Thill (2010) prepared a technical
 periods up to 2014 and essentially provides a proof of
report for the Nature Conservancy on climate change in
 concept and applicability that is useful, as HHM TWG is
the basin. Using output from 16 General Circulation
 using WRF as a forecasting tool for the study's "Theme
Models (GCMs) and two emissions scenarios, climate
 3" (flood response) work.
change impacts on temperatures and precipitation were
developed. By extension, the challenges of extreme
 2.5.3 Study’s Climate Change Work
precipitation events were noted. The report drew no
conclusion about future flood levels, but outlined the A comprehensive climate change analysis was
need for additional research, some of which is being completed for this study by École de Technologie
done by this study: Supérieure (ÉTS). Most of the work reported in this
 section is captured in an earlier paper by Lucas-Picher et
 al. (2015) and two recent papers for the current study by
 Understanding of hydrological processes in the Lucas-Picher et al. (2020a, 2020b). The investigation
 watershed should be improved to allow more precise
 used:
 near-term forecasting of weather-related changes in
 lake level, stream flow and other environmentally
 important factors. More stream-level data are needed. • Two emission scenarios, termed RCP:
 An accurate watershed precipitation- and evaporation- Representative Concentration Pathways;
 response model could be helpful for both short- and • 28 GCM, termed CMIP5 as per IPCC5;
 long-term prediction of stream flow and lake level
 changes. (Stager and Thill, 2010) • Six RCM, termed CORDEX, driven by five GCM for
 nesting purposes; these were operated for RCP 4.5
 and 8.5; and
While these hydrological variables were noted, the focus • 50 Canadian RCM #5 (CRCM5), termed CLIMEX,
was on the ecological impacts on flora and fauna. that were run only for RCP8.5.
 The resolution varied 100 to 300 km for GCM, 25 to 50
Riboust and Brissette (2015a) concluded that most
 km for RCM and 12 km for CRCM5.
climate projections indicate the severity of most extreme
spring floods may be reduced between 2041 and 2100, The study employed Hydrotel (Fortin et al. 1995) as the
but that summer‐fall extreme events, such as caused by driving hydrological model for representing the dynamics
hurricane Irene in August, 2011, may become more in the system. Hydrotel is the approved model used for all
frequent in the future. In their work they used 372 hydrological simulations in Quebec. Based on the
downscaled climate projections from 19 GCM and nine multiple simulations, the results indicated the model
Regional Climate Models (RCMs) with three emission adequately reproduces the observed events. It should be
scenarios. A total of 197 simulations covered the period noted, though, that flood levels and average annual NBS
of analysis 2040 to 2070, and 175 for the period 2071 to are not well correlated and flood levels have almost no
2100. The study employed constant scaling and daily dependence on supplies after June.

 15
You can also read