Weather-Related Construction Delays in a Changing Climate: A Systematic State-of-the-Art Review - MDPI
←
→
Page content transcription
If your browser does not render page correctly, please read the page content below
sustainability

Review
Weather-Related Construction Delays in a Changing Climate:
A Systematic State-of-the-Art Review
Steven J. Schuldt * , Mathew R. Nicholson, Yaquarri A. Adams II and Justin D. Delorit

                                          Graduate School of Engineering and Management, Air Force Institute of Technology,
                                          Wright-Patterson AFB, OH 45433, USA; mathew.nicholson@afit.edu (M.R.N.);
                                          yaquarri.adams@afit.edu (Y.A.A.II); justin.delorit@afit.edu (J.D.D.)
                                          * Correspondence: steven.schuldt@afit.edu; Tel.: +1-937-255-3636 (ext. 4645)

                                          Abstract: Adverse weather delays forty-five percent of construction projects worldwide, costing
                                          project owners and contractors billions of dollars in additional expenses and lost revenue each year.
                                          Additionally, changes in climate are expected to increase the frequency and intensity of weather con-
                                          ditions that cause these construction delays. Researchers have investigated the effect of weather on
                                          several aspects of construction. Still, no previous study comprehensively (1) identifies and quantifies
                                          the risks weather imposes on construction projects, (2) categorizes modeling and simulation ap-
                                          proaches developed, and (3) summarizes mitigation strategies and adaptation techniques to provide
                                          best management practices for the construction industry. This paper accomplishes these goals through
                                          a systematic state-of-the-art review of 3207 articles published between 1972 and October 2020. This
                                          review identified extreme temperatures, precipitation, and high winds as the most impactful weather
                                          conditions on construction. Despite the prevalence of climate-focused delay studies, existing research

                                   fails to account for future climate in the modeling and identification of delay mitigation strategies.
Citation: Schuldt, S.J.; Nicholson,       Accordingly, planners and project managers can use this research to identify weather-vulnerable ac-
M.R.; Adams, Y.A., II; Delorit, J.D.      tivities, account for changing climate in projects, and build administrative or organizational capacity
Weather-Related Construction Delays       to assist in mitigating weather delays in construction. The cumulative contribution of this review
in a Changing Climate: A Systematic       will enable sustainable construction scheduling that is robust to a changing climate.
State-of-the-Art Review. Sustainability
2021, 13, 2861. https://doi.org/          Keywords: climate change; construction; delay; impact; modeling; productivity; review; weather
10.3390/su13052861

Academic Editors: Sunkuk Kim and
Jurgita Antuchevičienė                  1. Introduction
                                                The construction industry is one of the most vulnerable to adverse weather conditions
Received: 4 February 2021
Accepted: 4 March 2021
                                          due to its reliance on labor and outdoor activities [1]. Weather events pose major uncertainty
Published: 6 March 2021
                                          factors that negatively impact construction projects’ productivity and duration [2]. Forty-
                                          five percent of all construction projects are affected, to some degree, by weather, resulting
Publisher’s Note: MDPI stays neutral
                                          in billions of dollars in additional costs worldwide, on an annual basis [3]. These events
with regard to jurisdictional claims in
                                          can impact project stakeholders through schedule slippage and decreased worker safety,
published maps and institutional affil-   resulting in potential legal repercussions.
iations.                                        This review focuses on the impact of adverse weather events on construction projects,
                                          specifically focusing on weather’s impact on task feasibility, methods to model delays,
                                          and mitigation techniques to counteract these impacts. Weather events directly impact the
                                          ability to complete construction tasks, also called task feasibility. Effects on task feasibility
Copyright: © 2021 by the authors.
                                          range from complete work stoppage to reduced worker productivity and ultimately delays
Licensee MDPI, Basel, Switzerland.
                                          the project schedule. The delay of any project has financial implications, which are shared
This article is an open access article
                                          by the contractor, owner, and external stakeholders. The inclusion of specific language
distributed under the terms and           concerning the calculation of permissible delays, based on abnormal or unforeseeable
conditions of the Creative Commons        weather, and which weather conditions constitute an excusable delay, have been shown to
Attribution (CC BY) license (https://     reduce the number of delay disputes that arise in a project [4–7]. Events like lightning and
creativecommons.org/licenses/by/          high winds pose significant threats to workers, slow worker productivity, or require work
4.0/).                                    stoppages, but proper planning and coordination can mitigate risk.

Sustainability 2021, 13, 2861. https://doi.org/10.3390/su13052861                                     https://www.mdpi.com/journal/sustainability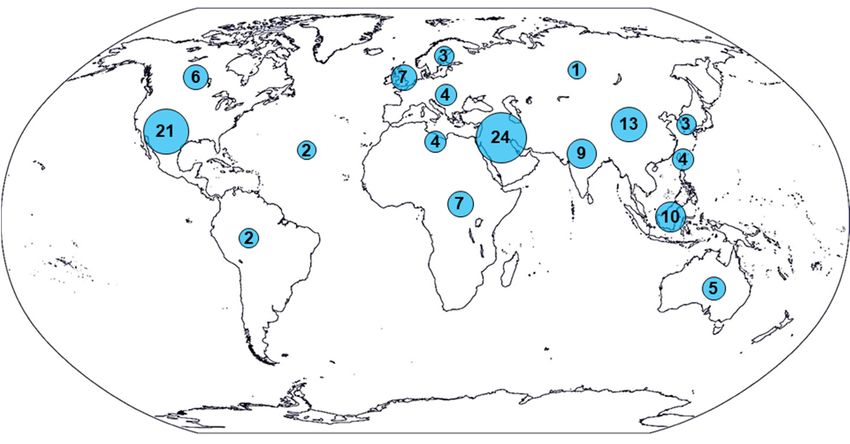
Sustainability 2021, 13, 2861                                                                                             2 of 25

                                      Modeling contributes to understanding weather impacts on construction and can
                                inform construction managers’ mitigation and adaptation strategies. As such, decision-
                                makers must model weather events to determine their impact on construction tasks and
                                develop schedules that reduce risk. As it becomes more apparent that climate change
                                increases weather intensity and variability [8], weather prediction improvements will be
                                critical. However, few studies address the influence of climate change on the modeling and
                                mitigating delays. Climate change affects the typical working environment and reduces the
                                validity of current models. Altinsoy and Yildirim (2015) mention the importance of regional
                                climate models in accounting for decreases in worker productivity due to region-specific
                                climate change and suggest the development of more sophisticated models may be crucial
                                for project delay management [9].
                                      With project adjustments and strategies, mitigation of weather-related delays is pos-
                                sible. Mitigation methods can be as simple as observing work-rest cycles and providing
                                weather-appropriate protective gear [10]. Other methods may be more involved, such as
                                planning the project schedule within the proper construction season or ensuring that the
                                construction contract has the right language to prevent ambiguity. Mitigation strategies
                                can help construction managers adapt, avoid, or anticipate delays due to weather.
                                      Despite the significant contributions of the studies mentioned above, none of the
                                studies provide a critical review that holistically explains weather’s impact on construction.
                                This systematic state-of-the-art review identified 204 articles covering task feasibility, mod-
                                els, and mitigation techniques of weather’s impact on construction. The goal of this review
                                is to (a) identify and quantify the risks weather imposes on construction projects, (b) cate-
                                gorize modeling and simulation approaches that have been developed, and (c) describe
                                the mitigation strategies and adaptation techniques in order to provide best management
                                practices for the construction industry.

                                2. Materials and Methods
                                2.1. Research Methodology
                                      The authors utilized the PRISMA method to conduct a systematic state-of-the-art
                                review (Figure 1). The search was conducted using the following search string in Scopus
                                and Web of Science (WoS) core collection on 27 October 2020: construction AND (weather*
                                OR climat*) AND (delay OR impact OR schedul* OR effect) AND (producti* OR labor OR
                                labour OR feasib* OR workability OR safety). The search identified 4337 papers.
                                      After removing 1130 duplicates, the authors performed a two-step screening process
                                using two pre-defined exclusion criteria: (1) only articles focused on the construction
                                industry were considered eligible, and (2) each article had to focus on at least one of the
                                keywords or phrases listed in the search string hierarchy. The first screening reviewed
                                article titles and abstracts and excluded 2982 articles using the pre-defined exclusion criteria.
                                Next, the remaining 225 full-text articles were screened, and an additional 101 articles
                                were removed, resulting in 124 identified eligible records. Additional articles were selected
                                from the references of included texts to expand the systematic review scope, resulting in
                                80 unique new records. As a result of this methodology, 204 studies were included in the
                                systematic review.
                                      The state-of-the-art component of this paper focused on the inclusion of literature
                                that addressed the role of climate change and construction delays. After each of the
                                204 articles was read, it was categorized by the degree of focus climate change received as
                                a component of the research. The degree to which climate change is included in the articles
                                is summarized in this paper’s climate change section.

                                2.2. Bibliometric Analysis
                                      Figure 2 shows the top producing locations and their associated total number of
                                citations. The United States leads the way in both total publications (42) and total citations
                                (1740), while Australia, the United Kingdom, Canada, and Hong Kong round out the
                                top five producing locations with 23, 23, 15, and 11 publications, respectively. Despite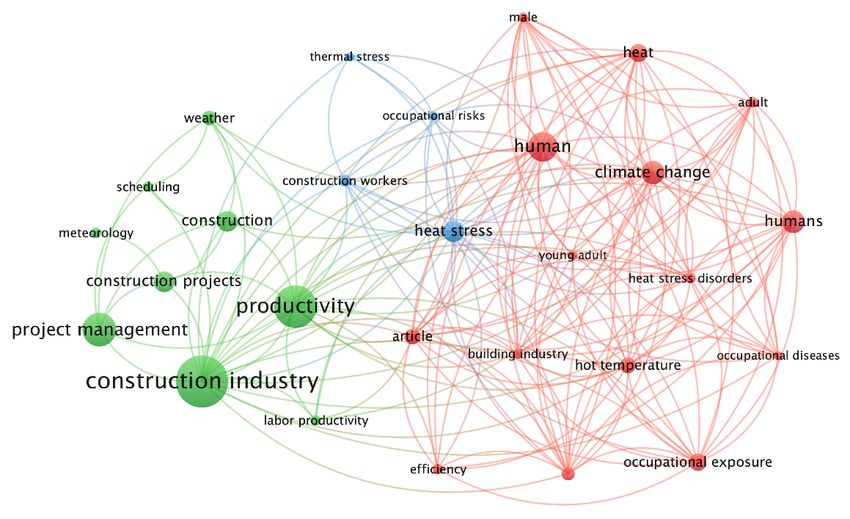
Sustainability 2021, 13, 2861                                                                                          3 of 25

                                only publishing 11 papers, Malaysia has the second-most citations (876), followed by
                                Australia (781), Hong Kong (759), and the United Kingdom (573). In total, 51 locations
 Sustainability 2021, 13, x     are represented in the 202 papers included in this systematic state-of-the-art review. 3This
                                                                                                                         of 27
                                collection of papers has a combined h-index of 40, as shown in Figure 3.

                                Figure 1. PRISMA Flow Diagram.

                                2.2. Bibliometric Analysis
                                     Figure 2 shows the top producing locations and their associated total number of ci-
                                tations. The United States leads the way in both total publications (42) and total citations
                                (1740), while Australia, the United Kingdom, Canada, and Hong Kong round out the top
                                five producing locations with 23, 23, 15, and 11 publications, respectively. Despite only
                                publishing 11 papers, Malaysia has the second-most citations (876), followed by Australia
                                (781), Hong Kong (759), and the United Kingdom (573). In total, 51 locations are repre-
                                sented in the 202 papers included in this systematic state-of-the-art review. This collection
                                of papers
                                 Figure
                                Figure      has a combined
                                       1.1.PRISMA
                                           PRISMA           h-index of 40, as shown in Figure 3.
                                                    FlowDiagram.
                                                   Flow Diagram.

                                2.2. Bibliometric Analysis
                                     Figure 2 shows the top producing locations and their associated total number of ci-
                                tations. The United States leads the way in both total publications (42) and total citations
                                (1740), while Australia, the United Kingdom, Canada, and Hong Kong round out the top
                                five producing locations with 23, 23, 15, and 11 publications, respectively. Despite only
                                publishing 11 papers, Malaysia has the second-most citations (876), followed by Australia
                                (781), Hong Kong (759), and the United Kingdom (573). In total, 51 locations are repre-
                                sented in the 202 papers included in this systematic state-of-the-art review. This collection
                                of papers has a combined h-index of 40, as shown in Figure 3.

                                Figure 2.
                                Figure    Top producing
                                       2. Top producing and
                                                        and highest
                                                            highest cited
                                                                    cited locations.
                                                                          locations.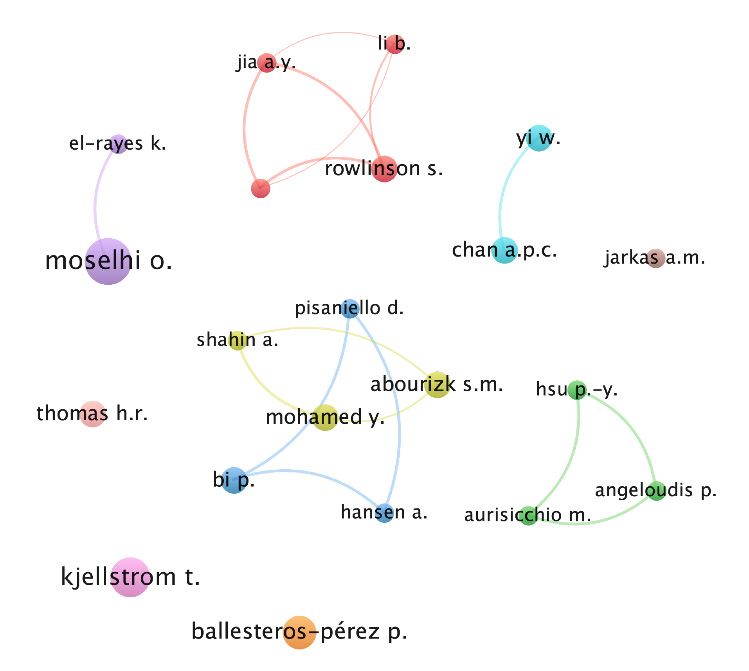
Sustainability 2021,
Sustainability 13, x2861
2021, 13, 44of
of27
25
Figure 3. The included publications have an h-index of 40.
A keyword co-occurrence network was constructed for all publications using both
author keywords and “keywords plus” provided by the journals. Figure 4 shows the key-
word co-occurrence network for the 28 keywords that appeared at least ten times in the
included
Figure The
Figure3.3.The includedpublications
publications.
included publications have
There arehave
threeanan h-indexof
important
h-index ofelements
40.
40. in the keyword co-occurrence
diagram. First, circle or node size represents
A keyword co-occurrence network was constructed for the frequency orall
number of papers
publications usingthatboth
in-
clude A keyword
thekeywords co-occurrence
identifiedand keyword. network
The larger was constructed for all publications using both
author “keywords plus”the circle, the
provided bymore frequentlyFigure
the journals. the given keyword
4 shows the
author
appears.keywords
Second, and
the “keywords
colors plus”
represent provided
clusters or by the
related journals.
keywords.
keyword co-occurrence network for the 28 keywords that appeared at least ten Figure 4
Finally,shows
the thetimes
lines key-
rep-
word
in theco-occurrence
resent co-occurrences—the networkwider
included publications. forThere
thethe28are
keywords
line, that co-occurrences
the important
three more appeared at least
elements ten keyword
inbetween
the timestheinkey-
the
co-
included
words. publications. There are three important elements in the keyword
occurrence diagram. First, circle or node size represents the frequency or number of papers co-occurrence
diagram.
that These First,
include thecircle
keywords or node
are
identified size represents
grouped
keyword. into
Thethree the frequency
clusters,
larger the or number
representing
circle, the more groupsof papers
frequently that
of keywords
the in-
given
clude
that the
keyword identified
appeared keyword.
together
appears. The
in papers
Second, the atlarger the
least four
colors circle, the more
times.clusters
represent frequently
“Construction
or related the
Industry” given keyword
was the
keywords. most
Finally,
appears.
the linesSecond,
frequently theco-occurrences—the
used keyword,
represent colorsappearing
represent in clusters
58 or
papers,
wider related
the followedkeywords.
line, the Finally, the(47),
by “productivity”
more co-occurrences lines rep-
“pro-
between
resent
ject co-occurrences—the
management”
the keywords. (37), wider
“human” the
(33), line,
and the more
“climate co-occurrences
change” (26). between the key-
words.
These keywords are grouped into three clusters, representing groups of keywords
that appeared together in papers at least four times. “Construction Industry” was the most
frequently used keyword, appearing in 58 papers, followed by “productivity” (47), “pro-
ject management” (37), “human” (33), and “climate change” (26).
Figure 4.
Figure Keywordco-occurrence
4. Keyword co-occurrence showing
showing 28
28 keywords
keywords that
that appeared
appeared in
in at
at least
least ten
ten publications.
publications.
These keywords are grouped into three clusters, representing groups of keywords
that appeared together in papers at least four times. “Construction Industry” was the most
frequently used keyword, appearing in 58 papers, followed by “productivity” (47), “project
management” (37), “human” (33), and “climate change” (26).
FigureTable
4. Keyword co-occurrence
1 lists the showing
top 10 highest 28papers
cited keywords that appeared
included in this in at least tenstate-of-the-art
systematic publications.
review. With 439 citations, Richardson (1981) is the top-cited article [11]. The International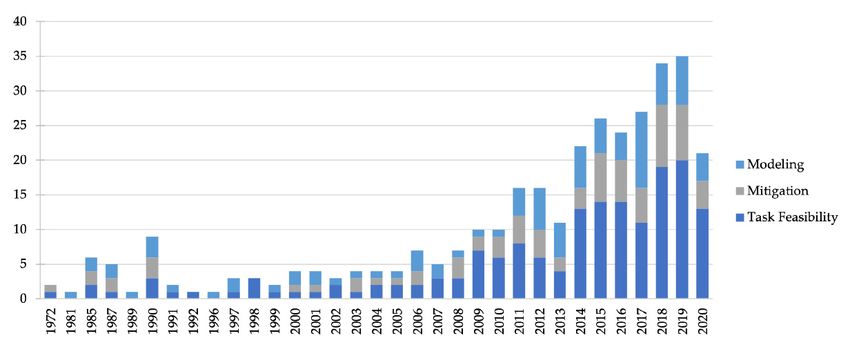
Sustainability 2021, 13, 2861 5 of 25
Journal of Project Management accounted for the majority of the highly published papers,
including five of the top 10 most cited papers.
Table 1. The ten highest cited papers included in the systematic state-of-the-art review.
No. Source Title, Year Title Document Type Times Cited
Stochastic simulation of daily precipitation,
1 Water Resources Research, 1981 Article 439
temperature, and solar radiation
International Journal of Project Causes and effects of delays in Malaysian
2 Article 398
Management, 2007 construction industry
International Journal of Project A comparative study of causes of time overruns in
3 Article 388
Management, 1997 Hong Kong construction projects
A serial approach to local stochastic weather
4 Ecological Modelling, 1991 Article 311
models
International Journal of Project
5 Construction delay: A quantitative analysis Article 298
Management, 2000
International Journal of Project The effects of construction delays on project
6 Article 290
Management, 2002 delivery in Nigerian construction industry
International Journal of Project Cost escalation and schedule delays in road
7 Article 268
Management, 2009 construction projects in Zambia
8 Accident Analysis and Prevention, 2004 The mixed effects of precipitation on traffic crashes Article 250
Archives of Environmental and The direct impact of climate change on regional
9 Article 246
Occupational Health, 2009 labor productivity
Factors affecting construction labour productivity
10 Structural Survey, 2005 Review 233
for Malaysian residential projects
Table 2 showcases the nine authors that have published at least four papers included
in this systematic review. Notably, while the United States produced by far the most
publications included in the review, only one of the top nine most productive authors is
affiliated with the United States (Thomas). Professor Moselhi from Concordia University,
Montreal, Canada, has the most papers included in this review (seven), and he is followed
by authors from New Zealand (Kjellström), Spain (Ballesteros-Pérez), Australia (Peng),
Chan (Hong Kong), Mohamed (Canada), Rowlinson (Hong Kong), Thomas (United States),
and Yi (New Zealand). Professor Tord Kjellström, the Director of Health and Environmental
International Trust, Nelson, New Zealand, has the most citations among the top producing
authors (286).
Table 2. The top producing authors included in the systematic state-of-the-art review.
Author Affiliation Papers Citations
Moselhi, Osama El Sayed Concordia University, Montreal, Canada 7 204
Health and Environment International Trust, Nelson, New
Kjellström, Tord E. 6 286
Zealand
Ballesteros-Pérez, Pablo Universidad de Cadiz, Cadiz, Spain 5 58
Bi, Peng The University of Adelaide, Adelaide, Australia 4 279
Chan, Albert P.C. Hong Kong Polytechnic University, Kowloon, Hong Kong 4 96
Mohamed, Yasser Abdel Rady I. University of Alberta, Edmonton, Canada 4 47
Rowlinson, Steve The University of Hong Kong, Pokfulam, Hong Kong 4 106
Thomas, H. Randolph Pennsylvania State University, University Park, United States 4 180
Yi, Wen Massey University Auckland, Albany, New Zealand 4 88
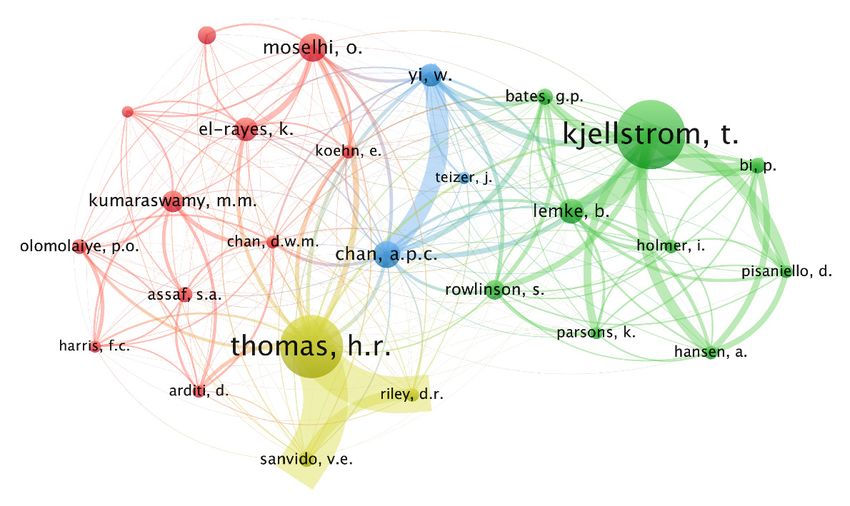
Two additional co-occurrence analysis networks are presented in Figures 5 and 6.
Figure 5 visualizes the co-authorship analysis network of authors with three or more publi-
cations included in the review. This network shows little interaction or crossover among the
top-producing authors. This is to be expected with this systematic review because it draws
papers from a wide variety of topics and academic disciplines to holistically determine the
impact of weather on construction workers, materials, and tasks. Papers included in this
review come from numerous academic disciplines, including engineering, business and
management, medicine, environmental science, and decision sciences.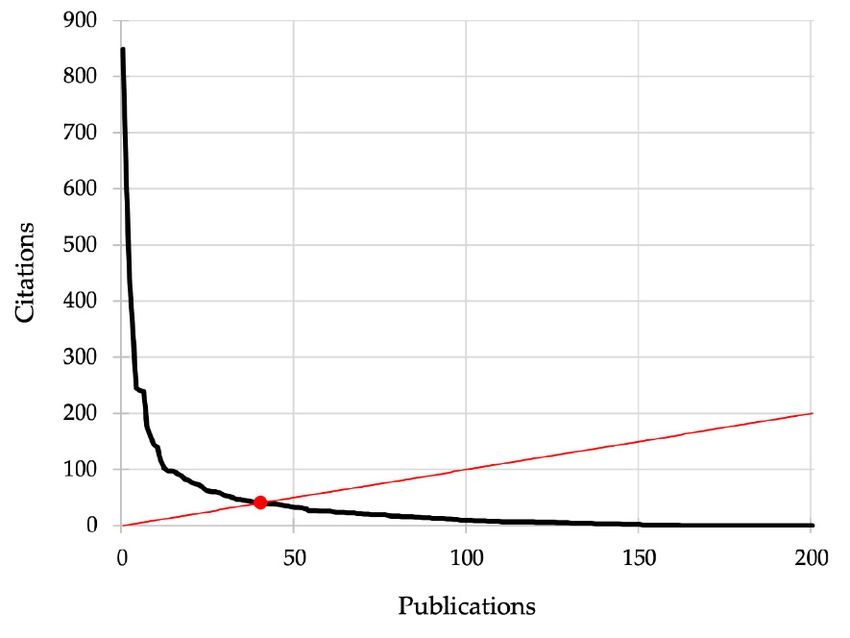
Sustainability 2021, 13, x 7 of 27
Sustainability
Sustainability 2021, 13,x2861
2021, 13, 7 of 27 6 of 25
Figure
Figure5. Co-authorship analysis
5. Co-authorship network
analysis of authors
network with three
of authors or three
with more publications.
or more publications.
Figure 5. Co-authorship analysis network of authors with three or more publications.
Figure
Figure 6. Co-citation
6. Co-citation analysis
analysis of theof
26the 26 authors
authors cited atcited at times
least 25 least 25 times each.
each.
Figure 6. Co-citation analysis of the 26 authors cited at least 25 times each.
The connectedness
2.3.Classification
Classification Literatureof these authors and their research are revealed through the analy-
2.3. ofofLiterature
sis of the author co-citation network shown in Figure 6. The author co-citation network
This review
This review includes
includes 204 204 studies
studies published
published between
between 1972 1972 and
and October
October 2020.
2020. The
The lit-
lit-
examines
erature whose
approaches publications
construction are cited
weather together
delays in in main
three the same
areas:articles.
weather Twenty-six
attributes authors
erature
were approaches
cited cause
at least construction
25 times, weather
and they delays in
are grouped three main areas: weather attributes
that
that directly
directly delays
cause delays by limiting
by limiting construction
construction taskinto
task
four clusters.
feasibility;
feasibility; modeling
modeling
These clusters
efforts
efforts that represent
that
variouspredict
skillfully research streams
delays, of the
estimate various aspects
construction impacts, ofandthe optimize
problem,scheduling;
includingand the effects of
skillfully predict delays, estimate construction impacts, and optimize scheduling; and
weather on
techniques labor productivity
implemented to mitigate and methods
delays caused to manage
by heatSeveral
weather. stress suffered
areas are by
mostconstruction
techniques implemented to mitigate delays caused by weather. Several areas are most
workers.
acutely This
impacted review
by agglomerates
weather, including these
labor, disconnected
equipment, and research
acutely impacted by weather, including labor, equipment, and materials. These types of streams
materials. These to fully
types of assess the
delays
impactare classified
of weather hereon as task feasibility
construction. delays. The review found that
delays are classified here as task feasibility delays. The review found that mitigative tech- mitigative tech-
niquesare
niques areclassified
classifiedas asphysical
physicalor oradministrative
administrativeprotocols.
protocols.Additionally,
Additionally,several
severalclimate
climate
2.3.
factors Classification
appear in the of Literature
literature, including temperature, precipitation, humidity,
factors appear in the literature, including temperature, precipitation, humidity, wind, and wind, and
anomaly
anomalyThis weather
review
weather events. Extreme
includes
events. Extreme events,
204events,
studies such as
published
such tornadoes
as tornadoes and
between hurricanes,
1972 andare
and hurricanes, are disrup-
October
disrup- 2020. The
tiveto
tive toconstruction
constructionand andhave
haveunexpected,
unexpected,traumatic
traumaticeffects.
effects. However,they theyare
arenot
notwithin
within
literature approaches construction weather delays inHowever,
three main areas: weather attributes
the primary scope of this
the primary scope of this review. review.
that directly cause delays by limiting construction task feasibility; modeling efforts that
skillfully predict delays, estimate construction impacts, and optimize scheduling; and
techniques implemented to mitigate delays caused by weather. Several areas are most
acutely impacted by weather, including labor, equipment, and materials. These types
of delays are classified here as task feasibility delays. The review found that mitigative
techniques are classified as physical or administrative protocols. Additionally, several
climate factors appear in the literature, including temperature, precipitation, humidity,
wind, and anomaly weather events. Extreme events, such as tornadoes and hurricanes, are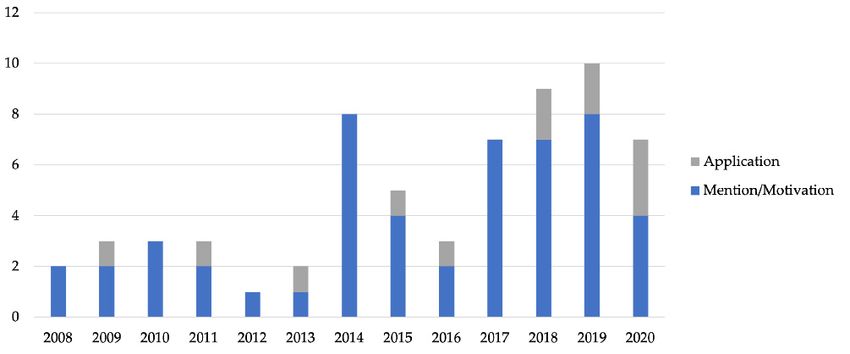
Sustainability 2021, 13, 2861 7 of 25
Sustainability 2021, 13, x 8 of 27
disruptive to construction and have unexpected, traumatic effects. However, they are not
Sustainability 2021, 13, x
within the primary scope of this review. 8 of 27
An article with multiple focuses is counted in each relevant research area, so the fol-
An article with multiple focuses is counted in each relevant research area, so the fol-
lowing analysis is not cumulative. Figure 7 provides a non-cumulative, temporal summary
lowing analysis is not cumulative. Figure 7 provides a non-cumulative, temporal sum-
of the distribution of paper focusisareas. The each
taskrelevant
feasibility category is the most commonly
maryAn of article with multiple
the distribution focuses
of paper counted
focus areas.inThe research
task feasibility area, so
category thethe
is fol-most
researched
lowing
commonly
andisisnot
analysis
researched
featured
cumulative.in 133
and is featured
of in
Figurethe 204ofpublications
7133
providesthe a204
(65.2%) retained
non-cumulative, temporal
publications (65.2%)
in
sum-this review.
retained in
The
next
mary most
of the common
distributionindividual
of paper research
focus focuses
areas. The were
task modeling
feasibility
this review. The next most common individual research focuses were modeling (33.3%) (33.3%)
category is and
the labor
most productiv-
commonly researched
Figure 8and is featured the
ity labor
and (30.9%).
productivity summarizes
(30.9%). Figurein8 summarizes
133 of the 204 publications
breakdown weather(65.2%)
theofbreakdown retained
attributes
of weather by in construction
the
attributes
this review.
impact The next
area. The impactmost common individual research focuses were modeling (33.3%)
by the construction impact of temperature
area. The impactisof thetemperature
most common is thesingle
most area
common studied,
singleaccounting
and labor productivity (30.9%). Figure 8 summarizes the breakdown of weather attributes
for 87
area of theaccounting
studied, 204 publications
for 87 of (42.6%). Humidity(42.6%).
the 204 publications (26.0%)Humidity
and precipitation
(26.0%) and (20.1%)
pre- are the
by the construction impact area. The impact of temperature is the most common single
nextstudied,
area most
cipitation commonly
(20.1%) are the researched
accounting for
next most commonly
87 of the 204 weather factors.
researched
publications The
(42.6%). least factors.
weather
Humidity common Theresearch
(26.0%) and pre- focus areas
least com-
mon research
include focus
climate areas
change include climate
applications change
(5.9%), applications
physical (5.9%),
mitigation
cipitation (20.1%) are the next most commonly researched weather factors. The least com- physical
techniques mitigation
(13.2%), and the
techniques
impact
mon (13.2%),
of wind
research and
focus(14.2%).the impact of wind (14.2%).
areas include climate change applications (5.9%), physical mitigation
techniques (13.2%), and the impact of wind (14.2%).
Figure7. 7.
Figure Non-cumulative,
Non-cumulative, primary
primary research
research areas byareas
year; by year;
many many
of the of the
papers papers
address address multiple
multiple
Figure 7. Non-cumulative, primary research areas by year; many of the papers address multiple
research
research areas resulting
areas in what
resulting in appears
what as a greater
appears as a number
greater ofnumber
papers than
of were published
papers than in published in
were
research areas resulting in what appears as a greater number of papers than were published in
each
eachyear.
each year.
year.
Weather
Figure8.8.Weather
Figure factors
factors by construction
by construction impact impact areas/task
areas/task feasibility
feasibility research research
area; area; one study may
one study
Figure
may 8. Weather
include
include multiplefactors
multiple by construction
weather
weather impact
factors; therefore,
factors; therefore,thisareas/task
figure
this feasibility
is not
figure research area; one study
iscumulative.
not cumulative.
may include multiple weather factors; therefore, this figure is not cumulative.
The papers are also classified by whether the effects of changing climate are ad-
The papers are also classified by whether the effects of changing climate are addressed.
dressed.
The Sixty-four
papers areof also
the studies reviewed
classified considerthe
by whether climate change
effects in some form,
of changing where
climate are ad-
Sixty-four
12 of those of papers
63 the studies reviewed consider climate change
the in
usesome form, where
in 12 of those
dressed. Sixty-four of directly address
the studies climate
reviewed change
consider through
climate change inofsome
projections
form, where
63ofpapers
12 directly
those 63 papersaddress climate climate
directly address changechange
through the use
through theofuse
projections in modeling
of projections in or
analysis, while 51 simply mention climate change as a motivation, limiting factor, or future
research opportunity, without using projections in their analysis. Thirty-seven of the 63
papers that meaningfully address climate change consider temperature changes. Figure 9Sustainability 2021, 13, x 9 of 27
Sustainability 2021, 13, 2861 8 of 25
modeling or analysis, while 51 simply mention climate change as a motivation, limiting
factor, or future research opportunity, without using projections in their analysis. Thirty-
seven of the 63 papers that meaningfully address climate change consider temperature
changes. the
depicts Figure 9 depicts theof
progression progression of climate
climate change aschange
a focusas ainfocus
the in the papers
papers re-
reviewed, with the
viewed,
first with the first
publication publication
occurring inoccurring in 2008. Superficial
2008. Superficial allusionsallusions to climate
to climate change
change have increased
have increased steadily since its first mention, though only limited and sporadic modeling
steadily since its first mention, though only limited and sporadic modeling applications
applications have been completed. Clearly, there is a demand for the inclusion of climate
have been completed. Clearly, there is a demand for the inclusion of climate change
change projections in construction scheduling and delay modeling that is not being sati-
projections
ated. in construction scheduling and delay modeling that is not being satiated.
Figure The
Figure 9.9.The number
number of studies
of studies considering
considering climate climate change.
change. Those that Those
mentionthat mention
climate changeclimate
or change or
use climate change as a motivation without applying projections in their analysis are categorized
use climate change as a motivation without applying projections in their analysis are categorized as
as “Mention/Motivation.” In contrast, those that apply climate change (e.g., through climate pro-
“Mention/Motivation.” In contrast, those that apply climate change (e.g., through climate projections)
jections) are categorized as “Application.”.
are categorized as “Application.”.
Geographic trends exist in the literature for case study-based papers. Figure 10 below
Geographic
displays trends
scaled circles exist in the
corresponding literature
to the numberfor case study-based
of studies emanating from papers. Figure 10 below
each ap-
displays scaled
plied to that circles
region, corresponding
of a total to theidentified
of 128 case studies number fromof studies
the 204emanating from each applied
studies retained.
One
to example
that region,of regionalization
of a total of 128 is the prevalence
case studiesofidentified
worker/labor productivity
from studies inretained. One
the 204 studies
the Middle East [12–17] and East Asian Countries near the Tropic of Cancer
example of regionalization is the prevalence of worker/labor productivity studies in the [10,18–22].
The prevalence of worker productivity studies in these regions could be due to the vast
Middle East [12–17] and East Asian Countries near the Tropic of Cancer [10,18–22]. The
number and density of the labor forces in nations like India and China or the recent in-
prevalence of workerin
crease in development productivity studies
these countries. The in these Peninsula’s
Arabian regions could highbe due to the vast number
temperatures
and density of the labor forces in nations like India and
draw many researchers to study laborer conditions and worker health. Fewer case China or thestudies
recent increase in
development in these
exist in colder regions andcountries.
the AfricanThe Arabian
continent. ThosePeninsula’s high for
studies collected temperatures
colder regionsdraw many re-
include Sweden
searchers [23], Finland
to study laborer[24], Denmarkand
conditions [25],worker
Norway health.
[24], Canada
Fewer [26,27],
caseNepal [19],exist in colder
studies
Russia [28],
regions andandtheoffshore
African construction
continent.[29,30].
ThoseThe studies
studies of the African
collected continent
for colder were include Swe-
regions
conducted in Nigeria [31–33], Libya [34], Egypt [35,36], Zambia [37], or across several
den [23], Finland [24], Denmark [25], Norway [24], Canada [26,27], Nepal [19], Russia [28],
countries [8,38]. There are no regional, standardized modeling techniques for incorporat-
and offshore construction [29,30]. The studies of the African continent were conducted in
ing weather delays in construction. The likely reasons include a regional variation of cli-
Nigeria [31–33],
mate impacts, Libya
available [34],
data, andEgypt [35,36],
goals [3,9]. Zambia
Overall, [37], or
the spatial across
analysis of several countries [8,38].
case studies
There
retainedarebynotheregional,
PRISMA searchstandardized modeling
indicates that a greatertechniques for incorporating
quantity of publications came fromweather delays
in construction.
countries with largerThepopulations,
likely reasons include
advanced a regional
construction variation
industries, and ofaclimate impacts, available
large number
of research
data, universities.
and goals [3,9]. Overall, the spatial analysis of case studies retained by the PRISMA
Sustainability 2021, 13, x search indicates that a greater quantity of publications came from 10countries
of 27 with larger
populations, advanced construction industries, and a large number of research universities.
Figure 10.
Figure 10.World
Worldmapmap
of caseof
study
caselocations
studywith scaled bubbles
locations correlating
with scaled to the number
bubbles of
correlating to the number of
studies in that region. Two case studies were applied to offshore construction and are represented
studies in that region.
here in the Atlantic Ocean. Two case studies were applied to offshore construction and are represented
here in the Atlantic Ocean.
3. Results and Discussion
3.1. Overview Source of Delays
While weather conditions during many days allow for meaningful construction pro-
gress, suboptimal temperatures, precipitation, and winds challenge task feasibility. Ulti-
mately, the weather creates delays, which can drive schedule slippage and cost. Sched-Sustainability 2021, 13, 2861 9 of 25
3. Results and Discussion
3.1. Overview Source of Delays
While weather conditions during many days allow for meaningful construction
progress, suboptimal temperatures, precipitation, and winds challenge task feasibility.
Ultimately, the weather creates delays, which can drive schedule slippage and cost. Sched-
ulers must account for likely delays in their planning. The addition of climate change
considerations increases complexity to the problem facing construction planners and man-
agers. Examining the influence of climate change and its impact on adverse weather
conditions will help depict a holistic view of its present and future implications on con-
struction work. As such, the following sections discuss the impact of adverse weather
conditions on construction project efficiency. The effects of adverse weather conditions
are separated into sections related to worker productivity, construction materials, and
equipment use. Additionally, modeling techniques used in research to create preventative
strategies for negative consequences to weather are discussed.
3.2. Impact of Weather on Task Feasibility
Studies investigating construction delays find weather as a contributing factor. The
most frequent weather factors studied consist of temperature, humidity, precipitation, and
wind [19,20,39–42]. These weather factors affect labor, materials, and equipment, each
in unique ways. Temperature changes generally affect the length that laborers can work
outside, in addition to putting limitations on equipment if conditions prove unsafe for
operations. Humidity poses a threat to material placement, specifically concrete, which can
be negatively affected by even slight additions of water beyond its water-cement ratio. This
effect is doubly negative in precipitation conditions, which can negatively affect labor and
equipment operations, especially if that precipitation combines with other weather effects
such as lightning or snow, heavy snow accumulation, and material freezing. Finally, winds
can affect materials and labor through the need for restraints for unconstructed materials,
and debris knocked around by winds can threaten personnel. Even high-strength winds
can threaten equipment operations. All three aspects of task feasibility can be affected by
these weather conditions. As such, the following sections describe in detail the scope of
these threats.
3.2.1. Labor
The workforce is the most critical resource regarding task feasibility [43]. Worker
productivity is an uncertain factor that can be affected by exogenous variables, including
weather. As previously stated, the most frequent weather factors studied are temper-
ature [19,20,23,39–42,44], humidity [19,20,23,39–42,44], precipitation [23,44], and wind
[20,23,39–42,44].
Temperature variation is negatively correlated to worker productivity, causing 64%
of productivity variability [42]. For every 1 ◦ C rise in temperature above 28 ◦ C, worker
productivity can decrease by up to 57%, and temperature rise increases the risk of heat-
related injuries, including heat rash, heat cramps, heat exhaustion, and heatstroke [42].
Prolonged, unmitigated exposure to heat can adversely affect the human body [1,45,46]. An
individual working under heat stress conditions is four times more likely to experience heat-
related illness [47]. Moreover, exposure to cold temperatures affects the skin, muscles, and
internal organs [20]. Low temperatures reduce the power and performance of workers [20].
However, the adverse labor productivity effects caused by cold temperatures can be
reduced by wearing appropriate clothing [41].
Each country is affected differently by temperature variations. Countries with high
poverty rates, lower labor standards, and informal employment arrangements, which are
given government protection, experience higher costs than developed countries [48]. For
example, the United States shows a loss of work capacity of 0.17% under moderate work
conditions, while India shows a 2% loss under the same conditions [49]. The effects of the
increased temperatures also produce ordered results outside of illness. These effects areSustainability 2021, 13, 2861 10 of 25
psychological and caused by the stress of prolonged exposure to hot environments [48]. The
effects of heat lead to slower work, more mistakes, and create an atmosphere of increased
risks of accidental injuries [21,42,49].
In addition to temperature and humidity, precipitation and wind speed affect worker
productivity. Rain and snow slow or stop productivity and divert worker attention to
covering or protecting materials and work areas [23]. If work areas are not protected
in adverse weather conditions, workers have to spend time shoveling and cleaning in
the aftermath (Jung et al. 2016). While large weather events are often considered most
disruptive, even low magnitude events can affect construction. Precipitation occurring
as light rain (less than 4 mm per 12 h) can reduce labor productivity by up to 40% [23].
Jung et al. (2016) found that even moderate precipitation (at least 5 mm per hour) can
result in a work stoppage. Precipitation can also have latent effects on construction. Heavy
snowfall can affect worker productivity regardless of whether it occurs on the day of the
scheduled work tasks and can reduce crew efficiency by 35% [50].
Although precipitation and high wind speeds may render construction tasks unfeasi-
ble, the primary factor causing the worker productivity delay is the risk to workers’ safety.
High wind speeds increase the risk of worker accidents [23]. For example, workers gov-
erned by safety standards legislation are generally prohibited from completing construction
tasks on scaffolding during high winds or electrical storms due to falling or electrocution
safety risks [51]. Snow coupled with cold temperatures can also cause falling hazards as
workers can slip on ice [52]. Moreover, painting in high winds presents a ‘struck-by’ hazard
as buckets can be blown over and fall onto workers on lower levels [51].
3.2.2. Materials
Though weather-related construction delays are most commonly associated with
worker productivity, weather conditions can negatively impact the behavior of construc-
tion materials. The scope of this analysis is limited to materials used in major outdoor
construction activities since the weather has minimal impact on indoor construction. There-
fore, the materials investigated are concrete, asphalt, brick, steel, and soils. Numerous
climatic factors exist that could potentially damage these materials. However, this paper’s
scope will focus on the impact the previously identified aspects of climate–temperature,
humidity, precipitation, and wind have on each of the materials listed above.
Low temperatures, high winds, and precipitation are consistently critical factors that
affect concrete placement productivity rates [53]. Concrete pour activities are limited to
temperatures between 0 ◦ C and 40 ◦ C, and maximum wind speeds less than 30 knots.
Due to the freezing point of water, exceeding these thresholds degrade the concrete’s final
strength [54]. Cold weather concrete mixtures have been developed with a non-chloride
accelerator that protects against freezing at ambient temperatures as low as −7 ◦ C [55].
The use of heated enclosures and insulated blankets can overcome this threshold, and
so a complete work stoppage threshold is redefined at −15 ◦ C [52]. The effects of hot
weather on concrete were shown to be minimized with the use of water reducing and
retarding admixtures [56]. Water evaporation can occur in hot weather, changing the water
to cement ratio and decreasing compressive strength [57]. Heavy rainfall can also impact
productivity for concrete operations. Increasing the water content of a concrete mix will
have negative results. Asphalt paving operations have similar temperature thresholds but
are more susceptible to small amounts of precipitation in the form of rain, snow, or hail [58].
Spreading an aggregate mix under wet conditions is difficult, and freezing temperatures
can increase viscosity too quickly [54]. The base must be dry, and temperatures cannot be
between 0 ◦ C and 10 ◦ C [59].
Masonry is another construction task that can be impacted by weather, and predomi-
nantly temperature. A normal temperature range for masonry work is between 4.4 ◦ C and
37.8 ◦ C. Laying bricks should not occur if temperatures are below 4.4◦ C before construction
begins. If temperatures drop below 4.4 ◦ C during construction, the mortar will need to be
heated to maintain a minimum of 4.4 ◦ C. In hot conditions, mortar needs to be kept belowSustainability 2021, 13, 2861 11 of 25
48.9 ◦ C for it to be effective [60]. Cold weather was seen to cause a 3 to 5-h delay in mortar
mixing [61]. The majority of literature is focused on masonry labor-productivity under
certain weather conditions instead of the effect on the material [62,63].
Steel is another frequently used material in construction projects [51,52,64]. It is most
often associated with structural reinforcement, including columns, foundations, or footers,
and structural support in vertical construction [51,52]. In addition to its prevalence within
the industry, activities that use steel are generally found on the project’s critical path
and can affect the scheduled duration when delayed [65,66]. Therefore, it is crucial to
account for weather risks when planning projects containing steelwork due to its exposed
nature [4,67].
When using steel in construction, planners should consider wind, temperature, and
precipitation in their scheduling. Wind speed is the most frequently cited aspect of weather
impacting steel construction [9,52,68]. Wind speeds exceeding approximately 56.33 km/h
were unsafe for lifting operations because these efforts involved the use of cranes [52,54,68].
Visibility, as affected by precipitation, also prevented the assembly of steel structures [50,69].
Rain intensity rather than total rainfall affects steel construction, although work stopped
when the area’s average reached 1.04 cm [70]. Joining methods like welding and steel
detailing is also affected by precipitation [54]. Extreme temperatures tend to impair the
labor force’s ability to use steel before the material is adversely affected [66,71]. However,
at sufficiently cold temperatures, typically below −51.1 ◦ C, certain types of steel become
more brittle, which should be put at high consideration if building in arctic conditions or if
freezing temperatures of this magnitude are expected [64].
Additionally, extreme cold weather plays a role in the type of steel selected. Traditional
carbon steel frequently shatters when exposed to repeated shock loading, necessitating the
use of steel alloys [64]. Research surrounding extreme hot temperatures focused on steel
construction’s labor productivity rather than how the material was affected.
Earthwork operations and site preparations can be heavily impacted by precipitation
and low temperatures. Rainfall can hinder performance and increases soil humidity [54].
Runoff can quickly flood a worksite without proper sealing. Permanent and temporary
drainage facilities should be put in place early to prevent delays [61]. A common precipita-
tion threshold set for mass excavations is between 6.35 mm and 12.7 mm [59]. Excavations
in freezing temperatures can be especially challenging. Frost penetration can create frozen
soils that can be very difficult to remove, refill, and compact [72]. A gas-operated ground
thawing device may be required in some cases [64].
3.2.3. Equipment
An essential component to task feasibility is the use of construction equipment and
how weather conditions may affect operational limits. For this study, the definition of
equipment is limited to construction vehicles. Construction vehicles include tracked and
wheeled vehicles as well as temporary construction cranes.
Weather conditions that affect construction equipment are primarily cold temper-
atures, high winds, and heavy rain. The environmental limitations for equipment are
examined below through an analysis of these three weather conditions. Construction vehi-
cles, independent of type, are affected by cold weather, defined as −17 ◦ C to −29 ◦ C [64].
Anything below −29 ◦ C is considered arctic conditions, and special winterization measures
are needed to protect equipment.
In cold conditions, a problem of primary concern is cold-starting engines. As tem-
perature drops, engine oil becomes more viscous, making engines harder to crank. At
low-temperatures, batteries also put out less power. The engine must reach a temperature
that the components and oils can function normally to overcome cold conditions. Using
engine heaters is a way to achieve operational engine heat [64]. Engine heaters require an
investment in additional equipment to plug engine heaters into. An additional solution
is to build heated garages to store equipment. Construction equipment makes extensive
use of hydraulics, especially in earth moving equipment. Hydraulics require unique win-Sustainability 2021, 13, 2861 12 of 25
terization to ensure that hoses and O-rings can withstand low temperatures [73]. Typical
construction equipment is not capable of operating in extremely low temperatures without
proper winterization upgrades.
Wind speeds have a considerable effect on cranes. High winds can make using cranes
unsafe. From 2000 to 2010, 1125 tower crane accidents caused over 780 fatalities [74]. Gen-
erally speaking, it is dangerous to operate a tower crane in winds over 72.42 km/h. Many
countries have regulations that significantly restrict crane operations in high winds [75].
The crane manufacturer’s recommendations for wind speed limitations closely ad-
hered to the construction industry safety standards. Weather conditions that exceed the
allowed crane wind speed will cause a shut down in operation. As loads increase, the
maximum allowable wind speeds decrease. Modern weather forecasting and on-site
anemometers allow for more efficient lift planning schedules and increase project safety.
Precipitation can have a significant impact on construction vehicle operations. Muddy
conditions caused by wet weather can stop operations entirely depending on the type
of vehicle and the soil conditions. In extreme cases, a site may become inaccessible due
to flooding.
Muddy conditions on-site will limit the type of vehicles that can be operated. Tracked
vehicles are ideal for muddy conditions, but they are more costly to maintain and slower.
Treads reduce vehicle ground pressure and allow it to traverse a broader range of ter-
rain [76]. Although tracked vehicles can operate better in wet conditions, wheeled vehicles
are better for on-road transport due to their increased speed and fuel efficiency [76]. Con-
struction vehicles that need to regularly leave the site, like dump trucks, concrete trucks,
and other transport vehicles, must be wheeled. However, wheeled vehicles cannot navigate
heavy mud. In wet conditions, these wheeled vehicles are confined to roads or other
improved surfaces. This restriction can increase delays because materials coming on-site
will need to be cross-loaded from over the road transport to a vehicle capable of navigating
the muddy conditions.
Precipitation is the most significant weather predictor of on-road motor vehicle
crashes [77]. Vehicle transport will be slowed during precipitation events, along with
an increased risk of accidents and injuries. These delays frequently impact the flow of
workers and material to the site. Additionally, the frequency of rain events has a significant
impact on the risk of traffic accidents. There are several percent increases in the risk of an
accident if there have been two days between rain events vs. 20 days [78]. This is due to
the accumulation of oils on the road surfaces. More frequent rains tend to wash away oils
before they can accumulate.
3.3. Methods to Model or Predict Delays
Mathematical models are algorithms used to calculate outputs based on input data
and specified parameters and constraints to find solutions to set objectives. These tools
help decision-makers identify optimal or near-optimal solutions for problems with large
search spaces [16]. Weather is modeled to determine the impacts on workers, equipment,
and schedule [34,52]. Weather modeling consists of three overarching types: weather
generation models, construction impact models, and project scheduling models, as shown
in Table 3.
Weather generation models utilize site-specific weather data, historical weather, geo-
graphical extrapolation, or some combination of the datasets mentioned above to simulate
or predict delay-causing events in a construction area [9]. Most construction-related
weather models use historical weather to predict delay-causing events, but extrapolation is
used when historical data is unavailable. Weather events of interest include factors such
as temperature, precipitation, wind, humidity, and frost [9,52,68]. Weather generation
models can be adjusted based on the data used to produce a wide range of probabilistic and
deterministic scenarios at a specific site, which improves project planning capabilities [72].
These types of models work to predict the weather and intensity of weather during a
project timeline.Sustainability 2021, 13, 2861 13 of 25
A stochastic weather generator that can compute a series of weather sequences of
the most influential weather parameters affecting construction is a vital requirement of
the proposed framework [9]. Classification of weather-generation methods is based on
the historical weather data treatment: parametric [9,11,79,80] and non-parametric ap-
proaches [51,81,82]. Parametric weather generators are numerical models that reproduce
synthetic weather data as a daily time-series of weather variables with the same statistical
properties as historical weather data [11,79]. Parametric models excel when a construction
period is not applied [83].
Table 3. Modeling literature characterization.
Author Model Type Objectives Data Used
Ballesteros et al. 2016
Wilks 2009
Weather Weather prediction Parametric weather data
Racsko et al. 1991
Richardson 1981
Caraway et al. 2013
Weather Weather prediction Non-parametric weather data
Lee et al. 2012
Chan et al. 2012
Choi and Ryu 2014
Weather effects
El-Rayes and Moselhi 2001 Impact localized weather data
Impacts on workers
Risikko et al. 2003
Gatti et al. 2014
Chan et al. 2012
Choi and Ryu 2014 Weather effects
Impact localized weather data
Risikko et al. 2003 impacts on materials
El-Rayes and Moselhi 2001
Yaseen et al. 2020
Xiang et al. 2013
Moselhi et al. 2012
Yi et al. 2015 Weather prediction Parametric and/or
Impact
Moohialdin et al. 2019 Impacts on construction non-parametric weather data
Boateng et al. 2012
Wei 2017
Ghani et al. 2020
Jung et al. 2016
Senouci et al. 2018
Thomas et al. 1999
Yi et al. 2017
Muqeem et al. 2011b
Shahin et al. 2011
Shahin et al. 2014 Weather prediction
Shahin et al. 2007 Construction Impacts on construction Parametric and/or
Dytczak et al. 2013 Scheduling Optimized schedule/worker non-parametric weather data
Hassanein and Moselhi 2004 productivity
Wales and AbouRizk 1995
Moselhi et al. 1990
Pan 2004
Senouci et al. 2017
Shan and Goodrum 2014
Al-alawi et al. 2017
Muqeem et al., 2011a
Alfakhri et al. 2017
Schedule Optimization
Kholy 2013
Construction Cost Optimization Determined delays on equipment,
Gunduz et al. 2015
Scheduling Worker Productivity materials, and personnel
Taha et al. 2016
Weather is not the focus of research
Sheng et al. 2018
Castro and Dawood. 2006
While models that do not utilize weather data have been developed [34,36,43,84–86],
construction impact models use weather-generation data to model critical weather effects
test task sensitivity. Task sensitivities are used to develop construction delay estimates,Sustainability 2021, 13, 2861 14 of 25
which can be transformed into outcomes of interest such as cost, schedule, and worker
productivity [42,68,72,87].
Construction impact models use stochastic weather model results to determine im-
pacts on many construction factors, such as worker productivity. One notable model is
the WEATHER model, which analyzes the impact of weather-related events on worker
productivity [58]. Hot and humid climates produce a significant delay stemming from
the change in weather [42]. The effects of cold weather on worker productivity are not as
commonly studied as hot and humid climates; however, extreme weather events, both hot
and cold, when modeled, show impacts on productivity, safety, and health [20].
Construction impact models viewing the effect of weather-related events on worker
productivity [24,58,88–90], construction materials [24,58,88,89], and construction processes
[20,38,42,91–95]. Construction impact models that focus on worker productivity are
regression-based and only consider single weather factors [23,57,88–90]. These models are
criticized as too simplistic concerning their ability to accurately represent weather impacts
on worker productivity [42]. These model types are also used to gauge worker productivity
based on physiological responses at the individual level: heart rate, resting heart rate, and
breathing rate [90] as well as recovery rate [88]. Major criticisms of single factor regression
models rest on the fact that such models use simple weather parameters [42]. While these
models are used to predict worker productivity, some do not include confounding factors
such as mental and physiological factors and individual worker capabilities [42]. These
confounding factors are improved by gathering data through worker-mounted cameras
and computer vision analysis technology to quantify worker time and produce activity
quantities [42]. Another issue with modeling construction site impacts is the lack of a
standard definition for worker productivity under various weather conditions [42].
Project scheduling models are used to generate efficient schedules based on construction
site conditions, weather impacts, and worker productivity [15,42,49,51,64,67,71,87,96–101]. A
multi-objective optimization model can generate optimal or near-optimal schedules that
minimize construction projects’ time and cost in extreme weather regions [16]. Building
information models are primarily used as a simulation tool to integrate construction
information into productivity rates used for scheduling [65]. Optimizing scheduling to
account for weather impacts on construction sites can also be subject to prioritized variables:
minimizing time, cost, and maximizing quality of profit [16,83].
3.4. Mitigation Techniques/Adaptation Strategies
Weather delays can be mitigated with physical and administrative project adjustments
and strategies. The reviewed literature indicates that 14% of papers included physical miti-
gation methods, and 30% had administrative mitigation strategies. Mitigation strategies are
validated by comparing the results of the weather and construction models highlighted in
the literature. Physical mitigation techniques are primarily used in the execution phase of
construction, while administrative mitigation techniques are used in the construction plan-
ning phase. Understanding weather variations and planning uncertainty in task feasibility
required a more precise decision-making tool for contractors and owners [85]. Predicting
an accurate construction duration will create better control of a project’s budget [102].
Research and utilization of these mitigation strategies can help construction managers
adapt, avoid, or anticipate delays due to weather.
3.4.1. Physical
Physical mitigation techniques found in the literature primarily focused on strategies
to improve worker productivity due to temperature [10,48,54,103–107]. For example, pro-
ductivity losses due to heat exposure for labor workers can be combated with regulated
physical work breaks, increased fluid intake of workers, and personal protective devices
such as sun reflecting hats or more breathable fabric for personal clothing items [10]. Chan
et al. researched 30 identified fabrics and their effect on worker productivity, resulting
in preferred prototype uniforms for construction workers [103]. Additionally, humidityYou can also read