Mapping Disease Transmission Risk of Nipah Virus in South and Southeast Asia - MDPI
←
→
Page content transcription
If your browser does not render page correctly, please read the page content below

Tropical Medicine and
            Infectious Disease

Article
Mapping Disease Transmission Risk of Nipah Virus
in South and Southeast Asia
Mark A. Deka *       ID
                          and Niaz Morshed
 Department of Geography, Texas State University, 601 University Drive, San Marcos, TX 78666, USA;
 m_m617@txstate.edu
 * Correspondence: mad214@txstate.edu; Tel.: +1-512-557-5647

 Received: 3 May 2018; Accepted: 25 May 2018; Published: 30 May 2018

 Abstract: Since 1998, Nipah virus (NiV) (genus: Henipavirus; family: Paramyxoviridae), an often-fatal
 and highly virulent zoonotic pathogen, has caused sporadic outbreak events. Fruit bats from the genus
 Pteropus are the wildlife reservoirs and have a broad distribution throughout South and Southeast Asia,
 and East Africa. Understanding the disease biogeography of NiV is critical to comprehending the
 potential geographic distribution of this dangerous zoonosis. This study implemented the R packages
 ENMeval and BIOMOD2 as a means of modeling regional disease transmission risk and additionally
 measured niche similarity between the reservoir Pteropus and the ecological characteristics of outbreak
 localities with the Schoener’s D index and I statistic. Results indicate a relatively high degree of
 niche overlap between models in geographic and environmental space (D statistic, 0.64; and I
 statistic, 0.89), and a potential geographic distribution encompassing 19% (2,963,178 km2 ) of South
 and Southeast Asia. This study should contribute to current and future efforts to understand the
 critical ecological contributors and geography of NiV. Furthermore, this study can be used as a
 geospatial guide to identify areas of high disease transmission risk and to inform national public
 health surveillance programs.

 Keywords: Nipah virus; ENMeval; BIOMOD2; risk mapping; ecological niche modeling; disease
 biogeography; infectious disease cartography

1. Introduction
      In a 2005 review on emerging and reemerging infectious agents, of the 1407 human pathogens,
816 (58%) were classified as zoonotic in origin [1]. In recent decades, zoonotic pathogens have
induced considerable stress and anxiety in a broad range of societies worldwide. The emergence of
Nipah virus (NiV) in Peninsular Malaysia in September 1998 was the second in a series of spillover
events. The first, starting in September 1994, was an outbreak of Hendra virus (HeV) in Brisbane,
Australia [2–5]. Nipah and Hendra viruses are members of the family Paramyxoviridae (genus:
Henipavirus), each can potentially cause fatal disease in human and animal hosts [6]. Nipah virus takes
its name from the village of Kampung Sungai Nipah in Malaysia, where the virus was isolated from
pigs presenting neurological and respiratory symptoms [7,8]. NiV-infected pigs developed a unique
clinical condition called ‘barking pig syndrome’ [9]. The first human cases in Malaysia (Perak, Negri
Sembilan, and Selangor states) and Singapore were reported amongst abattoir workers.
      The Malaysia epidemic resulted in 265 cases of acute encephalitis with 109 deaths and the culling
of 1.1 million pigs [10,11]. Since 1998, Malaysia and Singapore have not documented human cases;
however, human disease has been continuously reported in Bangladesh since 2001, with mortality
rates estimated at approximately 70% [12]. Subsequently, NiV has emerged as a significant public
health threat in Bangladesh and India [13]. Unlike the initial outbreak, in which pigs were the primary
host, the role of bat reservoirs in human infection has been substantiated [14]. The geography of

Trop. Med. Infect. Dis. 2018, 3, 57; doi:10.3390/tropicalmed3020057       www.mdpi.com/journal/tropicalmed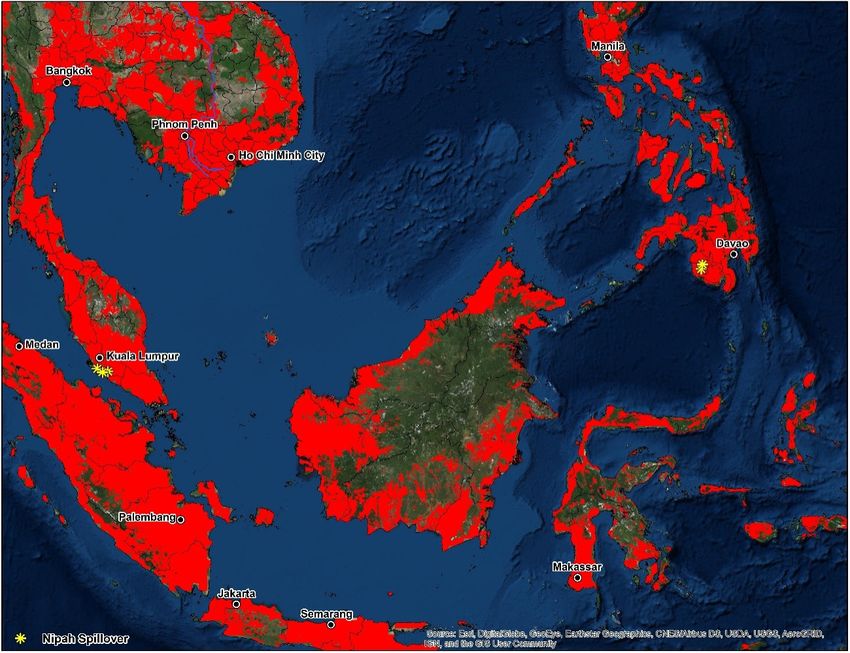
Trop. Med. Infect. Dis. 2018, 3, 57                                                                 2 of 23

NiV in Bangladesh, exhibits characteristics of clustering, particularly in the Dhaka, Khulna, Rajshahi,
and Rangpur divisions. Date palm monoculture and the geographic distribution of transmission
events since 2001 display strong spatial dependency [4,15,16]. Bats (order: Chiroptera) of the family
Pteropodidae, genus Pteropus (flying foxes) are the presumed wildlife reservoir of NiV [17]. Pteropus
giganteus or the Indian flying fox is the largest frugivorous bat species in Bangladesh and is of key
interest as the zoonotic reservoir of Nipah virus. Pteropus giganteus is further associated with harboring
at least 55 recently-discovered viruses [18]. The asymptomatic nature of NiV in bats suggests that the
virus had evolved alongside Pteropus bats for centuries, and more than likely this adaptation has been
responsible for human exposure long before the virus was first reported in 1998 [19–21]. Biological
traits making bats well-suited for hosting a variety of microorganisms include their long lifespans,
which facilitate viral persistence [22] and their ability for flight. Long-distance travel is prevalent;
in fact, the grey-headed flying fox (Pteropus poliocephalus) expands its range by up to 600 km during
long-distance travel between roosting sites [23–25]. Regionally, 330 species of bats are endemic to
Southeast Asia, which accounts for 25% of the world’s overall bat diversity [26]. The genus Pteropus
alone features 60 species of bat with broad geographic distributions extending to the east coast of
Africa, the Philippines, Indonesia, New Guinea, and much of the Indian sub-continent [6].
      NiV is classified as a high-priority agent of biological warfare by the Centers for Disease Control
and Prevention [27] and causes severe respiratory and febrile encephalitic illness in humans after
an incubation period between 4–45 days [28]. Symptoms range from fever, headache, myalgia,
disorientation, seizure, vomiting and coma, with a case mortality rate ranging from 40–70% [29–31].
Viruses from the genus Henipavirus can infect a wide range of mammalian species and outside
of NiV and HeV, include recently discovered Cedar (CedV), Kumasi (KV), and Mojiang virus
(MojV). The primary risk factors for contracting NiV in Bangladesh and eastern India are tied to
the consumption of raw date palm sap, contaminated with the urine or saliva of Pteropus bats, direct
contact with infected humans, and hunting bats for bushmeat [4,15,18,32–35]. Studies using infrared
cameras have shown that Pteropus bats visit date palm trees at night and contaminate sap by licking
and urinating in the collection pots [36]. Those who contracted the disease following the consumption
of raw or fermented date palm sap had a higher case fatality rate compared to those individuals who
developed illness through direct exposure to an infected human [37]. Reports from India confirm
that Pteropus bats are hunted for both food and medicine and are used as treatments in rural areas for
asthma and chronic pain [38]. Pathogen spillover begins when a viral agent jumps from an animal
reservoir to humans with minimal subsequent human–human transmission [39]. During these repeated
exposures, a phenomenon known as ‘viral chatter’, transformations may develop making it more
likely that the pathogen will spread to humans [39]. Spillover is a critical antecedent and serves as a
significant upstream source for human–human transmission [40]. According to Plowright et al. [41],
a series of interconnected conditions are necessary for the facilitation of spillover events from bats.
Bats, of course, must be present in the environment and must be infected and actively shedding the
pathogen. Outside of the reservoir, the virus must survive in the environment and have access to a
recipient host in sufficient quantities to cause illness.
      Previous efforts to model and identify the pertinent ecological contributors and geography of
NiV are limited and vary considerably by the scale of analysis. Peterson [42] and Hahn et al. [43]
developed ecological niche models for Bangladesh, based on human occurrences and Pteropus
roosting sites. While Walsh [44] took a broad scale approach across South and Southeast Asia
using an inhomogeneous Poisson model. Disease modeling and risk mapping contribute to a better
understanding of ecology, epidemiology, and disease biogeography, while providing an objective
basis for public policy formulation [45]. Disease biogeography and infectious disease cartography
(infectious disease mapping) are emerging fields of study, merging quantitative mapping with the
study of infectious disease, vectors, reservoirs, and susceptible hosts [46,47]. Disease biogeography
shares linkages with epidemiology and ecology through the application of analytical toolsets to
study the distribution of epidemic events [46]. Infectious disease cartography similarly applies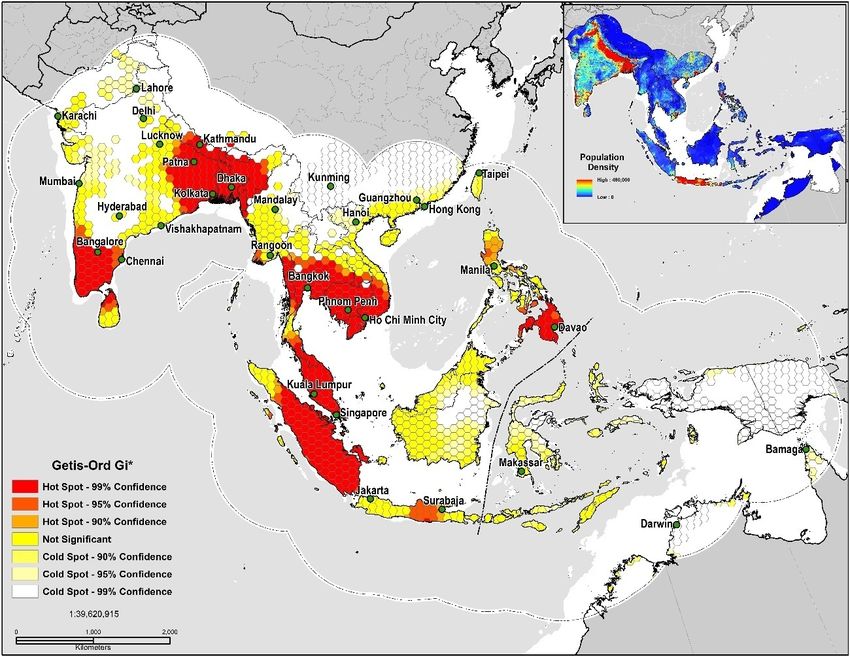
Trop. Med. Infect. Dis. 2018, 3, 57                                                                  3 of 23

analytical techniques as a means of quantifying disease transmission risk through deterministic [48],
statistical [49], and geostatistical modeling [26]. Together these frameworks provide evidence-based
policymaking for public health officials focused on mitigating the effects of infectious agents in human
and animal populations.
      In recent decades, South and Southeast Asia have become the location of emerging and
re-emerging infectious diseases, due to a combination of inadequate public health systems, rapidly
expanding human populations, and an abundance of potential wildlife hosts [50]. Future efforts to
describe the geographic variation in the disease transmission risk of NiV infection regionally would
benefit from an understanding of the disease biogeography of the primary host Pteropus, and of the
environmental characteristics of NiV transmission localities. The primary aim of this study was to:
(1) provide contemporary disease maps that delineate the most significant risk for NiV in South and
Southeast Asia; (2) identify those abiotic and biotic features associated with increased risk; and (3)
to evaluate geostatistical models to ascertain varying degrees of model overlap in geographic and
environmental space. Because of the imminent public health threat associated with NiV, the need
for detailed risk maps is necessary to improve disease surveillance, control systems, and to further,
minimize human mortality, long-term morbidity, economic distress, and spillover events.

2. Materials and Methods

2.1. Study Area
     This study covered 15,595,674 km2 (17.55◦ S to 38.55◦ N, 64–146◦ E) (Figure 1) and included
the countries of Afghanistan, Australia, Bangladesh, Brunei, Cambodia, China, Hong Kong, India,
Indonesia, Laos, Macau, Malaysia, Maldives, Myanmar, Nepal, Pakistan, Papua New Guinea,
the Philippines, Singapore, Sri Lanka, Taiwan, Thailand, Timor-Leste, and Vietnam. An essential
element in the development of ecological niche models are hypotheses of the areas (M) that are
potentially accessible to the species; a theory incorporated into the three-factor conceptual ‘BAM’
framework (biotic, abiotic, movement) [51,52]. With this in mind, we delineated our study area
as recommended by Peterson and Samy [53]. South and Southeast Asia are home to an estimated
2,884,289,620 people or 39% of the world population and produces a vast economic output estimated
annually at $9.107 trillion (GDP—nominal) [54–56] (Figure 1).

2.2. Data Collection
     Biosurveillance data for Nipah outbreaks and seropositive Pteropus bats (n = 51) (1998–2014)
were acquired from the Institute of Epidemiology, Disease Control and Research (IEDCR)
(Dhaka, Bangladesh) [57], the World Health Organization [16], and a variety of diverse literature
sources [8,13,58–63]. Vector-borne and zoonotic agents are spatially dependent on the geographic
distribution of both their vectors and hosts. To discern the risk of disease transmission, it is imperative
to identify the geographic distribution of the host species [64–66]. NiV has been documented in bats
from the genus Pteropus; we utilized The Global Biodiversity Information Facility (GBIF) (GBIF.org
(18 November 2017) GBIF Occurrence Download https://doi.org/10.15468/dl.utprbq) to identify the
geographic distribution of Pteropus sightings and specimens (n = 918). Finally, both datasets were
georeferenced in ArcGIS 10.5.1 with a geographic coordinate system [67].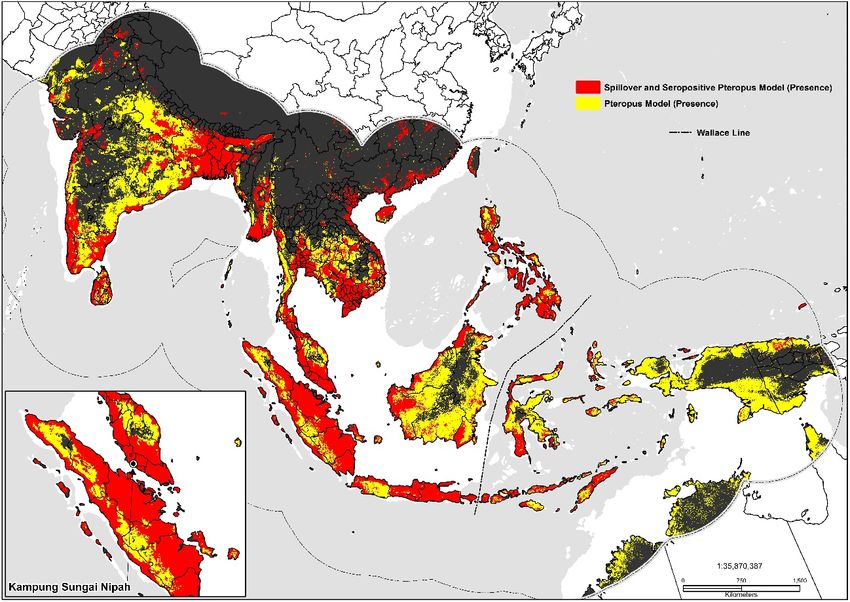
Trop. Med. Infect. Dis. 2018, 3, 57                                                                              4 of 23
Trop. Med. Infect. Dis. 2018, 3, x FOR PEER REVIEW                                                              4 of 23

Figure  1. Presence-only
     Figure               datadata
             1. Presence-only   for for
                                    the the
                                         development
                                             developmentof of
                                                           thethe
                                                                disease
                                                                  diseasetransmission
                                                                           transmissionrisk
                                                                                        riskmodels.
                                                                                             models. The  dashed
                                                                                                      The dashed
outline in grey
     outline      demarcates
             in grey          the the
                      demarcates  analysis   area
                                      analysis    at at
                                                area 770770
                                                          km,
                                                            km,which
                                                                  whichrepresents
                                                                         representsthe
                                                                                    the accessibility
                                                                                        accessibility or potential
                                                                                                      or potential
movement    (M)  as defined by the ‘BAM’    framework.
     movement (M) as defined by the ‘BAM’ framework.

2.3. Model
2.3. Model Covariates
           Covariates
      With the
      With   the aim
                  aimofofidentifying
                           identifyingabiotic   and
                                          abiotic    biotic
                                                   and       features
                                                         biotic        andand
                                                                 features   theirtheir
                                                                                  association   with with
                                                                                        association   Pteropus  hosts
                                                                                                            Pteropus
and   human    transmission    events,  a variety of high-resolution    geospatial   datasets  were
hosts and human transmission events, a variety of high-resolution geospatial datasets were applied   applied   (Table
1). In acquiring
(Table             climate data,
         1). In acquiring          the widely-cited
                              climate                 WorldClim WorldClim
                                        data, the widely-cited      Global Climate     database
                                                                                   Global        wasdatabase
                                                                                           Climate    not used [54],
                                                                                                                  was
due   to  recently  identified   limitations   [55]. As   an  alternative,   nineteen-MERRAclim
not used [54], due to recently identified limitations [55]. As an alternative, nineteen-MERRAclim      (Modern-Era
Retrospective Retrospective
(Modern-Era       Analysis for Research
                                   Analysis and
                                              forApplications)
                                                   Research and   bioclimatic  variables
                                                                     Applications)        from 2000–2010
                                                                                      bioclimatic   variables[56]from
                                                                                                                   (2.5
arc-minutes)     were   incorporated.     MERRAclim        coverages    are  constructed    through
2000–2010 [56] (2.5 arc-minutes) were incorporated. MERRAclim coverages are constructed through        homogenous
hourly temperature
homogenous                and humidity
                 hourly temperature      anddata    collected
                                              humidity          by NASAby(National
                                                          data collected                  Aeronautics
                                                                               NASA (National             and Space
                                                                                                   Aeronautics    and
Administration)
Space               satellitesatellite
        Administration)       reanalysis   of 28 data
                                       reanalysis      products
                                                    of 28          and represent
                                                           data products            nineteen nineteen
                                                                             and represent    bioclimatic   variables
                                                                                                         bioclimatic
[68]. The global
variables          distribution
            [68]. The             of land cover,
                       global distribution        enhanced
                                              of land  cover,vegetation
                                                               enhanced index     (EVI),index
                                                                            vegetation   land surface   temperature
                                                                                                (EVI), land  surface
temperature (LST) and elevation at a resolution of 1-km coverages were acquired from Processes
(LST)   and   elevation   at  a resolution   of  1-km   coverages    were    acquired   from   the  Land   the Land
Distributed
Processes       Active Archive
            Distributed              Center Center
                          Active Archive      (LP-DAAC)
                                                     (LP-DAAC)(https://lpdaac.usgs.gov/),     and the
                                                                    (https://lpdaac.usgs.gov/),      and NASA
                                                                                                          the NASA  Jet
Propulsion    Laboratory—California        Institute of Technology     (https://www2.jpl.nasa.gov/srtm/).
Jet Propulsion Laboratory—California Institute of Technology (https://www2.jpl.nasa.gov/srtm/).
     Because of the implications of anthropogenic activities on the emergence of zoonotic and
vector-borne diseases, gross forest cover loss (2000–2016) was acquired at a 30-m resolution from
the Global Forest Watch (GFW) (http://earthenginepartners.appspot.com/science-2013-global-forest/
download_v1.4.html) [69]; and high resolution human population density grids (2015) at a 1-km
resolution from the GeoData Institute (www.worldpop.org.uk). Gross forest loss is a change from
forest to non-forest, or a stand-replacement disturbance [69]. Additionally, incorporated were data
depicting the presence of tree plantations in Southeast Asia at a 1-km resolution. This dataset, created
by Transparent World (http://www.transparentworld.ru/en/), with direct support from the Global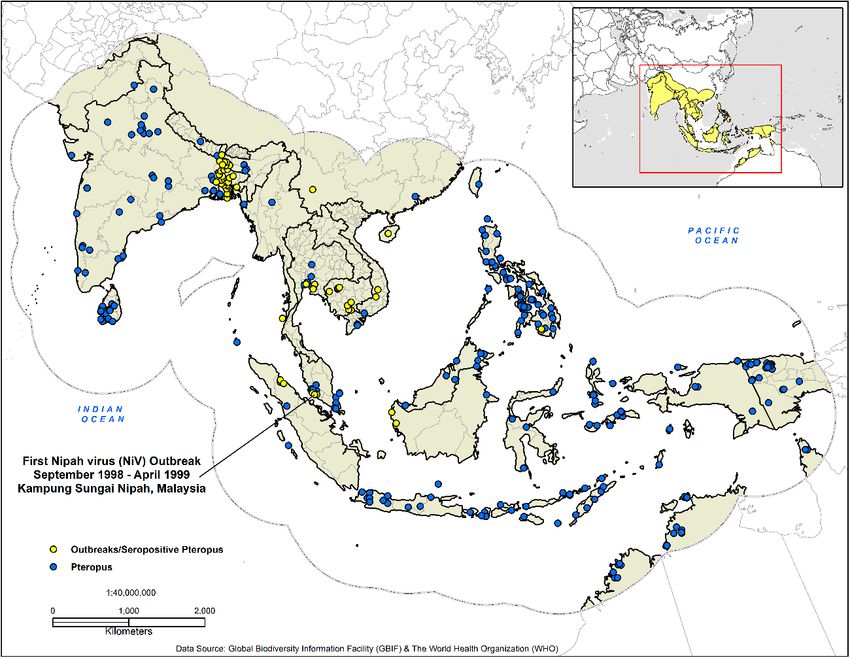
Trop. Med. Infect. Dis. 2018, 3, 57                                                                                5 of 23

Forest Watch (GFW), features geospatial data representing a variety of plantations ranging from oil
palm, fruit, coconut palm, cacao, and wood fiber/timber. All forms of domesticated zoonotic reservoirs
including cattle, goats, sheep, and pigs were considered. These considerations were justified because
of the amplification of the virus by pigs, and the results of a recent study that identified NiV antibodies
circulating in cattle and goat populations in Bangladesh [70]. The global distribution was represented
with the Gridded Livestock of the World products via the Food and Agricultural Organization
of the United Nations (FAO) (1-km resolution) (http://www.livestock.geo-wiki.org). All model
covariates were preprocessed at a 1-km resolution with identical cell sizes and spatial reference
systems. To define potential biologically-relevant variables and to guard against multi-collinearity and
over-parameterization, we performed a measure of variance inflation factors (VIF) [71] on all 34-model
covariates. In total, seventeen covariates were excluded before the model calibration phase, and these
include one land cover covariate (broadleaf biomes), the density of goats, and all MERRAclim rasters
other than temperature seasonality, the mean temperature of driest quarter, the mean temperature of
warmest quarter, and precipitation of warmest quarter.

                                                   Table 1. Environmental variables.

                                      Variable                            Data Type               Resolution
                 Annual Mean Temperature                           Environmental/continuous      2.5 arc-minutes
                 Mean Diurnal Range                                Environmental/continuous      2.5 arc-minutes
                 Isothermality                                     Environmental/continuous      2.5 arc-minutes
                 Temperature Seasonality                           Environmental/continuous      2.5 arc-minutes
                 Max. Temperature of Warmest Month                 Environmental/continuous      2.5 arc-minutes
                 Min. Temperature of Coldest Month                 Environmental/continuous      2.5 arc-minutes
                 Temperature Annual Range                          Environmental/continuous      2.5 arc-minutes
                 Mean Temperature of Wettest Quarter               Environmental/continuous      2.5 arc-minutes
                 Mean Temperature of Driest Quarter                Environmental/continuous      2.5 arc-minutes
                 Mean Temperature of Warmest Quarter               Environmental/continuous      2.5 arc-minutes
                 Mean Temperature of Coldest Quarter               Environmental/continuous      2.5 arc-minutes
                 Annual Precipitation                              Environmental/continuous      2.5 arc-minutes
                 Precipitation of Wettest Month                    Environmental/continuous      2.5 arc-minutes
                 Precipitation of Driest Month                     Environmental/continuous      2.5 arc-minutes
                 Precipitation Seasonality                         Environmental/continuous      2.5 arc-minutes
                 Precipitation of Wettest Quarter                  Environmental/continuous      2.5 arc-minutes
                 Precipitation of Driest Quarter                   Environmental/continuous      2.5 arc-minutes
                 Precipitation of Warmest Quarter                  Environmental/continuous      2.5 arc-minutes
                 Precipitation of Coldest Quarter                  Environmental/continuous      2.5 arc-minutes
                 Evergreen Broadleaf                                 Landscape/categorical           1-km
                 Croplands                                           Landscape/categorical           1-km
                 Gross Canopy Loss (2000–2016)                   Human environment/categorical        30-m
                 Elevation (SRTM)                                    Landscape/continuous            1-km
                 Mean MODIS EVI (2001–2012)                          Landscape/continuous            1-km
                 Mean Value 8-day MODIS day-time Land
                                                                     Landscape/continuous            1-km
                 Surface Temperature (LST) (2011–2012)
                 Tree Plantations (Southeast Asia)                   Landscape/categorical           1-km
                 Mixed Forests                                       Landscape/categorical           1-km
                 Mosaic Cropland/Vegetation                          Landscape/categorical           1-km
                 Woody Savannas                                      Landscape/categorical           1-km
                 Human Population Density (2015)                 Human environment/continuous        1-km
                 Cattle Density                                      Landscape/categorical           1-km
                 Goat Density                                        Landscape/categorical           1-km
                 Sheep Density                                       Landscape/categorical           1-km
                 Pig Density                                         Landscape/categorical           1-km
Trop. Med. Infect. Dis. 2018, 3, 57 6 of 23
2.4. Model Calibration
To quantify disease transmission risk, the R 3.4.1 [72] packages ENMeval [73] and BIOMOD2 [74]
were used for the analysis. The first step in our study was to test both presence-only datasets in
ENMeval or f MaxEnt (fine-tuned MaxEnt) to determine the correct feature class transformations (FC)
and ß regularization multipliers (RMvalues). ENMeval facilitates the construction of ENM’s based
on the presence-only method, MaxEnt (v. 3.3.4k) [75]. The ENMeval package calculates evaluation
metrics as an alternative to arbitrarily assigning model parameters. ENMeval allows the user to
conduct spatially independent evaluations and partition data through the implementation of k-fold
cross-validation, and further determines model fit based on the Akaike Information Criterion (AIC)
and provides six options for data partitioning. Of the six, the n − 1 jackknife method was used. Models
in R were built with a range of ß regularization multipliers (RM values) from 0.5 to 4.0 (increments
of 0.5) to test for and prevent model over-complexity and overfitting. All possible feature class (FC)
transformations (L, LQ, H, LQH, LGHP, and LQHPT), those being linear (L), quadratic (Q), hinge
(H), product (P), and threshold (T), were used resulting in 500 individual model replicates. Modeling
methods such as MaxEnt display some of the highest predictive ability in identifying favorable
suitability outside of known occurrence locations [76]. The principle of maximum entropy estimation,
first described by [77], from a theoretical perspective is a Bayes estimation method [78]. MaxEnt
predicts the relative occurrence rate (ROR) in each cell based on the environmental characteristics at
each PO location [79].
The second step involved creating a consensus or ensemble model (RM) using the BIOMOD2
package. BIOMOD2 gives the user the option of implementing machine learning, classification,
regression and surface range envelope techniques using presence/absence data and environmental
covariates. The central basis for ensemble forecasting operates on the premises that by using several
modeling methods that a measure of central tendency (mean or median) can be quantified, and
thus a more reliable prediction can be made [80]. Eleven algorithms were applied in this study:
generalized linear models (GLM) [81], generalized additive models (GAM) [81], generalized boosting
model (GBM) [82], classification tree analysis (CTA) [83], artificial neural networks (ANN) [84],
surface range envelop (SRE) [85], flexible discriminant analysis (FDA) [86], multiple adaptive
regression splines (MARS) [87], random forest (RF) [88], maximum entropy (Maxent. Phillips) [75],
and low-memory multinomial logistic regression (Maxent. Tsuruoka) [89]. Other than the maximum
entropy (Maxent. Phillips) technique, which included the ENMeval defined feature-class settings and
ß regularization multipliers, the remaining algorithms featured the BIOMOD2 default model settings.
Model parameters specified a true skill statistic (TSS) evaluation metric quality threshold of 0.75 have
the potential of being quite useful [90]. Cohen’s Kappa compares observed accuracy with a measure of
expected accuracy (random chance) and is regarded as a robust measure of agreement calculation [91].
The TSS similarly measures model performance by considering omission and commission errors and
ranges from −1 (random) to +1 (perfect model agreement) [92]. An inherent advantage of the TSS
is that it retains the strong properties of KAPPA while not experiencing issues with sensitivity [93].
An overview of the methods can be found below (Figure 2).Trop. Med. Infect. Dis. 2018, 3, x FOR PEER REVIEW 7 of 23
inherent
Trop. advantage
Med. Infect. of3,the
Dis. 2018, 57 TSS is that it retains the strong properties of KAPPA while not experiencing
7 of 23
issues with sensitivity [93]. An overview of the methods can be found below (Figure 2).
Figure 2. Method overview.
Figure 2. Method overview.
2.5. Geospatial Analysis
2.5. Geospatial Analysis
Following the exportation of the ensemble models, binary maps were produced from the
Following the exportation of the ensemble models, binary maps were produced from the selected
selected TSS quality threshold values (Trop. Med. Infect. Dis. 2018, 3, 57 8 of 23
s
∑nj=1 x2j
S= − X 2 (3)
n
2.6. Measuring Niche Overlap
The overlapping distribution of reservoir and recipient hosts delineates geographies where the
recipient hosts are at an increased risk for infection [41]. To measure similarities between model
surfaces and to evaluate the niche conservatism in environmental (∆env ), and geographic space (∆ geo ),
two statistical measures—Schoener’s D index [97] and the I statistic from Hellinger distance [66]—were
employed. Geographic space in this analysis represents the M hypotheses of accessibility, while the
second facet, ecological space, or ‘natural space’ defines the environment separate from human activity
or the interdependence between physical and living constituents [98]. Both methods were incorporated
in ENMTools [66]. These statistics employ metrics ranging from 0 (no overlap) to 1 (>0.6 significant
overlap). The I and D statistics determine overlap by calculating the difference between models in the
suitability scores within each grid cell [66]. Niche overlap is calculated using Schoener’s D with the
following formula:
1
2 n∑
D p x, py, = 1 − Px,i− Py,i− (4)
=i
where Px,i and Py,i signify the probability assigned by the ENM to grid cell i for species x and y [99].
Schoener’s D applied to Px,i values establish the degree of geographic overlap between the Pteropus
reservoir distribution and human transmission models. The I statistic on the contrary measures true
suitability without prior biological assumptions Px,i and is defined as [66,99]:
1
I Px , Py = 1 − H Px, Py (5)
2
Hellinger distance or H is defined as:
s p q
∑
H Px , Py = Px,i − Py,i (6)
i
3. Results
After tuning the reservoir PO data and environmental coverages in fMaxEnt, the most robust
model performance was achieved with all feature classes (LQHPT) and a regularization multiplier of 4.0
(ß). The top-performing techniques in BIOMOD2 were the generalized linear model (GLM), generalized
boosting model (GBM), flexible discriminant analysis (FDA), multiple adaptive regression splines
(MARS) and random forest (RF) algorithms. The maximum entropy and low-memory multinomial
logistic regression (Maxent. Tsuruoka) methods performed poorly and were excluded from the final
ensemble output. Model evaluation values between ROC, KAPPA, and TSS were acceptable and
ranged from 0.606 to 0.897 (Table 2). The most accurate model when comparing ROC, KAPPA and TSS
metrics was the random forest algorithm.
Table 2. Model evaluation statistics (average)—reservoir model.
Model ROC KAPPA TSS
GLM 0.873 0.606 0.627
GBM 0.886 0.654 0.663
FDA 0.867 0.616 0.616
MARS 0.868 0.607 0.621
RF 0.897 0.661 0.681Trop. Med. Infect. Dis. 2018, 3, 57 9 of 23
Highly favorable conditions are found in equatorial regions extending past the Wallace Line
(faunal line) to New Guinea, the Philippines, west through Southern Vietnam, Cambodia, Thailand,
a substantial proportion of the Indian sub-continent, southwestern Pakistan, southern China and
northern Australia. Population density (importance: 0.286), mean temperature of the driest quarter
(importance: 0.252), precipitation of the warmest quarter (importance: 0.143), land surface temperature
(LST) (importance: 0.124), and temperature seasonality (importance: 0.117) were critical environmental
predictors (Table 3).
Table 3. Top model contributors—reservoir model.
Variable Contribution Sample Averages
Population Density 0.286 1357 per cell
Mean Temperature of the Driest Quarter 0.252 23 ◦ C
Precipitation of the Warmest Quarter 0.143 1124 mm
Land Surface Temperature (LST) 0.124 -
Temperature Seasonality 0.117 30 ◦ C
Elevation (SRTM) 0.074 709 m
EVI MODIS (2001–2012) 0.060 -
Mean Temperature of Warmest Quarter 0.039 28◦ C
Mosaic Vegetation 0.036 -
Cattle Density 0.028 24.85
Pig Density 0.025 18.84
The best performance and ideal settings for the human transmission model was a regularization
multiplier of 1 (ß), and a linear (L) only feature class setting. The top-performing techniques were the
generalized linear model (GLM), generalized boosting model (GBM), flexible discriminant analysis
(FDA), multiple adaptive regression splines (MARS), random forest (RF), maximum entropy (Maxent.
Phillips), and low-memory multinomial logistic regression (Maxent. Tsuruoka)algorithms (Table 4).
Cattle density (importance: 0.509), temperature seasonality (importance: 0.201), elevation (importance:
0.115), land surface temperature (LST) (importance: 0.105), population density (importance: 0.103),
the mean temperature of the driest quarter (importance: 0.097), and the mean temperature of the
warmest quarter (importance: 0.088) were significant model contributors (Table 5). The most accurate
models were the machine learning techniques: random forest and the generalized boosted model.
Geographically, a high probability of occurrence was predicted on coastal and highly populated areas in
southern China, the Mekong Delta, Peninsular Malaysia, Java and Sumatra, Indonesia, the Irrawaddy
Delta, India and Sri Lanka.
Table 4. Model evaluation statistics—human transmission model.
Model ROC KAPPA TSS
GLM 0.862 0.615 0.629
GBM 0.917 0.752 0.772
FDA 0.857 0.611 0.623
MARS 0.902 0.729 0.734
RF 0.770 0.747 0.789
Maxent. Phillips 0.770 0.526 0.517
Maxent. Tsuruoka 0.878 0.627 0.675
Large inland swaths of high suitability are identified throughout the southern and northwestern
Indo-Gangetic Plain, southern Pakistan, Bangladesh, and the Brahmaputra Basin. The predicted
distribution is additionally related to the density of sheep (0.06), pigs (0.06), mosaic vegetation (0.051),
and the presence of tree plantations (0.032). Combined the geographic distribution between models
display’s high suitability on coastal stretches of southern China, India, inland portions of the DeccanTrop. Med. Infect. Dis. 2018, 3, x FOR PEER REVIEW 10 of 23
Table 5. Top model contributors (average)—human transmission model.
Variable Contribution Sample Averages
Trop. Med. Infect. Dis. 2018, 3, 57Cattle Density 0.509 45.5 10 of 23
Temperature Seasonality 0.201 40.2 °C
Elevation (SRTM) 0.115 857.45 m
Plateau, southern Nepal, the Indo-Gangetic
Land Surface Temperature (LST) Plain, Indus Basin, Greater
0.105 Mekong -Subregion, Taiwan,
the Philippines, and Indonesia (Figure
Population Density 3). Maps displaying risk at
0.103 the country level
348.71 per forcell
selected areas
were also produced (please see Supplementary
Mean Temperature Materials: S1,0.097
of the Driest Quarter S2, S3). 21 °C
Mean Temperature of the Warmest Quarter 0.088 28 °C
Table 5. Top model contributors (average)—human transmission model.
Sheep Density 0.06 16.7
Pig Density 0.06 16
Variable Contribution Sample Averages
Mosaic Vegetation 0.051 -
Cattle Density 0.509 45.5
Tree Plantations 0.032 -
Temperature Seasonality 0.201 40.2 ◦ C
Precipitation of the
Elevation Warmest Quarter
(SRTM) 0.029
0.115 980 mm
857.45 m
Land Surface Temperature (LST) 0.105 -
Population
Large inland swaths of highDensity 0.103
suitability are identified throughout 348.71 perand
the southern cell northwestern
Mean Temperature of the Driest Quarter 0.097 21 ◦C
Indo-Gangetic Plain, southern Pakistan, Bangladesh, and the Brahmaputra Basin. The predicted
Mean Temperature of the Warmest Quarter 0.088 28 ◦ C
distribution is additionally related to the density of sheep (0.06), pigs (0.06), mosaic vegetation (0.051),
Sheep Density 0.06 16.7
and the presence of tree Pig
plantations
Density (0.032). Combined the0.06 geographic distribution
16 between models
display’s high suitability on Vegetation
Mosaic coastal stretches of southern China,
0.051 India, inland portions
- of the Deccan
Plateau, southern Nepal, Treethe
Plantations 0.032 Greater Mekong- Subregion, Taiwan,
Indo-Gangetic Plain, Indus Basin,
Precipitation of the Warmest Quarter
the Philippines, and Indonesia (Figure 3). Maps displaying0.029 risk at the country980 mm
level for selected areas
were also produced (please see Supplementary Materials: S1, S2, S3).
Figure 3. Predicted geographic distribution in South and Southeast Asia.
Figure 3. Predicted geographic distribution in South and Southeast Asia.
Geospatial and Niche Overlap Analysis
Geospatial and Niche Overlap Analysis
In measuring spatial autocorrelation based on the TSS quality threshold (Trop. Med. Infect. Dis. 2018, 3, x FOR PEER REVIEW 11 of 23
GiPvalue: 0.0052) and exhibits clustering and spatial dependency at eight locations, the southeastern
Indo-Gangetic
Trop. Plain,
Med. Infect. Dis. 2018,Indonesia,
3, 57 Peninsular Malaysia, the Greater Mekong Subregion, southern 11 India,
of 23
northern Sri Lanka, the Irrawaddy Delta, and the Philippines (Figure 4). The land area deemed as
high risk for disease transmission totaled 2963, 178 km2 or 19% of the study area. Niche equivalency
disease 2 or 19% of the study area. Niche equivalency tests of the D
tests of transmission
the D metric totaled
equaled2,963,178 km0.64
a value at indicating a relatively high degree of overlap between
metric equaled
models. a valuewhen
The I statistic at 0.64solely
indicating
basedaonrelatively high degree
the probability of overlap
distribution was between models.
much higher 0.89;I
at The
statistic when
inferring that asolely
very based on the
high level of probability
similarities distribution was much higher
exists in environmental ( )atand
0.89; inferring that
geographic space a
very
( ). In sum, our results indicate that both models share strong similarities in their ecological
high level of similarities exists in environmental (∆ env ) and geographic space (∆ geo ) . In sum,
our results indicate that both models share strong similarities in their ecological niches.
niches.
Figure 4.
Figure 4. TSS
TSS quality
quality threshold (Trop. Med. Infect. Dis. 2018, 3, 57 12 of 23
Table 6. Land area designated as ‘high risk’.
Country Area km2
Afghanistan 15.29
Australia 1258
Bangladesh 122,951
Brunei 2929
Cambodia 96,421
China 68,223
Hong Kong 263
India 549,588
Indonesia 1,107,777
Laos 19,640
Macau 4.88
Malaysia 206,031
Myanmar 90,354
Nepal 8092
Pakistan 18,626
Papua New Guinea 17,540
Philippines 233,641
Singapore 0.97
Sri Lanka 51,430
Taiwan 8187
Thailand 192,403
Timor-Leste 23,554
Vietnam 148,584
Our models predicted a high degree of environmental suitability in vast areas of the Indian
sub-continent, Indonesia, Southeast Asia, Pakistan, southern China, northern Australia, and the
Philippines. In comparing our results to broad-scale analysis of NiV by Walsh [4], which is the
most appropriate for comparison, our models predicted an increase in disease transmission-risk over
stretches of India, Pakistan, Borneo, and portions of western New Guinea. Measures of niche overlap
in environmental (∆env ), and geographic space (∆ geo ) indicate that a relative to very high correlation
exists between the reservoir and human transmission models. To our knowledge, this research is the
first to measure niche overlap between the wildlife reservoir of NiV, spillover events and seropositive
bats, a finding that accounts for the persistence of the virus at the reservoir and landscape level.
Moving beyond niche overlap, the influence of scale must be accounted for. At the coarsest or
finest scales, the manifestation of pathogen exposure varies considerably, and is driven by numerous
human, economic and social structures; as well as the phylogenetic closeness to the reservoir host
species [100]. The implications of measuring such correlations have a high degree of importance to
public health and disease transmission ecology, since the eco-epidemiology of NiV is both sylvatic and
synanthropic [101,102].
Models developed in this study delineated large areas of high disease transmission risk through
much of South and Southeast Asia, especially in the proximity to riparian systems like the Ganges,
Brahmaputra, Irrawaddy and Indus Rivers. According to Hahn et al. [103] in a study of the roosting
characteristics of flying foxes in Bangladesh an increase in colony size correlated positively with the
distance to the nearest river (p = 0.03); a finding supported by studies in neighboring West Bengal,
India [104]. One such region, the Greater Mekong Subregion has since 1970 lost 30% of its forest [105]
with a predicted loss of 75% of its original forest and 42% of its mammal species by 2100 [106].
High disease transmission risk is distributed throughout a coastal corridor from southern Vietnam
north through Hanoi, Nanning, Guangdong, and areas encompassing the global economic hubs of
Hong Kong, Shenzhen, Guangzhou and the Pearl River Delta. The dangers associated with interspecies
transmission events regionally are highlighted by the fact that China is home to about 50% of the
world’s pig population [107]. Neighboring Vietnam, a country with a significant degree of overlap andTrop. Med. Infect. Dis. 2018, 3, x FOR PEER REVIEW 13 of 23
Trop. Med. Infect. Dis. 2018, 3, 57 13 of 23
transmission events regionally are highlighted by the fact that China is home to about 50% of the
world’s pig population [107]. Neighboring Vietnam, a country with a significant degree of overlap
disease transmission-risk,
and disease servesserves
transmission-risk, as the principal hub for pig
as the principal hubexports
for pigregionally. Vietnam distributes
exports regionally. Vietnam
pigs on trading routes through Thailand, Laos, Malaysia, Cambodia,
distributes pigs on trading routes through Thailand, Laos, Malaysia, Cambodia, Hong Hong Kong and Singapore.
Kong and
Southeast
Singapore.Asia features
Southeast multiple
Asia regional
features trading
multiple routes
regional that are
trading dictated
routes by complicated
that are supply and
dictated by complicated
demand trends that vary considerably from country to county [108]. Cattle
supply and demand trends that vary considerably from country to county [108]. Cattle were the highest contributor
were the
to the human transmission model, a finding which implies that intensive
highest contributor to the human transmission model, a finding which implies that intensiveagricultural practices are
present in locations
agricultural practices where spillover
are present in events have
locations occurred.
where As reported
spillover by Chowdhury
events have occurred. Asetreported
al. [70] inby
a
recent 2014 study, cattle and goats with NiVsG antibodies in Bangladesh were more
Chowdhury et al. [70] in a recent 2014 study, cattle and goats with NiVsG antibodies in Bangladesh likely to have had
awere
history
moreof likely
eating to fruit
havethathad
hada previously been partially
history of eating consumed
fruit that by nearby
had previously beenbatpartially
populations; these
consumed
dropped fruits could have subsequently been contaminated with bat excreta or
by nearby bat populations; these dropped fruits could have subsequently been contaminated with saliva. The serological
response
bat excreta byorthe cattleThe
saliva. in this study suggested
serological response aby high
the likelihood of study
cattle in this Henipavirus infection
suggested a high[70]. Cattle
likelihood
serve as an essential
of Henipavirus economic
infection commodity
[70]. Cattle foran
serve as Bangladesh and Myanmar;
essential economic both countries
commodity importand
for Bangladesh up
to two million head of cattle annually because of insufficient domestic production
Myanmar; both countries import up to two million head of cattle annually because of insufficient [108]. Malaysia
is further production
domestic dependent on the Malaysia
[108]. importation of live dependent
is further cattle to meeton the
the rising domestic
importation demand
of live cattlefor
to meat
meet
products [108] (Figure 5).
the rising domestic demand for meat products [108] (Figure 5).
Figure 5.
Figure 5. Disease transmission risk—Southeast
Disease transmission risk—Southeast Asia.
Asia.
The current study determined that land surface temperature (LST) and temperature seasonality
The current
was a strong study of
predictor determined
presence inthat land
each surface
model. Landtemperature (LST) and has
surface temperature temperature
been usedseasonality
as a proxy
was
for numerous epidemiological studies on vector-borne diseases [109–111]. has
a strong predictor of presence in each model. Land surface temperature In been used asthe
predicting a
proxy for numerous epidemiological studies on vector-borne diseases [109–111]. In
distribution of the suspected bat reservoir of Ebola virus disease (EVD) in Africa and models of predicting the
distribution of the suspected
zoonotic transmission, bat reservoir
Pigott [112] identifiedofland
Ebola virustemperature
surface disease (EVD)
(LST)inas
Africa andpredictor
a strong models ofof
zoonotic transmission, Pigott [112] identified land surface temperature (LST) as
environmental suitability. According to the Global Animal Disease Intelligence Report (2016),a strong predictor
land
of environmental
surface temperaturesuitability.
is one of According to the Global
the factors/drivers Animal
influencing theDisease Intelligence
dynamics of animalReport (2016),
and zoonotic
land surface
diseases temperature
globally is March,
[113]. In one of the factors/drivers
February and Aprilinfluencing the dynamics
2016, significant of animal and
above-average zoonotic
temperature
diseases globally [113]. In March, February and April 2016, significant above-average
anomalies (1.43 °C above 20th-century average) were observed in Papua New Guinea, northern and temperatureTrop. Med. Infect. Dis. 2018, 3, 57 14 of 23
anomalies (1.43 ◦ C above 20th-century average) were observed in Papua New Guinea, northern and
eastern Australia and southern Thailand [113]. Coupled with land surface temperature, seasonality
is another catalyst for zoonotic and animal diseases [113]. Previous studies have pointed to seasonal
changes in Pteropus behavioral patterns, especially during the dry season. For example, Pteropus niger
frequently forages on cultivated fruits when their natural food sources are in short supply and are
often observed in plantations, small holdings and home gardens [114]. A longitudinal study on the
prevalence of NiV in Thailand among Pteropus lylei [12] found that the amount of virus and shedding
bats fluctuated with both reproductive cycles and seasonality. Viral shedding was recorded in greater
frequency during the first five months of the year. Additionally, the authors determined that the two
viral strains: Malaysian and Bangladesh were detected in the urine of P. lylei, with the latter being
dominant. This seasonality further corresponds with the dry season reproductive cycles of P. giganteus
(November–April) in Bangladesh and India [12]. Seasonal fluctuations are additionally linked in the
Russian Federation, Lithuania, Poland and Ukraine to epidemic waves of African swine fever (ASF).
These variations are intertwined with the ecology of local wild boar populations [115].
Recently a study on the temporal aspects of human cases found a correlation between yearly
temperature differences and spillover events in Bangladesh from 2007–2013 [116]. Seasonality and
the connection to date palm harvesting are common in human infections, with the majority occurring
in the dry season between December and May [33]. Some mechanisms driving this trend include
improved viral survivorship at colder temperatures and an increase in sap production during the
winter months [116]. The cultivation of date palms has deep historical and cultural roots in Bangladesh
and eastern India; it is a seasonal business for families living primarily in rural areas. Collecting
sap is a critical component of the local economy and constitutes the livelihood of people during the
winter when economic opportunities are lacking [117]. Date palm sap is collected early in the morning,
distributed and consumed within hours before it ferments [116]. Multiple products are made from date
palm sap; these include date palm wine, jaggery (gur), and sugar candy. Bangladeshi villages, where
outbreaks have been documented, have one similarity in that a higher proportion of residents report
consuming fresh date palm sap [116]. Similarly to Ebola virus disease (EVD), NiV causes high mortality
rates in impoverished, rural communities [118,119]. Access to health care among these groups lacks
considerably, even when these individuals face complications from severe illness [120]. Furthermore,
the annual total per capita spending on health care nationwide in Bangladesh is estimated at $12 per
person [121]. In Bangladesh (Figure 6), the majority of human cases are documented in the central
and northwestern districts or the ‘Nipah Belt’. This area features land cover dominated by irrigated
and rainfed croplands interspersed with grassland and forests. Villages found within the Nipah Belt
feature high population densities and a high amount of forest fragmentation [103].
A variety of anthropogenic instigators propels the emergence of novel pathogens like NiV.
Anthropogenic activities are a significant factor in bat-borne zoonosis transmission in human
populations [5]. The continued fragmentation of sylvan landscapes through human-induced pressures
has the potential of amplifying and increasing the likelihood of human–animal interactions [44,122].
The emergence of NiV is a clear example of amplification via agricultural encroachment through the
establishment of monoculture plantations and the increased abundance of domestic animals [123].
Similar cases are documented with epidemics of Rift Valley fever (RVF) and Venezuelan equine
encephalitis [124]. Preceding the 1998 outbreak was slash-and-burn deforestation for industrial
plantations and pulpwood, followed by severe drought conditions exacerbated by the 1997–1998 El
Nino southern oscillation (ENSO) [59]. Fragmentation propelled by urbanization leads to changes
in connectivity among and between bat metapopulations, a phenomenon that has been identified in
Australia as a driver of Hendra virus (HeV) infection in flying foxes [125]. These events result in a
reduction of bat migration and exert pressure on the internal structure of bat populations facilitating
spillover events [126]. Wilcox and Gubler [127] defined disturbances as contributing ‘to the natural
disassembly of orderly natural communities’ through species ‘habitat simplification’ and ‘ecological
release’. Investigations of the roosting behavior of Pteropus giganteus in Bangladesh indicate that withTrop. Med. Infect. Dis. 2018, 3, 57 15 of 23
increasing population density and forest fragmentation came a propensity for the bats to roost in
Trop. Med. Infect. Dis. 2018, 3, x FOR PEER REVIEW 15 of 23
the remaining proximal tree canopy [44,103]. This behavior is typical in communities with previous
zoonotic transmission
with previous zoonoticto humans [112].
transmission Landscape
to humans [112].fragmentation and habitat loss
Landscape fragmentation have previously
and habitat loss have
prompted bat colonies to seek alternative roosting sites on or near human dwellings
previously prompted bat colonies to seek alternative roosting sites on or near human dwellings [5,59]. Land[5,59].
cover
change and deforestation in Bangladesh are attributed to poverty, land tenure rights,
Land cover change and deforestation in Bangladesh are attributed to poverty, land tenure rights, and and unenforced
forest management
unenforced policy practices
forest management [128,129].
policy practices [128,129].
Figure 6.
Figure 6. Intersecting
Intersecting cells
cells of
of high-disease
high-disease transmission
transmission risk
risk superimposed
superimposed on Bangladesh, eastern,
on Bangladesh, eastern,
and northeast India, and western Myanmar. The center of the map features the outline
and northeast India, and western Myanmar. The center of the map features the outline (white)(white) of
of the
the
‘Nipah Belt’, an area of Bangladesh characterized by reoccurring outbreaks since
‘Nipah Belt’, an area of Bangladesh characterized by reoccurring outbreaks since 2001.2001.
From 1970 to the mid-1990s, mango trees were planted near pig farms in Malaysia to increase
From 1970 to the mid-1990s, mango trees were planted near pig farms in Malaysia to increase
agricultural output [14], a decision that ultimately intensified bat-pig interactions, the persistence of
agricultural output [14], a decision that ultimately intensified bat-pig interactions, the persistence of
the virus, and human infection. The shift from vegetable-based diets to those with a higher intake of
the virus, and human infection. The shift from vegetable-based diets to those with a higher intake
animal proteins is another factor [14]; zoonotic disease potential intensifies in proportion to the
of animal proteins is another factor [14]; zoonotic disease potential intensifies in proportion to the
population of host animals and is commonly linked to an increased demand for meat products [130].
population of host animals and is commonly linked to an increased demand for meat products [130].
After the 1998 Malaysia outbreak, government restrictions were placed on fruit cultivation near
After the 1998 Malaysia outbreak, government restrictions were placed on fruit cultivation near
poultry farms, resulting in policies that are now praised by public health officials [5]. Economically,
poultry farms, resulting in policies that are now praised by public health officials [5]. Economically,
the consequences of the initial NiV outbreak was devastating, along with the loss of human life, the
the consequences of the initial NiV outbreak was devastating, along with the loss of human life,
Malaysian government estimates that 36,000 jobs and $350 million in revenue were lost during
the Malaysian government estimates that 36,000 jobs and $350 million in revenue were lost during
September 1998–May 1999 [7]. The economic impact of NiV in Bangladesh and India has yet to be
September 1998–May 1999 [7]. The economic impact of NiV in Bangladesh and India has yet to be
assessed [131]. To account for the shift to commercialized monoculture, the incorporation of data
assessed [131]. To account for the shift to commercialized monoculture, the incorporation of data
representing tree plantations in Southeast Asia was a necessity. Although not contributing a high
representing tree plantations in Southeast Asia was a necessity. Although not contributing a high
degree of variable importance to the human-transmission model (0.032) and being limited by the
degree of variable importance to the human-transmission model (0.032) and being limited by the
geographic extent of the dataset, this finding corroborates anecdotal evidence of potential risk factors
geographic extent of the dataset, this finding corroborates anecdotal evidence of potential risk factors
for NiV spillover. Future modeling efforts would benefit from the inclusion of monoculture data for
Bangladesh and Eastern India. With increases in international trade and commerce, the possibility
for NiV pandemics in European, African, Eurasian, and East Asian economies is not out of the
question. Biological interactions accelerating viral amplification include: (1) ecological changes
related to economic development, land cover change, animal husbandry, climate change; (2)Trop. Med. Infect. Dis. 2018, 3, 57 16 of 23
for NiV spillover. Future modeling efforts would benefit from the inclusion of monoculture data for
Bangladesh and Eastern India. With increases in international trade and commerce, the possibility
for NiV pandemics in European, African, Eurasian, and East Asian economies is not out of the
question. Biological interactions accelerating viral amplification include: (1) ecological changes related
to economic development, land cover change, animal husbandry, climate change; (2) overpopulation;
(3) international trade, commerce, and travel; (4) technological advancements in food processing;
(5) microbe evolution; and (6) an overall decline in public health infrastructure [7,26,132]. Lederberg,
Hamburg, and Smolinski [130] further stated that human development and large-scale social change
are intimately associated with infectious diseases, and there is a need for research focused on ecological
and social factors affecting disease emergence [130].
This study has several limitations and inherent challenges due to the multiple stages of analysis.
The first is related to our choice of model variables, specifically the density of livestock. The initial
outbreak in Malaysia was associated with the presence of pigs serving as an intermediate reservoir for
the virus; however, Bangladesh is a majority Muslim country with a very low pig population density.
This difference in livestock comparisons between nations explains the (0.085) variable importance
of pigs in this study, due to the majority of human cases being documented in Bangladesh. Second,
we are confident that the reported number of NiV human cases has been underreported throughout
the study area. There are two reasons for this; one is that the available data on NiV in Bangladesh is
biased towards those infections acquired during outbreaks only. The second possible explanation for
underreported cases is that meningoencephalitis is a common cause of hospitalization in Bangladesh,
it is plausible that NiV infection has been overlooked by medical professionals [33]. Raising awareness
of the dangers of drinking raw date palm sap is an approach that may reduce the risk of zoonotic
transmission. However, this may not be possible especially in rural areas. Third, ENMeval and
BIOMOD2, as with any study that incorporates species distribution modeling (SDM), have inherent
limitations. ENMeval features extended computation times due to the hundreds of replicate runs
performed, a process intimately linked to the number of occurrence points and environmental
variables in each analysis. Model evaluation methods like the area under the curve AUC (ROC)
statistic is considered a relative standard of the geographic dissemination for a given study area
and will discriminate occurrence from background localities. Background locations are treated as
pseudo-absences for the evaluation and not the model fitting stage. The AUC has been criticized
because it does reveal goodness-of-fit to provide information about the spatial distribution of model
errors [133]. We recommend that the models presented here be interpreted with caution because
they do not take into consideration the potential interaction between Pteropus bats and humans.
We admit that even in geographies designated as high risk, it is difficult to quantify and predict with
certainty zoonotic transmission. It must be emphasized that the presented maps do not enable the
assessment of secondary transmission risk in human populations. In light of the reported results,
the eco-epidemiology and ecology of NiV needs to be further explored.
5. Conclusions
Despite the caveats and limitations discussed above, the presented maps and associated
results provide the best description of the geography of Nipah virus (NiV). This study offers an
in-depth geographic and environmental analysis of Nipah virus (NiV) in South and Southeast Asia.
The results of this analysis revealed that the emergence of NiV is complex and is interconnected
with a plethora of cultural, geographic, ecological, and economic factors that facilitated its initial
appearance and continued persistence. These complex interactions will be better understood through
the continued development of interdisciplinary research collaboration between ecologists, medical
doctors, veterinarians, epidemiologists, and geographers. Risk maps incorporating geospatial datasets
are a valuable tool for the design of risk-based surveillance programs at multiple scales of analysis.
Several key policy implications can be inferred from this study. First, the presented risk maps should
significantly improve geographically targeted intervention strategies for policymakers attempting toTrop. Med. Infect. Dis. 2018, 3, 57 17 of 23
maximize monetary resources and epidemic preparedness. Second, the presented maps can serve
as an aid for our continued understanding of NiV host-virus ecology and the environmental spatial
heterogeneity of disease transmission risk. Third, beyond the scope of public health entities at the
local and national level, governments in geographic areas of high risk can utilize these maps to
warn prospective economic stakeholders, local administrative officials, and travelers of the potential
dangers associated with NiV. Recently, for the first time in India, NiV has been reported in Mangalore
(Karnataka), Kozhikode and Malappuram districts (Kerala). According to local health officials,
ten people who were exposed to NiV have died, and another three dozen people have been quarantined
since the outbreak began on 21 May [134,135]. These new outbreak locations, which sit firmly in the
high-risk portion of south India, have been included in the Supplementary Materials (S1) portion of
this study.
Supplementary Materials: The following are available online at http://www.mdpi.com/2414-6366/3/2/57/s1.
Map S1: Nipah virus disease transmission risk in Bangladesh and India with updated human case locations
from May 2018. Map S2: Nipah virus disease transmission risk in Southeast Asia. Map S3: Nipah virus disease
transmission risk in Indonesia.
Author Contributions: M.A.D. and N.M. conceived and designed the experiments; M.A.D. and N.M. performed
the experiments; M.A.D. and N.M. analyzed the data; M.A.D. created the maps; M.A.D. wrote the paper; and
N.M. edited the paper.
Acknowledgments: No external funding sources.
Conflicts of Interest: The authors declare no conflict of interest.
References
1. Woolhouse, M.E.J.; Gowtage-Sequeria, S. Host range and emerging and reemerging pathogens. Emerg. Infect. Dis.
2005, 11, 1842–1847. [CrossRef] [PubMed]
2. Murray, K.; Rogers, R.; Selvey, L.; Selleck, P.; Hyatt, A.; Gould, A.; Gleeson, L.; Hooper, P.; Westbury, H.
A novel morbillivirus pneumonia of horses and its transmission to humans. Emerg. Infect. Dis. 1995, 1, 31–33.
[CrossRef] [PubMed]
3. Wang, L.-F.F.; Michalski, W.P.; Yu, M.; Pritchard, L.I.; Crameri, G.; Shiell, B.; Eaton, B.T. A novel P/V/C gene
in a new member of the Paramyxoviridae family, which causes lethal infection in humans, horses, and other
animals. J. Virol. 1998, 72, 1482–1490. [PubMed]
4. Montgomery, J.M.; Hossain, M.J.; Gurley, E.; Carroll, D.S.; Croisier, A.; Bertherat, E.; Asgari, N.; Formenty, P.;
Keeler, N.; Comer, J.; et al. Risk factors for Nipah virus encephalitis in Bangladesh. Emerg. Infect. Dis. 2008,
14, 1526–1532. [CrossRef] [PubMed]
5. Simons, R.R.L.; Gale, P.; Horigan, V.; Snary, E.L.; Breed, A.C. Potential for introduction of bat-borne zoonotic
viruses into the EU: A review. Viruses 2014, 6, 2084–2121. [CrossRef] [PubMed]
6. Field, H.; Young, P.; Yob, J.M.; Mills, J.; Hall, L.; Mackenzie, J. The natural history of Hendra and Nipah
viruses. Microbes Infect. 2001, 3, 307–314. [CrossRef]
7. Daszak, P.; Cunningham, A.A.; Hyatt, A.D. Emerging infectious diseases of wildlife—threats to biodiversity
and human health. Science 2000, 287, 443–449. [CrossRef] [PubMed]
8. Wacharapluesadee, S.; Samseeneam, P.; Phermpool, M.; Kaewpom, T.; Rodpan, A.; Maneeorn, P.;
Srongmongkol, P.; Kanchanasaka, B.; Hemachudha, T. Molecular characterization of Nipah virus from
Pteropus hypomelanus in southern Thailand. Virol. J. 2016, 13, 53. [CrossRef] [PubMed]
9. Mohd Nor, M.N.; Gan, C.H.; Ong, B.L. Nipah virus infection of pigs in Peninsular Malaysia. Rev. Sci. Tech.
2000, 19, 160–165. [CrossRef] [PubMed]
10. Chua, K.B.; Bellini, W.J.; Rota, P.A.; Harcourt, B.H.; Tamim, A.; Lam, S.K.; Ksiazek, T.G.; Rollin, P.E.; Zaki, S.R.;
Shieh, W.-J.; et al. Nipah virus: A recently emergent deadly paramyxovirus. Science 2000, 288, 1432–1435.
[CrossRef] [PubMed]
11. Chua, K.B. Nipah virus outbreak in Malaysia. J. Clin. Virol. 2003, 26, 265–275. [CrossRef]You can also read