Opportunity, Risk, and Public Acceptability: The Question of Shale Gas Exploitation in Québec - Center for ...
←
→
Page content transcription
If your browser does not render page correctly, please read the page content below
Issues in
                      Energy and Environmental Policy                                                       Number 16 | October 2014

                           Opportunity, Risk, and Public Acceptability:
                         The Question of Shale Gas Exploitation in Québec
Executive Summary
The Canadian province of Québec has the largest reserves of shale gas in Eastern Canada, but Québeckers are in the midst of a heated debate
over the desirability of exploiting this resource. At issue is the controversial technique of hydraulic fracturing, or “fracking.” The provincial
government has decided to proceed cautiously. In 2011, Québec instituted a temporary moratorium, still in effect, on shale gas development in
order to conduct consultations with experts and members of the public that has continued to present day. Recently, the government released
the results of the experts’ report, the Strategic Environmental Evaluation. This paper highlights the report’s key findings about the potential
economic benefits, environmental risks, and public acceptability of shale gas development. Québec’s balanced approach to the complex,
technical issue of shale gas development represents a deliberative approach to governance that emphasizes extensive public engagement.

Introduction
Since the 1990s, natural gas from shale has risen to the fore of the public debate over energy production. At the core of the discussion lie
the main techniques of the exploitation of natural gas from shale (“shale gas”): hydraulic fracturing (“fracking”) and horizontal drilling.
Shale gas extraction is efficient and economically viable only when these methods are used in tandem, but the practice has attracted
attention for the uncertainty surrounding the long-term consequences of fracking on human health and environmental quality.

As a result of the concern over fracking, many governments around the world are weighing the costs and benefits of allowing shale
gas development in their jurisdictions. The Canadian province of Québec has taken this process particularly seriously, banning shale
gas development until the completion of a public consultation on the acceptability of the prospective economic and environmental
consequences of fracking. This stands in contrast to the governments of Alberta and the American state of Pennsylvania, which are
evaluating the impacts of fracking with drilling already well underway, having encouraged development since the mid-2000s.

This paper examines the Canadian province of Québec and the factors in its cost/benefit analysis of shale gas development. It first explores
Québec’s culture, history, geophysical situation, and scientific and public engagement on the issue of shale gas to provide context for a discussion
of Québec’s evaluation of fracking as a policy issue. The report then turns toward an investigation of the potential economic benefits and
environmental risks of shale gas development, including both the substantial natural risks and technological risks related to fracking. Finally,
it explores how public opinion on the benefits and risks of shale gas development has evolved over recent years among Québeckers, arriving
at a near-consensus that these risks may outweigh the relatively moderate economic gains that may be realized from shale gas exploration in
Québec. While Québec’s conclusion regarding the desirability of shale gas development will be the product of a unique combination of Québec’s
history, economy, and environment, this experience provides a valuable framework for other jurisdictions considering the impact of fracking.

  Author
  Michael Lerner
  Research Associate
  Environmental Law Institute
  lerner@eli.org
The Center for Local, State, and Urban Policy

Background                                                                                         Figure 1
                                                                                  Comparison of Quebec and U.S. Energy Mixes.
Québec, the “Rest of Canada,” and the Environment
                                                                                  Québec Energy Consumption by Form (2010)
To unfamiliar observers, one of the most striking things
about Québec is the degree to which its history infiltrates                     Biomass Coal-1%
and influences all aspects of Québec society. Even issues as                           7%
practical as energy policy are often understood in Québec as                Natural                                             Hydroelectricity
just one episode in a long, contentious, and often emotional                 Gas                                                    95.8%

series of cultural skirmishes running from its colonial era                  38%
                                                                                                                                Other Renewable
to today. At the center of this struggle lies a fundamental                                   Electricity                             1.5%
                                                                                                 41%
skepticism about the legitimacy of “Canada” as a political                                                                          Nuclear
unit. For many Québeckers, the concept of “Canada” is                    Conventional Gas                                            2.0%
                                                                              38%                                                  Petroleum
fundamentally flawed; yellowed, cracked glue binding two
                                                                                                                                   Products
fundamentally different peoples: the Francophones of Québec                                                                          0.6%
and the Anglophones of the “Rest of Canada,” or ROC.                                                                              Natural Gas*
                                                                                                                                     0.1%

Despite federal provisions affording the Québec government                                                   *Shale Gas included in Natural Gas
greater powers than other provincial governments, the
question of autonomy continues to act as the gravitational                            U.S. Energy Consumption by Form (2010)
center of Québec politics. The province voted in 1980 and
                                                                               Biomass      Coal-2%
1995 on ballot propositions proposing negotiations leading                                                                      Hydroelectricity
                                                                                       4%
to Québec’s sovereignty from the ROC, but these were                                                                                 6%
rejected by margins of 19.22% and 1.16%, respectively.1                      Natural                                           Other Renewable
                                                                              Gas                                                     4%
The Parti Québecois, which led Québec’s government                            17%
from September 2012 to April 2014, favors a third vote on                                                                           Nuclear
                                                                                              Electricity                            20%
sovereignty in the near future.2                                                                 40%
                                                                                                                              Petroleum Products
                                                                         Conventional Gas                                             1%
In April 2014, however, the Parti Québécois lost heavily to                   36%
                                                                                                                                 Natural Gas*
the Parti libéral du Québec. The Liberals are a centrist party                                                                       24%
that supports a large degree of autonomy for Québec, but                                                                              Coal
rejects the idea of a sovereign Québec. While a third ballot                                                                          45%

proposition will not occur under the current government,                                                       *Shale Gas included in Natural Gas
Québec’s relations with the ROC will continue to be a                  Québec and the U.S. have similar patterns of total energy consumption,
constant source of tension.                                            but 97.3% of Québec’s electricity is produced renewably while the U.S.
                                                                       only produces about 10% of electricity from renewable sources. In
                                                                       contrast, coal is not used to produce electricity in Québec, but accounts
Québec’s history of policy-making with an eye toward                   for 45% of U.S. electricity production. Data Sources: Ministère des
autonomy has at times dovetailed with its strong, proactive            Ressources naturelles. (2014). Quebec City, Québec: Ministère des
                                                                       Ressources naturelles. Retrieved from http://www.mern.gouv.qc.ca;
engagement with the environmental movement. Starting in the            U.S. Energy Information Administration. (2014). Washington, DC: U.S.
1940s, the province embarked on a series of large investments          EIA. Retrieved from http://www.eia.gov/
in hydropower. The underlying purpose of these projects was to take
advantage of the province’s formidable water resources to create an independent electricity grid, a necessity for an independent Québec.

An inadvertent, but happy consequence of this effort is that Québec is among the cleanest energy economies in the world today.
Hydropower provides over 95% of Québec’s electricity, leaving it more or less independent of hydrocarbon imports.3 By way of
comparison, the United States obtains approximately 10% of electricity from renewable energy sources, and petroleum and natural gas
supply 25% of its electricity4. These differences are illustrated in Figure 1. Other Canadian provinces have also made use of their water
resources, with Newfoundland and Labrador, Manitoba, and British Columbia each producing over 80% of their electricity through
hydroelectric power.5

2                                                                                                                   www.closup.umich.edu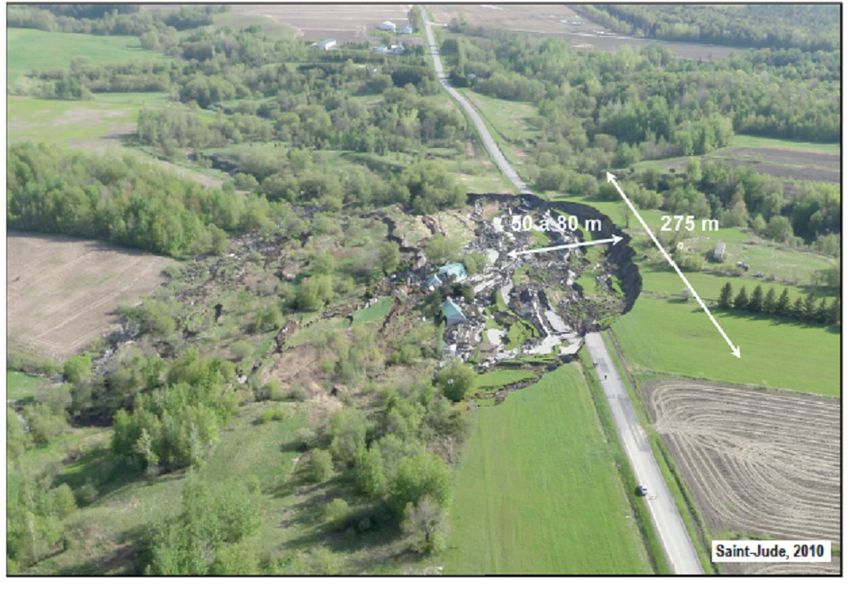
Opportunity, Risk, and Public Acceptability: The Question of Shale Gas Exploitation in Québec

Another example of Québec’s efforts to differentiate itself from the ROC aligning with environmental priorities is its cap-and-trade
market for carbon emissions, the only one in Canada. Since January 2013, Québec has forced large carbon emitters—those producing
25,000 metric tons of CO2 or greater per year—to buy emissions allowances at auction. In addition,6 Québec joined the Western
Climate Initiative (WCI) in 2008, a coalition of American states and Canadian provinces with the aim of reducing greenhouse gas
emissions.7 Though the WCI’s once substantial membership has suffered through the economic downturn and encountered political
backlash in some states, Québec has remained committed to reducing its environmental footprint through its carbon market.

The Utica Shale

Since 2010, when the discovery of gas reserves in Québec sparked interest among investors and drilling companies, the political debate
in Québec has come upon a new issue: shale gas.8 Though Québeckers have drilled for conventional oil and gas wells since the late
19th century, the discovery of substantial reserves of shale gas in the southern half of the St. Lawrence Lowlands, an area spanning
approximately 2,900 square miles, has given new impetus to the question of development.9 As shown in Figure 2, the most promising
geological formation in the area of interest within the St. Lawrence Lowlands is the Utica Shale, a thin layer of rock topped by a mile-
thick layer of quasi-impermeable rock.10 Exploratory wells drilled in the Utica suggest it contains a total volume of 155 trillion cubic
feet of natural gas, of which approximately 31 trillion cubic feet is technically recoverable.11 This ranks the Utica as the most significant
shale gas deposit in Eastern Canada, and Canada’s fifth largest overall.

                                                                      Figure 2
                                                    Area of Interest for Shale Gas Extraction.

          The area outlined represents the area of potential shale gas exploitation in the St. Lawrence Lowlands, Québec. The Utica shale
  becomes progressively shallower to the north, with the northern edge of the area of interest representing the point where the Utica formation
    reaches the surface. The greatest reserves of shale gas are located on the southern bank of the St. Lawrence River, which runs southwest-
        northeast through the area. Source: Google Earth. (Build 7.1.2.2041). [Software]. Mountain View, CA: Google Inc. (2014). Available at
        http://earth.google.com; Semantic Science Integrated Ontology. [Software]. Mountain View, CA: Google, Inc. (2014). Retrieved from
      http://semanticscience.org; National Oceanic and Atmospheric Administration. (2014). Washington, DC: U.S. Department of Commerce.
   Retrieved from http://noaa.gov/; U.S. Navy. (2014). Washington, DC: U.S. Department of Defense. Retrieved from http://navy.mil; U.S. National
     Geospatial-Intelligence Agency. (2014). Washington, DC: U.S. Department of Defense. Retrieved from http://nga.mil; General Bathymetric
  Chart of the Oceans. (2014). Liverpool, UK: British Oceanographic Data Centre. Retrieved from htt0p://gebco.net; Image: U.S. Geological Survey
       Landsat. (Build GEBCO_08). [Software]. Washington, DC: U.S. Department of the Interior. (2014). Available at http://landsat.usgs.gov/

                                                                                                                                                   3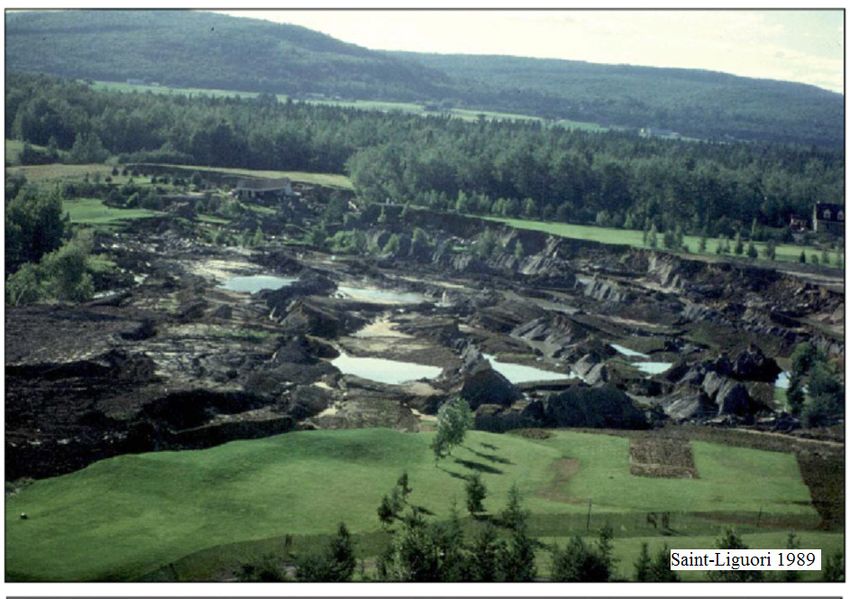
The Center for Local, State, and Urban Policy
Shale gas is a “tight” gas, meaning the reservoir rock holding the gas is fine-grained, rendering the gas difficult to extract. However,
there are two factors that have made the exploitation of the Utica Shale economically attractive. The first is the improved efficiency of
exploiting shale gas and other “tight” gases through the combination of horizontal drilling and fracking (see Figure 3). Traditional (or
“conventional”) wells only drill vertically, limiting the well’s production to the immediate vicinity. Perfected only recently, horizontal
drilling increases production per well by creating multiple well shafts extending in different directions from one wellhead.12 For
example, a typical six-well drilling platform using horizontal drilling techniques would have 36 individual well shafts instead of one
well shaft per well. Such a set-up would be capable of draining nearly 4 km2 of rock from just one drilling platform.13 This leads to
substantial efficiency gains, and thus profit margins, over traditional techniques.
The other technological development is the spread of sophisticated fracking techniques. Fracking involves injecting large volumes of
“frack fluid,” a mix of water, sand, and chemicals, into a well at high pressure to crack open the rock and free gas deposits. Though the
North American oil and gas industry has used this technique for the past few decades, the effectiveness of fracking has dramatically
increased recently due to changes in the exact chemical composition of the “frack fluid” mix and its use in combination with
horizontal drilling.14 Due to the low porosity of shale, the exploitation of shale gas and other “tight” gas deposits is only economically
viable through the combination of these two techniques.
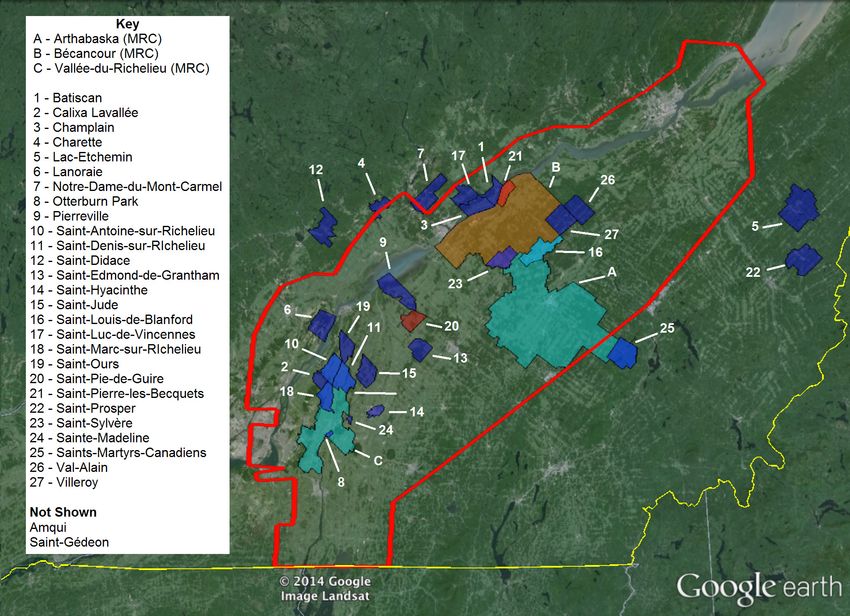
Figure 3
Schematic of a Well using horizontal drilling and fracking.
The well shaft descends vertically until it reaches the rock layer containing hydrocarbons. The shaft then turns
horizontally and the well operator performs successive hydro-fractures to increase the permeability of the hydrocarbon-
laden rock. Figure adapted from Government of Québec. (2011, February). Sustainable development of the shale gas
industry in Québec: Inquiry and public hearing [BAPE] report 273, p. 31. Québec City: Minister of Natural Resources.
4 www.closup.umich.edu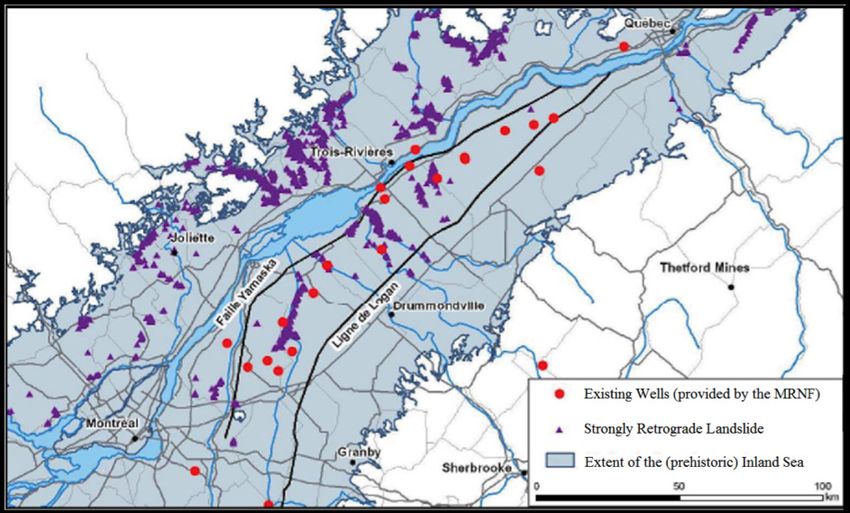
Opportunity, Risk, and Public Acceptability: The Question of Shale Gas Exploitation in Québec

Given these factors, the physical characteristics of the Utica Shale make exploitation particularly cost-effective. The Utica is composed
of relatively large, porous grains compared to other shales.15 This means it is both easier to fracture the Utica and each “frack” frees up
more gas than in other geological deposits. The surrounding rock formations are more or less impermeable, meaning the gas formed
in the Utica is a concentrated source of natural gas with low rates of migration into neighboring rocks.16

Despite these advantages, exploiting the Utica’s natural gas is not cheap. Roughly 15 individual fracks are required to create a well of
average yield, three billion cubic feet over a lifetime of 25 years.17 Each frack requires about 400,000 gallons of water, totaling to just
over 5.2 million gallons of water per well.18 Typically, these millions of gallons of water must be brought in by truck, causing the cost of
a fracked exploratory well, created to discover if an area contains accessible hydrocarbon reserves, to reach approximately $20 million,
double that of a conventional exploratory well.a This cost difference endures to a smaller degree during the exploitation phase.19 While
only a handful of shale gas wells have been drilled in Québec up to now (see Figure 4), hundreds, perhaps thousands more wells stand
to be drilled and fracked if Québec allows development of the Utica Shale to proceed.20

                                                                                                    Figure 4
                                                                   Oil and Gas Wells Drilled in the St. Lawrence Lowlands, QC (1980-2012).

                                                              10
                        Number of Oil and Gas Wells Drilled

                                                              8

                                                              6

                                                              4

                                                              2

                                                              0
                                                                   1980
                                                                   1981
                                                                   1982
                                                                   1983
                                                                   1984
                                                                   1985
                                                                   1986
                                                                   1987
                                                                   1988
                                                                   1989
                                                                   1990
                                                                   1991
                                                                   1992
                                                                   1993
                                                                   1994
                                                                   1995
                                                                   1996
                                                                   1997
                                                                   1998
                                                                   1999
                                                                   2000
                                                                   2001
                                                                   2002
                                                                   2003
                                                                   2004
                                                                   2005
                                                                   2006
                                                                   2007
                                                                   2008
                                                                   2009
                                                                   2010
                                                                   2011
                                                                   2012
                                                                   2013
           Since 1980, the number of wells drilled in the St. Lawrence Lowands of Québec has never exceeded 10 wells per year (solid black
        lines). The moratorium on new well drilling came into effect in 2011 (grey dashed line). Source: Système d’information géoscientifique
              pétrolier et gazier. (2014). Québec City: Ministère des Ressources naturelles. Retrieved from http://sigpeg.mrn.gouv.qc.ca/

C. Québec’s Evaluation of Shale Gas and Its Controversy

Following the discovery of Québec’s accessible hydrocarbon reserves in 2010, the Québec government has reacted cautiously to
the sudden surge of interest in exploiting shale gas in Québec, seeking out comments and advice from both scientists and the lay
public. The provincial government’s first step was to request a public consultation on the sustainable development of shale gas
under the auspices of the Bureau of Public Hearings on the Environment (BAPE).b This organization is among the most widely
known and respected governmental organizations in Québec, with 65% of Québeckers having heard of the BAPE and 93% of those
respondents judging the BAPE to be credible.21 The BAPE, charged with informing and consulting the public on projects liable to
have significant impacts on the environment, concluded in early 2011 that it was unable to fully complete its consultation because,
“For certain fundamental [scientific] questions, the answers are either incomplete or nonexistent.”22 The BAPE’s report asked for
more time and information.

a All monetary amounts in this paper are in Canadian dollars.

b All translations of titles and quotes in this report are the author’s translations.

                                                                                                                                                 5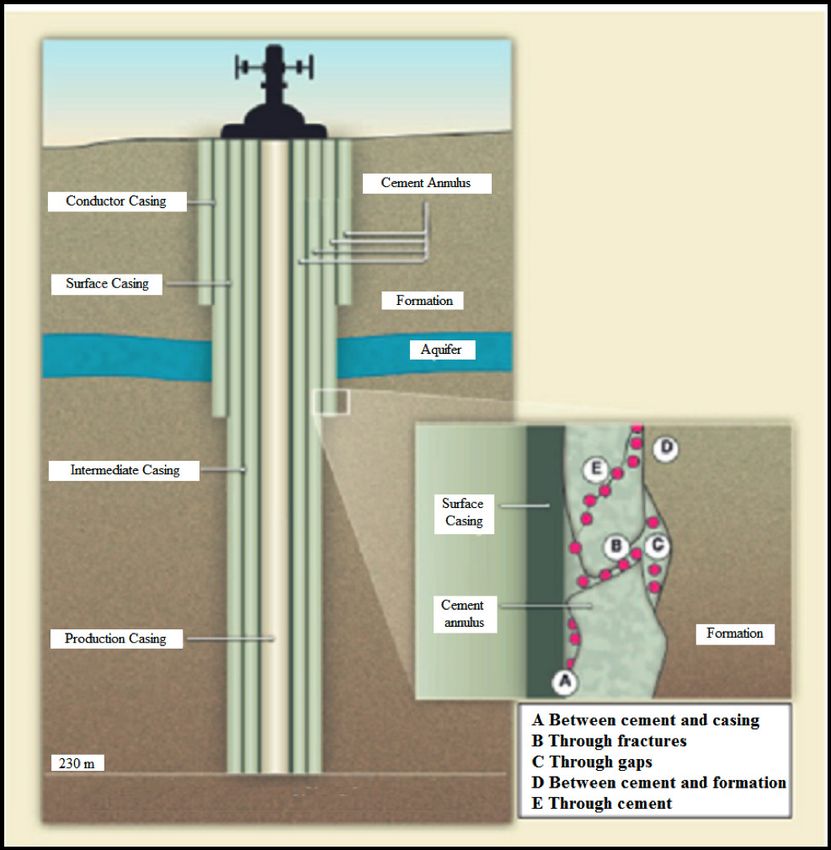
The Center for Local, State, and Urban Policy

The Québec government responded to the BAPE’s recommendation, imposing a moratorium on exploratory drilling in the St.
Lawrence Lowlands in June 2011. The ban was contingent upon the completion of an environmental impact study, called a Strategic
Environmental Evaluation (EES), in order to provide the BAPE with the information necessary to inform and consult the public.23 This
temporary measure, in place to the present day, halted all new oil and gas activities, though the handful of wells in production at that
time were allowed to continue to operate.

The EES is similar to the United States’ federal and state Environmental Impact Statements, but with a more holistic emphasis. In
addition to evaluating the effect of hydraulic fracturing on the environment, the EES has commissioned 78 expert reports over three
years evaluating its influence on the economy, human health, and other quality of life concerns. The EES is purely informational,
containing no concrete recommendations. Instead, its purpose is to empower the BAPE to perform a more comprehensive public
consultation.24 The EES submitted its final report to the Québec government in December 2013 and the BAPE has begun a second
public consultation scheduled to conclude in November 2014, in response to which the National Assembly is due to produce shale
gas legislation.

There are two controversial elements in this process. The first is the question of whether the outcome of this process has been
predetermined. Québec’s National Assembly already adopted a resolution in favor of a ban on gas and oil extraction in Québec before
the EES was even submitted.25 As in the United States, this resolution was an expression of the official will of the legislature, without
the binding force of law. The Parti Québecois pushed for the passage of a legally enforceable ban, but this was defeated following
Liberal protests that such a bill would moot the years-long evaluation process. Now that the Liberals have taken power in Québec, it
seems unlikely that the evaluation process will be short-circuited.

Nevertheless, the Liberals were part of the unanimous approval of the resolution supporting the principle of a ban.26 In addition, the
National Assembly extended the expiry date of the moratorium on drilling in the St. Lawrence Lowlands to 2018, though the BAPE’s
report is due at the end of 2014.27 It is unclear why the moratorium lasts well beyond the deadline for the BAPE report. Taken together,
these signs suggest that many politicians have already made up their minds. As Martine Ouellet announced in September 2012, less
than 24 hours after taking office as Minister of Natural Resources, the Parti Québecois’ “position is very clear on shale gas: a complete
moratorium on exploration and exploitation.”28

The second controversial element of this process is that the moratorium did not provide compensation for the lost profits of companies
that bought gas exploitation permits from the Québec government.c The legal doctrine for compensating the loss of the right to use
land, called “regulatory takings,” is extremely narrow in Canada. Canadian law explicitly excludes interests in land from individual
property rights and Canadian courts have consistently required the loss to be permanent to qualify for compensation.29 The temporary
nature of the ban makes it unlikely Canadian companies could obtain compensation through Canadian courts.

Companies in the United States and Mexico, on the other hand, may have a better chance of obtaining compensation by suing
Québec through the North American Free Trade Agreement (NAFTA), which includes strong language requiring compensation for
expropriating the property of foreign investors.30 An oil and gas company incorporated in Delaware, Lone Pine Resources Inc., filed
suit through NAFTA’s arbitration system in late 2012, arguing the Québec government expropriated the company’s permits without
compensation despite their multi-million dollar investment.31 However, the case’s future looks bleak for two reasons. The first is
that, like Canadian courts, NAFTA arbitration boards also require a permanent transfer of land use rights from the landowner to
the government for compensation.32 Second, the ability of Lone Pine Resources to pursue the lawsuit itself is uncertain following the
company’s bankruptcy in September 2013.33

c In Canada, surface rights are severed from mineral rights. Private citizens can own the surface rights to land, but the government owns all mineral rights. Private companies can buy leases from the
  government to extract underground resources.

6                                                                                                                                                                  www.closup.umich.edu
Opportunity, Risk, and Public Acceptability: The Question of Shale Gas Exploitation in Québec

Approaches to Fracking Elsewhere

In Other Canadian Provinces

While Québec currently produces very little natural gas, Canada as a whole is the fourth largest producer of natural gas in the world.
As shale gas makes up an increasingly large share of Canada’s natural gas production, Canadians in other provinces have weighed
the cost of accessing this resource and reached varied conclusions.34 In Western Canada, fracking has become an accepted practice.35
Alberta, the epicenter of the Canadian fracking industry, gives primacy to industry development but allows municipal governments
to regulate the industry. British Columbia created the Oil and Gas Commission to balance industry and local interests, with the
possibility of appeal to the Surface Rights Board, a conflict resolution body.

While Canada’s western provinces have long been accustomed to living with the excesses and benefits of the oil and gas industry,
the industry has historically left a light footprint in the east, specifically in Québec and the Maritime Provinces of Nova Scotia, New
Brunswick, Prince Edward Island, and Newfoundland and Labrador. Unsurprisingly, it is in eastern Canada that proposals for shale
gas development sparked the greatest furor.

Nova Scotia and Newfoundland and Labrador have both banned fracking to the widespread approval of their residents. New
Brunswick gives municipalities complete control over oil and gas development, but limits this authority to urbanized areas. Partly as
a result of this distinction and partly due to a controversial court decision allowing companies to drill in less populated areas, rural
residents of New Brunswick took to the streets to protest the arrival of the shale gas industry. In one New Brunswicker indigenous
community, the Elsipogtog First Nation’s protests turned violent, with police cars burned and dozens arrested.36

Around the World

Governments all over the world are increasingly skeptical of fracking. France and Bulgaria have explicitly banned fracking and there is
a de facto ban in Germany. The anti-fracking movement has also gained momentum in the United States, the world’s leading producer
of shale gas. Vermont is the only U.S. state to explicitly ban fracking, though New York has imposed a de facto ban on fracking that,
similar to Québec, depends on the publication of a long-awaited evaluation of the impacts of shale gas development.37 While some
states have not followed this trend, such as Pennsylvania, representatives in 19 U.S. states proposed at least 119 bills during the 2012
legislative session alone.38

There is an important difference between the approaches to fracking elsewhere and the situation in Québec, however. Since most of the
jurisdictions that have acted against fracking contain only marginal shale gas reserves, government officials often have relatively little
to lose by banning the practice. Québec, on the other hand, has substantial reserves of shale gas. The next two sections will consider
the economic benefits and the environmental risks of developing these shale gas reserves, the largest in Eastern Canada.

The Benefits of Shale Gas Development
Why develop and exploit shale gas in Québec? One argument often made in the United States in favor of shale gas is its positive
environmental impact. Specifically, when burned to produce electricity, natural gas releases only half the CO2 and one-third the
nitrogen oxide compared to coal.39 Moreover, shorter pipelines from well to furnace would lead to lower greenhouse gas emissions
resulting from pipeline leaks relative to shipping natural gas from Western Canada.40 However, all of these benefits are based on an
erroneous comparison. Québec does not use coal to produce electricity, but hydropower. When compared to hydropower, natural gas
is clearly not the environmentally-friendly option. Therefore, the only reason to develop and exploit the shale gas contained in the
Utica Shale is for economic benefit.d

The EES explored three clear economic benefits that stand to be gained by developing shale gas in Québec. The first is reduced
prices on natural gas. In 2010, the last data year available, Québec spent approximately $1.815 billion dollars, or 5.8% of total energy
expenditures, importing 195 billion cubic feet of natural gas from Western Canada. While this gas is inexpensive relative to crude

d Although the EES did not evaluate the profit potential for private actors, economic benefit would derive from natural gas exports, particularly to nearby provinces dependent upon natural gas for energy,
  such as Nova Scotia, New Brunswick, and Ontario.

                                                                                                                                                                                                         7
The Center for Local, State, and Urban Policy

oil, which sells at roughly six times the price, Québec has to pay the extra cost of transporting the fuel roughly 2,000 miles across the
greater part of Canada. As a result, the price of natural gas in Québec is more than twice the price in Alberta, where most Canadian
natural gas is produced.41

By producing natural gas, Québec and its businesses would likely save hundreds of millions of dollars even without selling any gas
through exports. If prices fell to those seen in Alberta, the government’s savings alone would equal $900 million per year. Since
Québec both has the largest shale gas reserves in Eastern Canada and is one of the few provinces not to ban its exploitation, Québec’s
neighbors would also hold considerable demand for locally produced, and thus competitively priced, natural gas.

A second economic advantage from the production of shale gas is job creation. Well drilling, preparation, and operation are labor-
intensive, with the potential to create thousands of new, well-paid jobs. Estimates of just how many jobs this might entail vary greatly.
One report found that a $1.5 billion investment by the shale gas industry over 10 years would support approximately 11,000 workers.42
This works out to just over $135,000 per job. Another report found a $7 billion investment over 25 years would support approximately
200,000 jobs, an average of $35,000 per job.43 What might explain this discrepancy is the former estimate does not consider the three
to four low-pay jobs that are indirectly created for every high-pay job directly supported by the industry.44

As there are only 330,000 unemployed people in Québec, these new, well-paying jobs will likely attract job-seekers from all over
Canada.45 Unfortunately, this migration can come at the cost of straining the local community. As people flock to the St. Lawrence
Lowlands, prices and rents will be vulnerable to large, volatile increases. Individuals on fixed incomes may be squeezed and even
forced to leave the area in order to survive.46 Political tensions may also rise with the arrival of large numbers of non-Francophone
workers.47 It is worth noting that the Québec government’s own analysis of the impacts of shale gas gives these concerns greater weight
than the industry’s job-creation potential.

Finally, shale gas development could lead to a small financial windfall for the provincial government in the form of licensing fees
and royalties. A report commissioned by the EES examined three potential development scenarios and their effect on government
revenues (see Figure 5). The first envisions small-scale development, with only 1000 wells created over 10 years (starting in 2016).
Québec’s revenues from industry-related fees and royalties would sharply spike over the seven years between 2019 and 2025, reaching
a maximum of approximately $800 million in 2021 and 2022 respectively. By way of comparison, Québec’s revenues from forests,
mining, and hydropower equaled approximately $2.2 billion in 2013-2014. Cumulatively, provincial revenues from industry-related
fees and royalties would equal roughly $2.5 billion over 10 years, with an additional $500 million over the next 20 years.

In the medium-scale scenario, 3350 wells are drilled over 10 years. Québec would see annual revenues rise to a maximum of $2.7
billion in 2024 within a period of significant collections ranging from 2022 to 2028. Overall, Québec would gain a total of $10 billion
in revenue by 2028, with an additional $3 billion between 2028 and 2050.

Finally, large-scale development of the Utica Shale would entail the construction of 9,000 wells. Revenues would peak in 2027 at nearly
$5 billion and there would be an eight-year period of revenues greater than $1 billion between 2024 and 2031. Cumulatively, Québec
would receive $25 billion by 2036 and an additional $5 billion from 2036-2066.

While these sums appear large, they should be understood in the context of the government’s other revenues. Even if annual revenues
from fees and royalties were to reach $5 billion, the peak revenue from the most intensive development scenario, this would equal just
7% of Québec’s 2013-2014 budget.48 Shale gas revenues would make an even smaller contribution to Québec’s finances when taking
into account the anticipated expansion of Québec’s budget between today and 2027, when this peak would occur.

Overall, these estimations suggest that, while shale gas development would lead to lower gas prices, more jobs, and a boost in Québec’s
revenues, these benefits are not overwhelming and may even destabilize local communities. Given these advantages, limited though
they may be, the question of shale gas development now turns to its prospective environmental impacts.

8                                                                                                              www.closup.umich.edu
Opportunity, Risk, and Public Acceptability: The Question of Shale Gas Exploitation in Québec
Figure 5
Graphs of Well Drilling and Provincial Revenues in Three Natural Gas Development Scenarios.
Annual Wells Annual Revenues
2000 5000 small-scale
Millions of Dollars (CAN)
small-scale
medium-scale
4000
1500 medium-scale
Number of Wells
large-scale
large-scale 3000
1000
2000
500
1000
0 0
2016
2018
2020
2022
2024
2026
2028
2030
2032
2034
2036
2038
2040
2042
2044
2046
2048
2050
2052
2054
2056
2058
2060
2062
2064
2066
2016
2017
2018
2019
2020
2021
2022
2023
2024
2025
2026
2027
2028
2029
2030
2031
2032
2033
2034
2035
2017
2019
2021
2023
2025
2027
2029
2031
2033
2035
2037
2039
2041
2043
2045
2047
2049
2051
2053
2055
2057
2059
2061
2063
2065
Cumulative Wells Cumulative Revenues
10000 30000 small-scale
small-scale
Millions of Dollars (CAN)
medium-scale 25000 medium-scale
8000
Number of Wells
large-scale 20000 large-scale
6000
15000
4000
10000
2000
5000
0 0
2016
2018
2020
2022
2024
2026
2028
2030
2032
2034
2036
2038
2040
2042
2044
2046
2048
2050
2052
2054
2056
2058
2060
2062
2064
2066
2016
2017
2018
2019
2020
2021
2022
2023
2024
2025
2026
2027
2028
2029
2030
2031
2032
2033
2034
2035
2036
2017
2019
2021
2023
2025
2027
2029
2031
2033
2057
2059
2061
2063
2065
Clockwise from bottom left: Cumulative number of wells drilled in the small-scale, medium-scale, and large-scale development
2035
2037
2039
2041
2043
2045
2047
2049
2051
2053
2055
scenarios. Number of wells drilled per year for each of the three scenarios. Amount of additional provincial revenue from fees and
royalties per year resulting from shale gas development for each development scenario. Cumulative amount of additional provincial
revenue per year for each of the three development scenarios. Source: Bureau of Public Hearings on the Environment. (2014,
April). L’ industrie du gaz de schiste dans les Basses-Terres du Saint Laurent: scénarios de développement [Strategic Environmental
Evaluation report], p. 23, 25, 27. Québec City: Ministère de Développement durable, Environnement, Faune et Parcs.
9The Center for Local, State, and Urban Policy
The Environmental Risks of Shale Gas Development
Shale gas is certainly present in the St. Lawrence Lowlands. But the risks of accessing and exploiting this resource are not negligible.
These risks come in two forms: natural risks and technological risks. Natural risks are inherent to any sort of development, gas
or otherwise, in the region. They are events that would happen without any direct human action, though humans may indirectly
influence their frequency or severity. Technological risks, on the other hand, are anthropogenic hazards directly related to the
techniques and practices of shale gas extraction. These are events that would never occur without human intervention. This section
explores each of these in turn.
Heightened Natural Risks
Even without direct human influence upon the terrain, the natural features of Québec introduce “considerable exploration and
completion risk” for natural gas extraction in Québec.49 These include the risks of land subsidence, increased frequency and intensity
of earthquakes, and the release of naturally present contaminants.
Land Subsidence
Perhaps the most serious of these risks is land subsidence. There are hundreds of landslides every year in Québec, 80% of which occur
in clay deposits, such those that exist in the St. Lawrence Lowlands.50 A very significant proportion of these landslides, some 40%,
are indirectly precipitated by human activity.51 As shown in Figure 6, wells are often drilled in areas that have experienced strongly
retrograde landslides, a highly destructive form of land subsidence (see Figure 8).
In some places, the mere presence of gas activities necessarily results in subterranean pressure shifts following the extraction or
migration of gas deposits, overloading of surface water basins, and the erosion of vulnerable slopes.52 These effects lead to landslides in
areas where the soil is extremely sensitive to vibration. As demonstrated in Figure 7, this is the case in the St. Lawrence Lowlands.
Figure 6
Map of strongly retrograde landslides in relation to existing gas well locations.
Many existing wells are in areas vulnerable to strongly retrograde landslides. Figure adapted from Transports Québec. (2014,
April). Glissements de terrain. Exploration et exploitation des gaz de schiste, p. 17. Québec City: Government of Québec.
10 www.closup.umich.eduOpportunity, Risk, and Public Acceptability: The Question of Shale Gas Exploitation in Québec
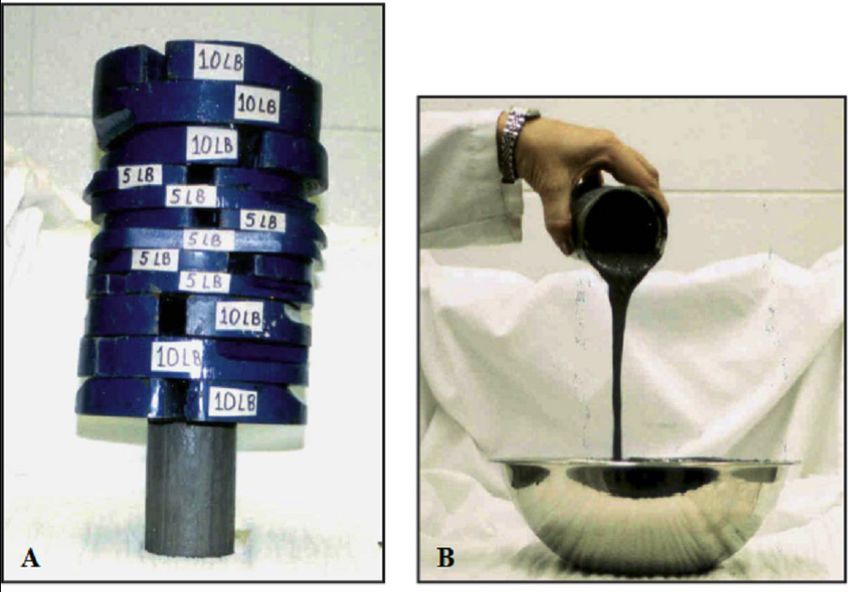
Figure 7
Photos demonstrating the sensitivity of the St. Lawrence Lowlands’ soil to vibration.
A = intact soil capable of holding 90 lbs without cracking. B = If vibrated, the soil becomes a low-viscosity mud.
From Transport Québec’s report Glissements de terrain. Exploration et exploitation des gaz de schiste, p. 14.
Figure 8
Photos of strongly retrograde landslides: Saint-Liguori (1989) and Saint-Jude (2010).
Note the size of the trees in the foreground of the Saint-Liguori photo for a sense of
scale. The green roof of a home destroyed on May 5 when it was buried under several
meters of mud is visible in the Saint-Jude photo. Pictures from Transports Québec’s
report Glissements de terrain. Exploraiton et exploitation des gaz de schiste, p. 13.
11The Center for Local, State, and Urban Policy While the risk of land subsidence is not unique to Québec, few shale plays in North America have a topography and climate comparable to that of the St. Lawrence Lowlands, a mix of steep inclines, substantial precipitation, and a harsh freeze-thaw cycle. This risk is particularly pernicious because it is difficult to generalize the conditions that lead to landslides. Québec’s current regulations attempt to do this, forbidding all construction within 100 meters of a vulnerable slope. Unfortunately, this distance proved to be insufficient when, on May 5, 2010, a family of four was killed when a crevasse one kilometer long and 500 meters wide opened in St. Jude, near St. Hyacinth (see Figure 8). The family was watching ice hockey in their basement when mud swept over the house, which was located in an area thought to beyond the landslide danger zone. The adults and children suffocated to death under several meters of mud.53 While this incident was unrelated to drilling, it stands to reason that a well would pose considerable risk to the environment under similar circumstances. Earthquakes A second, related risk is that of earthquakes. Earthquakes can either directly damage a well or induce damaging landslides. In 1983, an earthquake in Québec measuring M4.1 on the Richter scale occurred six weeks after the injection of fluid into a well lubricated nearby faults.54 Similarly, scientists believe well exploration was the cause of M4 earthquakes in Wilmington, California that caused damage to several wells.55 In April 2014, the Ohio Department of Natural Resources explicitly connected fracking in the Ohio section of the Utica Shale with M3 and M4 earthquakes.56 Earthquakes in Québec tend to fall between M2 and M4 on the Richter scale, with most between M2 and M3.57 At this intensity, there is practically no risk of damage. However, the micro earthquakes generated by exploratory drilling and hydraulic fracturing can increase the frequency and intensity of dangerous earthquakes.58 In order to trigger a landslide, an earthquake has to be above M4.5.59 While this has not been observed in Québec, the BAPE report notes that “the injection of fluids into the crust can, on occasion, produce seismic events that can reach a magnitude of M5.”60 In addition, the many inactive faults in the St. Lawrence Lowlands pose a risk of reactivation if widespread fracking occurs. Therefore, increased shale gas development in Québec would introduce increased risk of earthquakes and landslides. Natural Contaminant Release Finally, the highly acidic and oxidizing conditions in wells pose a third risk. Fracking may precipitate the release of contaminants naturally residing in the Utica Shale, regardless of the composition of the “frack fluid” used. These potential releases may include significant amounts of dissolved solids, barium, and very high concentrations of chlorides.61 The resulting contamination of reflux waters would require costly treatment in order to ensure the health of local surface waters. Technological Risks Shale extraction involves a number of techniques that involve risks that are generally rare but severe. Of the most recent shale gas development in Québec (2006-2010), 85% has taken place in rural settings (60% agricultural, 25% forest).62 This means the risks and effects are primarily rural questions, concerning, in order of decreasing exposure: workers on drill sites, residents in direct proximity to drill sites, and communities in which these activities take place. The risks of shale gas exploitation may be inherent to the activity or simply stem from a failure to follow best practices. There is a wide variety of potential impacts on human and environmental health, including explosions, water pollution, air pollution, and nuisances in the form of light, noise, and traffic. This section will discuss each of these effects in order. Explosion The most spectacular risk when exploiting shale gas is the violent eruption of flaming gas at the wellhead. This was particularly prevalent around the turn of the 20th century, when oil and gas extraction was first introduced to Québec. In 1883, the log of the Cabane Ronde well noted, “A column of liquid, rocks, and gas coming out of the well and rising more than 50 feet could be observed for 48 hours.” Fifty years later, the well log for Lanoraie Oil and Gas Syndicate No. 1 tersely observed, “When drilling reached the gas pocket, a column of mud erupted to a height of 75 meters. Gas flowed for 24 hours before being controlled.”e e These well logs are accessible on the website of the Système d’information géoscientifique pétrolier et gazier (sigpeg.mrn.gouv.qc.ca). 12 www.closup.umich.edu
Opportunity, Risk, and Public Acceptability: The Question of Shale Gas Exploitation in Québec

Explosions occur when gas surges, leaks, or otherwise escapes containment during drilling or exploitation. These events have become
rarer with advances in gas-containment technology. Nevertheless, one gas district in California using fracking experienced explosion
rates during exploitation as high as 1:1000 between 1995 and 2005.63 The 2011 BAPE report concluded that a sizable proportion of
recently drilled wells in the St. Lawrence Lowlands experience unexpected leakages of natural gas in volumes large enough to present a
risk of explosion.64

Water Pollution

A less dramatic, but similarly concerning risk is the infiltration of contaminants into surface structures and aquifers. This can
happen when oil, frack fluid, or reflux sludge spills at the surface or leaks underground. Reflux sludge, the mix of frack fluid, natural
contaminants, and mud that returns to the surface after fracking, is particularly difficult to manage safely. Shale gas extraction
produces a large volume of reflux sludge, with a single well producing approximately 2000 cubic feet of sludge per day.65 This liquid can
contain heavy metals, certain chemical products,f non-biodegradable products, such as suspended polyesters, long-lasting pesticides,
and radioactive contaminants.66

Reflux sludge requires substantial treatment before it can be released safely back into the environment or reused in other wells. Reuse
is the most environmentally-friendly option in terms of minimizing water use and preserving environmental quality, but it is costly to
do so. In terms of treatment, it is unclear whether municipal water treatment facilities could adequately purify the liquid, but, in any
case, there are not enough of these facilities in the region to treat waste from more than a handful of wells.

While there are alternatives to water use in fracking, such as liquefied natural gas or liquefied carbon dioxide and nitrogen, these gases
are dangerous to transport. It is also possible to frack only with water and do without chemical or physical additives. While this liquid
would still require treatment, it would be simpler to do so. The main disadvantage is that fracking without additives is less efficient.
Nevertheless, some 1200 wells have been drilled in the United States and Canada with these methods.67 This means it is at least
technically feasible to frack with lower-risk methods than those predominantly in use today, albeit with reduced production.

Subterranean seepage of fluids into surface structures and aquifers is a particularly worrisome concern, as this is often not directly
observable. In order to isolate the target rock and prevent fluid migration, workers seat a cement casing around a well.68 If this cement
sealant is improperly installed, meaning there are gaps in the cement, or in the casing cracks, methane migration into surface aquifers
or nearby structures is possible (see Figure 9).69

A recent study of the wells in the St. Lawrence Lowlands found that some 15% of wells have unsafe concentrations of methane.70 The
failure of the cement in these wells would pose a material risk to human health, either due to explosion or poisoning. In addition, there
is also the possibility of tainted crops, as 80% of the target area is agricultural.71

In the worst-case scenario for subterranean fluid migration, as much as 30,000 cubic feet of gas could leak every year into the nearby
area after only 10 years of abandonment.g Fracking increases the speed and volume of leaks, as the technique involves placing the
production tubes under several multiples of pressure. Fracking amplifies weaknesses in the cement.72 Improperly installed casings
made of low-quality cement will break down at an accelerated pace, soon posing a substantial risk to the surrounding environment. In
contrast, well-seated casings made of fresh, high-quality cement are unlikely to fail, even after fracking.73

f   Including acetylene alcohol, volatile organic compounds, alkyphenols, ammonium chloride, trimethyl chloride, and quinoxifen.

g This is an estimate for a conventional well. This means the effect of fracking is not factored into the calculation.

                                                                                                                                       13
The Center for Local, State, and Urban Policy
Figure 9
Schematic of Well Cementing and Means of Failure.
Gas, natural contaminants, and frack fluid may escape through gaps or fractures (A-D), as well as
directly through deteriorated cement (E). Adapted from Vidic, R. D., Brantley, S. L., Vandenbossche,
J. M., Yoxtheimer, D., & Abad, J. D. (2013). Impact of shale gas development on regional water
quality. Science, 340 (6134), p. 8. Retrieved from http://dx.doi.org/10.1126/science.1235009
14 www.closup.umich.eduOpportunity, Risk, and Public Acceptability: The Question of Shale Gas Exploitation in Québec
Air Pollution
A third risk is one that has the potential to affect a larger population: air pollution. Potential sources of air pollution include the use
of diesel internal combustion engines, boiler systems, torches and incinerators, and reflux sludge storage basins, as well as fugitive or
ventilated gas. A typical shale gas project in Québec releases approximately 250 million pounds of carbon dioxide (CO2), 25 million
pounds of methane (CH4), 6 million pounds of nitrogen oxides (NOx), and 5.5 million pounds of carbon monoxide (CO) every year for
25 years.74 In terms of annual emissions, every three wells drilled are roughly equivalent to opening one new coal-fired power plant.h
In a situation wherein a company were to use the least environmentally-friendly practices, local air pollution would likely exceed
several norms and air quality standards, particularly for nitrogen dioxide (NO2), fine particulate matter (PM2.5), and formaldehyde.75
When water storage basins are left uncovered, there is an additional risk of extreme excesses in terms of concentration and spread of
BTEX (benzene, toluene, ethylbenzene, exylene) and hydrogen sulfide (H2S). Frack fluid also contains chemicals that can pollute the
air, most notably hydrogen chloride (HCl). While most operators use HCl at a 15% concentration, some frack fluid recipes call for
HCl in concentrations as high as 28%. HCl is volatile, meaning it may form a toxic gas cloud if spilled, with immediate, dire health
consequences for exposed workers, residents, and vegetation. In addition, odors from shale gas operations are emitted regularly, some
which may travel as far as five kilometers away.76
This is, as mentioned above, the worst-case scenario. There are some basic mitigation measures that can significantly reduce air pollution
resulting from shale gas extraction.77 Equipment should be run on electric power and their chimneys raised several meters above ground level.
To eliminate the risk of evaporation and volatilization of reflux sludge and frack fluid, water storage basins should be covered. Other techniques
include the use of air capture systems while setting the well casing, burning low-sulfur coal in boilers, treating gas with condensation and
thermal oxidation methods, and the installation of micro-leak detection and repair systems. Such measures, when implemented, can reduce the
emissions of volatile organic compounds and H2S by more than 90% and avoid nearly all excesses of air quality standards. These measures may
also limit odors to a 500-meter radius from the drill site during the roughly two-and-a-half months required to frack a well.
Nuisances
As perceived by the public, the most serious problems brought by shale gas development are light, noise, and traffic pollution.78 The construction
of a typical multi-well site requires between 500 and 1180 “noisy” days, when daytime traffic raises sound levels above safe limits.79 Even if
individuals avoid suffering the physical health consequences of these nuisances, constant loud noises and bright lights in residential, commercial,
and recreation areas may lead to negative psychological effects.80 These deleterious effects can be reduced through the creation of buffer zones,
the construction of adequate roads, the adherence to strictly defined operating hours, and the application of sound-dampening technology.81
It is clear that shale gas extraction threatens to detract from the quality of human life and the environment in Québec. The twin risks
of land subsidence and earthquakes pose a serious risk to the physical integrity of wells constructed in the St. Lawrence Lowlands.
Shale gas extraction poses an inherent risk of explosion and there is a constant risk of water pollution. The treatment of reflux sludge is
complicated by the risk of contaminating surface waters with chemicals naturally residing in the Utica Shale, as well as those included
in frack fluid. Sealant failure may lead to the subterranean migration of chemicals threatening aquifers and surface structures. Light,
noise, and traffic nuisances pose a danger to human physical and mental health.
Companies that follow best practices may be able to reduce their environmental impact to a large extent. Unfortunately, it is
impossible to ensure that these measures are implemented properly. Human error, slipshod work, and, of course, unavoidable natural
disasters mean the risk of serious, lasting damage to the environment that cannot be eliminated. With these facts in hand, the
question of shale gas development then hinges upon public perceptions of acceptable levels of risk.
Public Opinion of Shale Gas Development
Public perceptions of shale gas are in constant evolution as public awareness grows and new, relevant information becomes available.
Since the institution of the moratorium in June 2011, Québeckers have taken an increasingly negative outlook toward fracking. This
evolution can be measured in terms of municipal actions, public forums, and surveys.
h According to the Environmental Protection Agency’s calculator at http://www.epa.gov/cleanenergy/energy-resources/calculator.html.
15The Center for Local, State, and Urban Policy
In the first case, the Council of Canadians, a non-partisan civic organization, reports at least three of Québec’s county-level
governments (MRCs) and 29 municipal governments have passed motions or submitted official requests to the provincial government
calling for a moratorium on fracking (see Figure 10).82 All three MRCs and 23 of the municipalities are located within the zone of
interest for shale gas development (see Figure 2).
As the EES notes in terms of public input, “The debate on shale gas generally goes beyond local conflicts or factors of proximity. It
has taken on national dimensions…”83 Indeed, more than 50% of the participants in the BAPE’s first round of public consultations
came from outside of the area of interest. In addition, over 10,000 Canadians from all parts of the country have signed a petition
circulated by the Council of Canadians calling for a moratorium on all fracking in Canada until the federal government completes an
environmental impact statement. While this petition became moot with the publication of the Council of Canadian Academies’ report
on May 1, 2014,i its strong support is notable.
Figure 10
Map of Municipalities and MRCs That Have Passed Anti-Fracking Resolutions within the Area of Interest.
Key
A - Arthabaska (MRC)
B - Bécancour (MRC)
C - Vallée-du-Richelieu (MRC)
1 - Batiscan
2 - Calixa Lavallée
3 - Champlain
4 - Charette
5 - Lac-Etchemin
6 - Lanoraie
7 - Notre-Dame-du-Mont-Carmel
8 - Otterburn Park
9 - Pierreville
10 - Saint-Antoine-sur-Richelieu
11 - Saint-Denis-sur-Richelieu
12 - Saint-Didace
13 - Saint-Edmond-de-Grantham
14 - Saint-Hyacinthe
15 - Saint-Jude
16 - Saint-Louis-de-Blanford
17 - Saint-Luc-de-Vincennes
18 - Saint-Marc-sur-Richelieu
19 - Saint-Ours
20 - Saint-Pie-de-Guire
21 - Saint-Pierre-les-Becquets
22 - Saint-Prosper
23 - Saint-Sylvère
24 - Sainte-Madeline
25 - Saints-Martyrs-Canadiens
26 - Val-Alain
27 - Villeroy
Not Shown
Amqui
Saint-Gédeon
This map shows the municipalities (blue) and MRCs, or county-level governments (teal) that have passed motions calling for a
moratorium on fracking in their jurisdictions and the municipalities (red) and MRCs (orange) that have sent the Québec government
an official request for a moratorium on fracking in Québec. Color variations do not signify qualitative differences between shaded
regions of the same colors. Data from Council of Canadians. (n.d.). Fracker tracker. Ottawa: Council of Canadians.
Retrieved from http://www.canadians.org/fracking/fracker-tracker; image from Google Earth. (Build 7.1.2.2041). [Software].
Mountain View, CA: Google Inc. (2014). Available at http://earth.google.com;
U.S. Geological Survey Landsat. [Software]. Washington, DC: U.S. Department
i The report finds that at present, data is both insufficient and inconclusive about the prospective environmental costs of fracking within the divergent geographical, geological, and ecological contexts
of different Areas of Interest for fracking within Canada. See Council of Canadian Academies. (2014, May 1). Environmental impacts of shale gas in Canada: The expert panel on harnessing science
and technology to understand the environmental impacts of shale gas extraction. Ottawa: Council of Canadian Academies.
Retrieved from http://www.scienceadvice.ca/uploads/eng/assessments%20and%20publications%20and%20news%20releases/shale%20gas/shalegas_fullreporten.pdf
16 www.closup.umich.eduOpportunity, Risk, and Public Acceptability: The Question of Shale Gas Exploitation in Québec
The BAPE engaged three main actors in its first consultation: business, agriculture, and citizens’ collectives. These three groups largely
reject the notion of expanded shale gas development in Québec.84 The promise of economic benefits from development did not appear
to significantly influence the various participants’ views, as there was no difference between those coming from economically healthy
areas and those from economically depressed municipalities.85 As suggested in Figure 10, people in many of the communities in which
shale gas has been exploited or may be in the future feel negatively about the industry. This contradicts the idea that familiarity with
the industry breeds its acceptance. On the contrary, the strongest condemnations of shale gas development came from areas where the
industry was already present.
The results of public opinion surveys echo these findings.j Public support of fracking, only tepid at first, slipped quickly over less than a
year’s time (see Figure 11.1). In January 2012, Québec tied Alberta as the province most supportive of fracking, with slightly more than
half of Québeckers in favor of a national moratorium on fracking (55%).86 By November 2012, 72% of Québeckers came out against
shale gas extraction of any kind k, a 17-point swing.87
Montpetit and Lachapelle find that Québeckers are generally hostile to the shale gas industry.88 The word “fracking” is widely believed
to have negative connotations (see Figure 11.2), and nearly two-thirds of Québeckers believe the advantages of shale gas development
will be outweighed by its costs in the future (see Figure 11.4). Even if the highly-respected BAPE were to publish a report showing the
risks of shale gas development to be low, the public’s risk perception would still be above-average (see Figure 11.3).
This skepticism is tied to Québeckers’ concern that shale gas development will lead to negative environmental consequences. This is
demonstrated by the nearly linear relationship between risk perception and support for development (see Figure 11.5). As some three-
quarters of respondents strongly or somewhat agree that natural gas drilling represents a major risk to water resources (see Figure
11.6), it is unsurprising that Québeckers are largely hostile to the shale gas industry.
Québeckers’ take toward the shale gas industry might be explained by their ambivalence toward the desirability of atomistic
competition, or that between individuals (see Figure 11.8), relative to their clear opposition to private profits from exploitation (73%)
and concomitantly overwhelming belief that natural gas reserves are a public resource whose development should benefit citizens, at
92% (see Figure 11.9). Québeckers likewise prize environmental protection, with two-thirds in support of restraining economic growth
to solve environmental problems (see Figure 11.7). For a further investigation into the relation between shale gas development and the
values, beliefs, and perceptions of Québeckers, please refer to Montpetit and Lachappelle (2013).
The EES commission considered these three measures of public opinion and concluded that the public acceptability of shale gas
development is waning quickly. It is evident that, if development were to proceed in Québec, the industry would be obliged to improve
their communication practices to convince the public of the desirability of their industry. As the climate of public opinion stands
today, shale gas development is perceived to have little to offer in Québec.
j For technical information regarding these polls, refer to the caption in Figure 11.
k Albeit in response to slightly different questions. The question in January 2012 was, “Would you strongly support, somewhat support, somewhat oppose, or strongly oppose a moratorium on all
fracking for natural gas until all the federal environmental reviews are complete?” while the question in November 2012 was, “In general, would you say that you strongly agree, somewhat agree,
somewhat disagree, or strongly disagree with the extraction of natural gas through shale wells in Québec?” (my translation).
17You can also read