Extreme Weather, Climate and Natural Disasters in Ireland - EPA
←
→
Page content transcription
If your browser does not render page correctly, please read the page content below
Climate Change Research Programme (CCRP) 2007-2013
Report Series No. 5

          Extreme Weather, Climate
          and Natural Disasters in Ireland
Environmental Protection Agency
The Environmental Protection Agency (EPA) is              REGULATING IRELAND’S GREENHOUSE GAS EMISSIONS
a statutory body responsible for protecting               � Quantifying Ireland’s emissions of greenhouse gases
the environment in Ireland. We regulate and                 in the context of our Kyoto commitments.
police activities that might otherwise cause              � Implementing the Emissions Trading Directive,
pollution. We ensure there is solid                         involving over 100 companies who are major
                                                            generators of carbon dioxide in Ireland.
information on environmental trends so that
necessary actions are taken. Our priorities are
protecting the Irish environment and                      ENVIRONMENTAL RESEARCH AND DEVELOPMENT
ensuring that development is sustainable.                 � Co-ordinating research on environmental issues
                                                            (including air and water quality, climate change,
The EPA is an independent public body                       biodiversity, environmental technologies).
established in July 1993 under the
Environmental Protection Agency Act, 1992.                STRATEGIC ENVIRONMENTAL ASSESSMENT
Its sponsor in Government is the Department
                                                          � Assessing the impact of plans and programmes on
of the Environment, Heritage and Local                      the Irish environment (such as waste management
Government.                                                 and development plans).

                                                          ENVIRONMENTAL PLANNING, EDUCATION AND
OUR RESPONSIBILITIES                                      GUIDANCE
                                                          � Providing guidance to the public and to industry on
LICENSING                                                   various environmental topics (including licence
We license the following to ensure that their emissions     applications, waste prevention and environmental
do not endanger human health or harm the environment:       regulations).
                                                          � Generating greater environmental awareness
� waste facilities (e.g., landfills,                        (through environmental television programmes and
  incinerators, waste transfer stations);                   primary and secondary schools’ resource packs).
� large scale industrial activities
  (e.g., pharmaceutical manufacturing,
  cement manufacturing, power plants);                    PROACTIVE WASTE MANAGEMENT
� intensive agriculture;                                  � Promoting waste prevention and minimisation
� the contained use and controlled release                  projects through the co-ordination of the National
  of Genetically Modified Organisms (GMOs);                 Waste Prevention Programme, including input into
                                                            the implementation of Producer Responsibility
� large petrol storage facilities.                          Initiatives.
� Waste water discharges                                  � Enforcing Regulations such as Waste Electrical and
                                                            Electronic Equipment (WEEE) and Restriction of
NATIONAL ENVIRONMENTAL ENFORCEMENT                          Hazardous Substances (RoHS) and substances that
                                                            deplete the ozone layer.
� Conducting over 2,000 audits and inspections of
  EPA licensed facilities every year.                     � Developing a National Hazardous Waste Management
                                                            Plan to prevent and manage hazardous waste.
� Overseeing local authorities’ environmental
  protection responsibilities in the areas of - air,
  noise, waste, waste-water and water quality.            MANAGEMENT AND STRUCTURE OF THE EPA
� Working with local authorities and the Gardaí to        The organisation is managed by a full time Board,
  stamp out illegal waste activity by co-ordinating a     consisting of a Director General and four Directors.
  national enforcement network, targeting offenders,
  conducting investigations and overseeing
  remediation.                                            The work of the EPA is carried out across four offices:

� Prosecuting those who flout environmental law and       � Office of Climate, Licensing and Resource Use
  damage the environment as a result of their actions.    � Office of Environmental Enforcement
                                                          � Office of Environmental Assessment
MONITORING, ANALYSING AND REPORTING ON THE                � Office of Communications and Corporate Services
ENVIRONMENT
� Monitoring air quality and the quality of rivers,       The EPA is assisted by an Advisory Committee of twelve
  lakes, tidal waters and ground waters; measuring        members who meet several times a year to discuss
  water levels and river flows.                           issues of concern and offer advice to the Board.
� Independent reporting to inform decision making by
  national and local government.
EPA Climate Change Research Programme 2007–2013

          Extreme Weather,
Climate and Natural Disasters in Ireland

                        (2007-CCRP-2.7)

                           CCRP Report

End of Project Report available for download on http://erc.epa.ie/safer/reports

              Prepared for the Environmental Protection Agency

                                      by

                           University College Cork

                                  Authors:

Gerard Kiely, Paul Leahy, Francis Ludlow, Bettina Stefanini, Eileen Reilly,
                      Michael Monk and Jason Harris

             ENVIRONMENTAL PROTECTION AGENCY
              An Ghníomhaireacht um Chaomhnú Comhshaoil
            PO Box 3000, Johnstown Castle, Co.Wexford, Ireland

             Telephone: +353 53 916 0600 Fax: +353 53 916 0699
                   Email: info@epa.ie Website: www.epa.ie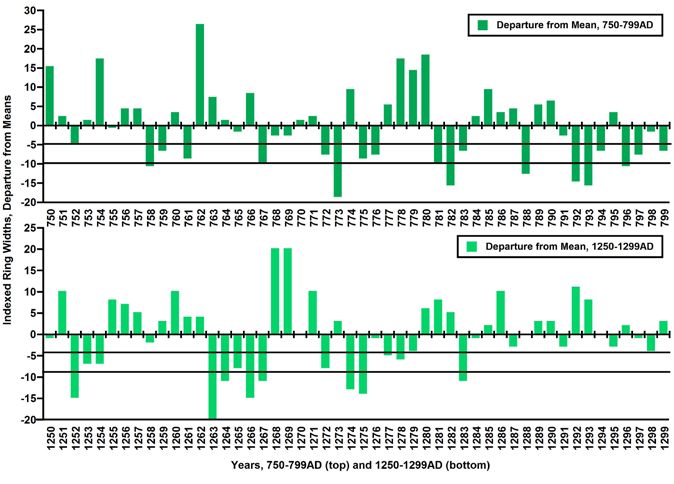
© Environmental Protection Agency 2010

                          ACKNOWLEDGEMENTS
This report is published as part of the Climate Change Research Programme (CCRP)
2007–2013. The programme is financed by the Irish Government under the National
Development Plan 2007–2013. It is administered on behalf of the Department of
the Environment, Heritage and Local Government by the Environmental Protection
Agency which has the statutory function of co-ordinating and promoting environmental
research.
The authors wish to acknowledge the contributions of the following experts: Mike Baillie
(Queen’s University Belfast); Peter Woodman (University College Cork); Diarmuid
Scully (University College Cork); Tido Semmler (Met Éireann); Sean Rickard (Mary
Immaculate College, Limerick); Paul Mayewski (University of Maine); Enda Murphy
(Trinity College Dublin); Kieran Hickey (National University of Ireland Galway);
Noreen Brennan (Met Éireann).
The support of the following agencies and institutions, through data products or other
co-operation is also acknowledged: Met Éireann; British Atmospheric Data Centre;
Climatic Research Unit (UK); National Center for Atmospheric Research (USA); Royal
Netherlands Meteorological Institute KNMI; Hadley Centre (UK); National Oceanic
and Atmospheric Administration (USA). The authors thank the EPA for its continuing
support and in particular Phillip O’Brien, Margaret Desmond, and Frank McGovern.

                                  DISCLAIMER
Although every effort has been made to ensure the accuracy of the material contained
in this publication, complete accuracy cannot be guaranteed. Neither the Environmental
Protection Agency nor the authors accept any responsibility whatsoever for loss
or damage occasioned or claimed to have been occasioned, in part or in full, as a
consequence of any person acting or refraining from acting, as a result of a matter
contained in this publication. All or part of this publication may be reproduced without
further permission, provided the source is acknowledged.
The EPA CCRP programme addresses the need for research in Ireland to inform
policymakers and other stakeholders on a range of questions in relation to climate
change. These reports are intended as contributions to the necessary debate on climate
change as it relates to Ireland.

                   EPA CCRP PROGRAMME 2007-2013
             Published by the Environmental Protection Agency, Ireland .

                         PRINTED ON RECYCLED PAPER

ISBN: 978-1-84095-363-3							                                              06/10/200
Price: Free

                                           ii
Details of Project Partners

Professor Gerard Kiely                 Dr Jason Harris
HYDROMET Research Group                Department of History
Department of Civil & Environmental    University College Cork
Engineering                            Tel.: +353-21-4903585
University College Cork                Email: j.harris@ucc.ie
Ireland
Tel.: +353-21-4902965                  Mr Francis Ludlow
Email: g.kiely@ucc.ie                  Department of Geography
                                       Trinity College
Dr Paul Leahy                          Dublin 2
Department of Civil & Environmental    Tel: +353-1- 8961576
Engineering                            Email: ludlowf@tcd.ie
University College Cork
Ireland                                Dr Bettina Stefanini
Tel.: +353-21-4902017                  Trinity College
Email: paul.leahy@ucc.ie               Dublin 2
                                       Email: stefanb@tcd.ie
Dr Michael Monk
Department of Archaeology              Dr Eileen O’Reilly
University College Cork                Trinity College
Tel.: +353-21-4904042                  Dublin 2
Email: mmonk@archaelogy.ucc.ie         Email: ereilly@ipean.ie

                                      iii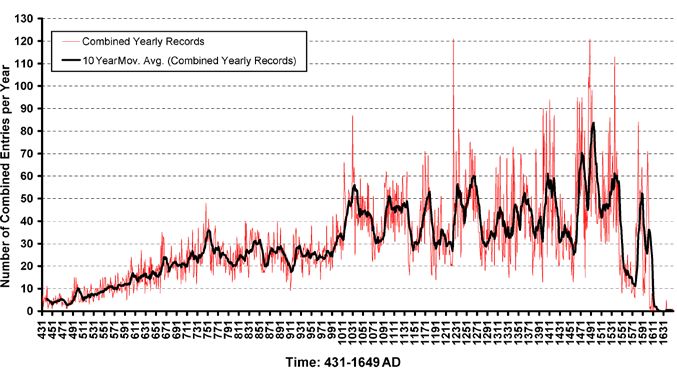
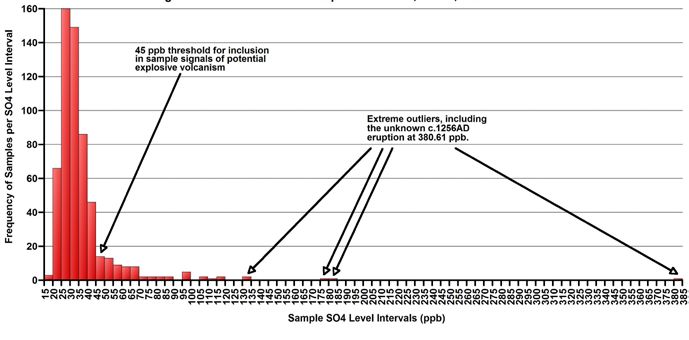
Table of Contents

Acknowledgements                                                             ii
Disclaimer                                                                   ii
Details of Project Partners                                                 iii
Executive Summary                                                           vii
1 Introduction                                                               1
    1.1 Project Aims                                                         1
    1.2 Approach                                                             2
    1.3 Climate Forcing                                                      3
2   Historical Review of Extreme Weather                                     4
    2.1 Historical Documentary Evidence of Extreme Weather                   4
    2.2 Chronologies of Extremes from the Annals                             6
    2.3 Conclusions                                                          9
3   Proxy Records                                                           10
    3.1 Introduction                                                        10
    3.2 General Conclusions                                                 11
4   Observational Records                                                   13
    4.1    Introduction                                                     13
    4.2    The Era of Instrumental Weather Observations in Ireland          13
    4.3    Air Temperature                                                  13
    4.4    Rainfall                                                         16
    4.5    Evaporation                                                      18
    4.6    Droughts                                                         18
    4.7    River Flows                                                      19
    4.8    Winds                                                            19
    4.9    Landslides and Bog Movements                                     20
    4.10   Conclusions                                                      20
5   Synthesis                                                               21
    5.1 Global and Regional Extremes Trends in Meteorological Time Series   21
    5.2 Comparison of Annals Information with Proxy Data                    21
    5.3 Conclusions                                                         26
6   Conclusions                                                             27
    6.1 Summary Conclusions                                                 27
    6.2 Key Findings                                                        27
    6.3 Recommendations                                                     28
References                                                                  29
Acronyms and Annotations                                                    33
Appendix: Gaelic Irish Annals                                               34

                                                      v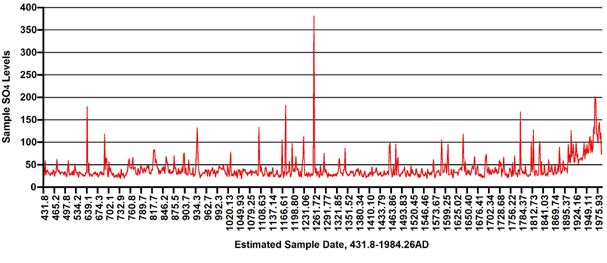
Executive Summary

The aim of this project was to collate historical, proxy                  The analysis also shows the localised nature of some
and observational (recent) records, and analyse the                       extremes, in the variation between the west and east of
information within this variety of sources for incidences                 Ireland, and illustrates the difficulty of extrapolation of
of extreme weather events and natural disasters, which                    local results to wider areas.
may give insight into the variability of climate in Ireland,
                                                                          Ireland’s location and geography on the Atlantic
and its impact on human society. The study focused on
                                                                          fringe of Europe means that is influenced more by the
extreme weather conditions: historical analysis from the
                                                                          North Atlantic circulation than continental influences.
fifth through to the seventeenth century       ad   was derived
                                                                          European climatic reconstructions and projections may
from the Gaelic Annals of Ireland1 and also from local
                                                                          have less direct relevance for Ireland than continental
and regional proxy data (e.g. tree rings and ice-core
                                                                          European countries. Rainfall and river flow changes
data). Observational data from the nineteenth century
                                                                          can be correlated to changes in the North Atlantic
onwards was analysed to identify extremes in rainfall,
                                                                          Oscillation.
winds, storms, floods and droughts.
                                                                          The current study was carried out to determine if
Modern instrumental records show that both maximum
                                                                          historical records from the Annals could support
and minimum temperatures are increasing across the
                                                                          evidence from other sources of regional climate forcing
island. In addition, there has been approximately a 10%
                                                                          events. For example, reported extremes of cold found
increase in annual rainfall over parts of Ireland since
                                                                          in the Annals correlate with volcanic eruptions evident
the 1970s. This is considered to reflect a climatic shift
                                                                          from the Greenland Ice Sheet Project 2 (GISP2) core
during the mid-1970s, and this shift is also evident in
                                                                          analysis. This shows the important contribution of
other records, such as river flow and evaporation. There
                                                                          volcanic events made to regional short-term cooling,
has also been an increase in extreme rainfall events
                                                                          due to the emission of aerosols. The GISP2 record
since the mid-1970s. Again, this change is observed in
                                                                          shows that aerosol sulfate levels increased during the
some river flow records. These findings suggest that
                                                                          twentieth century because of air pollution levels similar
the current practice of calculating return periods from
                                                                          to those recorded during a number of smaller volcanic
the longest possible datasets (including pre- and post-
                                                                          eruptions. The associated cooling is considered to have
1975 data) may result in underestimates of storm and
                                                                          masked greenhouse warming.
flood magnitude. This observation also suggests that
the assumption of stationarity2 (with regard to rainfall)                 Documentary sources, such as the Annals, provide
is now questioned.                                                        evidence for extremes of climate down through the
                                                                          centuries. The low event counts in many cases make it
More than 50 bog burst or ‘landslides’ in peatlands
                                                                          difficult to derive robust statistical measures. However,
have occurred since the early 1900s. These appear to
                                                                          some results emerge – such as a decrease in reported
have been caused by extremes in rainfall following dry
                                                                          extremes of cold in the late fourteenth and early fifteenth
periods and possibly compounded at times by human
                                                                          centuries; a lack of reported dry episodes during the
activities.
                                                                          ninth and tenth centuries; and a relative infrequency of
                                                                          wet episodes reported during the interval 1250 ad–1450
1 Ireland holds one of the oldest bodies of written literature            ad.   The data remain qualitative and it is not yet possible
  of any European country. The most important sources are                 to ascribe return periods to extremes identified in these
  the Gaelic Irish Annals. These represent the accumulation
                                                                          sources.
  of an annual chronicling of major local, national and
  international events by the educated elite in Ireland.
                                                                          It is impossible to go back in time and make instrumental
2 Stationarity is a term used in statistical analysis to describe
  a variable whose properties such as mean and variance                   observations of past weather and climate. To learn about
  are constant over time. In this case, engineers have                    past climate, it is necessary to look to those processes
  assumed that the risk of an occurrence of a flood events
  was constant with time.                                                 in nature which are affected by climate, and which leave

                                                                    vii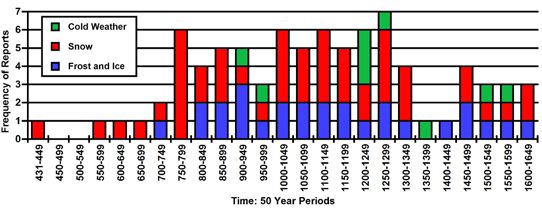
the signature of past climate in their structure. These             (19 November, with approximately 50 mm or more of
natural indicators of climate are known as ‘proxies’. For           rain for the 24-hour period in the south-west). Three
example, the growing conditions over time determine                 catchments (the Shannon, the Lee and the Liffey) were
the pattern of tree-rings for a given tree. Temperature             affected significantly. With climate change, extremes
and water availability are key weather parameters                   of flooding may become more frequent. The losses
that influence tree growth, although other confounding              incurred in 2009 may be repeated, unless extensive
factors such as pests and other damage also feature.                flood alleviation is implemented along with significant
Tree-ring chronologies from multiple locations offer a              improvements in flood monitoring, forecasting and
means of overcoming the localised nature of individual              warning.
proxies. The ‘Belfast’ oak chronology dates back more
                                                                    The main recommendations from this study include:
than 7,000 years, and is derived from oaks from most
of Ireland. Unusual growth patterns within a tree-ring              1   The establishment of a national repository for
chronology can be evidence for an extreme event with                    all data with potential for palaeoenvironmental
regional impact. Many, but not all, low-growth years                    reconstruction;
found through tree-ring chronologies correspond with
                                                                    2   An examination of further early texts for weather-
episodes of cold reported in the Annals. The probabilities
                                                                        related references (e.g. the Annals) and a
of other severe, non-climatic, global or local natural
                                                                        comparison of wind reports in the Annals to other
disasters, although uncertain (e.g. earthquakes) are
                                                                        proxies of environmental and climatic information;
extremely low compared to weather extremes, even
though their probable impacts may be high. While these              3   A reanalysis of the Belfast tree-ring chronologies
proxy records allow frequencies of extreme events to be                 with the specific purpose of palaeoenvironmental
estimated, it is not possible to quantify the magnitude of              reconstruction;
such events. This cross-referencing between sources                 4   The digitisation and web dissemination of the
allows us to be confident that the records of unusual                   remaining undigitised meteorological records;
or extreme weather in the Annals are reliable. Whilst
                                                                    5   An effort to collate instrumental data from dispersed,
many are due to regional impact of volcanic activity,
                                                                        fragmentary sources such as weather diaries;
other records may indicate the natural climate variability
during this period.                                                 6   A systematic homogenisation effort of the best
                                                                        available instrumental series;
In November 2009, widespread flooding occurred
across Ireland. It was the wettest November on record               7   An acute need for a single national authority to
at many locations, leading to saturated catchments                      control all river monitoring functions and make data
throughout the country. Flooding followed a wet day                     available on public websites.

                                                             viii
1 Introduction
1.1 Project Aims as rainfall intensities or air temperatures (a percentile
such as 99%). Thus, a severe 24-hour rainfall can be
The aim of this project was to collate historical, proxy
described by either its return period (e.g. 50 years) or
and observational (recent) records and analyse them
as a percentile (2%).
for incidences of extreme weather events, climatic
shifts, and natural disasters. This was to identify, where The general expectation is that climate change occurs
possible, event magnitudes and frequencies (return gradually over a long time frame. However, a climatic
periods), probabilities of occurrence, and impacts on shift can be described as a relatively abrupt transition
society. This analysis provides insight into the level of in climatic conditions. For instance, annual rainfall
climate extremes that Ireland had to cope with in the amounts may increase or decrease from the previous
past. long-term averages. Similarly, temperature may undergo
The definition of an extreme event depends on the local a climate shift – such as a warming in winter or a cooling
reference distribution. In other words, events that would in summer. For instance, for the northern hemisphere in
be classified as ‘extreme’ in one location might not be recent decades, there are indications of a poleward shift
considered unusual in another. Very often, the degree of of storm tracks and a strengthening of the storm tracks
risk associated with a given event is also dependent on north of Britain and Ireland. The transition time depends
the local expectation or degree of preparedness. Storms on the overall timescale of interest, but is generally
of magnitudes sufficient to cause widespread disruption short, i.e. over a 2–5 year period. A shift in a climatic
in the east of Ireland may be much more commonplace condition brings a change in climate parameters, which
in the west. For this reason, spatial shifts in weather are reflected in the statistical properties of data series
patterns or storm tracks are of particular interest, as for these parameters. Rapid climatic shifts, as well as
they may introduce unexpected events to new regions. individual events, can result in stress for ecosystems,
Seasonality is a further consideration. An event that is agricultural systems, infrastructure and societies
unexpected for a season may be considered as extreme, (Budyko et al., 1988). A meteorological extreme event
even though events of similar or even larger magnitudes as distinct from a climate shift can occur during a stable
may not be uncommon in that region in general during climate. For instance, the floods in Ireland in November
other seasons. One prominent example is the series of 2009 and the cold in January 2010 are regarded as
storms of August and September 1588, which included extreme events.
the storm on 21 September which destroyed much of
People affected by an extreme weather event (e.g.
the Spanish Armada off the coast of Ireland (Forsythe
extremely hot summer in Europe in 2003; Cork floods
et al., 2000; Lamb, 2005, 2nd edition). Similarly, there
in 2009; cold spell in Ireland in December 2009 and
were two large storms in August 1986. The first on
January 2010, which delayed the start to the growing
5/6 August mainly affected the west and south. The
season in Ireland in Spring 2010) often ask whether
second on 25/26 August (the remnants of Hurricane
human influences on the climate are responsible. A
Charley) affected the east with severe flooding in areas
wider range of extreme weather events is expected
such as Bray, Co, Wicklow.
with an unchanging climate, so it is difficult to attribute
By definition, extreme events are infrequent, but are any individual event to a change in the climate. Several
recorded throughout human history and have resulted factors usually need to combine to produce an extreme
in environmental and economic damage as well as event, so linking a particular extreme event to a
loss of life (Jentsch and Beierkuhnlein, 2008). Extreme single, specific cause is problematic. Simple statistical
events can be defined in terms of their return periods reasoning indicates that substantial changes in the
calculated over long intervals, i.e. 10-year, 50-year, frequency of extreme events can result from a relatively
100-year returns, or, for continuous variables such small shift of the distribution of a weather or climate
1Extreme Weather, Climate and Natural Disasters in Ireland
Figure 1.1. Schematic showing the effect on extreme temperatures when the mean temperature increases,
for a normal distribution (Box TS.5, Intergovernmental Panel on Climate Change, Assessment Report 4: 53).
variable. Extremes are the infrequent events at the difficult to deal with. In the context of this report, those
high and low end of the range of values of a particular extreme climate events that cause damaging impact
variable. The probability of occurrence of values in this on human society or activity are discussed. The term
range is called a probability distribution function (PDF) ‘‘natural hazards’’ encompasses a diverse range of
that for some variables is shaped similar to a Normal phenomena associated with the natural environment,
distribution. Figure 1.1 is a schematic of such a PDF for example, floods, storms, landslides, tsunamis and
and illustrates the effect a small shift can have on the earthquakes. The focus in this study is on climate-
frequency of extremes at either end of the distribution. related hazards.
An increase in the frequency of one extreme (number of
floods) will be accompanied by a decline in the opposite 1.2 Approach
extreme (number of droughts) (Intergovernmental
Three types of material were used in this study:
Panel on Climate Change [IPCC] Assessment Report
4 [AR4]). 1 Historical records and literary references from
approximately 400 ad (Chapter 2);
A hazard is an event, or series of events, which has
2 Proxy records from about 2500 bc (Chapter 3);
the potential to cause disruption, destruction, loss of
life, loss of economic production and/or ecosystem 3 Observational records from 1800 to 2009 (Chapter
function. The risk associated with such an event is often 4).
described as the product of the probability of occurrence These three categories possess very different temporal
of the event and the associated impact. High-impact coverage, and resolution, and spatial resolution, density
low-probability events are the most damaging and and reliability. The results are synthesised in Chapter 5.
Table 1.1. Date conventions.
Convention Description Main usage, notes.
bc/ad Conventional Latin Anno Domini system Instrumental, historical records
os/ns Old Style/New Style. Refers to variants of the bc/ Historical records. In the os, the new calendar year began on 25
ad system caused by the change from the Julian March (this persisted until 1752 in England and her colonies). In ns
to Gregorian calendar. ns is assumed unless the new calendar year begins on 1 January.
otherwise indicated.
Years bp (Uncalibrated) radiocarbon years before present Palaeoenvironmental records. The reference year is 1950.
Cal years bp Calibrated years before present Palaeoenvironmental records. The reference year is 1950, and
the raw radiocarbon age has been cross-calibrated by reference
to independently dated sources.
2G. Kiely et al. (2007-CCRP-2.7)
1.2.1 Area and Time Period of Interest such as carbon dioxide and particulate pollutants know
This study is focused on the island of Ireland. The as aerosols. These forcings are of concern because
events themselves may be local to Ireland (e.g. of both long-term shifts in climate and changes to
floods, bog bursts, etc.); local to another region (e.g. the frequency and characteristics of extreme climate
volcanic eruptions) but with possible effects on Ireland; events, and their implications for ecosystems and
regional (e.g. large tsunamis); or global (e.g. changes socio-economic systems. Radiative forcing (RF) is
in incoming global solar irradiance). The time frame is a measure of the influence that a parameter has in
the period from about 2500 bc to the present. Table 1.1 altering the balance of incoming and outgoing energy
summarises the standard dating convention.
in the Earth’s atmosphere system, and is an index
of the importance of the parameter as a potential
1.3 Climate Forcing climate change mechanism. Positive forcing warms
Extreme events occur because of the natural variability the surface while negative cools the surface. Figure
within the climate system. The global climate system 1.2 compares the RF values for 2005 to pre-industrial
also responds to forcings that alter the planet’s energy time (1750). The combined RF from increases in CO2,
balance (Budyko et al., 1988; Kondratyev and Galindo, CH4, and N2O is +2.3 W m-2 and its rate of increases
1997). This includes natural forcing such as the long- during the industrial era is very likely to have been
term solar cycles (Milancovich cycles) which have unprecedented in more than 10,000 years. The CO2
caused major changes to the Earth’s climate, such radiative forcing increased by 20% from 1995 to 2005,
as Ice Ages. More recent climate forcing is linked to the largest change in any decade in at least 200 years.
enhanced levels of atmospheric greenhouse gases (IPCC, 2007)
Figure 1.2. Global average radiative forcing (RF) estimates and ranges in 2005 for anthropogenic CO2, CH4,
and N2O and other important agents and mechanisms, together with the spatial extent and associated level
of scientific understanding (LOSU) (Figure SPM.2, Intergovernmental Panel on Climate Change, (IPCC, 2007).
Summary for Policymakers: 4).
3Extreme Weather, Climate and Natural Disasters in Ireland
2 Historical Review of Extreme Weather
The potential for the reconstruction of past climatic upon a comparison of evidence from the Annals of
conditions and weather extremes from the longest major societal stresses (implied food shortage and
continuous written body of literature from Ireland, the disease) and coincident severe downturn in northern
Irish Annals, was investigated.3 Direct references to hemisphere tree-ring growth in the sixth century. The
episodes of extremes of cold, wind, precipitation and general reliability of later events recorded in the Annals
temperature were extracted. Indirect weather records can be determined by comparing them to major events
or parameteorological phenomena such as floods and and dates known from independent documentary
droughts in the Annals were also noted. Other than the sources within and external to Ireland (e.g. Byrne,
Annals, other indigenous Irish sources with the potential 1967; McCarthy, 2000). This is further confirmed by the
for describing past climatic conditions and extremes accurate recording of astronomical phenomena, such
of weather are limited. Newspaper articles have been as solar and lunar eclipses, the dates of which can be
also used to construct a storm chronology for Dublin reconstructed independently.
(Sweeney, 2000). The use of documentary evidence, for
the period prior to systematic observations of climate/ 2.1.2 Past Investigations of the Annals
weather parameters, requires careful consideration Numerous authors have reported records of weather
of contemporaneous factors and reports as well as extremes, related phenomena and associated societal
the established provenance and critical reviews of the impacts in the Annals (e.g. Meaden, 1975; Dixon, 1987;
reliability of the record. Mallory and Baillie, 1988; Rowe, 1989; Baillie, 1994,
1995, 1999, 2006; Kelly, 1997; McCarthy and Breen,
2.1 Historical Documentary Evidence of 1997a, b; Sweeney, 2000; Pfister et al., 1998; Hall and
Extreme Weather Mauqouy, 2005; McCafferty and Baillie, 2005; National
Research Council, 2006; McCormick et al., 2007;
2.1.1 Available Historical Sources Down, 2008; McCarthy, 2008). As part of the Census
Ireland holds one of the oldest bodies of written of Ireland, 1851, Wilde’s survey included records of
literature of any European country. The most important weather extremes and unusual meteorological and
sources are the Gaelic Irish Annals. These represent natural phenomena. In 1878, a survey of relevant
the accumulation of an annual chronicling of major material in the Annals was published by Walford in the
local, national and international events by the educated Journal of the Statistical Society of London, entitled
elite in Ireland. Recording was initially undertaken in ‘The famines of the world: past and present’. The next
monastic settings after the establishment of Christianity, major attempt to compile material from the Annals
but largely moved to secular schools of learning from the was by Britton, published in Geophysical Memoirs
thirteenth century, with events recorded by professional in 1937. Britton’s main focus was on British and Irish
hereditary historians (Mac Niocaill, 1975; Dumville, sources and he adopts a critical stance in citing dates
1999; McCarthy, 2008). This move was precipitated and sources. The next notable assessment of weather
in part by the twelfth-century church reform (O’Dwyer, extremes in the Annals is by Dixon (1953, 1959).
1972; Gwynn, 1992). Rather than presenting a compilation of transcripts from
the Annals, a more traditional essay is presented in
The most recent and extensive study of the Annals
which major extremes (e.g. storms) are listed by date,
(McCarthy, 2008: 161) argues that ‘a capacity for
with some representative examples quoted. The most
accurate chronicling in the most difficult of circumstances
recent published catalogue of extremes and related
existed in an Irish monastic context by 538 ad and
phenomena in the Annals is by Lyons (1989). Table
possibly before’. McCarthy bases this assessment
2.1 gives examples that recognise a broad division
3 See Appendix.
between records of direct meteorological phenomena
4G. Kiely et al. (2007-CCRP-2.7)
(e.g. rain, wind) or conditions (e.g. dry weather) and Kempe and Rohr, 2003; Rohr, 2003, 2005; Given-
indirect or proxy phenomena, from which underlying Wilson, 2004). McCarthy and Breen (1997a, b) and
meteorological conditions may be inferred (e.g. drought, Ludlow (2005a) have shown that many unusual events
frost, flooding, and, more indirectly, harvest yields and recorded in the Annals are explained by reference
failures, fruit yields, scarcity, famine). to modern knowledge of rare physical phenomena.
This is not to imply that every record in the Annals is
Table 2.1. Examples and categories of relevant
reliable. Some may be exaggerated, manipulated or
records in the Annals (Four Masters).
fabricated according to the motives of scribes (or later
Example text Categories and dates copyists). Understanding the motives for the recording
(Corrected, Julian
Calendar) of natural phenomena can aid in identifying instances
There was great frost in this Indirect (parameteorological) of potential unreliability. Based upon assessments of
year, so that the lakes and phenomena (frost and frozen the astronomical records in the Annals, McCarthy and
rivers of Ireland were frozen water bodies). 700 ad.
… Breen (1997a, b) suggest that a primary motive for
There was unusual ice and Direct (snow) and indirect recording arose from the interpretation of astronomical
great snow in this year, from (parameteorological) phenomena (e.g. eclipses) as portents foretelling
Christmas to Shrovetide. phenomenon (ice). Christmas
is 25 December 817 ad. the coming of the Biblical Last Days. However,
Shrovetide falls in January of Ludlow (2005b) suggests that the desire to document
818 ad.
weather extremes arose because, unlike the majority
A great wind on the festival Direct weather phenomenon
of St Martin … caused great (wind) with associated impacts of astronomical phenomena, extremes often had an
destruction of the woods in (destruction of trees and impact upon society (e.g. damage to crops, mortality of
Ireland, and swept oratories buildings). The Feast of Martin
… from their respective sites. is 11 November. 892 ad. humans and animals).
The cornfields remained Indirect (phenological)
unreaped throughout Ireland phenomena (delayed harvest)
Of concern in investigating changes in the frequency
until after Michaelmas, in associated with a direct of extremes recorded in historical sources is the
consequence of the wet weather phenomenon (wet
weather. weather). Michaelmas is St.
representivity of derived trends. For example, it may be
Michael’s Day, 29 September. that a period, in which fewer extremes are recorded,
1329 ad.
reflects not an actual decrease in the occurrence
Great dearth in this year, Economic information
so that sixpence of the old associated with indirect of extremes, but a decrease in available records of
money were given for a cake phenomenon (dearth) extremes. This might arise from the destruction of
of bread in Connaught, or six subcategorised under famine
white pence in Meath. and scarcity. 1545 ad. sources or a lack of interest in recording the information
Intense heat and extreme Direct observations of at that time. What is commonly observed is a decrease
drought in the summer of meteorological conditions in the frequencies of extremes in earlier portions of
this year; there was no rain (heat, no rain) and indirect
for one hour, by night or day, phenomenon (drought). reconstructions. This may reflect a paucity of available
from Bealtaine to Lammas. Bealtaine is 1 May and records as much as any real decrease in extremes.
Lammas is 1 August. 1575 ad.
Such issues may be investigated for the Annals once
2.1.3 Reliability of Evidence
the digitisation of major texts by the CELT (Corpus of
Even records contemporary to the events and
Electronic Texts)4 project, University College Cork, is
phenomena they purport to describe must be assessed
complete. This will allow a quantification of the number
for reliability, in the context that other material supports
of entries (of all types, e.g. obituaries of important
the description. The interpretation of natural events
personages). This data is given in Figure 2.1, showing
and phenomena before the modern period generally
the combined number of entries available per year in
employed explanatory frameworks based upon myth,
folklore and religion, which, in the case of Christianity,
4 CELT, Ireland’s longest running Humanities Computing
described the origins and operation of the natural project, brings Irish literary and historical culture onto the
world. Studies of the perception of weather extremes Internet. It includes a searchable online textbase consisting
of 13.6 million words, in over 1100 contemporary and
and other natural hazards in the pre- and early-Modern
historical documents from many areas, including literature
periods are scarce (e.g. Janković, 2000; Kempe, 2003; and the other arts.
5Extreme Weather, Climate and Natural Disasters in Ireland
seven major texts from 431 ad to 1649 ad.5 The thick the variation in Fig. 2.1 is controlled by the number of
line is the 10-year moving average: each text ends on texts providing coverage for given periods rather than
a different year and final pages are often lost to decay the absolute number of records surviving for those
or interference, whilst in other cases scattered entries periods.
have been added through time. Though many entries
are duplicated between the texts, each provides different 2.2 Chronologies of Extremes from the
densities of coverage in entries per year. The mean Annals
value for Fig. 2.1 is 29.5 entries per year (median 27,
It is possible to obtain chronologies of the combined
standard deviation 18.9). Because the available entries
records of extremes of wind, precipitation and
are not distributed through time evenly, the mean,
temperature from the Annals. As noted above, these are
median and standard deviation are unrepresentative for
derived from the seven major texts. Relevant records
many periods. It is tempting to interpret the variation in
have been taken from the respective texts from about
Fig. 2.1 as reflecting the level of recording undertaken
431 ad to the date of their cessation around 1600.
through time, with marked trends corresponding to
The differing meteorological origin and spatial extent
known phases of Irish history (e.g. low but increasing
of certain extremes also necessitates the exclusion of
numbers from 431 ad might represent the progressive
some records to allow a comparison of like with like
establishment of Christianity and the spread of literacy
(e.g. in the frequency of extremes per 50-year period).
among monasteries). This is, however, speculative
This means that the derived chronologies are likely to
as the seven texts from which the data is drawn have
describe trends in events or episodes across Ireland
often abbreviated (or incorporated already abbreviated
rather than local events, for example in Munster. It is
versions of) earlier texts, while material in unknown
acknowledged that even large-scale synoptic systems
texts may not be incorporated in the surviving Annals.
(e.g. storms) may have a variable impact across
Because duplicates are not removed, a proportion of
relatively small geographical areas. This is highlighted
5 (i) Annals of the Four Masters; (ii) Annals of Ulster; (iii)
by major storms such as the great 1703 ad storm that
Annals of Inisfallen; (iv) Carew Fragment; (v) Annals severely affected England (Wheeler, 2003) being felt
of Tigernach; (vi) Annals of Loch Ce; (vii) Annals of only moderately in Ireland, while the ‘night of the big
Connaught.
Time: 431-1649 AD
Figure 2.1. Combined available yearly records.
6G. Kiely et al. (2007-CCRP-2.7)
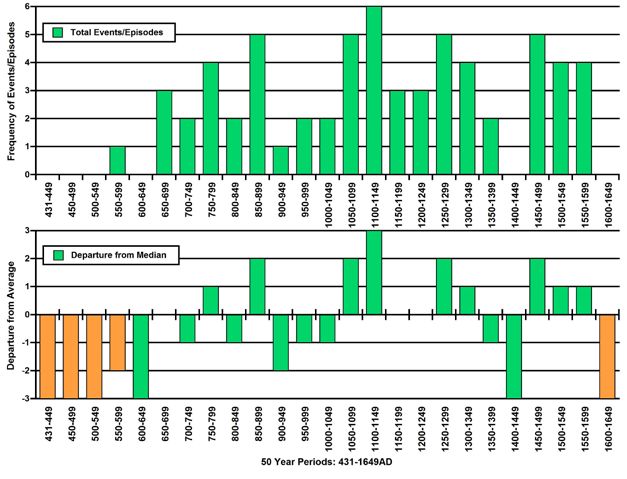
wind’ in 1839 ad that strongly affected Ireland (Shields 2.2.2 Extremes of Precipitation
and Fitzgerald, 1989; Hickey, 2008) was felt with much A composite chronology of extremes of precipitation
less force in England (Lamb and Frydendahl, 1991). from the seven major Annals, arranged in 50-year
periods, is presented in Fig. 2.3. The frequency is
2.2.1 Extremes of Wind shown of recorded wet events/episodes (in blue)
A composite chronology of extremes of wind derived versus the number of dry events/episodes (in orange).
from the seven major annalistic texts over the period On four occasions, records included as dry events/
431 to 1649 is presented in Fig. 2.2. The frequency of episodes may be considered as indicating actual
extremes is provided per 50-year period in Fig. 2.2a and conditions of drought, while on one occasion a similar
the deviation from the average in Fig. 2.2b. The median consideration applies to wet events/episodes. In
frequency of extremes of wind per 50-year period is 3. the chronology of dry events/episodes, these four
The problematic nature of averages derived from such involve large rivers drying out for a specific period,
time series is noted, with a low number of cases (i.e. low namely, the Galway river (Corrib) on three occasions
number of 50-year periods, with only 20 from 600–1599 (i.e. 1178 ad, 1191 ad, 1462 ad) and once the River
ad) and the low number of extremes recorded per period Liffey in Dublin (i.e. 1152 ad). However, the records
(ranging from 0 to a maximum of 6). The averages may do not include descriptions of drought to support a
thus be sensitive to small changes in the number of definite meteorological contribution. Several records
recorded extremes and the selection time increment describing notably hot summers are included, though
(e.g. 50- vs. 20-year periods). these do not automatically equate with drought.
(a)
(b)
Figure 2.2. Frequency of wind events, 431–1649 ad . (a) total number of events per 50-year period with a
median of 3 and (b) the deviation from the average.
7Extreme Weather, Climate and Natural Disasters in Ireland
Figure 2.3. Frequency of wet/dry events/episodes, 431–1649 ad.
The frequency of wet events/episodes per period ranged records in the lesser remaining Annals included. This
from 0 to 4, with an average of approximately 2. The may be inferred from the relatively few additions to the
first reliably recorded extreme occurs in 700–749 ad and chronology of extremes of cold from the lesser texts and
the number of recorded extremes varies from 1 to 2 per the general small volume of these texts in comparison
period until 900–949 ad, for which 4 extremes are noted. to the seven major texts.
This is one of the highest observed values, matched
Very few extremes of heat are recorded in the Annals.
only by one later period (1550–1599). The frequency
Cold events/episodes are well represented and more
continues to vary between 1 and 2 from 950–1149 ad,
likely reflect the actual frequency of extremes of cold
before increasing to 3 events/episodes per period from
experienced through time, so a chronology derived
1150–1249 ad. A notable aspect of the series is only 1
from these has potential for further investigation in
record for 1250–1349 ad and none from 1350–1449 ad.
terms of statistical analysis. Extremes of cold are
This marks one of the most sustained periods of below-
under-investigated in an Irish context; however, the
average records. A steady increase in the number of
Annals can afford the opportunity to test the response of
events follows from 1450 ad, reaching a peak of 4 in the
biologically environmental proxies such as tree-rings to
1550–1599 ad period. This final peak corresponds to a
known extremes of cold. Spatial patterns of temperature
period known for its series of cold and wet years across
also tend to vary less across larger geographical areas
much of Europe owing to persistent low pressure centred
than do patterns of precipitation that are more prone
over Scandinavia and much of North West Europe
to variation from local orographic influences (Croxton
(Pfister, 2007). No event/episode is recorded for 1600–
et al., 2006). Thus, recorded cold may be more
1649 ad, likely reflecting the fall in records generally
representative of extremes experienced across Ireland
available in this period.
as a whole. Figure 2.4 depicts 83 recorded direct and
indirect proxy phenomena and observations from
2.2.3 Extremes of Temperature which low temperatures may be inferred for Ireland,
For extremes of temperature (e.g. low temperatures, arranged in 50-year periods from 431–1649 ad. Of the
Fig. 2.4), the chronology comprises records from the 83 recorded cold events, 47 (or 56.6%) are records
Annals and several lesser texts and one non-annalistic of snowfall (often with descriptions of unusual depth,
source for 1601 ad (Stafford, 1633). A more extensive widespread geographical extent, and/or duration of
search for recorded extremes of cold can be found in snow cover). Twenty-seven (or 32.5%) are records
the proxy Greenland Ice Sheet Project 2 (GISP2) ice of frost or ice on water bodies, while 9 (or 10.8%) are
core record of past volcanism and the Irish oak tree-ring observations of generally cold conditions. Figure 2.4
record. The chronologies are broadly representative shows significant variation in the frequency of extremes
of the trends that would be apparent were all relevant involving low temperatures through time. Figure 2.4
8G. Kiely et al. (2007-CCRP-2.7)
Figure 2.4. Recorded information from which low temperatures may be inferred.
therefore presents the frequency of individual episodes understanding the nature of the climate signal in other
of cold (whether each involves several phenomena or proxies than a definitive record of climate. It can advance
only one). Chapter 5 presents an investigation of the investigating the relationship between the incidence of
relationship between extremes of cold reported in the extremes and the mean state of climate variables (i.e.
Annals and Irish oak dendrochronological records, and precipitation) should an appropriate and sufficiently
a comparison of extremes of cold in the Annals to the high-resolution record be developed as discussed in
record of Northern Hemisphere volcanic eruptions in the Chapter 5. The trends in extremes of wind, precipitation
GISP2 ice core. and temperature reveal potentially significant variations
in Ireland’s weather. Evidence from the Annals may be
2.3 Conclusions compared to or combined with information from proxies
to improve understanding. It is recommended that a
The Annals provide a unique and valuable record of
systematic review of the Annals and other sources be
the climate between 400 ad and 1649. Information from
the Annals on extremes may offer more potential for undertaken for extreme event related material.
9Extreme Weather, Climate and Natural Disasters in Ireland
3 Proxy Records
3.1 Introduction environments (high altitudes, northern forest margins,
etc.) (Baillie, 1995). Some of the Irish temperature
Climate reconstructions are in part based on climate
proxy records show a detailed picture, particularly of the
proxy data. Climate proxies are measured variables
step-wise progress of post-glacial warming. Among the
that can be used to infer climate attributes such as
Holocene temperature proxies, several records stand
temperature, precipitation or storminess. Some proxy
out for their accuracy, resolution and dating. Given the
records, like oxygen isotopes in lake/cave deposits
number of potentially excellent lake, cave and tree-
describe long-term trends in climate change, while others
ring-based archives available in Ireland, it should be
like tree rings and shipwrecks may represent single
possible in the future to produce enough well-dated,
extreme events. Ireland’s climate is strongly influenced
high-resolution temperature proxy records to achieve a
by the Atlantic ocean. This creates markedly different
comprehensive understanding of Holocene temperature
climatic conditions to other European (continental)
change in Ireland.
regions and makes the use of palaeo-climate data from
outside Ireland unsuitable. The literature on Irish proxy
3.1.2 Hydrological Proxies
data is reviewed under the headings: (i) temperature
In this context, ‘hydrological proxy’ is used to include
proxies; (ii) hydrological proxies; and (iii) landslides
palaeo-precipitation, surface water, water-table depth
proxies. Shipwrecks as a proxy for storminess are also
and flood indicators. In Ireland few natural archives
examined briefly.
have been identified that store palaeo-precipitation
proxy data. Most Irish surface water proxy records have
3.1.1 Temperature Proxies
been generated through macrofossil, testate amoebae,
Biotic proxies include tree rings, sub-fossil insects and
humification, sub-fossil insect and peat stratigraphic
pollen. Sub-fossil insects have been used in palaeo-
analyses of raised bog sediments. Most of these proxies
temperature reconstruction, especially to identify the
are thought to reflect the climate patterns of a number
late glacial/early post-glacial transition (i.e the end
of years or decades rather than of a single growing
of the last Ice Age, and the beginning of the present
season. This can be due to several factors, such as
period, e.g. Brooks and Birks, 2000; Coope and
a lag time between climate and vegetation change or
Lemdahl, 1995). Pollen data have also been used in
the structure and growth of raised bog systems, which
several investigations of early Holocene environments
accumulate plant material first in the ‘acrotelm’ (the
in Ireland. For instance, Haslett et al. (2006) used
aerated top layer of the bog above the water table).
pollen data from Glendalough, Co. Wicklow to calibrate
After some decades this material is incorporated into
a temperature reconstruction model based on Bayesian
the permanently waterlogged substructure of the bog
statistics. (the ‘catotelm’) where it is subject to much slower
Tree-ring widths have been variously used as a proxy decay rates and is thus less influenced by later climate
to reconstruct past precipitation levels, temperature, regimes. Most of the proxy records described here point
volcanic activity and meteor impacts (Briffa et al., to climate trends rather than specific extreme weather
1983; Baillie and Munro, 1988; Baillie et al., 2000). events.
Tree-ring widths often correlate with both precipitation Bog bursts, which may be caused by a combination
and temperature, but the correlation with precipitation of internal stress on the peat and high precipitation,
appears more significant (García-Suárez, 2005). have been separated successfully from climate signals
Isotopic measurements on tree cellulose generally (Bermingham and Delaney, 2005; Casparie, 2005;
reflect climate parameters more closely than ring width Geary and Caseldine, 2006). In two studies, in Derryville
and may be more specific in its application (Loader et Bog, Co. Tipperary and Tumbeagh Bog, Co. Offaly,
al., 1995). In locations such as Ireland, there is a very beetles produced important evidence for catastrophic
clear climate signal from tree-ring widths in stressed bog bursts (Gowen et al., 2005; Bermingham and
10G. Kiely et al. (2007-CCRP-2.7)
Delaney, 2005). In both cases, the response of beetles that an interplay between land-use changes and extreme
to changes in the hydrology of the bog could be weather events such as big storms lead to downslope
identified in changes in the composition of water beetle movement of destabilised sediments (Creighton et
assemblages before and after the dated bog bursts al., 2006). The periods of debris aggradation in the
(Reilly, 2005; 2006). However, the sample resolution Macgillycuddy Reeks are partly based on the Gaddagh
of the insect assemblages was coarse so the changes Valley record (Anderson et al., 2004) and partly on
observed might not have been recognisable specifically the Hags Glen, Glen Coomloughra and Curraghmore
as bog bursts. records (Anderson et al., 2000). Both these sources rely
Tree-ring width, large-scale dying and germination on only a few dates while the Mount Brandon record is
events in oaks and the number of oaks found in lake and based on 26 dates and the Upper Liffey Valley record
bog archives have been used as proxies for adverse and on 18 dates. Conclusions overall must remain general
favourable hydrology affecting tree growth (Leuschner as there are neither enough examined sites nor well-
et al., 2002; Turney et al., 2005, 2006). Furthermore, constrained dates to provide a firm link between sites,
runoff and erosion, as measured by magnetic proxy climate and land-use evidence.
susceptibility and other lake level indicators, may have
been due to increased precipitation. However, runoff 3.2 General Conclusions
could also have followed from catchment deforestation While Ireland has many useful, high-resolution archives
and may thus be an ambiguous proxy signal. In the An that have generated important proxy data of past climate
Loch Mor and Lough Maumeen cores, climate change trends and single extreme events, significant gaps –
evidence could be separated from deforestation signals particularly in temperature proxy records – remain. While
since landscape change was recorded independently proxy records may record a single extreme event, such
through pollen analysis (Holmes et al., 2007; Huang, as a major storm or volcanic eruption, they seldom give
2002). The first record shows low lake levels around an accurate picture of the amplitude of the event. Other
8300, 7500 and 7000 cal bp and rising lake levels from proxy records may be useful to infer general trends of
6400 until ca. 5200 cal bp while the second indicates temperature and hydrology but their applicability may
wetter conditions between 6250 and 6000 cal bp, as be limited in geographical and chronological terms.
well as during the Little Ice Age.
Climate proxy research in Ireland is relatively new.
Improvements in dating and analytical techniques
3.1.3 Landslide Proxies
help to develop the potential of such studies. Ireland’s
The destabilisation of sediments in mountainous areas
position on the Atlantic fringe of Europe makes it an
may be caused by either extreme weather events or
important stage for climate research as both ocean
land-use changes. For example, it often occurs in the
and solar-mediated climate change hypotheses can
wake of human-induced deforestation. Ancient debris
potentially be tested. It is therefore important that the
sometimes encases one or several lenses of peat that
existing gaps in our proxy records are filled and the
accumulated while there was no geomorphic impact
potential offered by tree rings, tephra and accelerated
on the find site. These peat lenses can be used to infer
mass spectrometry (AMS), and wiggle-matched dating
palaeo-environmental information. Macrofossils or bulk
techniques, to produce high-resolution chronologies
samples of extracted peat from such lenses provide a
for multi-proxy climate records, are fully exploited. The
dating tool while pollen may inform on land use at the
current investigation of proxies notes that:
time of peat growth. The publications reviewed identify
times with increased debris aggradation as coincident ● There is a lack of temporally well-resolved,
with cultural periods and deforestation. From the pollen temperature proxy records (apart from tree rings,
records, it appears that the aggradation followed on from see Chapter 5). However, general early Holocene
increasing intensive land use of the catchment, including warming, subsequent cooling and variable
deforestation. Changes in land use are shown by temperature conditions in recent millennia may be
pastoral and in some cases arable indicator pollen. The inferred from existing records;
authors of publications on geomorphic activity speculate
11Extreme Weather, Climate and Natural Disasters in Ireland
● There are common indications of wet periods from ● Analyses of other indicators such as documentary
multiple hydrological proxies from multiple sites in shipwreck records and aggraded sediments are
some instances, including the periods 4450–4300 cal complicated by strong confounding, non-climatic
bp; 3500–3000 cal bp; 2800–2500 cal bp; 2000–1800 influences. For example, a large surge in reported
cal bp and 1600–1050 cal bp. Conditions appeared to incidence of shipwrecks in the second half of the
be dry thereafter, followed by wetter periods around nineteenth century is probably due to increased
850 cal bp and 200 cal bp. The 3500–3000 bp wet reporting frequency and may be unrelated to an
period coincides with an upsurge in the construction independent record of storminess. In the case of
of wooden trackways in the midlands and with an sediments, shifts in cultivation practices (possibly in
increase in hillfort settlements, which may be due response to climatic influences) may be the strongest
to the wetter conditions, although cultural influences influence.
cannot be ruled out;
12G. Kiely et al. (2007-CCRP-2.7)
4 Observational Records
4.1 Introduction (Table 4.1), for example, the Botanic Gardens, Dublin in
1801, Valentia in 1860 and Birr in 1872 (Shields, 1987;
Precipitation, temperature and wind speed records
Rohan, 1986). Not all the early records are digitised,
are available at 13 stations in the Republic of Ireland.
which makes them difficult or impossible to analyse.
Records date back to 1794 at Armagh. Other climatic
Locations of stations are shown in Fig. 4.1 with details
variables – including radiation, soil temperature and
in Table 4.1.
barometric pressure, and, at some locations, evaporation
– are more recently available at the synoptic stations.
In the 1990s many of the stations were automated
4.3 Air Temperature
with new instrumentation. At that time, there were as The regional patterns of increasing air temperatures
many as 2000 daily rain stations around the country, during the twentieth century have also been noted in
although the number has been decreasing over the last records from various stations in Scotland and Ireland.
two decades. River records at flow stations around the A combined Scottish–Northern Irish temperature time
country do not have the same longevity as many of the series found that 23 of the warmest months, seasons
rain stations, The river flow stations are managed by and years (out of a total of 51 series: 17 time series and
multiple agencies including: the Office of Public Works 3 locations) in the period 1861–2002 have occurred after
(OPW), the Environmental Protection Agency (EPA), 1988. Wavelet analysis has shown that the temperature
the Electricity Supply Board (ESB), the county councils time series has a periodic component of a period of 7.8
and others. Some are managed for flood flows while years, corresponding to the period of the North Atlantic
others for low flows. Oscillation (NAO) (Butler et al., 2005). Statistically
significant increasing trends have been noted for
4.2 The Era of Instrumental Weather twentieth-century annual and particularly March–May
Observations in Ireland temperatures at Valentia, and annual and all seasonal
temperatures, except December–February at Armagh.
The era of regular, instrumental, meteorological
observations in Ireland started in Armagh in 1794 The annual 99th percentiles of daily maximum and
with barometric pressure and wind direction (Hickey, minimum temperatures for four Irish stations since the
2003). Records commenced in Dunsink, near Dublin, 1950s are shown in Fig. 4.2. There are clear increasing
around the same time (Butler et al., 2005). Various trends for maxima and minima. The rate of increase of
other meteorological quantities (e.g. soil temperature; the minima range is between 0.27 and 0.42 °C /10-year
García-Suárez and Butler, 2005) have been added while the rate of increase of the maxima range is from
since the commencement of the Armagh record. More 0.04 to 0.33 °C /10-year. The increasing trends were
stations began recording during the nineteenth century generally stronger for daily minimum temperatures
Table 4.1. List of selected continuous, long-term meteorological records in Ireland.
Location Station type Current operator Start End Values measured
2008 date date
Armagh Automated Armagh Obs. 1794 present P, WD, Ts, SD, M
Birr Synoptic Met ÉÉireann 1872 present P, Pr, Ta, SD, M
Galway Daily Met Éireann 1861 present Pr, Ta, M
Dublin(Botanic Gardens) Daily Met Éireann 1801 present Pr, Ta, M
Dublin (Phoenix Park) Daily Met Éireann 1829 present Pr, Ta, SD, M
Valentia Synoptic Met Éireann 1860 present Pr, Ta, P
P = Pressure; WD = Wind Direction; Pr = Precipitation; Ta = Air Temperature; Ts = Soil Temperature; SD = Sunshine Duration; M = More.
See the Armagh Observatory website (http://climate.arm.ac.uk/) for a full description and Met Éireann’s website (http://www.met.ie/) for
the station names, types and records.
13You can also read