JRC TECHNICAL REPORTS - European wildfire danger and vulnerability in a changing climate: towards integrating risk dimensions
←
→
Page content transcription
If your browser does not render page correctly, please read the page content below
JRC TECHNICAL REPORTS

European wildfire danger and
vulnerability in a changing climate:
towards integrating risk dimensions
                   JRC PESETA IV project
                   Task 9 - Forest fires

                   Costa, H., de Rigo, D., Libertà, G.,
                   Houston Durrant, T., San-Miguel-Ayanz, J.

                   2020

                                                         EUR 30116 EN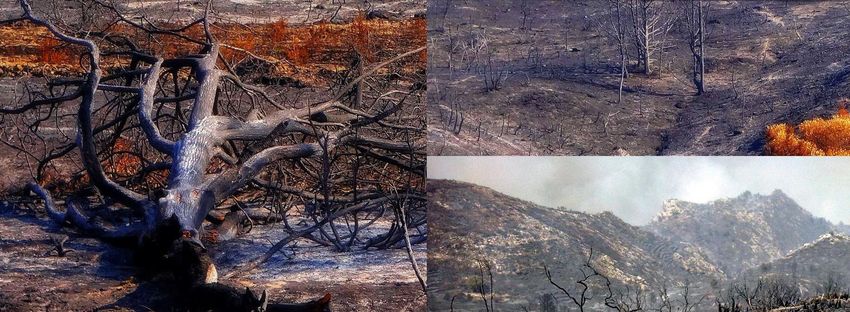
This publication is a Technical report by the Joint Research Centre (JRC), the European Commission’s science
and knowledge service. It aims to provide evidence-based scientific support to the European policymaking
process. The scientific output expressed does not imply a policy position of the European Commission. Neither
the European Commission nor any person acting on behalf of the Commission is responsible for the use that
might be made of this publication. For information on the methodology and quality underlying the data used in
this publication for which the source is neither Eurostat nor other Commission services, users should contact
the referenced source. The designations employed and the presentation of material on the maps do not imply
the expression of any opinion whatsoever on the part of the European Union concerning the legal status of any
country, territory, city or area or of its authorities, or concerning the delimitation of its frontiers or boundaries.

EU Science Hub
https://ec.europa.eu/jrc

JRC119980

EUR 30116 EN

  PDF        ISBN 978-92-76-16898-0          ISSN 1831-9424        doi:10.2760/46951

Luxembourg: Publications Office of the European Union, 2020

© European Union, 2020

The reuse policy of the European Commission is implemented by the Commission Decision 2011/833/EU of 12
December 2011 on the reuse of Commission documents (OJ L 330, 14.12.2011, p. 39). Except otherwise noted,
the reuse of this document is authorised under the Creative Commons Attribution 4.0 International (CC BY 4.0)
licence (https://creativecommons.org/licenses/by/4.0/). This means that reuse is allowed provided appropriate
credit is given and any changes are indicated. For any use or reproduction of photos or other material that is
not owned by the EU, permission must be sought directly from the copyright holders.

All content © European Union 2020, unless otherwise specified

How to cite this report: Costa, H., de Rigo, D., Libertà, G., Houston Durrant, T., San-Miguel-Ayanz, J.,
European wildfire danger and vulnerability in a changing climate: towards integrating risk dimensions,
EUR 30116 EN, Publications Office of the European Union, Luxembourg, 2020,
ISBN: 978-92-76-16898-0, doi:10.2760/46951, JRC119980
Contents

Executive summary .......................................................................................                5

1 Introduction ............................................................................................ 10

2 Methodology ........................................................................................... 16

3 Results .................................................................................................. 24

   3.1 Changing frequency of fire danger classes due to climate change ....................... 24

   3.2 Vulnerable vegetation due to climate change ............................................... 27

   3.3 Vulnerable population by proximity to wildland fuels ...................................... 31

4 Conclusions ............................................................................................ 32

   4.1 Adaptation options .............................................................................. 33

Annexes .................................................................................................... 35

   Annex 1: on computational modelling, methods and data ...................................... 35

References ................................................................................................. 45

List of abbreviations and definitions .................................................................... 52

List of Figures.............................................................................................. 56

List of Tables ............................................................................................... 57

    The designations employed and the presentation of material on the maps in this publication do not imply the expression
of any opinion whatsoever on the part of the European Union concerning the legal status of any country, territory or area
or of its authorities, or concerning the delimitation of its frontiers or boundaries.
     Conventions for hyperlinks: hyperlinks to external sources (internet links) are highlighted in blue. Internal links to
parts of this document (e.g. cross-links to figures, tables, references, sections) are highlighted in brown. Abbreviations
listed in the List of abbreviations and definitions are highlighted with a grey background . Each title of a section or
subsection is an active cross-link to this page of Contents.
   Images in the front cover: left and top right, wildfire in Rhodes, Greece – adapted from an image authored by Alan
Eng (CC-BY) http://preview.tinyurl.com/flickr-alaneng-14151661831. Bottom right, wildfire in Alicante, Spain – adapted
from an image authored by Sergio Jordá Gregori (CC-BY) http://preview.tinyurl.com/flickr-sergiojorda-17666900792.

                                                            3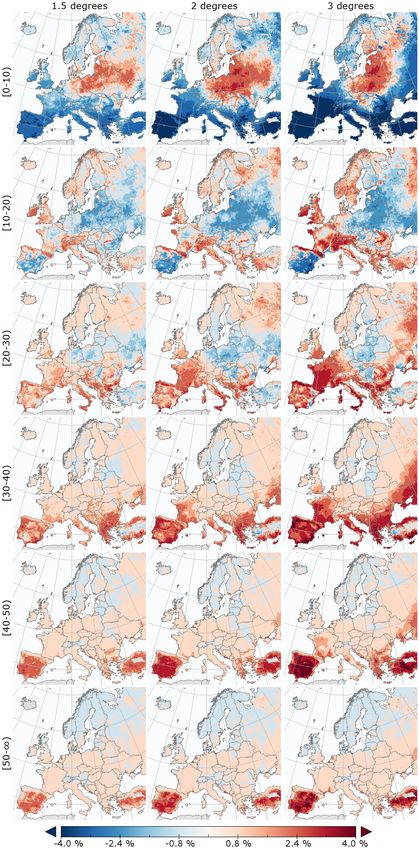
Acknowledgements

This publication benefited from the peer-review of the PESETA IV project1 with the comments
and suggestions of its advisory board and the other external referees.

We acknowledge the World Climate Research Programme’s Working Group on Regional Climate,
and the Working Group on Coupled Modelling, former coordinating body of CORDEX and respon-
sible panel for CMIP5 . We also thank the climate modelling groups (listed in Table 1 of this
document) for producing and making available their model output.

We also acknowledge the Earth System Grid Federation infrastructure, an international effort led
by the U.S. Department of Energy’s Program for Climate Model Diagnosis and Intercomparison,
the European Network for Earth System Modelling and other partners in the Global Organisation
for Earth System Science Portals (GO-ESSP) .

Authors

Hugo Costa 1,2,3 a iD ,                   1
                                              European Commission, Joint Research Centre (JRC),
Daniele de Rigo 4,5 iD ,                  Ispra (VA), Italy
Giorgio Libertà 1 iD ,                    2
                                              Direção-Geral do Território,
Tracy Houston Durrant 6 iD ,              Lisbon, Portugal
Jesús San-Miguel-Ayanz 1 ∗ iD
                                          3
                                              Universidade Nova de Lisboa,
                                          NOVA Information Management School (NOVA IMS) ,
                                          Lisbon, Portugal

                                          4
                                              ARCADIA SIT s.r.l
                                          Vigevano (PV), Italy

                                          5
                                              Maieutike Research Initiative,
                                          Integrated Natural Resources Modelling and Management (INRMM hub) ,
                                          Milan (MI), Italy

                                          6
                                              Engineering Ingegneria Informatica S.p.A.
                                          Ispra (VA), Italy

                                          ∗
                                              Corresponding author: jesus.san-miguel@ec.europa.eu
                                          a
                                            HC was affiliated with the European Commission, Joint Research Centre when
                                          the research began. He is currently affiliated with Direção-Geral do Território
                                          and Universidade Nova de Lisboa.

Please, cite as:

Costa, H., de Rigo, D., Libertà, G., Houston Durrant, T., San-Miguel-Ayanz, J., 2020. European
wildfire danger and vulnerability in a changing climate: towards integrating risk
dimensions. Publications Office of the European Union, Luxembourg, 59 pp.
ISBN:978-92-76-16898-0 , https://doi.org/10.2760/46951

  1 https://ec.europa.eu/jrc/en/peseta.

                                                              4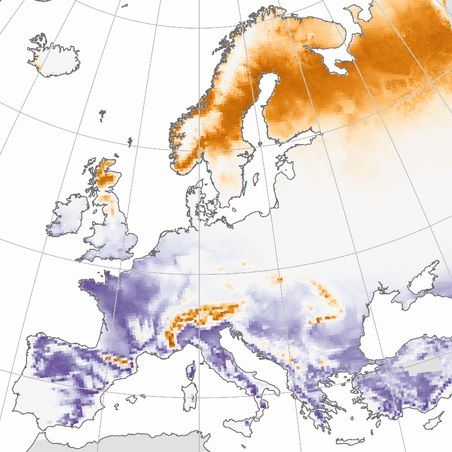
Executive summary

In Europe, forests cover over one third of the land area, but the continent is characterised by
high fragmentation of land cover, with complex patterns of human settlements and land uses,
where populated areas are frequently found close to wildland. This human-nature interface may
be due to either expansion of wildland (for example on abandoned agricultural areas) or to the
extension of settlements in areas previously characterised by a high proportion of wildland. Con-
sequently, wildfires have a great impact on agricultural resources and urban settlements, with
critical consequences for the safety and health of citizens, the safeguard of economic assets and
the provision of essential services from fire-damaged ecosystems. Furthermore, climate change
may directly change fire regimes in Europe and globally and affect the biophysical conditions of
ecosystems so that, in some areas of Europe, the current vegetation structure might become
irrecoverable after fire damage.

Wildfires: interactions among changing weather, vegetation and human factors

Several factors are important to understand the variable distribution and damage of wildfires
and prepare for practicable adaptation options. Weather and climate, vegetation condition and com-
position, and human factors play an essential role in fire regimes. Weather and climate define the
composition and structure of vegetation fuels. Although human activities and vegetation manage-
ment shape the actual state of vegetation fuels, their typology is subject to the general ecological
domains in which they exist. Additionally, weather effects can strongly influence the susceptibility
to fire of vegetation fuel. Weather can control the moisture content of the vegetation, allowing
a rapid wetting or drying of fine fuel (litter, needles, mosses, twigs), while having a slower re-
sponse on coarser wooden fuels. The moisture level in these different fuels, along with weather
factors such as wind speed, affect the ease of ignition, potential propagation and severity of a
fire.

Extremes of fire danger and damage               In Europe, the number of days with high-to-extreme
wildfire danger is expected to increase with the changing climate. Wildfire risk can be identified
as the joint effect of the level of wildfire danger in a given area, and its potential impact for
citizens. Under climate change, specific components of wildfire risk may be expected to increase
in various European areas [35, 75, 93], raising the impact for the people and ecosystems exposed
in vulnerable areas. As a main component of risk, wildfire danger is linked with the factors,
including weather and climate, which can worsen either the likelihood of ignition, or the behaviour
of the fire once ignited. Nevertheless, weather conditions alone cannot precisely predict where
wildfires will be ignited. In Europe, the vast majority of fires are caused by human actions [35].
These actions are related to socio-economic aspects which are difficult, if not impossible, to be
quantitatively modelled especially under climate-change scenarios. However, not all the ignited
fires have the same impacts. What weather and climate may help to predict is the behaviour
component of the fire danger, that is, the potential spread and intensity of fires once they are
ignited; particular weather conditions of high temperature, low relative humidity and fast wind
speed facilitate the spread of uncontrollable fires. In addition to weather conditions, other factors
such as fuel types and topography determine the conditions of fire spread. Two wildfires ignited
in the same place, but under different weather conditions, may result in very different levels
of damage. The distribution of wildfires in Europe and the damage they may generate is remarkably

                                                 5
variable, with 65 % of the overall area burnt caused by only 1.2 % of the European fires, and a very
small share of the total number of fires (less than 0.3 % of wildfires) causing more than 40 % of the
annual burnt area. These extreme fire events show a strong connection with co-occurring extreme
conditions of fire danger, as a fire ignited when fire danger conditions are particularly unfavourable
may become uncontrollable and cause major damage. In Europe, these extremes of fire danger may
be expected to increase significantly with the changing climate (see Figure 1).

                                     1.5 degrees                       2 degrees                        3 degrees
                                     (additional days/year – compared with present – with high-to-extreme fire danger)
       High-to-extreme fire danger

Figure 1: Number of days per year with high-to-extreme fire danger (daily FWI ≥ 30). Additional days per year
with high-to-extreme fire danger, with reference to the situation in the control period 1981-2010, for different levels of
global warming. Red shades denote an increment of days, blue shades a decrement. See Figure 10 and Figure 11 for
more details.

The intensity of wildfire danger is summarised by assessing the changes in the frequency of
different classes of danger (from relatively low values of danger up to higher values linked with
extreme fire danger)2 . Fire danger is determined by the overall combination of precipitation,
temperature, wind, and humidity patterns, and their climatic changes. The effect of weather
on fuel and vegetation complexes are discussed in the next section. In Mediterranean Europe,
an increasing number of days per year is predicted in the higher danger classes (from high to
extreme fire danger) under future climate scenarios. A marked increase is predicted of days with
high-to-extreme fire danger in the Iberian Peninsula, Turkey, along with part of Greece and the
Balkans, part of central and southern Italy, and of France. Although the projected worsening of
fire danger is smaller with 1.5 °C global warming, relative to 2 °C or 3 °C warming, fire danger
is still predicted to be consistently worse than at present, as fuels will transition to drier fuel
complexes under future climate scenarios, more prone to forest fires. The areas with increased
high-to-extreme fire danger are notably expanded (see Figure 1) at 1.5 °C. This expansion is
further increased at 2 °C and even more at 3 °C.

Other European regions show consistent worsening patterns. Southern UK, Belgium, part of
the Netherlands and Germany, and the Pannonian Basin enclosed by the Carpathians and the
Transylvanian Plateau display an increasing number of days with high-to-extreme fire danger.
This is more evident in the 2 °C than in the 1.5 °C warming scenario, and is projected to worsen
in the 3 °C warming scenario.
   2 Six equi-spaced classes of increasing fire danger by weather , monitoring the expected evolution under climate change

of the annual number of days falling within each class of danger. This ranges from the number of low-danger days (lowest
class of danger) up to the number of extreme-danger days (highest class of danger). See Figure 10 and Figure 11 for
more details.

                                                                           6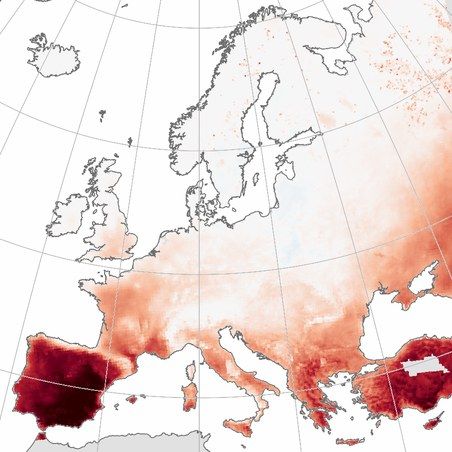
1.5 degrees               2 degrees                          3 degrees
        Boreal
       Temperate
       Subtropical
       Tropical

                     Contraction                                                                         Expansion

Figure 2: Areas bioclimatically more vulnerable for the exposed vegetation. Shifting components of the vegetation
ecology (ecological domains: Tropical, Subtropical, Temperate, and Boreal) in relation to vegetation fuel complexes in
Europe. The figure shows the expected change in the future scenarios, compared to 1981-2010. Darker colours (either
brown or violet) indicate a higher stress to the vegetation currently established in a given area, due to a stronger change
of the prevalent ecological domain. A substantial shifting of all the domains towards North is expected. This results in a
substantial contraction of the Boreal domain, as the Temperate domain shifts North. The Subtropical domain is expected
to expand around the Mediterranean region, and to contract in extreme Southern areas of the Mediterranean region,
where the Tropical domain, currently absent in Europe, is expected to appear and possibly become a significant ecological
component. From [27]: see Figures 9, 12, and 13 for more details.

                                                            7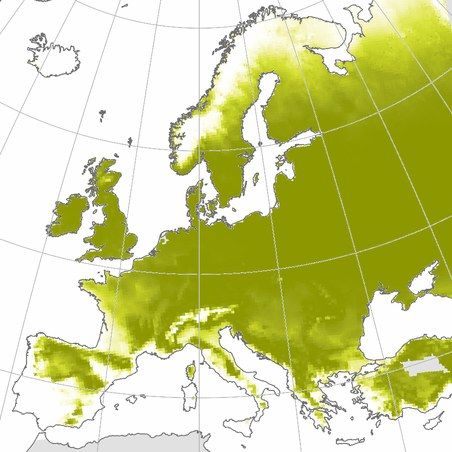
Changing ecosystem vegetation, fuel and resilience                  Climate change is expected to exert
a direct influence on the structure and composition of terrestrial ecosystems. This may affect
wildland vegetation (forests, shrub and grassland) with changes in the spatial distribution of the
future ecological zones, their typical plant associations, and corresponding fuel characteristics.
This may include negative effects not only on the vegetation before a fire occurs; but also after the
fire, diminishing its resilience and thus limiting the vegetation recovery (post-fire recovery).

In particular, the risk posed by wildfires in a specific area may rise with increasing levels of fire
danger and vulnerability. This may happen due to the effect on vegetation of the changing cli-
mate, which may introduce an important stress factor. Areas with higher climate-driven stress
are susceptible to higher degradation of the local vegetation. In these areas, the accumulation
of dead woody debris on the ground may directly affect the spread and intensity of fires, and
raise the overall fire risk. In addition, vulnerability to fires may worsen further because of declin-
ing ecosystem resilience, which may hamper the regrowth of existing species and lead to unwanted
ecosystem transitions. This might trigger a chain of disruptions in the services provided by the
affected ecosystems.

Figure 2 summarises the expected changes of the prevalent ecological domains (European ecolog-
ical domains: Tropical, Subtropical, Temperate, and Boreal, following the global FAO definition
[49] ) in relation to vegetation fuel complexes. Elements of a fuel complex include the tree canopy,
the understorey vegetation, along with ground material from the decomposition and regeneration
processes. Pronounced variations of the ecological domains due to the changing climate may help
identify, with a uniform criterion at the continental scale, areas in which the current vegetation
is highly vulnerable. However, even a relatively small change in the ecological domain pattern
may still be associated with a high local change of vegetation vulnerability. Major changes of the
ecological domains will surely induce a major stress on the structure and composition of vege-
tation fuels, leading to changes in the vegetation vulnerability to fire, which may worsen under
changing climate.

A substantial shift of all the domains towards North is expected, along with the appearance in
Europe of climatic features specific to the Tropical domain, namely in extreme Southern areas of
the Mediterranean region. Most intense changes in the ecological domains appear to concentrate
in the Mediterranean region and in the southern part of both the current temperate and boreal
domains. The intensity of change appears to increase when comparing the 1.5 °C global warming
scenario with the 2 °C and 3 °C scenarios, with a remarkable stability of the patterns between
different scenarios.

Vulnerable interfaces between human settlements and wildland                      The climatic effects
on the vegetation and the potential decrease of the ecological resilience, describe an important
dimension of the vulnerability to wildfires. Another key component is directly linked to identifying
in which areas the exposed population is most vulnerable to forest fires. Climate-driven changes of
fire regimes will potentially affect European citizens, in particular where human settlements are close
to wildland areas. In this vulnerable interface between wildland and urban presence (the so-called
Wildland-Urban Interface, WUI), the risk of fire may be especially high for the population [100,
108, 54].

A key vulnerability nexus between human presence and wildfire risk. Two main components link
the human presence in the vulnerable interface with the resulting overall risk. Most of the fire
ignitions are linked to human actions, which are frequent in the WUI. Furthermore, most of the

                                                  8
Wildland-urban interface (WUI):         Vulnerable population: Number of       Vulnerable population: Percentage
Percentage of land area which lies in   people living in the WUI (ensemble     of population living in the WUI
the WUI (ensemble median, by            median, by spatial cell).              (ensemble median, by spatial cell),
spatial cell).                                                                 compared with the total people (also
                                                                               outside the WUI).

Figure 3: Vulnerable population by proximity to wildland fuels. Vulnerable interface between wildland and urban
presence (Wildland-Urban Interface, WUI), where the risk of fire may be especially high for the local population. The
spatial extension of the interface is illustrated (map at left), along with the amount of population more vulnerable to
wildfires because of living in the interface (maps at the centre and right).

burned areas in the Mediterranean region occur within or next to WUI areas. This may be defined
as an active role of the WUI in increasing the fire risk. The second component of WUI population
vulnerability is a passive consequence of the increased risk. Once a given fire is ignited close to
the WUI, neighbouring locations are also threatened. This means that the population living in the
WUI are more vulnerable to wildfires (see Figure 3).

                                                          9
1 Introduction

An overview of wildfire damage in Europe           Forests cover about 215 million ha in Europe
and an additional 36 million ha are covered by other wooded lands; this is over a third of the
total land area [30, 1]. To this area, shrubland and grassland may be added to encompass the
extent of European areas with an important component of wild land.

In recent years, large forest fires have repeatedly affected Europe, in particular the five Mediter-
ranean countries Portugal, Spain, Italy, Greece and France (part of the Mediterranean region of
the European Union, EU-Med ), which on average account for around 85 % of the total burnt area
in Europe per year ( [35] see Figure 4). In these five countries, the average damage between
1999 and 2016 was more than 400 thousand ha, and higher than 700 thousand ha one year in
five. In 2017, the worst year for the last two decades, the total annual burnt area of Portugal,
Spain, and Italy alone exceeded 0.8 million ha. Other countries of the region (for which less
data are available and with higher uncertainty) also suffer from a substantial annual damage by
wildfires.

In Figure 5 and Figure 6, an overview is offered of burnt area in hectares across Europe and
the Middle East. Figure 5 shows the statistics in the European Union for the years 2007-2017
(estimates from satellite images of fires of over 30 ha, as mapped by the European Forest Fire In-
formation System, EFFIS ). Figure 6 shows the corresponding statistics for the available countries
outside the European Union, for the years 2009-2017.

The inadequacy of average trends to fully capture the dynamics of extremes                In the
previously mentioned five EU-Med countries, there has been overall a slight downward trend since
the 1980s in terms of reported burnt area in forests and other wooded land. The number of fires

Figure 4: An official source of fire damage in Europe: country-reported data from the Fire Database of the European
Forest Fire Information System (EFFIS) [9, 94]. Annual burnt area (relative proportion) of five EU-Med countries (France,
Greece, Italy, Portugal, Spain) and of 12 other countries (Bulgaria, Croatia, Finland, Germany, Latvia, Lithuania, Poland,
Romania, Slovakia, Sweden, Switzerland, Turkey). Percentage of burnt area per year, where 100 % represents the total
annual burnt area of all the 17 countries. Derived after de Rigo et al. ( [35] see in particular fig. 4 and 5).

                                                           10
Figure 5: Another harmonised and independent source of fire damage in the European Union, from the European For-
est Fire Information System (EFFIS) . Overview of total burnt area for the years 2007-2017 from satellite images of
fires of over 30 ha mapped by EFFIS. Countries are ordered by total size of burnt area over this period. Note that the
burnt area mapped for Portugal in 2017 exceeds the combined total for all countries in all except one of the previous
10 years. Country names with size proportional to the order of magnitude of the total burnt area. Image adapted from
San-Miguel-Ayanz et al. [95].
reported over the same interval show a slightly more complex rise and fall pattern that may also
be linked to an improvement in reporting the smaller fires during the 1990s [94]. This promising
decreasing trend of burnt area in the Mediterranean Europe has been linked with the progress in
fire management and prevention [104].
However, “extreme” years where the total burnt exceeds the average by a significant margin
happen every 2-5 years. In Figure 5, it may be noted that the burnt area mapped for Portugal
along in 2017 exceeds the combined total for all countries in all except one of the previous 10
years. Perhaps counterintuitively, a run of years with fewer or smaller fires may result in a
build-up of fuel leading to more extreme fires in bad years, if aggressive fuel management is
not undertaken [4], meaning that looking only at multi-year averages may mask the underlying
patterns.
As Figures 4, 5, and 6 highlight, these patterns are specific to the local characteristics of each
11Figure 6: Fire damage across Europe and the Middle East (available countries outside the European Union, see also
Figure 5), from the European Forest Fire Information System (EFFIS) . Overview of total burnt area for the years 2009-
2017 from satellite images of fires of over 30 ha mapped by EFFIS. Countries are ordered by total size of burnt area over
this period. Country names with size proportional to the order of magnitude of the total burnt area. Image adapted from
San-Miguel-Ayanz et al. [95].
European region. At the country (and sub-country) level, human aspects may be uneven. Dif-
ferences in the availability and allocation of fire-fighting resources, in the local strategies for fire
prevention and management of fuel, and also in the population behaviour, may mark comparably
different responses to fire danger and ignition, which may reverberate into variable patterns of
fire damage. All these human-related elements are very challenging to model, given the system-
atic lack of harmonised information on them. In addition, at the local scale differences in the
typology and fragmentation of land cover, and in the local vegetation distribution and structure,
may further exacerbate the variability of fire damage patterns.
A fragmented European wildland and its interface with urban areas Europe is densely
populated, with about 3 % of world land hosting almost 7 % of the world population [31, 43]. The
continent is characterised by high fragmentation of its land cover and uses, with intricate patterns
related to the density and distribution of human settlements and activities, and populated areas
are frequently found close to wildland. It comes as no surprise that the important role of human
activity (whether accidental, negligent or deliberate) is one of the most common causes of fire
12[55, 35]. Changing socio-economic conditions in several regions may result in a change in the
local land use, with agriculture abandonment and unmanaged re-vegetation of areas that are
close to human settlements and which were previously characterised by more favourable fuel
conditions [78, 76]. On the other hand, the fragmented borders of some large urban settlements
are expanding over areas previously occupied by important share of wild land. Both phenomena
lead to a relevant interface between wildland and urban areas (the so called Wildland-Urban Inter-
face, WUI : see the corresponding part in the methodology section) which is especially vulnerable
to fire hazard [98]. As a consequence, fires in European forests and wildland also have a great
impact on agricultural resources and urban settlements, with critical consequences for the safety
and health of citizens, the safeguard of economic assets and of the provision of essential services
from fire-damaged ecosystems. At regional, national, and sub-national level, the spatial extent
of this WUI interface was investigated in several studies with different methodologies, data and
assumptions [59, 51, 40, 69, 70]. Here, a preliminary harmonised overview of the distribution in
Europe of the wildland-urban interface is presented for the first time at a high spatial resolution
[17]. This result is based on the combination of pan-European land cover [7, 8] and global
high-resolution information on human settlements [80].
The key role of weather and climate on fire danger and large fires In addition to the
direct human role in the changing patterns of wildfire, the indirect role of the climate and of its on-
going change exerts a clear influence on the weather-driven danger of fire. The projected trends
of burnt area under climate change scenarios have been estimated as largely increasing [97],
although “complex relationships between climate, vegetation and fires hamper the applicability
of fire impact models to conditions that are very different from the current ones” [103]. Extreme
weather events, such as prolonged dry spells and droughts, or intense dry wind, are expected to
increase in frequency with the changing climate (for a literature overview, see [35] ). In 2017
[75], there were unusually high fire levels during the fire season in many parts of the world, with
extensive and severe fires occurring in Chile, the Mediterranean, Russia, the US, Canada and even
Greenland. In Europe, the mapped burnt areas of fires over 30 ha in 2017 was almost 1 million
hectares (993600 ha) compared with a 2008–2016 average of around 213,000 ha [95]. Climate
is just one of many factors influencing wildfire risk, but negative climatic conditions enable fires
to take hold and spread quickly. In a high fire year the number of fires do not necessarily increase
by much but the difference is in the severity and size of the burn area resulting from fires once
started.
The specificity of wildfires as a natural hazard It is here important to understand why
wildfires as a natural hazard do not necessarily show the typical saturation which may be observed
in other hazards. For example, floods or windstorms may inflict severe damage in areas directly
hit by an extreme event. However, although precipitation and wind energy are key driving factors
of the disturbance (flood or windstorm), which may be subject to cumulative effects and delayed
impacts (e.g. from water runoff), these effects are fortunately not self-sustaining. Analogously,
dry or windy weather conditions may be key factors for the spread of a fire once ignited.
However, a key fact to understand about wildfires is that they can be a self-sustaining phe-
nomenon which is linked with the amount of fuel available to burn, and which may spread far
from the initial ignition point under favourable weather conditions. The energy and spread of a
wildfire is connected with both the biomass it can enter in contact with and effectively burn, and
the weather or climatic conditions. The distribution of wildfire events in Europe is uneven and
confirms the key role of the most extreme events in the overall damage by fire. Only 3.6 % of the
wildfires recorded by the Fire Database of EFFIS have an area burnt greater than 30 hectares.
13However, they contribute to more than 79 % of the total burnt area. Larger fires are even less
frequent, but their damage is outstanding. 1.2 % of the fires exceed 100 ha, and less than 0.3 %
is greater than 500 ha, respectively contributing to 65 % and 40 % of the overall burnt area.
Only less than 0.1 % of the wildfires spread for over 1000 ha: this very small percentage alone is
responsible for 30 % of the damaged area in Europe. This prompts us to investigate the factors
behind these extreme events [35].
Weather conditions and European large fires A number of factors contribute to forest fire
ignition, including vegetation conditions and composition, as well as human behaviour. However,
weather and climate are considered to be among the main factors influencing wildfire potential,
and they also influence some of the other factors. For example, rainfall amounts and patterns
affect the moisture content of leaves on the ground’s surface and of the deeper layers of organic
matter. Dryer or wetter surfaces can change the potential spreading of a fire and also the ease
of ignition. Climate variables such as wind speed are also important because they can affect the
rate at which a fire might spread following ignition.
In the Mediterranean areas of Europe, precipitation and soil moisture appear among the most
important factors associated with spatial patterns of fire occurrence. Fernandes et al. [45]
correlated large wildfires in Portugal with forest areas subject to extreme weather conditions,
combined with high fuel hazard and subsequent fast fire spread. Ruffault et al. [88] found two
categories of weather-driven large wildfires: those driven by strong winds and dry air conditions
(i.e. the wind-forced mode of Hernandez et al., 2015a, 2015b) and the others occurring with
comparatively weak winds but hotter weather. In Greece, Karali et al. [60] underlined the impact
of high temperature and wind speed on critical fire danger, while Founda and Giannakopoulos
[50] linked the extensive and destructive forest fires that occurred in Greece during 2007 with
the extreme hot summer and a co-occurring prolonged drought. In Italy, Cardil et al. [10] found
a clear relationship between high-temperature days and burnt area due to large wildfires. In
Spain, De Luı ́ s et al. [19] suggest that a decrease in the average annual precipitation may have
increased the fire frequency and the areas of higher fire danger, with potential repercussions on
soil degradation and desertification patterns. If several of these factors coincide the effects are
likely to be magnified. It is worth noting that on the “worst day of the year” in Portugal, 15 October
2017 [4], weather and climate hazards came together with a prolonged drought coinciding with
the very strong winds associated with Hurricane Ophelia. The result was fire activity not seen
before in Europe: a greater area burnt in one day than had occurred during the rest of the year,
the largest pyro-convective phenomenon3 recorded in Europe so far and the largest in the world
in 2017 [57].
Effects of climate change on vegetation, and implications for fire vulnerability In
addition to the direct fire danger driven by weather conditions, the potential impact of a fire
ignition may be magnified by the conditions of the threatened vegetation. Vegetation fuel may be
characterised by variable moisture, with different behaviour of fine materials and coarse wooden
fuels (on this, see in the following methodology section the part describing a standardised index
of fire danger by weather). Under climate change, the hazard will become higher than at present,
which means adaptation strategies are needed to avoid an increase in the devastating effects of
forest fires on ecosystem functioning and biodiversity. Unfortunately, the functions and services
provided by an ecosystem might not be so easily recovered after major fire damage. Even for
3 Pyro-convection can be generally defined as the transfer of heat by the circulation or movement of the local heated
air (along with other fire emissions and smoke); in particular, it is the vertical transport of atmospheric properties driven
by or enhanced by fire. For an introduction, see Charney and Potter [13].
14supposedly less complex ecosystems, such as a grassland, the speed of the post-fire recovery may
be largely overestimated. Just one year after a fire, a grassland may appear to be green again.
However, the new vegetation may be quite different from the original. Several stages of ecological
succession may follow the first vegetation regrowth, with variable temporarily dominant species
(and potentially worse temporary fuel characteristics) until the original ecosystem is recovered.
Therefore, even a grassland may require several years to re-establish the balanced ecosystem
functions and services provided before the fire. The example applies even more demandingly to
forest ecosystems.
Human intervention may assist the post-fire restoration of valuable ecosystems and of their im-
paired services. For example, young exemplars of the main tree species may be planted to
accelerate the vegetation regrowth in a burnt forest area. However, this assisted restoration is
only a first step for the original ecosystem services to be recovered – even assuming that climate
change is not affecting the process. The frequency of fires is also an important parameter to
understand whether a certain ecosystem may be able to recover. Multiple wildfires may occur
in the same area, every time breaking the natural process of the ecological succession towards
the pre-existing ecosystem. Sometimes, this may eventually lead to an entirely new ecosystem
being established instead of the original one. Climate change may aggravate this phenomenon,
making originally typical plant species no more suited to live in the changed bio-climatic condi-
tions. This would impede the re-establishment of the original ecosystem even if the fire damage
were not recurrent in the area. Since the resistance to bio-climatic fluctuations of a mature
healthy ecosystem is usually greater than the resilience of a damaged ecosystem (e.g. due to
fire damage), wildfires might be triggering broader transitions in ecosystems already declining
due to climate change [36, 87, 85, 41, 102].
The vulnerability of a specific plant species to the changing climate might not be easily related
with the overall stress to which the whole vegetation assemblage is subject. Several vegetation
species contribute to the composition of those ecosystems suitable to thrive in a given ecological
zone, and the dominant weather and climatic conditions exert a strong effect not only on the
composition, but even on the structure of vegetation (i.e. the layers of trees, shrubs and under-
storey plants) [30, 34, 82]. As a consequence, aggregated comprehensive indices are essential
(rather than focusing on species-specific details) to support the detection of where the changing
bio-climatic conditions are expected to increase the cumulative stress in several species belong-
ing to a certain vegetation assemblage. In the following methodology section, an aggregated
index is discussed to summarise the climatic shift of the main ecological domains as defined by
FAO [49, 29, 34] and delineate the emerging areas of potential combined vulnerability of several
vegetation components.
152 Methodology
In the research performed within the third instance of the PESETA research [35], robust statistics
were introduced to estimate the potential evolution under climate change of the the fire danger
extremes. These statistics were designed to analyse the higher quantiles of danger, also providing
an assessment of the robustness of estimated climate-driven change, by assessing the agreement
among models on whether the predicted difference between future and control period ( anomaly )
was positive. In this work, a similar modelling methodology is extended to complement the
previous results [35] with new data-transformation statistics computed based on the percentage
of days above a given threshold of fire danger (classes of weather-driven danger).
The vegetation potentially exposed to wildfires in Europe spans over three main ecological do-
mains of the five classified by FAO [49]. The local ecological patterns of European vegetation can
show dominant characteristics belonging to the boreal, temperate, or subtropical domain. In ad-
dition to the dominant ecological domain, each area may show ancillary components from other
domains (for example, a temperate area with a secondary subtropical component). When – due
to climate change – a secondary/absent component becomes dominant, or vice-versa, then the
local vegetation fuels, their structure and composition, are stressed to shift not simply to adjust
their within-domain ecology, but instead to move into a completely new ecological domain – an
indication of major climate-driven vulnerability.
Finally, the European population potentially exposed to wildfires includes densely populated areas
where smoke and air-pollution by fires may affect citizens (with respiratory and other health
impacts [16, 84, 110, 6, 48] ) even quite far from where the fire emissions were originated.
However, some settlements have a direct interface with potentially burnable wildland, and the
population in these areas is more vulnerable to increased ignition and subsequent local spread
of wildfires. Here, an outline is presented on how to detect these more vulnerable areas for the
exposed population.
Climate change models
The European climate analysis is based on the outcomes of the JRC PESETA III project [35],
where a high-emission scenario was considered following the corresponding concentration tra-
jectory adopted in the Fifth Assessment Report by the IPCC [64, 71, 105, 99]. This scenario
focuses on a Representative Concentration Pathways (RCP) for which radiative forcing increases
throughout the 21st century up to reach a high value (an approximate level of 8.5 W per m2 ) by
end of the century. In addition, a scenario with mitigated emission pathway ( RCP 4.5 scenario)
is also considered. Results focus on different global warming levels, compared with pre-industrial
conditions. In particular, 1.5 °C, 2 °C, and 3 °C of global warming are assessed. Due to technical
incompatibilities and consequent unacceptably high computational uncertainty, some runs are
excluded from specific parts of the current analysis (See Tables 1, 2, 3).
Table 1 shows the institutions and acronyms associated with the global circulation models and
the regional climate models which define the EURO-CORDEX climate-projection realisations con-
sidered in this study. Table 2 provides an overview of codes associated with each EURO-CORDEX
model run, along with the corresponding institutions, Regional Climate Models (RCMs) and driv-
ing Global Circulation Models (GCMs) . Finally, Table 3 summarises the time intervals associated
with each period (hereinafter abbreviated as per ) considered in the cluster of sectoral analyses
16Table 1: Institutions and acronyms associated to the global circulation models and the regional climate models which
define the EURO-CORDEX climate-projection realisations (model runs) considered in this study [35, 39].
Acronym Institution name
CLMcom Climate Limited-area Modelling Community
CNRM/CERFACS Météo France, Centre National de Recherches Météorologiques - Centre Européen de
Recherche et de Formation Avancée en Calcul Scientifique
DMI Danish Meteorological Institute
EC-EARTH EC-Earth Consortium
ICHEC Irish Centre for High-End Computing
INERIS Institut National de l’Environnement Industriel et des Risques
IPSL Institut Pierre-Simon Laplace
KNMI Royal Netherlands Meteorological Institute
MOHC Met Office Hadley Centre
MPI-M Max Planck Institute for Meteorology
SMHI Swedish Meteorological and Hydrological Institute, Rossby Centre
Table 2: Short codes associated to each EURO-CORDEX climate-projection realisation (model run, abbreviated as mod )
considered in this study, and corresponding institutions, Regional Climate Models (RCMs) , driving Global Circulation
Models (GCMs) , and acronyms (RCM-GCM). The first five models (A-E) were used as core models in the third instance of
the PESETA series [35].
Code (model run mod ) Institution(s) Regional Climate Model Driving Global Circulation Model Acronym
A CLMcom CCLM4.8-17 (R1) CNRM-CERFACS-CNRM-CM5 (G1) R1-G1
B CLMcom CCLM4.8-17 (R1) ICHEC-EC-EARTH (G2) R1-G2
C IPSL-INERIS WRF331F (R3) IPSL-IPSL-CM5A-MR (G4) R3-G4
D SMHI RCA4 (R5) MOHC-HadGEM2-ES (G5) R5-G5
E SMHI RCA4 (R5) MPI-M-MPI-ESM-LR (G3) R5-G3
F CLMcom CCLM4.8-17 (R1) MPI-M-MPI-ESM-LR (G3) R1-G3
G DMI HIRHAM5 (R2) ICHEC-EC-EARTH (G2) R2-G2
H KNMI RACMO22E (R4) ICHEC-EC-EARTH (G2) R4-G2
I SMHI RCA4 (R5) CNRM-CERFACS-CNRM-CM5 (G1) R5-G1
J SMHI RCA4 (R5) ICHEC-EC-EARTH (G2) R5-G2
K SMHI RCA4 (R5) IPSL-IPSL-CM5A-MR (G4) R5-G4
within the PESETA IV project – to which this study belongs. The array of time intervals associated
with the future periods with nominal global warming 1.5 °C, 2 °C, and 3 °C is heterogeneous even
within each period. In particular, not all the corresponding model time-intervals begin after the
conclusion of the Control period.
17Table 3: Time intervals associated to each climatic period considered in the cluster of sectoral analyses within the PESETA
IV project – to which this study belongs. The array of time intervals associated with the future periods with nominal
global warming 1.5 °C, 2 °C, and 3 °C is heterogeneous even within each period (see supporting information of [39] ). In
particular, not all the corresponding model time-intervals begin after the conclusion of the Control period (in red, periods
beginning within the Control period). For each model and scenario ( RCP 4.5 or RCP 8.5 ), the year is shown when the
GCM associated to the model projects the nominal global warming to exceed a threshold (1.5 °C, 3 °C, or 3 °C), compared
to pre-industrial levels. The first five models (A-E) for the high-emission scenario were used as core models in the third
instance of the PESETA series, as they encompass a high share of the overall modelling variability [35] (in bold). Due to
technical incompatibilities and consequent unacceptably high computational uncertainty, some runs are excluded from
specific parts of the current analysis. For those parts, the core set of models (referred as core models) was used instead
of the complete set.
1.5 °C global warming 2 °C global warming 3 °C global warming
RCP 4.5 RCP 8.5 RCP 4.5 RCP 8.5 RCP 8.5
Model CGM (years in the CGM (years in the CGM (years in the CGM (years in the CGM (years in the
code +1.5 °C clim. period) +1.5 °C clim. period) +2 °C clim. period) +2 °C clim. period) +3 °C clim. period)
A 2035 (2021-2050) 2029 (2015-2044) 2057 (2043-2072) 2044 (2030-2059) 2067 (2053-2082)
B 2033 (2019-2048) 2026 (2012-2041) 2056 (2042-2071) 2041 (2027-2056) 2066 (2052-2081)
C 2023 (2009-2038) 2021 (2007-2036) 2042 (2028-2057) 2035 (2021-2050) 2054 (2040-2069)
D 2021 (2007-2036) 2018 (2004-2033) 2037 (2023-2052) 2030 (2016-2045) 2051 (2037-2066)
E 2034 (2020-2049) 2028 (2014-2043) 2064 (2050-2079) 2044 (2030-2059) 2067 (2053-2082)
F 2034 (2020-2049) 2028 (2014-2043) 2064 (2050-2079) 2044 (2030-2059) 2067 (2053-2082)
G 2032 (2018-2047) 2028 (2014-2043) 2054 (2040-2069) 2043 (2029-2058) 2065 (2051-2080)
H 2032 (2018-2047) 2026 (2012-2041) 2056 (2042-2071) 2042 (2028-2057) 2065 (2051-2080)
I 2035 (2021-2050) 2029 (2015-2044) 2057 (2043-2072) 2044 (2030-2059) 2067 (2053-2082)
J 2033 (2019-2048) 2026 (2012-2041) 2056 (2042-2071) 2041 (2027-2056) 2066 (2052-2081)
K 2023 (2009-2038) 2021 (2007-2036) 2042 (2028-2057) 2035 (2021-2050) 2054 (2040-2069)
Fire danger by weather: frequency of days with higher danger
Weather influences the fire hazard by affecting the ease of ignition, rate of spread, fire intensity
and overall impact of wildfires. This may be represented quantitatively by exploiting a rating
index, known as fire danger by weather.
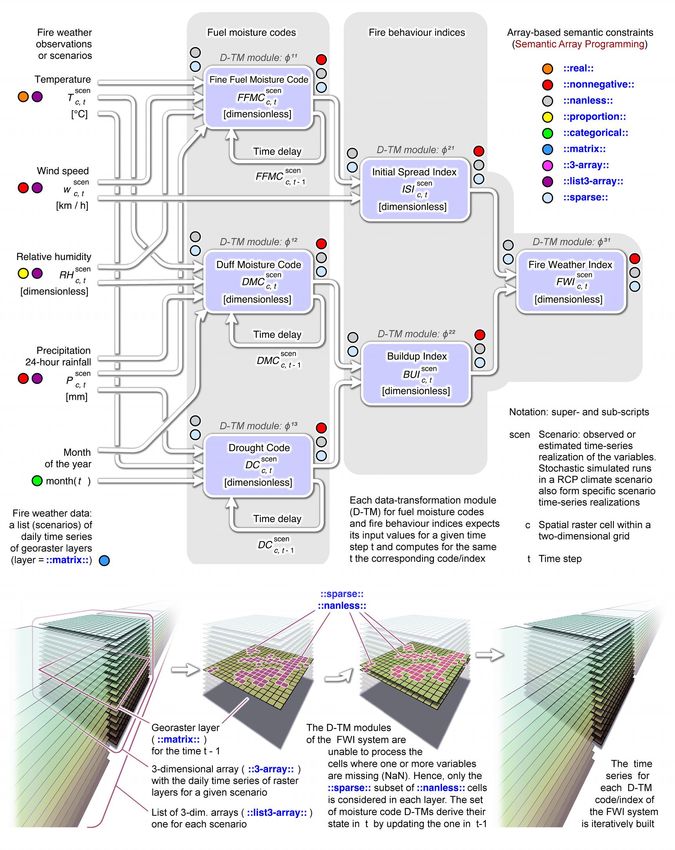
In this study, Canadian Fire Weather Index (FWI) system [106, 18, 67] is used to estimate
numerically the weather-driven fire danger. This is done on a daily basis, combining temperature,
wind speed, relative humidity, and precipitation to rate the fire danger for a certain day, also taking
into account the history, i.e. the cumulative dynamic effect of the weather in the previous days
(see also the appendix for more details). The literature widely supports the relationship between
large wildfires and this rating index [11, 53, 38, 37].
Different ranges of danger rates (from relatively safer ranges of values, to high and extreme
ranges) are expected to become less or more frequent in future, outlining a sort of unique ‘finger-
print’ of the changing fire danger by weather in a certain area. To ease the understanding of this
‘fingerprint’, the daily multi-model projections are summarised by considering six daily classes
of fire danger (from days with low danger up to days with extreme danger), and the percentage
of days within a corresponding range of fire-danger values (see Figure 10 and Figure 11 in the
Results section).
18Areas bioclimatically more vulnerable for the exposed vegetation
Two wildfires with a comparable burnt area, but affecting different vegetation, may result in
very different levels of damage, and recovery paths of the damaged vegetation. Rather than
modelling the tree species for which detailed data are available – and ignoring the cumulative
role and interactions of all the other plant species – the approach here proposed focuses on a
holistic, integrated analysis of the main ecological components (ecological domains [49, 29, 34,
27] ) which support the existence and specific structure of the current vegetation assemblages.
For example, in a forest this comprises the various tree species composing the canopy, the trees
and shrubs in the understorey, the herb and ground layers, including both living and dead biomass.
All these elements define the local typology of fuel. Pronounced variations of the ecological-
domain components due to the changing climate may help to identify, with uniform criteria at
the continental scale, areas subject to a high potential vulnerability of the current vegetation [96,
49, 72, 44].
FAO classifies five main ecological domains for vegetation: Polar, Boreal, Temperate, Subtropical,
and Tropical [49]. The European vegetation potentially exposed to wildfires comprises biomes in
the boreal, temperate, and subtropical domain [49, 29, 34, 27].
Boreal, Temperate, and Subtropical vegetation domains each encompass multiple sub-domain
zones (see Figure 7), and may be defined with a focus on the regional broad patterns (e.g.
including as subtropical even high mountain peaks in the Mediterranean region, see Figure 8),
or the local patterns (e.g. considering the vegetation succession in Mediterranean mountains in
its local specificity, varying from subtropical at low-elevation slopes, to predominantly temperate
at intermediate elevation, up to showing marked boreal components at the higher peaks, see
Figure 9).
A preliminary assessment of local ecological patterns is here presented, and for each area in
Europe the corresponding contribution of each domain component is estimated [49, 29, 34, 27].
In addition to the Boreal, Temperate, and Subtropical components, the appearance is estimated
in Europe of climatic features specific of the Tropical domain, namely in extreme Southern areas
of the Mediterranean region (See Figures 12, 13, and 14).
However, within-domain bioclimatic shifts are here not considered (e.g. sub-domain partitions
such as ecological zones). Therefore, even in areas not highlighted in this analysis local fac-
tors (not considered in a general ecological-domain overview) may induce a high vulnerability of
vegetation to changing bioclimatic conditions. Part of these factors may be the object of future
analysis at the sub-domain level4 .
4 Other factors are more difficult to assess: for example, the impact of increasing vapor pressure deficit (VPD) is
reported to reduce global vegetation growth, offsetting the positive CO2 fertilisation effect [109]. Therefore, CO2 fertili-
sation and VPD appear to act on opposite directions, widening the uncertainty of models. Overall, increasing VPD may be
“part of the drivers of the widespread drought-related forest mortality over the past decades, which has been observed
in multiple biomes and on all vegetated continents” [109]. As such, this may contribute to worsening the estimates on
vegetation vulnerability summarised in this work.
19Figure 7: FAO ecological zones. At the first level five domains are distinguished based on temperature: Tropical, Sub-
tropical, Temperate, Boreal and Polar. In Europe, these domains are distributed from South to North and Tropical is
absent. At the second level, precipitation is used to subdivide the domains into a total of 20 subclasses, of which 12 can
be found in Europe.
20Figure 8: Domains (level 1) of the FAO ecological zones (see Figure 7). The domains are distinguished based on
temperature and potential natural plant communities, and four domains can be found in Europe, namely Subtropical,
Temperate, Boreal and Polar (Tropical is absent), distributed from South to North. The boundary of the detailed ecological
zones shown in Figure 7 are represented in light grey.
21Figure 9: Local ecological domains according to the criteria of temperature used in the FAO ecological zones when applied
with the WorldClim data without considering the potential natural plant communities [29, 34, 27]. Compared with the
FAO domains (see Figure 7), the extent of Polar and Boreal domains is larger due to the local effect of the altitude in
mountainous regions, such as in Scandinavia, the Alps, the Iberian Peninsula, and Turkey.
22Vulnerable population by proximity to wildland fuels
The vulnerable interface between wildland vegetation (including forests, shrubland and grassland)
and human presence is where the risk of fire may be especially high for the local population.
In this work, a high-resolution preliminary assessment is introduced to estimate the interface
between urban areas and wildland ( Wildland-Urban Interface, WUI [17] ). This new continental-
scale estimation of WUI follows a standardised definition, with an emphasis on the uncertainty.
Following Stewart et al. [98], two components characterise the interface: the effect of settle-
ments intermixed with wildland fuel, and directly vulnerable to local fires; and the effect of large
core areas of vegetation fuels, which may generate violent wildfires able to produce embers or
sparks carried by the wind, and creating new fires (spot fires) at a larger distance.
This detailed interface map may help to summarise two components of the vulnerability feedback
between human presence and wildfire risk. A first component descends from the easier ignition of
areas where people can have an easier access to wildland (see Figure 20 and Figure 21). Indeed,
fire events with damage perimeters adjacent or intersecting the WUI appear to contribute the
majority of the burnt area in several parts of the Mediterranean Europe. This was previously
referred as an active role of the WUI in increasing the fire risk. The second component of WUI
population vulnerability was noted as a passive consequence of the increased local risk. As
ignition frequency is higher close to the WUI, under negative weather conditions some ignited
point may occasionally become a large fire, able to threaten areas quite far from the original
ignition. By definition of the WUI, part of these areas will be in the WUI, becoming passively
vulnerable just because of their proximity to the WUI. Discriminating between these roles at
the continental scale, and reconstructing the cause of each fire, may easily prove impracticable.
However, a basic identification of the areas whose population is more vulnerable to fire risk does
not require a detailed modelling of the fire causes. For this purpose, the spatial distribution of
the WUI may be exploited as a simple proxy for the population vulnerability.
The percentage of wildland was estimated from the CORINE Land Cover ( CLC ) map of 2012 [7,
8], and varied between a minimum and maximum value depending on the inherent uncertain
land cover class definition of CLC and other auxiliary data such as the JRC’s global surface water
[7, 79]. The Global Human Settlement Layer (GHSL) was used for housing unit counting [80,
81].
In addition, a harmonised preliminary pan-European map was derived estimating the population
exposed to wildfires in the intermixed Wildland-Urban Interface (WUI) (see Figure 3) ranging
between a minimum and maximum as a function of the uncertainty of the percentage of wildland
estimated from the CORINE Land Cover map of 2012 [7, 8]. Population count was based on the
Global Human Settlement Layer (GHSL) [52].
The WUI and the population within it provide a preliminary harmonised index of population vulner-
ability. However, this delineation cannot encompass the (even densely populated) areas which
are far from the WUI, but potentially subject to the impact of smoke and air pollution generated
by wildfires [16, 84, 110, 6, 48]. On this topic, still affected by wide uncertainty and missing
knowledge [73, 84], recommendations are summarised in the conclusions of this work.
233 Results
As underlined in de Rigo et al. [35], the climate-driven changes in the damage produced by
wildfires may be only estimated as a chain of impacts which link a changing fire danger with a
landscape subject to partially independent changes. These changes are reflected in the varying
uses of territory and in the vegetation conditions – including macroscopic modifications in the
ecological regimes underpinning the fundamental structure of vegetation, and the corresponding
typology of fuel available during fire events.
3.1 Changing frequency of fire danger classes due to climate change
de Rigo et al. [35] offered a European-wide outline of the potential climatic effects on fire danger
extremes, remarking how – besides indirect factors – fire danger is directly and “clearly influenced
by weather in the short term, and by climate and its changes when considering longer time
intervals”.
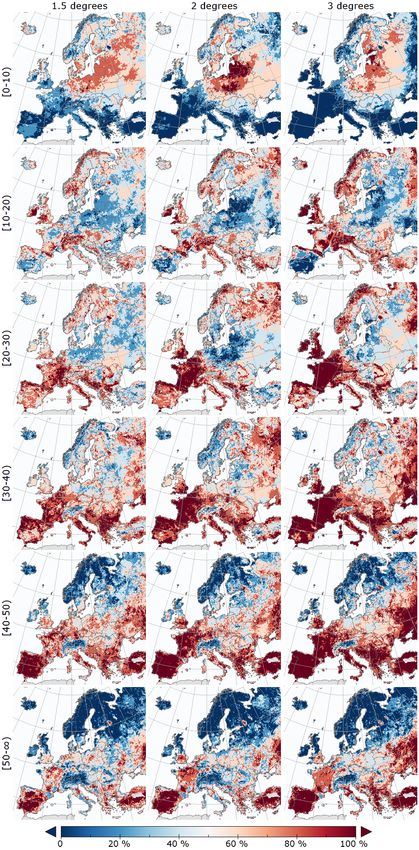
This influence is suitable for a more detailed analysis, considering the frequency of different fire
danger classes (from relatively safer values of danger up to values correlated with extreme fire
danger by weather), and their predicted changes under different scenarios. Figure 10 provides
an overview of the expected climatic trend in the weather-driven component of fire danger. It
summarises the changing patterns of fire danger in six equi-spaced classes of the aggregated
Fire Weather Index . Values of FWI above 20 are associated5 with high fire danger, while values
exceeding 50 typically characterise extreme danger conditions [91]. An assessment of the un-
certainty due to the variability of the estimates in different models is summarised in Figure 11,
where the percentage of models is shown which agree in the positive sign of future change com-
pared with the Control period. For a certain class of danger, a 100 % agreement means that all
the models robustly indicate an increasing number of days. Conversely, a 0 % agreement means
that all the models indicate a decreasing (or stable) number of days in the danger class. An
agreement close to 50 % denotes the highest uncertainty.
Observing Figure 10, it may be noticed how the frequency of days in the lowest class of fire danger
FWI-class1 ≡ [0 – 10) is projected to decrease in the Mediterranean region (implying an increasing
frequency of higher-danger days), with an intensity of change predicted to be strongest in the
3 °C global-warming scenario, and milder in the 1.5 °C scenario. Even in this mitigation scenario,
however, for several areas in the Mediterranean region of Europe all the models agree in the sign
of change (a decreasing frequency of the safest class of fire danger), with an agreement of at
least 80 % of the models in the more uncertain areas of the Mediterranean. In the Mediterranean
mountain systems, and in the Alps, the shift from the current distribution of fire danger classes
to the future expected one appears to be limited, while in several other areas of Southern Europe
even the higher danger classes display a marked predicted increase. This is particularly evident
in the Iberian peninsula and Turkey, along with part of Greece and the Balkans, part of central
and southern Italy, and of France. It is worth noting that even with mitigation that limits global
warming to 1.5 °C, the predicted sign of change in fire danger is consistent among several models.
Although the projected worsening of the climatic distribution of fire danger classes is smaller with
5 For example, a comparable classification is described at http://effis.jrc.ec.europa.eu/about-effis/technical-
background/fire-danger-forecast/, and implemented in the Current Situation Viewer of the European Forest Fire In-
formation System, EFFIS .
24You can also read