Climate Change and Extreme Surface Flooding in Northern Italy
←
→
Page content transcription
If your browser does not render page correctly, please read the page content below

Climate Change and
Extreme Surface Flooding
in Northern Italy
For WWF Deutschland
and Allianz SE

11th November 2011

                                                            Authors:
     -=

                                                                 Dr Erasmo Buonomo
                                                                 Dr Carlo Buontempo
                                                                 DrvFMatt
     Climate Change and Extreme Surface Flooding in Northern Italy        Huddleston
                                                                     11Nov11
                                          -1–                    Cressida Ford
     © Crown copyright 2008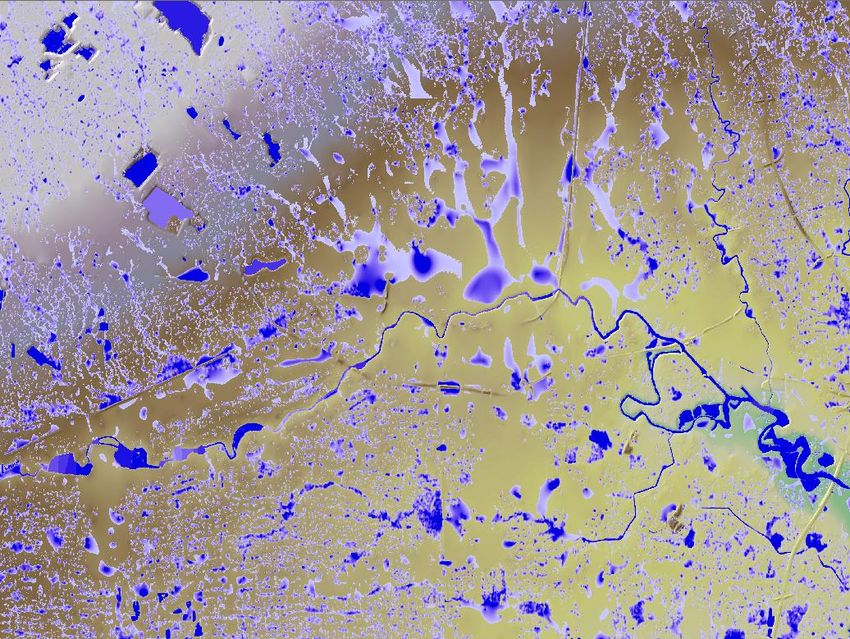
The Met Office aims to ensure that the content of this document is accurate and consistent with its best current scientific
understanding. However, the science which underlies meteorological forecasts and climate projections is constantly
evolving. Therefore, any element of the content of this document which involves a forecast or a prediction should be
regarded as our best possible guidance, but should not be relied upon as if it were a statement of fact. To the fullest
extent permitted by applicable law, the Met Office excludes all warranties or representations (express or implied) in
respect of the content of this document.

Use of the content of this document is entirely at the reader’s own risk. The Met Office makes no warranty, representation
or guarantee that the content of this document is error free or fit for your intended use.

This document is published by the Met Office on behalf of the Secretary of State for Business, Innovation and Skills, HM
Government, UK. Its content is covered by © Crown Copyright 2011 aside from Annex 3 which is © Copyright Jeremy
Benn Associates Limited 2011.

                                                           1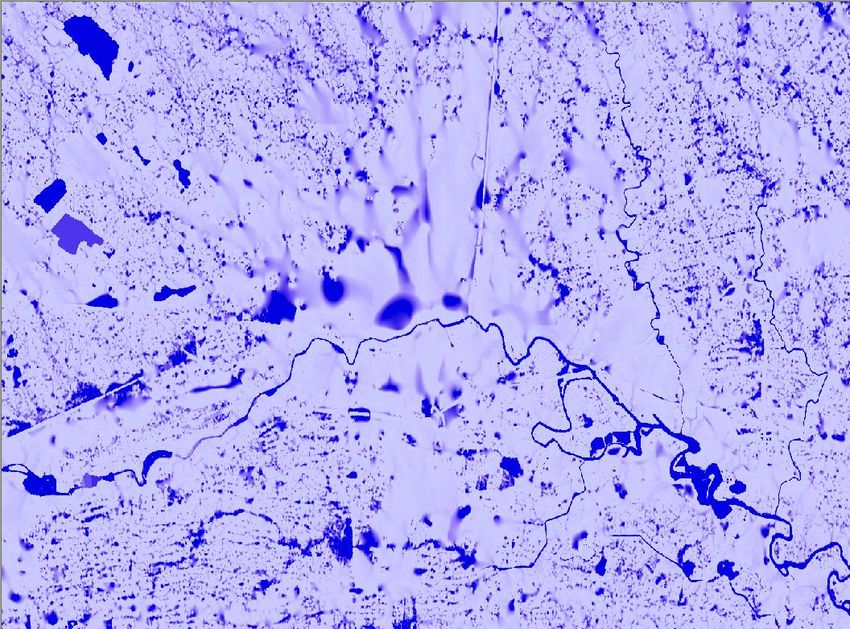
Contents
Executive Summary ........................................................................................................ 3

   Study conclusions.......................................................................................................... 3

Introduction and aims..................................................................................................... 5

Scientific approach ......................................................................................................... 7

   Data analyses................................................................................................................ 8

Observed surface water flood event in Northern Italy................................................. 9

Extreme rainfall events under climate change........................................................... 10

Surface water flood modelling..................................................................................... 11

Results ........................................................................................................................... 12

Future research and potential applications................................................................ 13

Annex 1: Climatological analysis ................................................................................ 14

   Introduction.................................................................................................................. 14
   The Venezia Region September 2007 event: meteorological conditions .................... 15
   Extreme precipitation from a climatological perspective.............................................. 16
   Improving the climatological description: bias correction ............................................ 20
   Climate model projections for extreme rainfall ............................................................ 22
   Choice of events for a case studies on surface water floods ...................................... 25
   Spatial downscaling of extreme rainfall ....................................................................... 27
   Summary ..................................................................................................................... 30
   References .................................................................................................................. 31

Annex 2: About the consortium................................................................................... 33

   Allianz SE .................................................................................................................... 33
   WWF Deutschland....................................................................................................... 33
   Intermap® Technologies ............................................................................................. 34
   Met Office .................................................................................................................... 34
   JBA Consulting ............................................................................................................ 35

Annex 3: Flood analysis ............................................................................................... 36

                                                               2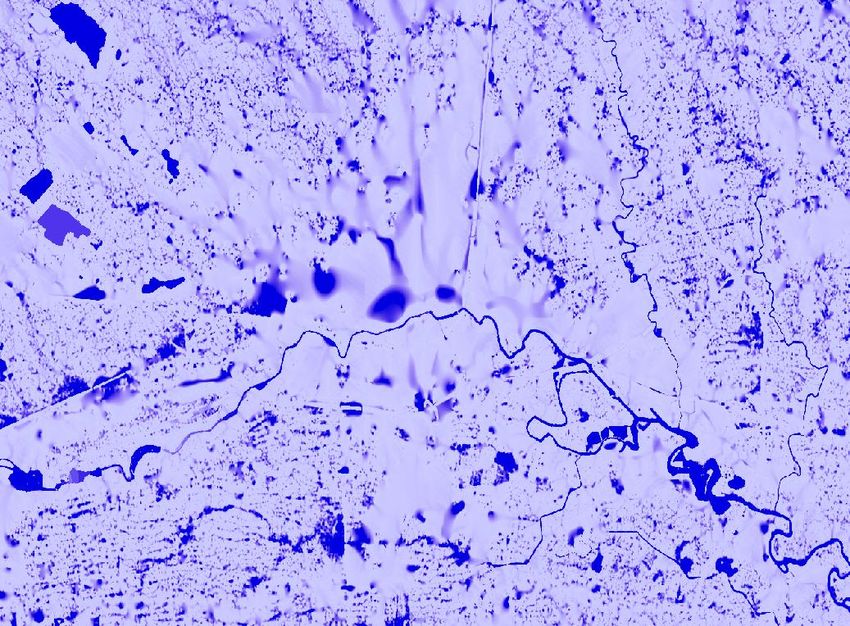
Executive Summary
Are the risks of loss-making atmospheric hazards changing because of climate
change?

Are any changing risks quantifiable and should they be taken into account by the
insurance industry when writing business?

This study aims to address these questions by comparing the characteristics of a recent
major loss-making event with those identified in present and future projections.

Specifically, surface water (pluvial or flooding related directly to heavy rainfall) flooding is
examined for Northern Italy. Surface water flooding occurs from the flow of water over
land before entering the river systems and is triggered by intense localised downpours.
The reference event chosen for the project was that of 26th September 2007; it caused
rainfall around the city of Venice which is estimated to be exceeded on average only
once in 160 years.

In this project climate models are used in addition to traditional analysis based on
historical data. These numerical models appear able to reproduce the basic features of
extreme precipitation and are validated for the Venice event. The study indicates an
increase in the intensity of such events in the future is plausible (three possible
realisations of future climate scenarios show a significant increase in these flooding
events, and none of the scenarios show a decrease in the period 2070-2099).

This study is unique in several respects:

    •   The potential climate change impact on the business model of a large insurance
        company is being assessed.
    •   A previously under-researched peril is analysed by linking observed current
        rainfall extremes and flooding to future climate risk by the means of climate and
        hydrological modelling.
    •   The project developed new methods that can be applied globally where sufficient
        observations exist.
    •   The study combined public and private expertise in a unique consortium
        including JBA Consulting, Intermap, Allianz SE, WWF DE and the UK Met Office.

In these ways, the case study proves the viability of using currently available methods
and data to manage future extreme risk.

Study conclusions
The September 2007 flood in the Venezia region, with intensity close to 300 mm/day
measured at one station, has a return period of approximately 1 in 160 years. Events
such as these are not seen in the present period (under current greenhouse gas level) in
the climate models – which may be due to the length of the dataset or the nature of the
natural climate variability during the current climate. However, analysis indicates that
extreme events of this nature with up to 50% more intense rainfall are seen in 3 out of 11
future scenarios under higher greenhouse gas levels at the end of the 21st century.

Hydraulic modelling by flood experts JBA Consulting successfully mapped the areas at
risk from flooding in nine extreme rainfall events from the climate model scenarios and
compared these events to the extent of flooding of the 2007 event.

                                             3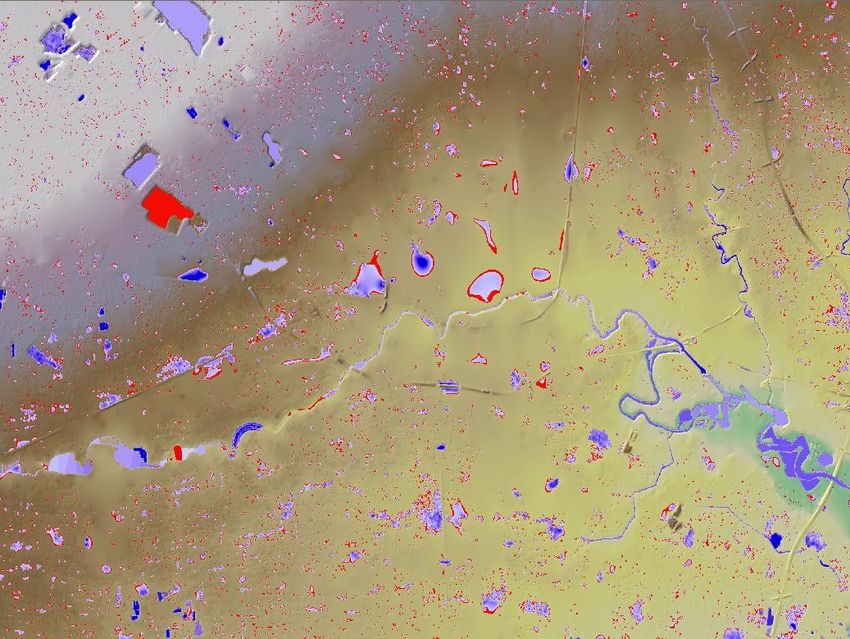
In the modelled future events examined, in line with the variable spatial patterns of
rainfall events in the climate scenarios, certain areas were found to be potentially at
greater risk of flooding than in 2007, while others were less heavily affected. The most
extreme events in the future climate scenarios show a pronounced increase in flood risk
due to considerably larger flood plains.

However, for the period 2021-2050 no significant changes are seen in the modelled
precipitation and therefore no changes are detected in the risks from surface water
flooding. Any signal present during this time period may likely be hidden in the large
(natural) climate variability “noise“. Its identification will require a larger set of climate
model integrations with respect to what it is currently available, specifically designed to
include a proper sampling of climate variability.

We conclude that there is potential for severe surface water flood events to occur in
Northern Italy both given today’s climate and under potential future climate scenarios. It
is possible that a future climate may cause more frequent and/or more severe flooding
associated with heavy rainfall. However, the possibility of such events is not only present
in a future scenario related to climate change, and so we would recommend that
insurers and other bodies consider how best to quantify and deal with surface water
flood risk today, rather than delay taking action until tomorrow.

With regard to the impact of climate change and how it is dealt with by insurers, since
the insurance industry’s practice of writing insurance is focusing on relatively short-term
considerations (i.e. on a yearly basis) it has proved very difficult to translate these results
in today’s practice. In other words, although a change in weather patterns that could
have massive repercussions on the insurability of the risk is deemed possible, there is
no direct possibility for the insurance industry to react proactively. This result is not
unexpected. Even if the specific project described above will not lead to measurable
changes in the way an insurance company is dealing with the risks of extreme flooding,
we hope that the exercise has served to convince decision-makers that a long-term view
on the impact of climate change on their business is an important element to any
strategy incorporating the practicalities of climate change.

It is also worth noting that no absolute monetary amounts were derived in this study
since no attempt was made to link, for example, the calculated flood depths to losses
using vulnerability assumptions of any affected exposure. This could be an area for
further study.

                                             4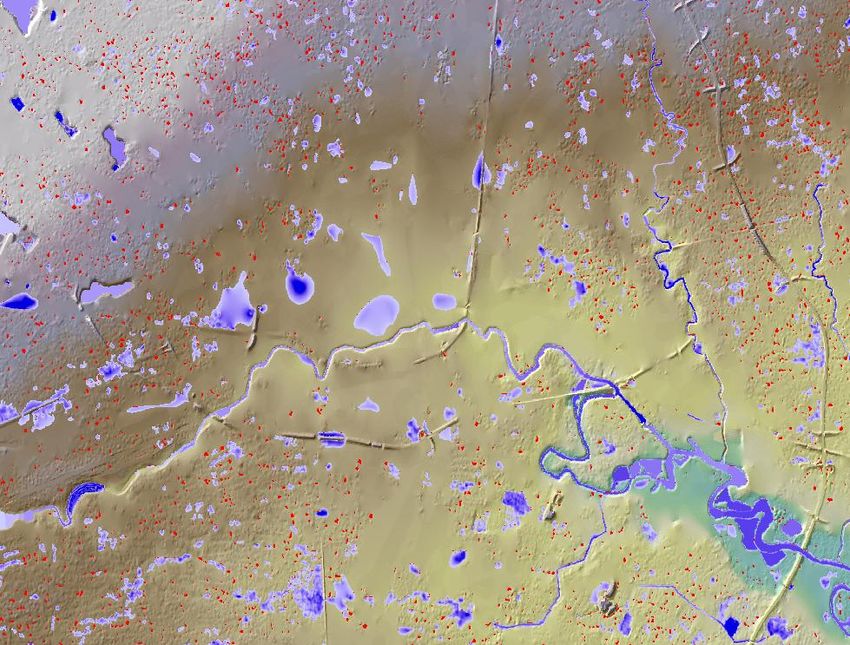
Introduction and aims
Whilst there is growing awareness of climate change, the analysis of more robust
regional predictions of extreme loss-making events is still challenging. In particular, it is
uncertain whether changes in the numbers and the impacts of localised extreme events
will adversely affect insurability of property and overall expected future losses.

Current methods for assessing loss-making events within the insurance industry use
historical data to assess current risk. This study particularly aims to assess the question
of whether climate projections could be used to estimate future hazard likelihood at
regional level.

Surface water (or “pluvial”) flooding is a relatively under-researched peril particularly in
the insurance and reinsurance industry and is often only a simple add-on to
sophisticated river flood models. In this respect, Central Europe insurance markets are
behind standard practice in (for example) the UK, where consideration of surface water
alongside river flood by underwriters is relatively common practice.

Resulting from the flow of rainwater over land, prior to it entering the river system, pluvial
flooding can be triggered by intense localised downpours rather than by widespread
precipitation, and as such presents a considerable challenge to climate modellers
because high resolution is needed to asses these small-scale features and this is not
easily available.

Increases in the global mean air temperature allow an increase in the water vapour
content of the atmosphere, which in turn may increase the precipitation intensity. This
means that pluvial flooding is a peril that will plausibly increase under warming scenarios
of climate change.

In 2010, WWF Deutschland approached a consortium of experts in relevant fields to
construct a study into the effects of climate change in the Venezia region of northern
Italy. Among its constituent parties, the consortium has all of the relevant expertise to
develop and conduct a study of this nature (see annex 3).

Allianz SE and WWF Deutschland share the concern and ambition that dangerous
climate change needs to be avoided. Based on climate science there is a guiding limit
on global warming, which is also a politically well established one – the 2°C limit on the
increase of global mean temperature compared to pre-industrial levels.

Allianz SE and WWF Deutschland defined a common work agenda in 2007 to address
the role capital markets can and will have in averting dangerous climate change whilst
understanding what the virtual certainty of exceeding 2°C of global warming in the 21st
century under some scenarios means for the business.

In the Allianz SE and WWF Deutschland collaboration the focus of work basically rested
on three work streams towards the business implications for Allianz SE in insurance and
investment management, in conducting research to better understand the challenges
ahead and also to find ways to advocate towards policy makers the need and relevance
of low carbon regulation and policy frameworks. In the insurance part of the business
one aspect that was focussed on were the options to integrate emissions mitigation into
insurance products.

                                            5
The other priority was to better understand the potential impact of climate change on the
business model of Allianz SE in its insurance business. The specific project described
here is visionary in that it genuinely incorporates the long-term climate risk and tries to
evaluate whether the result should translate in actual business decisions related to the
insurance sector today.

The consortium represented public (the Met Office), private (JBA Consulting, Allianz SE
and Intermap) and NGO (WWF Deutschland) interests and as such was a unique
consortium cutting across a range of expertise and interests.

This document introduces the methods and conclusions of the climate change study,
which took the extreme rainfall event of 26th September 2007 as a calibration event.

Objectives

The objectives of this specific study across the consortium were fourfold:

   1. Provide an estimate of the return period of the September 2007 Venezia event.
   2. Generate high-resolution precipitation maps for the area of flooding.
   3. Provide a quantitative assessment of the likelihood that these events will become
      more frequent or intense with climate change, along with a range of potential
      scenario events based on the output from an ensemble of climate model
      simulations for the comparison of future and present climate.
   4. Carry out flood hazard mapping for precipitation scenarios associated with
      different climate scenarios so as to illustrate the possible impact of climate
      change on surface water flood risk.

                                           6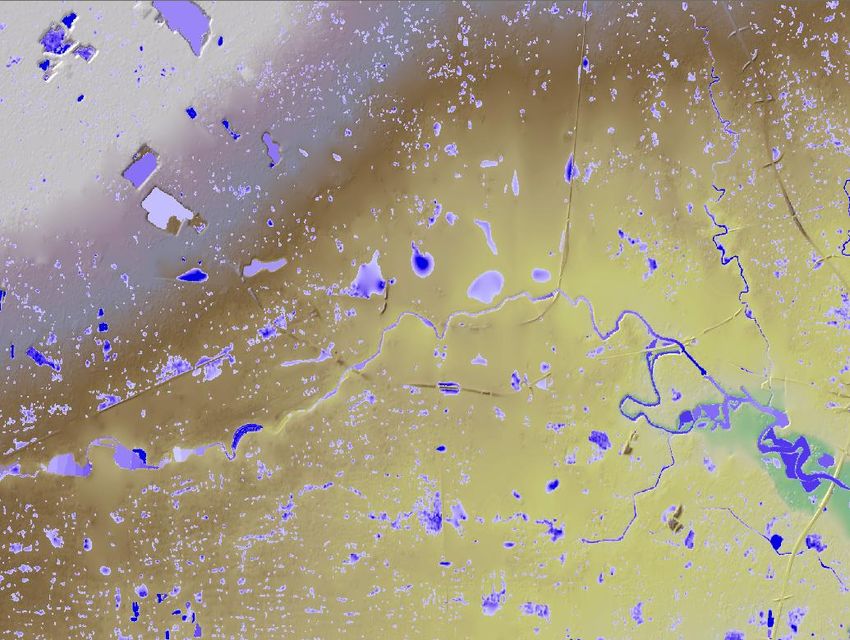
Scientific approach
The project required a number of steps to isolate extreme rainfall events from rainfall
observation data and modelled climate projections, ascertain the relative frequency of
these events and then drive hydraulic water flow models for these events with high-
resolution data. A summary of the steps is shown schematically in Figure 1.

Figure 1: Schematic showing work flow for the project for illustration purposes. Phase 1 and 2
relates to the JBA Consulting documentation (see annex 3). For descriptions of EObs and
ARPAV data see Rainfall observations data below.

A key innovation in the project was relating station-based observations of the rainfall
events to low-resolution climate data (both modelled and observed). This enabled
climate projection data at lower resolution (25km) to be downscaled to the high
resolution (5km) needed for the hydraulic modelling. See Figure 2 for an example of the
changes in intensity related to changes in the spatial scales of the data.

                                             7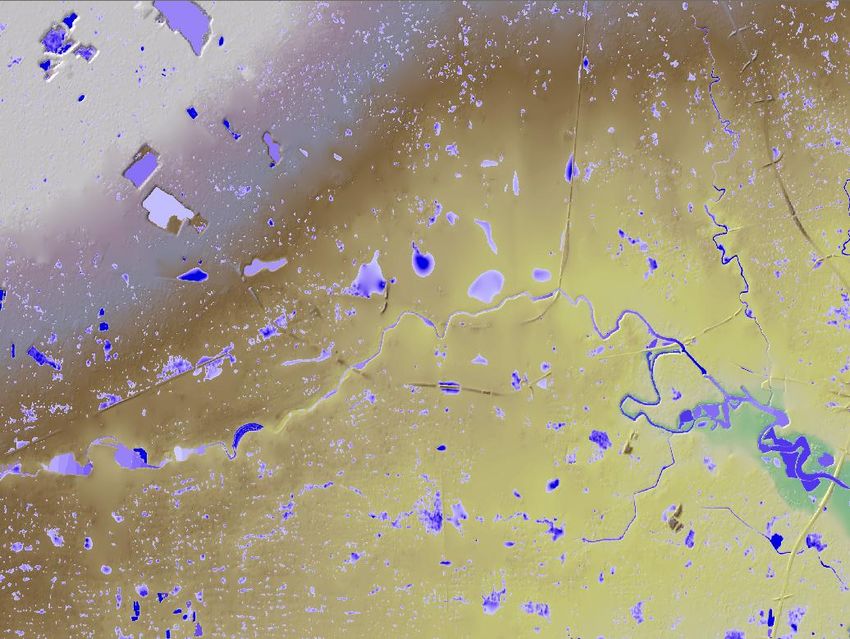
Figure 2: Daily precipitation (mm/day) interpolated from ARPAV stations around Venezia over a
grid of 1km (top left panel), 5km (top right panel) and 25km. The 1km grid could be considered as
representative of the stations value. The locations of the stations are represented by the black
dots. At the three resolutions, the maximum intensity of the events is 260mm/day (1km),
220mm/day (5km) and 120mm/day (25km). For descriptions of EObs and ARPAV data see
Rainfall observations data below.

Data analyses

Underlying datasets are key to be able to analyse the past likelihood of extreme events
and future changes in hazard. The main three sources are:

Rainfall observation data: Three sources of observations were used. An historical
gridded analysis (EObs 3.0 1950 to 2008 at 25km resolution) provided long-term
perspective on the extreme events. Observations from a dense network of 400 sites
available for 2001-2006 in Northern Italy were re-gridded to 5km and related to the 25km
data to provide a “downscaling” relationship. Additionally, hourly data for 12 stations
from the regional environmental agency ARPAV (Agenzia Regionale per la Prevenzione
e protezione Ambientale del Veneto) provided fine spatial structure information to inform
on event selection.

Climate model scenarios: The climate projections used in this study have been taken
from an extensive set (ensemble) of current climate and climate change projections1 for
1961-2000, 2021-2050 and 2070-2099, The Met Office Hadley Centre has developed a
rigorous approach to providing probabilistic climate projections for current and future
climate. This was designed to particularly sample the different realistic options in model
parameters.

The method employed at the Met Office Hadley Centre has been to run the same model
a number of times with a different (but equally valid) set of values for the parameters
describing unresolved processes. For this project, 11 integrations were selected which

1
    See UK Climate Projections (http://ukclimateprojections.defra.gov.uk)

                                                8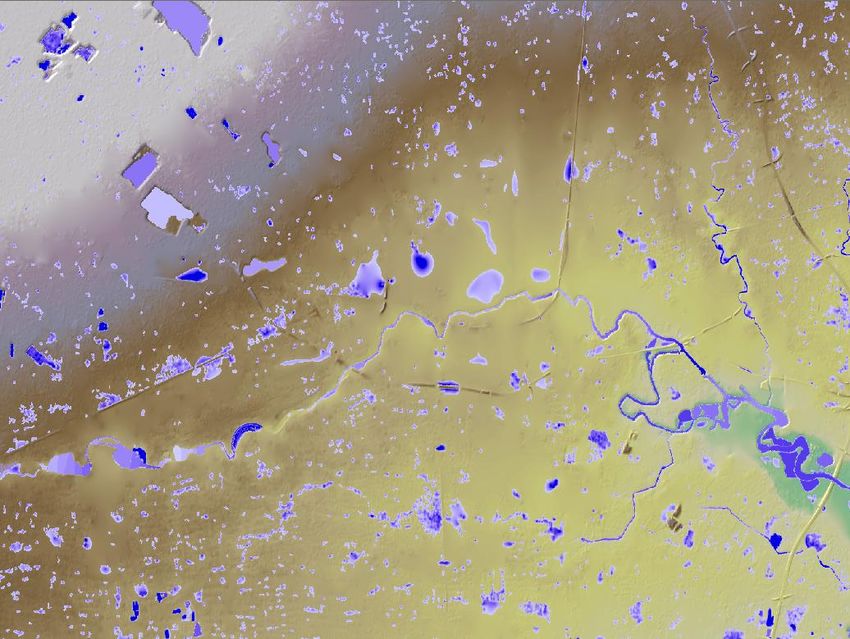
followed the A1B SRES2 scenario for the period 1951-2099 at a resolution of 25km over
an area that included the whole of Europe. Note under the A1B SRES scenario, there is
a virtual certainty of exceeding 2°C of global warming in the 21st century (Joshi et al.
2011).

Digital Terrain Data: Digital terrain data provide a digital representation of the ground
surface and are a critical input to flood hazard modelling. The Digital Terrain Model
(DTM) map used was Intermap's NEXTMap Europe DTM with 5m posting (cell size) for
the Venezia region. Because a DTM is taken from overhead imaging, structures such as
bridges that pass over the top of a watercourse or drainage path are displayed as solid
embankments that block the natural flow of the water. As part of their core product,
Intermap edits "cuts" through embankments such as these to allow watercourses above
a given size to pass through, as seen by comparing the two maps in Figure 3 (see areas
highlighted by the red boxes in the map on the left). These can have an important effect
on the results of the model.

Figure 3: Left: Quarto d’Altino with red boxes to show roads crossing watercourses and other
roads (Bing Maps © 2011 Microsoft Corporation and its data suppliers); Right; Quarto d’Altino as
represented by the Digital Terrain Model showing the overpasses digitally removed to permit
through-flow with colour legend for elevation of the DTM (lilac/light purple shows high elevation,
greens show low elevation).

Observed surface water flood event in Northern Italy
The Met Office Hadley Centre estimated the observed rarity of the September 2007
event by applying Extreme Value Analysis – a statistical approach to analyse
probabilities of rare events. The analysis indicated that precipitation intensity observed
in the September 2007 event is, on average, exceeded once every 160 years, with a
90% confidence interval ranging from 30 years to 1,800 years. In analysing the regional
climate model projections the Met Office used this estimate to select events of a similar
rarity.

2
  The A1 storyline and scenario family describes a future world of very rapid economic growth,
global population that peaks in mid-century and declines thereafter, and the rapid introduction of
new and more efficient technologies. A1B, a version of A1, particularly emphasises a balanced
use in energy sources. See Special Report on Emissions Scenarios (SRES) at
http://www.ipcc.ch/pdf/special-reports/spm/sres-en.pdf

                                               9
Extreme rainfall events under climate change
Estimating the future frequency and intensity of an extreme event is scientifically
challenging. This is even more so in areas such as the Mediterranean where the natural
variability of the climate can be pronounced. Using the extreme value analysis on the
regional climate model data it is possible to obtain an estimate of the way in which
extreme events may be changing in the future.
Figure 4 below shows potential changes in extreme precipitation at the end of the 21st
century for events whose intensity is expected to be exceeded once in 20 years on
average.
Figure 4: Changes in precipitation intensity (mm/day) for the 1-in-20-year frequency events for the
period 2070-2099 with respect to the present climate (1961-2000) for one climate projection (11
were examined in the study – this is the projection from the perturbed model HadRM3Q4). The
colours represent change toward wetter conditions (blue to green) or to drier ones (orange to
red). Grey areas indicate regions where changes are not statistically significant at 5% level.
While the figure (and generally all the other 10 projections) shows a general increase in
extreme precipitation over Northern Italy, the actual regional features are not robust
between projections. This analysis provides a good example of the difficulty in obtaining
robust estimates of extreme events from records of limited length.
Generally, longer observational records help to reduce the uncertainty associated with
the extreme event frequency and intensity. The results in Figure 4 show an example
which also indicates that projections with significant increased extreme precipitation
intensities for the Venezia region are plausible: three models out of the eleven show an
increase in the frequencies and/or intensities of extreme rainfall events. This means that
climate change could lead to a change of the expected frequency and severity of
extreme events.
Detailed analysis has been undertaken of the return level (intensity; mm/day of rainfall)
and the return period (frequency of event) for the 11 climate scenarios at the end of the
20th and 21st century. Diagrams showing the extreme value analysis are presented in
Appendix figure A8. For long return periods, uncertainty increases but 2 of the scenarios
show a significant increase in extreme precipitation by the end of the 21st century
(significant at the 5% level, that is values equal or higher would have occurred by
chance only 5% of the time), while a third model is quite close to a significant change in
10very rare extreme. See annex 1 for detailed description of the climatological components
of the project.
Surface water flood modelling
In phase 2, the Met Office supplied JBA with rainfall data for each of nine selected
events generated by the future climate models. This dataset provided the quantity of
rainfall per hour over the course of the event selected. These data represented the
hourly rainfall at any point across an area (or "tile") 6km x 6km. Each tile overlapped with
its adjacent tiles by 500m (leaving an area of 5km2 unique to that tile) to produce a
continuous flood extent.
JBA carried out hydrological modelling based on soil type and land use information
values to produce the volume of water that would become surface runoff (i.e. after soil
infiltration). Recent rainfall conditions were also taken into account at each hourly
interval, allowing for slower infiltration on saturated soil according to the volume of
rainfall over the event prior to that hour. The regionalisation of soil type and land use
means that, while the raw rainfall across the 6km tile is consistent, the modelled runoff
values reflect the changes in terrain in that area.
These values were then supplied to JBA’s advanced and scientifically-acclaimed
hydraulic model, JFlow+. The JFlow+ technology has been recently developed by JBA
and builds on the acclaimed JFlow-GPU system, which uses commercial computer
graphics cards (graphics processing units, or GPUs) to facilitate the quick processing of
flood depth calculations. Incorporating special advances such as shallow water
equations and longer time steps, JFlow+ is a fully hydrodynamic model, providing more
accurate simulations without simplifications or shortcuts, and is capable of modelling
large areas in a single simulation. JFlow+ is run in-house at JBA on the world’s largest
dedicated flood modelling grid.
The output of the model is in the form of depth grids in GIS raster format, which are also
converted to extent polygon shapefiles after post-processing. The grids are post-
processed to remove shallow depths; because rainfall is applied on every DTM cell
across the tile, there are no “dry” cells, and so a depth threshold must be set to remove
depths that are less significant, and small isolated ponds of flooding. The depth
threshold used was 30cm, considered appropriate for removal of “noise” in the DTM
data. Following this process, isolated ponds smaller than 1800m2 were also cleaned.
Figure 5: from right to left, the post-processing stages for the depth grids outputted by JFlow+. At
first (left image), every cell of the DTM is shown as being wet to a greater or lesser depth (lighter
= shallower, darker = deeper). Shallower depths are then removed below a threshold according
to the assumed level of noise in the DTM (central image) and finally any resulting isolated ponds
of a small size are cleaned from the dataset (right image).
11Results
The event of 26th September 2007 around the city of Venice is unprecedented. Climate
models when combined with observational downscaling methods are able to reproduce
the basic features of that extreme precipitation event in Venezia. In particular, when the
models are run for present day conditions, they rarely produce rainfall rates exceeding
those observed in the September 2007 event, a result which is consistent with the
observed rarity of this event.
The Met Office’s analysis of future simulations suggests that there is a possibility (3 of
the 11 available projections) that climate change may induce events that are much more
intense (up to 50%) than the extremes in the present climate and well in excess of the
event of 26th September 2007 around Venice. However, the findings of this study do not
allow us to conclude how surface water flooding [in this region] will change with climate
change.
One example of a flood scenario map generated by the climate modelling is given in
Figure 6 and compared to the JFlow+ modelling of the September 2007 event. The
event shown is chosen to be one that gives rise to more widespread severe flooding
than in September 2007 in the specific area illustrated. The two events were modelled
using the same data and assumptions apart from the event rainfall, which also varies in
intensity within each individual footprint. This illustration shows the potential of future
climate scenarios to generate significant surface water flood events, including events
that are more extreme than the one experienced in 2007.
Since the number of events comparable to the September 2007 flood which could be
selected from climate models scenarios is rather small no significant and consistent
change to flood hazard can be discerned and, in general, the level of variability in the
modelled flood depths is within the level of uncertainty associated with the DTM data.
For clarity, this study does not provide a conclusive statement that says surface water
flooding will increase with climate change, but does suggest an increased likelihood of
extreme rainfall events and suggests these events may indeed become more common.
We conclude that there is potential for severe surface water flood events to occur in
Northern Italy both given today’s climate and under potential future climate scenarios. It
is possible that a future climate may cause more frequent and/or more severe flooding
associated with heavy rainfall. However, the possibility of such events is not only present
in a future scenario related to climate change, and so we would recommend that
insurers and other bodies consider how best to quantify and deal with surface water
flood risk today, rather than delay taking action until tomorrow.
With regard to the impact of climate change and how it is dealt with by insurers, since
the insurance industry’s practice of writing insurance is focusing on relatively short-term
considerations (i.e. on a yearly basis) it has proved very difficult to translate these results
in today’s practice. In other words, although a change in weather patterns that could
have massive repercussions on the insurability of the risk is deemed possible, there is
no direct possibility for the insurance industry to react proactively. This result is not
unexpected. Even if the specific project described above will not lead to measurable
changes in the way an insurance company is dealing with the risks of extreme flooding,
we hope that the exercise has served to convince decision-makers that a long-term view
on the impact of climate change on their business is an important element to any
strategy incorporating the practicalities of climate change.
12Figure 6: JFlow+ modelling of the September 2007 event in the Venezia region (left) and the
simulated 2079 event from Table A1 in the annex (right). Comparison shows that certain areas
could be affected more severely by a future event, while others could be less strongly affected.
(Bing Maps © 2011 Microsoft Corporation and its data suppliers).
Future research and potential applications
The project has overcome a number of scientific hurdles and has stimulated new ways
to relate station observations to numerical climate model projections.
The framework presented could be generalised and would be directly applicable to other
geographic regions susceptible to surface water flooding. Given the downscaling
methods that have now been developed, other regions would need less effort than
required for the pioneering work in this study. Additionally, with suitable modifications
the methods may be applicable to other perils such as hail.
Finally, the approach outlined will be of direct relevance to the wider discussions on the
impact of extreme events from man-made climate change. Scientific papers are now in
preparation that will allow the work to be peer-reviewed and included in, for example, the
Intergovernmental Panel on Climate Change (IPCC) analysis.
13Annex 1: Climatological analysis
Introduction
The intense, short-lived rainfall event of 26th September 2007 in the region around
Venezia had a high impact, causing damages of tens of millions of euros in the urban
areas of this region. The high impact of this event and its societal relevance are main
reason for the choice of this event for this scientific investigation.
In this section, this extreme event is analysed from a climatic perspective, in particular to
understand how similar events may be different in the future climate, changed by the
increased concentrations of greenhouse gases in the atmosphere.
Since every meteorological event is unique, even when represented in the rather coarse
spatial resolution of the current generation of climate models, a study of the
climatological features of a specific weather phenomenon can only be done by isolating
its main features and by identifying a set of physical parameters which allow the
identification of its climatic analogues in the available record. Both observed data and
model simulations are used for the present period, while the future climate can only be
studied from available climate model projections. The analysis of future events from
climate projections is complicated by the possibility of an unprecedented climatic change
by the end of this century, caused by the increased greenhouse gases concentrations,
which might alter the basic features of these climatic phenomena e.g. in the context of
this study, we might have Mediterranean storms with some tropical features in the future.
For this reason, events will be described in a simple way, from their spatial and temporal
patterns of the rainfall. However, an understanding of the broader physical features of
the phenomena is important in the context of a climatic change study, to support findings
from a statistical analysis of precipitation. One way of addressing this issue is a multi-
model study, by assessing the robustness of the changes with respect to their
formulation. In addition to this criterion, a detailed analysis of the realism of the physical
description of this class of intense rainfall events would also be useful in increasing our
confidence in modelled climate scenarios. In particular, it could be possible to assess
the dependence of the changes on the most robust features of the future, changed
climate, such as the increased availability of moisture in the lower atmosphere.
The scale of the September 2007 event is toward the limit of what can be accurately
described by the current generation of Regional Climate Models (RCMs), which have a
resolution of 25km and use the hydrostatic approximation to eliminate explicit
representation of the vertical motion of the atmosphere. In such models, convective
processes are not explicitly resolved; in fact they are described as sub-grid scale
physical processes in the parameterisation schemes of the climate models. Previous
study have shown that, at the current resolution, RCMs are able to produce good
estimates of extreme precipitation events using daily precipitation accumulations, but
there are not many scientific studies on the quality of hourly rainfall extremes. Given the
mismatch between the resolution of RCMs and the requirements of the JBA surface
water flooding model, additional high resolution datasets are needed to reconstruct the
rainfall at the required scale. The final outcome of this work is a set of events selected
from the available high resolution climate projections, both from the present and future
climate (2070-2099), described with a time frequency and spatial resolution sufficient to
be used to drive the JBA surface water flooding model.
14The Venezia Region September 2007 event: meteorological conditions
In the early morning of September 26th 2007, a very intense precipitation event took
place inland from the Venezia Lagoon. Observed rainfall exceeded 300mm in less than
6 hours in rather small region (see figure A1), causing severe floods in the urban areas.
Figure A1: 24-hour accumulated rainfall isohyets (mm/day) from the ARPAV network of rain
gauges (from Rossa et al, 2010).
The weather pattern of the event has been discussed by Davolio et al (2009) and Rossa
et al (2010). According to these reconstructions, the event was caused by a Mesoscale
Convective System (MCS), created by the interaction between an upper level trough and
a mesoscale cyclone over the Gulf of Genoa (see figure A2). This synoptic situation
created the conditions for the onset of the deep convection in the area and sustained it
by allowing the convergence of moist air from the Adriatic Sea. The MCS was moving
slowly and, at its peak intensity, included multiple convective cells which produced the
extreme rainfall event.
15Figure A2: Mean sea level pressure (hPa) and geopotential height (dam) over Italy for September
26th 2007 at 06:00 UTC from the ERA-Interim reanalysis dataset (ECMWF).
Extreme precipitation from a climatological perspective
The climatological properties of the observed precipitation in the 2007 event, in particular
its rarity, can only be assessed by studying a long, accurate, record of events and with a
spatial resolution sufficient to capture the main features of the event. The gridded
dataset of daily precipitation EObs version 3 (Haylock et al, 2008), covering the period
from 1957 to 2008 with a spatial resolution of 25km, is the longest record available for
the whole region. This record has been used as the main dataset to study the Venezia
2007 event from a climatic point of view.
As discussed above, the intense precipitation in the Venezia 2007 event has a rather
small spatial extent and duration of few hours, as a result of a strong mesoscale system
over the area. The quite coarse resolution of this dataset could limit our ability to
estimate the rarity of such events, since peaks of intense rainfall might be averaged with
areas of lower intensity in the same grid box. These events could therefore become
comparable to extremes caused by frontal systems, usually more prolonged and
widespread, which could give comparable rainfall intensities over a grid with a 25km
resolution and for daily accumulation. If this is the case, these two phenomena could be
mixed in a statistical analysis of extremes from EObs. Since frontal precipitation might
have a different impact with respect to intense mesoscale systems similar to the Venezia
2007 event, the final result would be an incorrect estimate of the rarity of events causing
flash floods. It is worth noting, that this problem exists for the RCM integrations as well,
since EObs has the same resolution as the model integrations which will be used for the
climate change study. Therefore, this work should also aim to understand how realistic
a statistical analysis of events on a 25km grid might be, and to understand how its
spatial features transform when upscaled to this spatial resolution. It is worth mentioning
that the EObs dataset has been aggregated on the same grid used in the RCM
simulations and can be directly compared, i.e. grid box by grid box, with the model
16results. This choice is important for this study, since it will eliminate the smoothing of
localised extreme events, unavoidable when interpolating a pattern from one grid to
another with the same resolution but with grid boxes centred in different places. As
mentioned above, the main feature of the EObs dataset is its length: since estimates of
extreme events are strongly affected by the sampling uncertainty and by their possible
dependence on large scale multi-decadal modes of variability (Scaife et al. 2008), the
availability of a long record should be more important than the potential problems due to
the spatial and temporal representations discussed above.
Figure A3: Daily accumulation (mm/day) on September 26th 2007 in Veneto from EObs.
The daily accumulation for the Venezia 2007 event represented in EObs is shown in
figure A3. A direct comparison with Figure A1 is not possible because the precipitation
in figure A3 is an areal average on a 25km grid while the field in Figure A1 represents
rainfall as station values. However, it is clear the EObs is placing the peak of maximum
intensity in a different position. A more accurate description of the event has been
obtained from a set of 12 station records from the ARPAV rain gauge network, which
has been interpolated on a very fine grid chosen to give a good description of the
observed station rainfall. The interpolation has been done by applying the kriging
method as implemented in the R package spatial (R Development Core Team 2008). In
more detail, the algorithm has been applied to the logarithm of precipitation intensities,
the covariance has been modelled by an exponential function decreasing with the
distance, with a scale length of 30km and a nudging factor set to zero to avoid excessive
smoothing. This setting has been chosen to optimise the interpolation of intense and
17localised rainfall events. Daily precipitation obtained from this procedure for September
26th 2007 around the Venezia Lagoon is shown in figure A4.
Figure A4: Daily accumulation (mm/day) from the 12 ARPAV stations, interpolated and averaged
over the EObs 25km grid.
The spatial distribution from this dataset is slightly different from the EObs pattern. This
distribution shows another grid box with rainfall intensity comparable to the maximum
value located in the grid box at the northern edge of the Venezia Lagoon. The intensity
is also much larger in the aggregated ARPAV network dataset, with a peak at
120mm/day, while EObs shows a maximum around 85mm/day. The underestimation of
extreme precipitation in the EObs dataset has already reported (Hofstra et al, 2010) that
two problems might be relevant in this context: i) the network density insufficient to
completely describe small scale extreme processes (as seen from the comparison of
figure A2 and A3) which could result in errors in the spatial representation of intense
events and ii) a dependence of EObs bias from the intensity of rainfall, which leads to an
underestimation of peak rainfall intensities. Both problems affect our estimates of the
frequency of intense mesoscale events by increasing their rarity in a way which is very
difficult to quantify. Nevertheless, as it has been discussed above, EObs is the only
18available dataset available for a period sufficiently long to allow a meaningful
assessment of the rarity of extreme precipitation events,
The statistical analysis to estimate the rarity of the Venezia 2007 event has been based
on the Extreme Value Theory. In particular, for this problem, daily rainfall exceedances
have been fitted to a Generalised Pareto Distribution (GPD) (Coles 2001). The analysis
of the EObs dataset has been done from the precipitation distribution from summer-early
autumn months (from June to October, JJASO) and for the whole year, in the period
1957-2007. In this period, in area surrounding Venezia (see figure 3), the September
2007 event gives the highest daily rainfall amount registered in single grid-box. The grid
box with maximum intensity has been chosen as the reference point of our analysis.
The estimate of the return period for events with intensities larger the September 2007
rainfall in summer to early autumn (JJASO) is 160 years, with a 0.9 confidence level
ranging from 30 years to 1,800 years. The confidence interval has been estimated by
the profile likelihood method (Coles, R package ismev).
When extremes are extracted from the whole year, the estimated return period for this
event drops down to 110 years, with a 90% confidence interval ranging from 30 years to
600 years. This result indicates that winter weather systems can produce extreme
events which are comparable to the strong convective events of late summer to early
autumn. However, since the return period estimate is still much larger than the length of
the dataset, this estimate also indicates that the intensity of the September 2007
Venezia event is still quite infrequent, even when assessed on the annual timescale.
The relevance of a study based on the rainfall statistics from a single grid box can be
evaluated by estimating the Χ statistic (Coelho et al, 2008; Buishand 1984), a measure
of the simultaneity of extremes at different locations. The pattern of these statistics has
been calculated from EObs, using the grid box with maximum intensity in the September
2007 event as a reference and events above the 99th percentile (the same threshold
used for the GPD fit). The result is shown in figure A5, for extremes from June to
October in the period 1950-2007. The X statistics shows two interesting features: the
small extent of its spatial pattern and its alignment with the coast, indicating a
prevalence of high intensity rainfall events with spatial patterns which are not too
different from the 26th September 2007 event as represented by EObs (figure A3). This
statistic doesn't change markedly when evaluated over the whole year. This analysis
can be used to refine the area for the impact study, since it will allow an accurate
description of extreme rainfall patterns, based on the statistics from the reference grid
box used to estimate the Χ statistics.
19Figure A5: X statistic for the extreme events in EObs (JJASO, 1950-2007), with respect to the
grid box at the north-eastern edge of the Venetian Lagoon.
Improving the climatological description: bias correction
In the previous section, the inaccurate representation of the peak intensity for the
September 2007 event in EObs has been discussed. It has also been reported that the
bias of this dataset is dependent on the intensity/frequency of precipitation, becoming
larger for lower frequency/higher intensity events.
An attempt to correct the bias of this dataset needs two ingredients: i) a bias correction
algorithm able to correct not only the mean but also the higher moments of rainfall
distribution and ii) an observational dataset which is also able to reproduce the extremes
quite accurately. A suitable approach to correct precipitation distributions has been
described in Leander et al, 2007 and Terink et al. 2010. This is a two-parameter power
transformation of the gridded precipitation:
Pc=a*Pb
The parameter b is determined by matching for the coefficient of variation (CV) of the
corrected distribution with the CV from the observations while a is derived by the
requirement of having the same mean for corrected and observed precipitation.
The observational dataset available for this purpose is a set of 3-hourly precipitation
from 400 stations located in the north and centre of Italy (NIObs, Coppola, pers. comm.)
20Figure A6: Density of stations for NIObs on the EObs grid.
From these station observations, daily rainfall has been obtained and gridded on the
same high resolution grid used for ARPAV stations and by using the same parameters
for the kriging algorithm. The result on the high resolution grid was then aggregated on
the same rotated-pole grid used in EObs. With the two datasets on the same grid, it was
possible to apply the bias correction for each grid-point.
Figure A7 shows the two parameters of the bias correction over the region of interest.
These parameters have been estimated as average values for the whole year. The bias
correction seems to work well for the northern and western part of the domain, where
both parameters are close to 1, but appears to give an unreasonably large correction in
the area around Venice. Possible reasons for this outcome could be both the limited
length of the NIObs dataset and the lower station density in the EObs dataset in some of
the areas of this region. The application of the bias correction to EObs does not produce
a plausible representation of extreme precipitation events, as the spatial coherence of
the rainfall pattern is heavily modified by the wide range of the bias correction
21parameters. For this reason, bias correction has not been applied in the rest of this
work.
Figure A7: Multiplicative and exponential factors for the power transformation for the bias
correction of EObs, based on NIObs re-gridded on the same grid for the period 2002-2006.
Climate model projections for extreme rainfall
When studying the future, greenhouse gas-forced climate, the uncertainty due to the
possible different ways to construct climate models (model formulation) for precipitation
is quite large. In some regions of the world, GCM projections do not even agree on the
sign of the changes (IPCC, chap11). For extreme rainfall, the situation could be different
since it is physically plausible (Allen et al. 2002) to expect positive changes on larger
areas (e.g. Christensen and Christensen, 2003). However, robust patterns of change for
extreme precipitation indices are also quite difficult to obtain (Kendon et al., 2008). An
additional problem, in this case, comes from the limitation in the sample size: extreme
events are just a small subset of the available data; therefore their sampling uncertainty
is quite substantial.
The uncertainty on the description of events such as Venezia September 2007 due to
the chaotic nature of climate is enhanced if these events are affected by major mode of
variability such as El Niño Southern Oscillation (ENSO) or the North Atlantic Oscillation
(NAO), since the effects of the different phases of these variability modes will need to be
also represented in model data and the outcome of the climate change study will also
depend on the model’s ability to describe the effect of modes of variability.
Given the small scale of the events investigated in this study, the standard GCM
resolution will not be sufficient for their explicit resolution: as it has been anticipated in
the section above, regional climate models will be used to downscale the model
integrations to a horizontal grid with a resolution of (25km). The downscaling process
will also add another source of uncertainty to the process which could be quite
22significant for small mesoscale events. The importance of this contribution can be
assessed from the work by Davolio et al, 2009 on the Venezia September 2007 event,
which included experiments with three different limited area forecast models driven by
the same boundary conditions, showing convective systems with different centres and
peak rainfall intensities. A large sensitivity to the initial conditions of the limited area
forecast models has also been found, indicating a strong uncertainty component at
smaller scales which is purely chaotic.
The quantification of model uncertainty on events such as Venezia September 2007
needs a set of integrations in which the components due to the model formulation, at all
scales, have been sampled. Furthermore, any attempt to assess possible effects of
climate change on these systems will depend on a proper assessment of the variability
associated with these system at all scales, from the multi-annual, planetary scale modes
to the small scales contributions driven by local forcing mechanisms. A suitable set of
models for this task comes from the UK Climate Predictions 09 (UKCP09) ensemble of
Regional Climate Model integrations. This ensemble has been built by a rigorous
statistical approach aimed at sampling the model uncertainty due to the physical
processes which are not explicitly resolved. These processes are usually represented in
the models by schemes dependent on the model variables explicitly resolved and on a
set of parameters, some of which are ill-constrained by available observations or by
theoretical arguments. By varying this set of parameters, it is possible to sample the
model uncertainty dependent on the sub-grid scale processes. Several modelling steps
are needed to produce an ensemble of integrations which would allow the quantification
of model uncertainty on events of the scale of the Venezia September 2007 event.
Firstly, a mixed layer model based on atmospheric-ocean coupled model HadCM3
(Gordon et al, 2000), on which 400 different perturbations have been applied (Murphy et
al, 2004) and used in two sets of simulations with concentration of CO2 equal to pre-
industrial levels and to two times this concentration. Secondly, a set of 17 perturbations
have been applied to the flux-adjusted version of HadCM3, the resulting perturbed
models have been used to perform 150-year transient integration under the SRES A1B
emission scenario (Collins et al, 2006). The integrations have been done under the A1B
SRES scenario for the period 1951-2099 at a resolution of 25km over an area which
included the whole of Europe. Additional investigation has shown that this set gives the
same range of model uncertainty as the multi-model set of integration used in IPCC 4th
Assessment (AR4) (Collins et al, 2006). Thirdly, regional climate models based on the
atmospheric component of HadCM3 have been built for 11 perturbed GCMs, using the
same set of perturbations with exception of parameters which are explicitly dependent
on the horizontal resolution, which have been scaled accordingly. These models have
been used to downscale the corresponding GCMs in the A1B 150-year integration.
Daily precipitation extremes from the 11 RCMs have been analysed, for three different
periods (1961-1990, 2021-2050 and 2070-2099). The extremes have been extracted
from the whole year, over an area covering the north and part of central Italy. Annual
maxima were fitted to Generalised Extreme Value (GEV) distributions, with uncertainty
intervals estimate by profile likelihood method (following the approach fully described in
Buonomo et al, 2007). Within the three selected periods, the assumption of a stationary
climate has been made, i.e. the effects of climate change on extreme rainfall have been
considered negligible within each 30-year period. This assumption if supported by the
lack of significantly different results between estimates for the period 2021-2050 and
1961-1990, for all the models for the area near the Venetian Lagoon. However, the
period 2070-2099 could be different since models give a faster warming with respect to
the previous periods: this assumption could be tested by including a time-dependent
covariate in the GEV model (Coles, 2001). Goodness-of-fit tests (as in Buonomo et al,
232007) show that the GEV estimated even for this period are good (
in substantial agreement with analysis of the EObs dataset and support the idea of
studying the most extreme rainfall events produced by the RCM ensemble, in a “worst
case scenario” study, to understand the impact of events such as the Venezia 2007
flood. The analysis for the future shows that, for many climate runs, rainfall amounts
exceeding 100mm/day can be expected once in periods ranging from 10 to 50 years,
which is a substantial shortening of their rarity with respect to estimates from the present
climate. Additional analyses (not shown) indicate a generalised reduction for extreme
precipitation in summer and early autumn and a significant increase in winter, although
very intense precipitation is still possible in early autumn even in the future.

Hyetographs of these events (not shown) indicate that the larger amount of rainfall from
the larger events will be accumulated within few hours, suggesting a major role for
convective processes even in the winter months in the future climate. Therefore, in the
future’s changed climate, flash floods more severe than the Venezia 2007 event could
occur, in the same region, more frequently than in the present climate. The UKCP09
ensemble of climate model integrations do not allow a quantitative estimate of the
increased hazard, but suggest the non-negligible possibility of having a significant
increase in precipitation (3 out of 11 members in the UKCP09 ensemble) and project a
small set of events with very large intensity which are clearly unprecedented in the
present climate.

Choice of events for a case studies on surface water floods

Starting from the main features of the Venezia 2007 flood, it is possible to introduce a
simple set of criteria which allows the identification of events sufficiently close in their
main features to the event under investigation.

The region has been defined based on the X statistic (see figure A5), which is sufficiently
large to describe completely the daily precipitation pattern of the September 2007 event
(see figures A1 and A4).

Events from the subset of three UKCIP09 ensemble members with significant changes
in extreme rainfall has been chosen, both from the present climate (1961-2000), to
compare their impact with the results obtained by driving the surface water model with
the reconstructed precipitation of the September 2007 event, and from the future climate
(2070-2099), to estimate differences in impacts in the changed climate. For the future
climate, the most interesting events are those with daily rainfall amounts much larger
than both the present climate events of the whole UKCP09 ensemble and the
reconstruction of the Venezia 2007 event.

Two criteria have been used to select extreme events: i) highest correlation with the
spatial pattern of daily precipitation for the September 2007 event, as described on the
25km grid (see figure A4); and ii) highest daily rainfall for the Venezia grid box.

The first criterion selects events with the rainfall distribution spatially similar to the
September 2007 pattern, as an attempt to reproduce the main impact of the event in the
region affected by the Venezia 2007 event, thereby avoiding any accumulation of rainfall
at the edges of the domain, which might cause problems to the surface water model.
The second criterion is the selection of events with the highest rainfall on the Venezia
grid box. This is because, as it has been discussed previously, the September 2007
event has, for this grid-box, the highest rainfall reported in the longest available record at
our disposal.

                                            25
These criteria have been applied to select three events from each RCM integration in the
subset of UKCP09 integrations with significant changes in extreme over the area around
Venezia. Table A1 lists the main features of the events chosen from the three UKCP09
RCMs.
Model Date of event Spatial correlation Daily amount
HadRM3Q4 16/10/1974 0.54 61
09/12/2083 0.69 72
02/12/2084 0.60 63
HadRM3Q10 14/09/1976 0.51 52
04/01/1985 0.46 53
25/09/2096 0.60 125
HadRM3Q16 03/11/1974 0.40 75
02/02/2079 0.30 157
02/11/2086 0.30 60
Table A1 List of events selected for the impact study. Daily rainfall amount are shown for the
Venezia grid box in units of mm/day.
The table lists events taking place in autumn and winter; this is a feature of model
integrations, in which late summer events are less frequent than in the observed record.
A preliminary analysis of the weather conditions associated with these events has shown
a range of synoptic conditions with lows centred either in the Ligurian Sea or more to the
southeast, sometimes reaching the Adriatic Sea. For the lows centred on the Ligurian
Sea, the weather charts are similar to the synoptic conditions of September 26th 2007 –
see in figures A2 and A9.
Figure A9 Mean sea level pressure (hPa) at 18:00 UTC for the HadRM3Q10 event of September
25th 2096.
The similarity in weather patterns indicates that RCMs are able to produce intense
mesoscale systems from the synoptic conditions similar to those of September 26th
26You can also read