Observation- and Modelling of Morphodynamics in Sandy Coastal Environments - Habilitationsschrift zur Erlangung der venia legendi im Fachbereich ...
←
→
Page content transcription
If your browser does not render page correctly, please read the page content below
Observation- and Modelling of

Morphodynamics in Sandy Coastal Environments

                  Habilitationsschrift

            zur Erlangung der venia legendi

                          im

            Fachbereich Geowissenschaften

                der Universität Bremen

                 Dr. Christian Winter

                    Bremen, 2011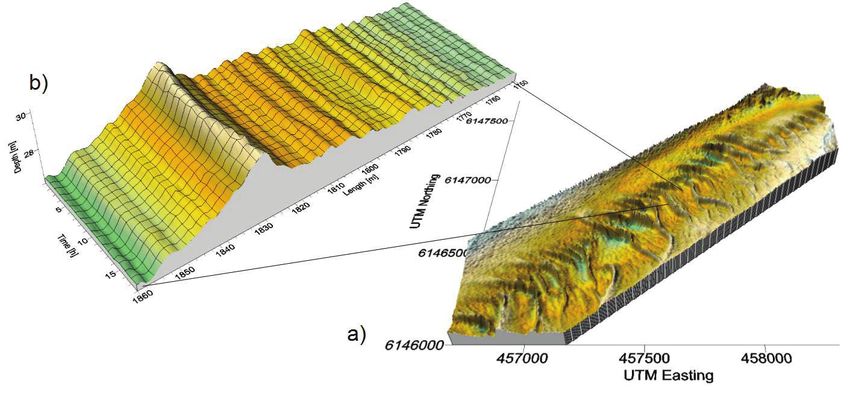
Summary

The topic of sandy coast morphodynamics involves the mutual influences of coastal
topography, local sedimentology, the driving meteorological and hydrodynamic boundary
conditions, flora and fauna, and the activities of human beings: The latter as direct actors
through coastal constructions and other interventions, as indirect actors through possible
contributions to global change, but also as receiving agents - as living individuals confronted
with the forces of the sea.

The general aim of coastal research is to gain an as comprehensive as possible understanding
of the different systems and their interaction in order to be able to evaluate their current state,
assess their stability, explain past changes (in the geological record), and predict future
developments under different conditions. Such systems dynamics involve a large bandwidth
of spatial and temporal scales: from the microscopic interaction of turbulent fluid motions
with single particles to meso-scale tidal dynamics of subaqueous bedforms to macro-scale
seasonal adaptations of beach profiles or the meandering of tidal channels, to the mega-scale
evolution of shorelines and shelf systems over decades to centuries.

The process of understanding involves a continuous feedback of observations, abstractions,
mathematical formulations, model development (ranging from conceptual models to
mathematical formulations of processes, and to complex, process-based numerical modelling
systems), and the testing of models on the basis of observations, new abstractions, and so
forth. In the case of the morphodynamics of sandy coasts, the interaction of the physical
processes involved in hydrodynamics, sediment dynamics, and their mutual adjustment to
changing bed topographies seem most relevant, although biogeochemical processes play a
(commonly underrated) additional role.

This discourse presents an extended summary of the current state in the continuous process of
gaining knowledge on coastal morphodynamics. It focuses on the dynamics of tidal channels
and their main roughness elements: subaqueous compound bedforms. Methodological
approaches involved are field measurements and numerical modelling, which are introduced
and discussed.

                                                2
Contents

1     Introduction ........................................................................................................................ 4
2     Observation of coastal morphodynamics ........................................................................... 9
    2.1      Observation of micro- to meso-scale morphodynamics........................................... 10
    2.2      Observation of macro- to mega-scale morphodynamics.......................................... 14
    2.3      Summary .................................................................................................................. 17
3     Morphodynamic modelling .............................................................................................. 18
    3.1      Morphodynamic model concepts ............................................................................. 18
    3.2      The modelling process ............................................................................................. 23
    3.3      Model evaluation...................................................................................................... 27
    3.4      A short biography of process based morphodynamic modelling............................. 28
4     Synthesis: Combining field data and models ................................................................... 30
    4.1      Papers on sediment transport processes and model reduction ................................. 31
    4.2      Papers on data reduction and model applications .................................................... 33
5     Outlook............................................................................................................................. 36
6     References ........................................................................................................................ 38
7     Appendix .......................................................................................................................... 47

                                                                    3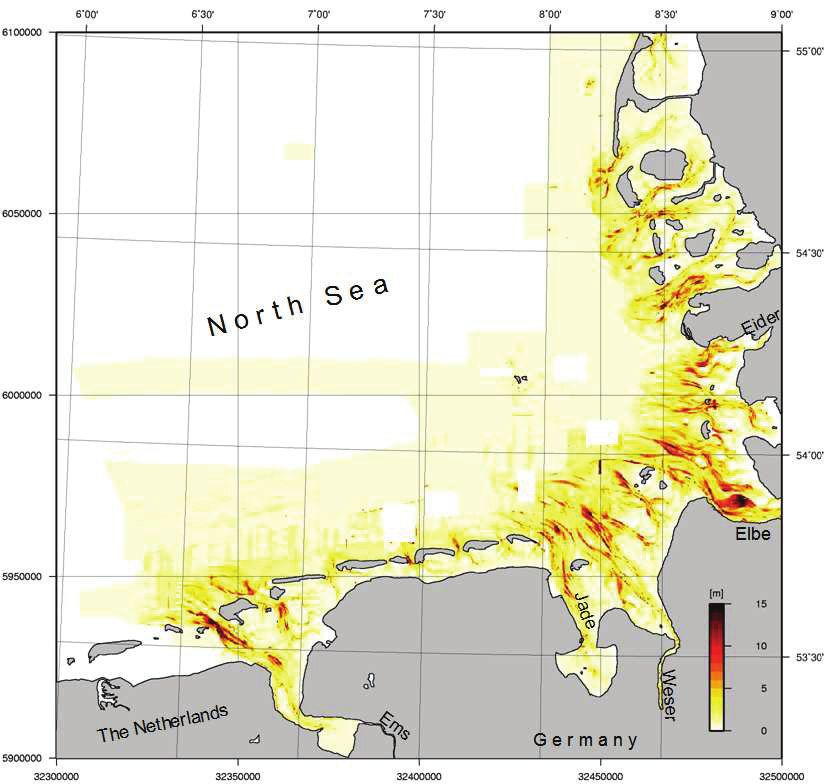
1 Introduction

Land and sea meet in the coastal zone - it is ‘the part of the land most affected by its proximity
to the sea and that part of the ocean most affected by its proximity to the land’ (Hinrichsen,
1998). Coasts are among the most dynamic environments on the planet because here
terrestrial and marine processes continuously interact over a broad bandwith of spatial and
temporal scales. In its vast variety of geographical forms, ecological richness, physical
relations, and economical values the coast has for eons fascinated humankind from casual
admirers to dedicated scientists of various disciplines who try to understand the interaction of
the complex processes controlling the evolution of coastlines and ecosystems under natural
forcing and anthropogenic influence.

With increasing human exploitation, coastal zones in particular have come under increasing
socio-economic pressure. The exploitation potential of the land-sea interface in terms of
settlement, traffic, constructions, harbour development, tourism, fisheries, offshore structures,
etc., goes along with severe impacts on the natural environment. Past experiences have shown
the vulnerability of marine systems, e.g. in the form of large-scale responses to small-scale
coastal engineering interventions (Capobianco et al., 1999; Pilkey and Dixon, 1998), and the
disastrous effects of extreme events (Pilkey and Young, 2005; Schiermeier, 2005). The often
detrimental effects of human interferences with the coast have led to the development of
management strategies which aim at a sustainable development of coastal zones based on
detailed knowledge of the natural systems, the underlying processes, and their response to
external forcing.

Various coastal systems can be defined which encompass the interaction, interrelation, and
interdependency of their associated entities:

   •   Socio-economic systems that link demographic and economic characteristics of a
       wide variety of coastal management issues such as, for example, environmental
       protection, coastal constructions, recreation, exploitation of natural resources.

   •   Ecosystems on micro-, local- and regional-scales that involve interdependent
       organisms such as plants and animals within the same habitat, and which are linked
       together through nutrient cycles and energy flow, and are individually and together
       influenced by chemical and physical factors of their environment.

   •   Physical systems that describe the dynamics of acting forces and their effects. The
       main entities of these systems encompass driving hydrodynamic processes, resulting
       transports, and their geomorphologic effects.

                                                4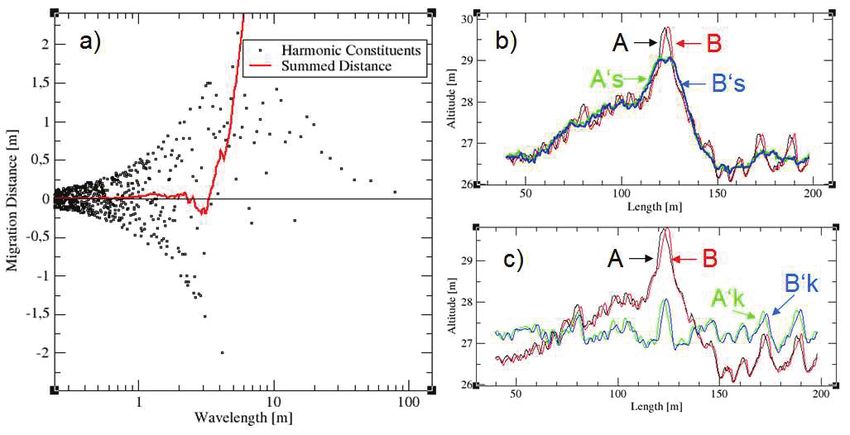
The above systems are characterised by their parts and composition, their drivers, processes
and output, and their interconnectivity: The various parts of a system, and also the different
systems by themselves, have functional and structural relationships between each other. These
may be analysed as closed structures, but must take into account environmental aspects that
act across the system boundaries.

Definition of Morphodynamics
The above-mentioned physical systems can be understood as primary drivers of the other
systems. The interplay between hydrodynamics (meteorological forcing, short waves and
wave-, wind- and tide-induced currents) and sediment dynamics (erosion, transport,
deposition and resulting morphological change) both drives and is influenced by coastal
morphology. The main processes are commonly schematised as a looped series of fluid
motion, sediment transport, and topographic change. The commonly cited work of Wright and
Thom (1977) termed the ‘mutual adjustment of fluid dynamics and topography involving
sediment transport’ as morphodynamics.

This scheme, however, can be misinterpreted as a closed system, tending towards a stable
equilibrium because the most crucial external drivers (the open boundary conditions) are not
mentioned. This certainly does not hold in natural systems that are continuously exposed to
unsteady forcing. De Vriend (1991) understands the term morphodynamics more generally as
the 'dynamic behaviour of alluvial boundaries'. The dynamic behaviour is the result of the
feedback loop of hydrology, sediment transport and resulting bed evolution driven by time-
variant or stationary boundary conditions (Figure 1).

     Figure 1: Scheme of coastal morphodynamics: Loop of the mutual adjustment of fluid motions,
  topography and sediment transport under the influence of conditions at the system boundaries (b.c.).

The morphodynamic scales
The morphodynamic loop described above holds on several temporal and spatial scales:
Kraus et al. (1991) classified morphodynamics into micro-, meso-, macro-, and mega-
temporal and -spatial scales. In that sense, micro scales cover the interaction of waves,
turbulence and single grains, and the formation of small ripples on the seabed, or the
formation and destruction of flocs and aggregates in less than seconds to minutes on
millimetre to centimetre length scales. Meso-scales cover processes acting on meters to
                                                   5
kilometres in minutes to months. However, a further differentiation of the meso-scale into a
small-scale (decimenters to tens of meters; minutes to days) and a large-scale (hundreds of
meters to kilometres; days to months) seems appropriate in this context (Figure 2). Thus,
small-scale morphodynamic processes comprise the formation, dynamics and hydraulics of
bedforms such as small dunes or scours produced in the instantaneous response to tide- or
wind- and wave-driven currents. The large meso–scale, for example, covers the migration of
large dunes in tidal channels or the adaptation of beach profiles to storm conditions. Sediment
pathways, tidal channel migration, or the vertically oscillating behaviour of tidal flats cover
macro-length (kilometres) and -time scales (months to years). Mega-scale morphodynamics,
in turn, comprises coastal features exceeding 10 km in length and dynamics over decades to
centuries. Finally, sub-regional and regional morphodynamics (mega-spatial scale >10 km)
occurs within macro- to mega-time scales (Kraus et al., 1991). The morphodynamics on yet
larger scales, e.g. the Holocene evolution of coastlines or the formation of barrier islands, are
beyond the scope of this discourse and are therefore not covered here.
Figure 2: Spatial and temporal scales and typical coastal morphological features.
Cowell and Thom (1997) group time scales at which coastal processes operate into four
classes: Instantaneous time scales involve the evolution of morphology during a single cycle
of the forces that drive morphological change (waves, tides) from a few seconds to many days
or weeks. Event time scales are concerned with coastal evolution as a response to forcing
processes operating across time spans ranging from that of an individual event through
seasonal variation from a few days to many years. Engineering time scales describe coastal
evolution under natural forcing and its response to human impact from a few months to
6decades. Geological or geomorphological time scales operate over decades to millennia and
cover the evolution of landforms in response to long-term mean trends in the forces (sea level,
climate).
It should be noted, that the above classifications draw rather arbitrary lines through a
continuous time-space system. The listed features certainly rely on processes over different
scales which interact and depend on each other. Scientific understanding of morphodynamic
systems thus not only requires the study of processes and interactions according to the spatio-
temporal equilibrium, but also the bridging of temporal and spatial process scales and
classifications.
Understanding the system
The visualisation and interpretation of coastal morphodynamics are commonly based on time-
series of morphological states. The inter-comparison of data of different times for the same
area reveals a residual morphological evolution between the states. Topographic (‘dry
morphology’) and bathymetric (‘wet morphology’) data usually are derived from land- or
ship-based surveying (Ehlers, 1988) or remote sensing products like aerial photography, lidar
or satellite altimetry (Chu et al., 2006; Kroon et al., 2007; Niedermeier et al., 2005).
Observed morphological changes can often be directly related to external (e.g. hydrodynamic)
forcing factors. Beach erosion due to storm wave action, scouring around offshore
foundations, or the breaching of dikes in a storm surge are examples of forced behaviour,
also called ‘hydrodynamic templates’. In contrast to the obvious direct effect of the forcing
agent to morphology, freely- or self-organised behaviour describes cases in which no
obvious relation between assumed forcing factors and observed patterns can be recognised.
Patterns like bed ripples, dunes, or features like beach cusps and rip currents are often related
to and explained by self-organisation. Obviously, the analysis of coastal morphodynamics
requires more than just information on morphological states: The description of the relevant
drivers is of prime importance. However, coherent hydro- and sediment dynamics are only
rarely measured simultaneously with the morphological measurements and a completely
synoptic analysis, i.e. the simultaneous observation of all relevant parameters of a multi-
dimensional morphodynamic system, is certainly not feasible.
The evaluation of modern coastal systems, the reconstruction of past stages, and the
prediction of possible future developments require an understanding of the underlying
processes and their interaction. The physics of morphodynamic processes are highly non-
linear and many elements and their coupling are still unclear. Some parts are understood in a
deterministic way (i.e. they can be derived from first principles), e.g. fluid dynamics in
principle can be calculated by numerical solution of the Navier-Stokes equations (NSE).
However, limitations in computational power and uncertainties in the initial and boundary
conditions can only be overcome by simplified parameterisations and thereby reduce the
theoretically possible direct simulation to an approximation. Other relevant processes are far
less well understood than the hydrodynamic system: The stability of the fluid-bed interface is
7a two-phase problem, which as yet has no deterministic solution. However, based on
theoretical and empirical considerations, a wide range of modelling approaches have been
formulated to relate, interpolate, extrapolate and interpret measured data and to simulate
system states. These models may comprise conceptual, empirical, data-driven stability
concepts and numerical process-based approaches. Empirical relationships have been
formulated for the description of boundary-layer properties of the fluid and bed (Nielsen,
1992), critical stages of erosion and deposition (van Rijn, 2007a), sediment transport on the
bed and in suspension (van Rijn, 2007b), and the formation of bedforms of various sizes (van
Rijn, 1984; Yalin, 1964). If these are embedded in a system of computational modules for the
calculation of fluid motions and bed evolution, a simulation of morphodynamics is
theoretically possible. However, by definition, any empirical relationship is only valid for the
system under consideration and the range of observations it is based upon; thus, application to
other environments requires calibration and validation based on local field data. Thus, the
current state of the art in understanding the morphodynamics of any system requires both: The
analysis of field data and the utilisation of model approaches.
Purpose
This discourse introduces 13 selected peer-reviewed publications of the author (10 first
authorships) dealing with the observation and modelling of morphodynamics in sandy coastal
environments. It shows the integration of state-of-the-art numerical model concepts and field
observations into coastal morphodynamics research. It focuses on the large- to macro-scale
morphodynamics of tidal channels and small to large current-generated structures:
Subaqueous compound bedforms. Methodological approaches involved are field
measurements and numerical modelling, both of which are introduced and discussed below.
The following chapter 2 focuses on the observation and analysis of coastal morphodynamics
on the small to large-scale (bedforms) and the macro-scale (inlets, channels, estuaries).
Chapter 3 introduces different modelling approaches and numerical modelling strategies, and
provides examples of macro-scale process based numerical models. Important shortcomings
of the models are discussed. Chapter 4 places the publications into the general context of
coastal morphodynamics. In the final chapter an outlook on ongoing and future research
activities is given which addresses the integration of the results of small-scale field
observations with macroscale models.
.
82 Observation of coastal morphodynamics
The analysis of coastal morphodynamics is usually based on data of successive bathymetric
stages of the domain under investigation, which on a large variety of spatial and temporal
scales allows the visualisation of their residual evolution (Figure 3). Bathymetric data
commonly are derived by ship based hydro-acoustic mapping. This involves data acquisition
by the deployment and recording of echo-soundings and positioning, the filtering of raw data
for errors, the correction of data for ship movement and water depth, and the projection of
data to common coordinate systems and reference levels (Cohen, 1980). In the recent past,
positioning and measuring techniques and post-processing software tools have undergone
significant advances, leading to the possibility of spectacular high-resolution imaging of the
seafloor by multi beam echo-sounder (MBES) technology (Lurton, 2002; Winter, 2006b).
Other methods to derive high-resolution information on the micro-scale bed evolution involve
stationary measurements by optical methods such as stereo-photogrammetry (Briggs, 1989),
laser distance sensors, and acoustically fixed or profiling pencil beam sonars (Van Rijn,
1986).
Figure 3: Scales and measuring techniques: In which mbes are multi-beam echo sounders, sbes are single
beam echo sounders, and xb radar refers to x-band radar
For meso- to macro–scale observations, long-exposure camera images of wave patterns
(Aarninkhof, 2003; Bryan et al., 2008) or radar facing the nearshore (Serafino et al., 2010;
Ziemer et al., 2004) are analysed. Airborne remote sensing by photogrammetry (Lane et al.,
2003), lidar (Finkl et al., 2005; Irish and White, 1998; Jones et al., 2007a; Notebaert et al.,
92009), or radar (Niedermeier et al., 2005) are applied for dry and shallow water areas. Mega-
scale morphodynamics are usually derived from satellite observations (Chen and Chang,
2009; Ryu et al., 2008). The analysis of mega-scale morphodynamics also requires the
exploitation of old pre-digital data sources such as historical sea charts (Homeier et al., 2010)
or the geoscientific analysis of the sedimentary record (Behre, 2002; Streif, 2002).
Despite the fact that modern instruments deliver high-quality digital data, which can be
processed electronically, the semi-automatic nature of field data acquisition, and the pre- and
post-processing of high-resolution data requires considerable manual effort which easily
exceeds the time required for the acquisition of the measurements. After data acquisition and
post-processing, geo- and time-referenced data (x,y,z,t) are obtained that describe the
topography (elevation of sea bed). Successive measurements of the same domain can then be
compared to reveal the residual bathymetric evolution between the times of measurements.
Commonly, the irregularly spaced raw bathymetric data are interpolated on structured or
unstructured grids to form digital elevation models (DEM). Several different gridding and
data interpolation algorithms are available, and these should be carefully chosen and
evaluated for the required purpose (Heritage et al., 2009; Rayburg et al., 2009; Saffet, 2009).
DEMs then allow the direct comparison of different datasets at the same discrete points.
Methods for the visualisation and analysis of bathymetric change involve the comparison of
longitudinal or cross-sectional depth profiles (transects) or depth contour lines (isobaths)
recorded at different times. Characteristic features can then be recognised and followed
through time. By subtraction of DEMs of two different stages difference maps are generated
which allow a spatial quantification of measured residual deposition and erosion.
Morphodynamic analysis by the animation of bathymetric evolution is another option (Smith
et al., 2000), but the discrepancy between the large spatial extent of the whole coastal system
and the relatively small but complex changes of its parts leads to considerable uncertainty in
detection and interpretation.
2.1 Observation of micro- to meso-scale morphodynamics
As mentioned above, the modern high-resolution MBES bathymetry reveals features and
morphodynamic processes that could not be resolved by former techniques. Examples are
manifold and comprise the detection and quantification of scour dynamics (Noormets et al.,
2006), bedforms (Ernstsen, 2002; Ernstsen et al., 2006) and other morphological features (Li
and King, 2007; Roberts et al., 2005). Rhythmic patterns such as aeolian dunes are among the
most fascinating geomorphologic features on our and other planets (Claudin and Andreotti,
2006). As a product of the interaction of a deformable bed and the forcing hydrodynamics,
subaqueous bedforms have been a phenomenon fascinating the scientific community for more
than a century (Ayrton, 1910; Darwin, 1883; Dyer and Huntley, 1999; Flemming, 2000;
Fredsøe, 1974; Hulscher et al., 1993; Kennedy, 1963; Kennedy, 1969; Liu, 1957; Sumer and
Bakioglu, 1984; Yalin, 1976). Despite the simplicity in form, their ubiquitous nature and the
10multitude of applied methods and approaches, a satisfactory formulation of the underlying
physical principles has remained elusive and probably still needs many more years of
dedicated research (cf. Kennedy, 1963). As bedform nomenclature is a matter of controversy
between different schools, the terms “sandwave” or “dune” – which both have been
understood purely descriptive by some researchers (cf. Ashley, 1990) but process-related by
others (Yalin, 1976) – are avoided here in favour of the term “bedforms”. Important reviews
of the state of knowledge on subaqueous bedforms are given in other works (Allen, 1968;
Best, 2005; Dalrymple and Rhodes, 1995; McLean, 1990).
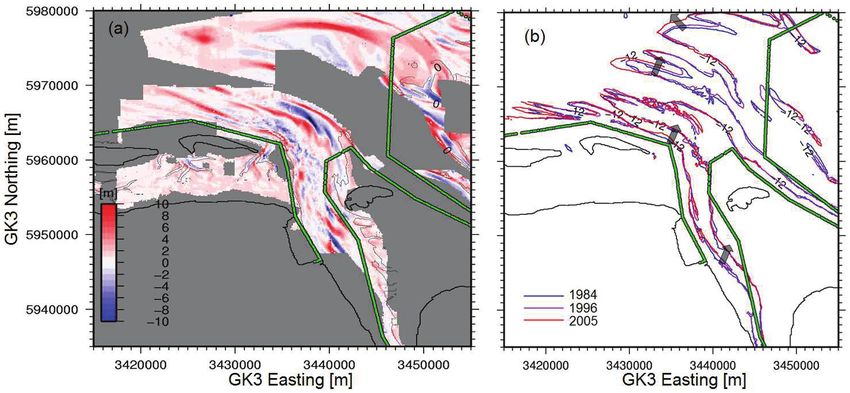
As an example, Figure 4a shows a map of compound bedforms in the Grådyb tidal channel
(Danish Wadden Sea, off Esbjerg harbour) in which the primary (large) forms are in the order
of some hundred meters in length and several meters in height. Smaller, secondary features in
the order of some tens of meters in length and some decimetres in height are super-imposed.
Tertiary bedforms (ripples) may also exist but cannot be sufficiently well resolved. Repeated
ship-based multibeam echo-sounder surveying of the centre of the main navigational channel
over several hours reveal the morphological adjustment of the bedforms (shown in Figure 4b
as an example of a compound dune of 100 m length and 3.5 m height) to the tidal currents. It
can be observed that the upper parts of the compound dune shows horizontal oscillatory
motions in the order of several meters over a tidal cycle, whereas the deeper trough region
seems stable. The large forms can also be recognised over longer time periods, and show
considerable residual migration (Ernstsen et al., 2011).
Figure 4: Compound bedforms in the Gradyb tidal channel (Danish Wadden Sea, North Sea coast)
recorded in 2002. a) Map of the inlet channel at 0.5 m resolution. A series of large (= 200 m long)
bedforms can be seen. b) Detail of the temporal evolution of one compound bedform repeatedly measured
over a period of 16 hours.
The analysis and quantification of bedform dynamics require objective and automated
methodologies to minimise errors in the recognition of the super-imposed small dunes and
thus the allocation of dynamic properties to specific elements. In analogy to the processing of
11time-series (e.g. wave or tidal sea-level analysis), different methods may be applied for an
objective description, dimensioning, and subsequent parameterisation of bathymetry in the
presence of subaqueous bedforms: Simple manual detection of morphological properties (e.g.
defining the positions of troughs and crests), and recognition of individual forms; automated
detection of bedform characteristics in the spatial domain; spectral analysis of bedform
profiles by Fourier transformation and wavelet analysis, and two dimensional Fourier
transformation of bedform fields.
Analysis in the spatial domain
Common approaches for the description and analysis of bedform morphology and migration
mainly consider triangular-shaped elements by linear interpolation between manually detected
crest and trough positions (Hoekstra et al., 2004; Simons et al., 1965). Such procedures,
however, do not allow a sufficiently realistic approximation of the complex bathymetric
patterns found in tidal domains. Instead, all the features resolved by the measurement
technique should be taken into account, which makes the manual recognition of bedforms
subjective and very work intense (Ernstsen et al., 2005). Van der Mark and Blom (2007)
proposed a bedform tracking tool in which geometric variables of individual bedforms are
determined by zero-upcrossing of detrended and smoothed bed elevation profiles. This
method is semi-automatic and still requires the subjective input of the moving average filter.
Ernstsen et al. (2010) extended this procedure by an objective estimation of the size of the
moving trend line to track and quantify secondary bedforms.
Spectral analysis
Spectral analysis can be used to decompose patterns and detect their (time- or) space-
frequency features (Jain and Kennedy, 1974; Winter and Ernstsen, 2007). The spectral
decomposition of measured bed profiles into a set of harmonic constituents by Fourier
transformation has already been suggested by Nordin and Algert (1966) who used auto-
covariance and spectral density analysis to overcome the simplistic description of bedforms as
triangular-shaped bodies. Furthermore, Robert (1988) applied semivariograms as a statistical
method for the investigation of roughness properties of bed profiles obtained from field work
and laboratory experiments. More recent studies use a spectral method to describe changes in
the height, length, and shape of wave-generated ripples which are considered to be the
product of an energy transfer process (Davis et al., 2004).
The high accuracy of modern instrumentation allows the application of spectral methods also
to bathymetric field data. Winter and Ernstsen (2007) applied a spectral decomposition of bed
elevation profiles over compound bedforms of the Grådyb tidal inlet in the Danish Wadden
Sea. Two profiles, measured at high and low water were decomposed by Discrete Fourier
Transformation (DFT) into two sets of harmonic waveforms individually described by their
amplitudes, wavelengths and phases. A comparison of individual waveforms along the two
profiles thus reveals their specific spectral evolution in time. The change in size could be
determined by the difference in amplitude, while the migration distance of the individual
12spectral components can be calculated from the difference in phase. Figure 5 shows an
example of the derived migration distances of all waveforms.
Figure 5: a) Decomposition of two compound dune bed profiles at high water (A) and low water (B) reveal
migration distances by the differences of component phases. b) Recomposition of waveforms considered
static A’s and B’s; c) Recomposition of waveforms considered kinematic A’k and B’k.
Numerical noise is shown by positive and negative migration distances for constituents of
small wavelengths. The summed distances of wavelengths smaller than two meters thus
oscillate near zero. These waveforms of indifferent migration and those featuring a migration
distance of less than 0.25 m were considered as being on average static. By contrast,
waveforms that show larger migration distances were considered mobile (kinematic). The
recomposition of the classified harmonic constituents for the part considered stable is given in
Figure 5b and the kinematic part in Figure 5c. While the stable constituents sum up to a
roughly triangular shaped body which is considered not to move during the ebb time period,
the recomposition of the kinematic constituents exposes the migrating forms as being
approximately ten meters in length and up to one meter in height.
The spectral decomposition of the bathymetric signal into harmonic waveforms of different
frequency clearly has great potential for bedform analysis and modelling (see section 3.1).
However, Fourier transformation assumes a periodicity of the analysed signal, a feature which
does not necessarily hold for bathymetric profiles and which therefore results in considerable
noise in the component spectrum.
Wavelet analysis
Non-periodical sequences like bedform profiles can be analysed by wavelet transformation
(Klees and Haagmans, 2000). The manner by which information about the spatio-temporal
evolution of spectral characteristics can be derived has been shown by Cataño-Lopera et al.
(2009) for laboratory-scale features. Fraccascia et al. (2011) carried out continuous wavelet
13transforms of bathymetric data recorded over seven years (from 2002 to 2009) along a 1600-
m-long transect over natural compound bedforms in the Grådyb tidal inlet. Following the
methodology proposed by Torrence and Compo (1998) for time-series analysis, characteristic
wavelengths of the compound bedforms and their temporal evolution were analysed. It was
shown that the observed bedforms are composed of four dominant wavelengths. This discrete
spectrum was recognized throughout the eight years, confirming an observation by Winter
and Ernstsen (2007) based on Fourier analysis. Although wavelet analysis can reveal
interesting features such as the discrete spectrum composing bedforms, it must be
complemented with other methods to derive information on bedform geometry. So far only
single profiles have been inter-compared. Although seemingly feasible, to the best knowledge
of the author, no studies have yet applied two-dimensional wavelet transformations of
compound bedforms.
2D spectral analysis
The above methods describe the analysis of one-dimensional bathymetric profiles. The
procedures thus require the a-priori subjective judgement on the choice and extraction of the
“right transect”. In the case of current-generated bedforms, profiles normal to the bedform
crests are commonly used if the data allow this choice (not possible for single-beam echo-
sounder profiles). Morphological characterisation and the objective derivation of bedform
orientation and dimensions by using 2D spectral analysis have been shown by Lefebvre et al.
(2011). The spectra descriptors calculated for a series of sub-regions for a domain with a high
variance in bedform occurrence showed characteristic elements of that particular region. In
combining spectral parameters of the sub-regions into an area-wide map, a differentiation into
representative morphological elements was achieved.
2.2 Observation of macro- to mega-scale morphodynamics
Measuring campaigns that are carried out by research institutions are usually restricted by
temporal and financial limitations. As a consequence, the scientific focus is commonly
constrained to spatially limited study areas and the analysis of “snapshots” of the system.
Long-term monitoring of coastal morphology for academic interests alone is hardly possible,
although notable exceptions exist (e.g. COAST3D in the Netherlands, Coastal DUCK in the
USA). However, governmental agencies often carry out extended coastal monitoring
programmes. A wide range of meteorological, hydrographical, physical, biochemical and
morphological parameters are thereby routinely measured at particular locations and varying
time intervals. However, because such programmes are usually undertaken for other than
scientific interests, the choice of locations and range of parameters measured often do not
fully satisfy scientific requirements. Bathymetric surveys of German waters, for example, are
carried out by the Federal Hydrographic Agency (BSH) and the local Waterways and
Shipping Agencies (WSA) in fulfilment of governmental responsibilities for the navigability
of waterways. Their data acquisition and processing schemes are optimised for the assessment
14of morphological states in these particular areas to support decisions on necessary measures to
guarantee safe navigation, e.g. the dredging of shoals considered as shipping hazards. This
implies frequent surveys of the waterways in contrast to rare observations in areas of less
socio-economic interest. At least agreement has been reached on coordinated actions by these
authorities for synoptic bathymetric data acquisition (Wulff, 2005), which makes it a very
valuable source of information on the state and dynamics of the meso- to mega-scale
morphological coastal systems occurring in these areas.
For the visualisation and analysis of morphodynamics, the irregularly-spaced raw bathymetric
data are gridded to structured or unstructured grids to form digital elevation models (DEM).
Different states can then be inter-compared over time at the same discrete points. By the
subtraction of DEMs generated for different time slices, bathymetric difference maps are
produced which allow a spatial quantification of measured residual deposition and erosion.
An example is shown for the outer Jade and Weser tidal channels in the German Bight in
Figure 6a in which the residual erosion (negative) and deposition (positive) patterns for a 21-
year time interval are visualised. The long and slim features aligned parallel to each other
with alternating positive and negative values reveal residual channel migration. Obviously,
large areas of the domain could not be taken into account because either in 1984 or 2005 no
data was available for comparison, thus highlighting a major disadvantage of this method. It
must be emphasized here that seemingly small values in residual differences do not
necessarily mean that little instantaneous transport took place at these locations.
Figure 6: Morphological evolution of the Jade-Weser tidal channels based on BSH datasets between 1984
and 2005. Coordinates are in the equidistant Gauss-Krueger system. (a) Bathymetric differences between
1984 and 2005; negative values represent residual losses of material, areas without data are grey. (b)
Comparison of the 12 m isobath calculated for the years 1984, 1996, and 2005; arrows depict preliminary
interpretation of possible trends.
Bathymetric change between more than two states may also be visualised by comparison of
longitudinal or cross-sectional depth profiles or depth contour lines of different times. In this
15way, characteristic features can be recognised and followed through time. This procedure,
however, limits the analysis to either one cross-section or one (or a few) depth levels as
shown in Figure 6b where the 12 m isobaths derived from 1984, 1996 and 2005 datasets are,
for example, shown for the outer Jade-Weser region. A comparison of these lines allows the
identification of possible trends; however, the four-dimensional morphodynamic system
cannot be derived by interpretation of isobaths only.
The analysis of larger areas and the initialisation of numerical model bathymetries usually
require the compilation of data of different origins and periods into one DEM. Commonly the
most recent (or best quality) data is gridded first which is then successively complemented by
older (or less reliable) data for the remaining regions. To avoid interpolation problems at the
overlapping areas of different datasets Milbradt et al. (2005) present a higher-order algorithm
for a spatio-temporal interpolation between datasets.
The macro-scale morphodynamics of the German Bight have been subject of several studies,
especially with respect to tidal flats. Several authors have provided detailed descriptions of
the morphology and dynamics of tidal flats (e.g. Albers and von Lieberman, 2010;
Bartholomä and Flemming, 1997), tidal inlets and barrier islands (Flemming and Davis,
1994), estuaries (Gönnert, 1996; Winter, 2006a), the offshore (Hüttemeyer et al., 1999), and
the shelf (Diesing et al., 2006) of the German Bight. Commonly, these studies focus on
confined areas but some extensive compilations for larger areas are also available (Ehlers,
1988; Niemeyer et al., 1995; Schüller, 1991). For the southern German Bight - from the Ems
to the Elbe - Homeier et al. (2010) have recently analysed numerous charts and maps
spanning four centuries (1650-1960), compiling these into a consistent mega-scale picture.
Winter (2011) gives an overview of the mega-scale morphodynamics of the whole German
Bight at meso-scale resolution. A simple parameter is defined for the quantification of coastal
morphodynamics based on bathymetric data of various times and variable spatial extent: The
bed elevation range (BER) takes into account bathymetric data from the period 1982-2008
and is shown for the German North Sea coast (Figure 7). The parameter BER is the envelope
of the bed evolution and may be understood as the morphodynamic spatial domain in which
the morphological evolution takes place. The compiled data shows the highest morphological
activity in the outer estuary tidal channels of the East Frisian coast and along the northwest
coast. Considering the known distributions of tidal currents and wave energy along the
German Bight coastline, it was suggested that the main morphodynamic drivers along the East
Frisian coast are the tidal currents, whereas the high morphologic activity along the northwest
coast can be viewed as being forced by waves.
16Figure 7: Macro-scale morphodynamics of the German North Sea coast as imaged by the bed elevation
range BER. Positions are given in UTM32 (ETRS89) and geographic coordinates (WGS84).
2.3 Summary
Coastal morphodynamics are observed across several spatio-temporal scales. Although
observation technology has greatly advanced, it is still mostly limited to a focus on residual
morphologic changes. The morphodynamics are thus decoupled from the dynamic processes
(hydrodynamics, sediment transport). Bathymetric measurements constitute time slices in a
continuously changing environment. Interpolation between surveys is possible if sufficient
data (spatial and temporal resolution) are available. For a comprehensive analysis of coastal
morphodynamics, however, all relevant processes should be known. As the simultaneous
measurement of the coherent hydrodynamic and sediment dynamic properties is not feasible
at all relevant time and length scales in the field, other approaches are needed: Dedicated
laboratory model experiments on the bed-fluid interface can focus on physical processes
under controlled boundary conditions. In addition, mathematical models can be introduced to
serve as higher-order tools for the spatio-temporal inter- and extrapolation of field data and
scenario analysis.
173 Morphodynamic modelling
A model is commonly defined as being a ‘representation of essential system aspects with
knowledge being presented in a workable form’ (Van Waveren et al., 1999). A model can thus
be a simplification or interpretation of data (e.g. a Digital Elevation Model), a conceptual
view, a physical representation (e.g. a down-scaled prototype in a laboratory flume
experiment), or a description of a system based on mathematical formulations. The latter
mathematical models span wide ranges of objectives and complexity. Mathematical model
concepts may be data oriented (only based on interpretation of measured data) to fully process
oriented (deterministic models based on physics). Empirical relationships or neural networks
are examples of purely data driven models. Soft hybrid models, which use process-oriented
numerical modules in a neural network environment, and numerical models with data
assimilation are intermediate concepts. Fully deterministic models describe the physics of a
system by formulations which are based on first principles and are solved by direct numerical
simulation (DNS). Models may also be classified into their domain of application (e.g.
hydrodynamic, ecological, morphological, meteorological models), their spatial dimension
(e.g. one-dimensional (1D), two-dimensional depth-averaged (2DH), three-dimensional (3D)),
or practical application (e.g. to answer academic, scientific, administrative, or commercial
questions).
The term modelling can be understood to encompass the process of model design, the
development, the model set-up, the model calibration and validation, and the application of
models. Simulation or model experiment are similar terms which may be used to describe
the process and product of modelling a system under certain sets of parameters and boundary
conditions. This chapter introduces mathematical model concepts and leads to a description of
2DH and 3D process-based morphodynamic numerical models. Model and data reduction
schemes are introduced and the modelling procedure is briefly described. Some
morphodynamic model applications are discussed and common shortcomings are highlighted.
3.1 Morphodynamic model concepts
Non-mathematical representations of system behaviour can be called conceptual models.
These may include schematised and simplified visualisations of complex processes, flow
charts or diagrams representing inter-relations between processes or model entities. They may
stand alone to interpret or explain observed features if fundamental knowledge on the
underlying processes is limited. Conceptual models also form a crucial first step in the
development and application of more complex models. Prominent examples of conceptual
models are the sequence of beach morphological states as defined by Wright et al. (1985),
delta sediment dynamics such as the one by Kana et al. (1999), the response of the East
Frisian Wadden Sea to sea-level rise by Flemming and Bartholomä (1997), or the estimated
18large-scale sediment transport pathways in the German Bight described by Sündermann and
Klöcker (1983). A conceptual model in which the formation of saddle shaped subaquous
dunes in a tidal channel was explained by inter-action of currents, sediments and local
bathymetry has been suggested by Ernstsen et al. (2005).
Behaviour oriented models are built from mathematical expressions or rules derived from
experiments, experience or conjecture, but not directly from first-order principles. Often
dimensionless variables are defined (e.g. the Shields parameter) and equations are found as a
best fit function between parameters. Examples for empirical models on coastal morphology
include the relation of temporal scales T (time), spatial scales L (length) and Z (depth) through
a transport rate q=ZL/T, in which typical values for q were found to be in the range 10-5 to
10-6 m²/s. This holds for environments of sufficient sediment supply and current strength and
may also be used to estimate the largest spatial scale at which coastal morphology can adapt
to sea-level rise (Dronkers, 2005). Other examples are the Bruun rule for coastal retreat
(Bruun, 1962) or the Dean Rule for shoreface slope (Dean, 1990). A well established
empirical relationship between the tidal inlet cross-sectional area A and the tidal prism P (at
spring tide) was given by O’Brien (1931) as A=cPn with the exponent n in the order of one
and a constant c in the order of 10-4. Alternative empirical relationships between inlet cross-
section and tidal prism are inter-compared by Stive and Rakhorst (2008). Other behaviour
oriented concepts include the geometric fitting of log-spiral curves to embayed beach
planforms, which have led to widely accepted assessment and prediction options for beach
equilibrium states (Silvester and Hsu, 1997). A diffusion type behaviour model of beach
profile change is described by de Vriend et al (1993a). Winter and Ernstsen (2007) formulate
a dynamic 1D behaviour model to analyse bedform super-imposition based on empirical
equations and a spectral decomposition of compound tidal bedforms.
Ranging in complexity between empirical formulations, which describe static equilibria
between state variables, and numerical solutions of the full set of fundamental equations,
cellular automata models are tools to simulate the spatial and temporal evolution of some
system properties. These properties are defined for and communicate on discrete grids. The
system behaviour here is assumed to be governed by a given set of abstract rules. Conceptual
ideas, empirical formulations or simplified fundamental processes may be coupled and
expressed in communication rules which drive the interaction between cells. Two dimensional
cellular models have, for example, been constructed to explain self-organized formation of
beach cusps (Werner and Fink, 1993), barchan dunes (Zhang et al., 2010), braided rivers
(Murray and Paola, 1994), or the long-term morphodynamics of shoreline evolution due to
waves (Ashton et al., 2001).
In principle, complex process-based models are based on the theoretical understanding of the
underlying physical processes. The governing equations are set as partial differential
equations from the fundamental physical laws such as conservation of mass, momentum, and
energy. If approximated by numerical approaches, the direct numerical simulation (no
parameterisation and turbulence sub-models) of the Navier-Stokes equations, which describe
19the motion of fluids, is possible. However, in that case all spatial and temporal scales of the
hydrodynamics (flow and turbulence) must be resolved – down to the smallest dissipative
scales of turbulence. The required very high grid resolution and very small time-steps of
simulations lead to very high computational demands. The direct simulation of processes
relevant to the topic of coastal morphodynamics is thus reduced to boundary layer studies at
small scales and relatively low Reynolds numbers (Ferziger and Periü, 2001). The application
of direct numerical simulation to coastal morphodynamic scales is therefore not feasible yet.
The direct simulation of flow structures in combination with discrete element methods or
smoothed particle methods, however, are very promising lines of research – in particular
when considering the increasing computational resources expected to be available in the
future (Papista et al., 2011; Schmeeckle and Nelson, 2003).
Stability concepts
Many morphologic patterns observed in the coastal environment can be related to instabilities
produced by the flow response to seabed perturbations: Sand dunes, ripples, beach cusps, rip
cells, breaker bars, meandering and braiding channels, tidal flats, and sand banks all have in
common that their characteristic wavelengths are not evident in the external driving
conditions. For highly idealised topography and for a limited range of spatial and temporal
scales, morphodynamic feedbacks can be solved analytically. Linear stability analysis aims
at the initial response of a system to an infinitesimal perturbation of a basic equilibrium state.
In this initial phase the perturbation is considered so small that the flow pattern is hardly
changed. The flow response is assumed to react linearly – and can thus be formulated by
linear equations which can, in some cases, be solved analytically. The linear approximations
do not hold for large growth rates in which the importance of nonlinear processes increases
(e.g. flow separation, gravity induced down slope transport, shift from bed load to suspended
load at ripple crests). Linear stability models thus indicate the 'initial tendency' to pattern
formation starting from small fluctuations of certain equilibrium. This initial tendency
involves the shape and horizontal length scales of the pattern but not its amplitude (Nemeth et
al., 2002). Dronkers (2005) gives an example of the growth of an initial perturbation, which
expands exponentially and migrates depending on the phase difference between the initial
perturbation and the sediment balance. Weakly nonlinear analyses are based on the
assumption that nonlinear effects are of limited importance to the morphodynamic system; for
example, that bedforms of some amplitude are still small in some sense and their development
can be explained by means of a perturbation approach (Blondeaux, 2001). Such analyses have
also been used to investigate coastal morphodynamics. However, they are not applicable
when nonlinear effects are strong, in which case only numerical approaches can simulate the
dynamics of the system (Besio et al., 2008).
Complex morphodynamic models
If the relevant physical processes are known, formulated (written as mathematical equations),
discretised (translated to a form that can be calculated numerically), and implemented (coded
and compiled) into computational modules, complex process-oriented modelling systems can
be developed by coupling the modules that describe sub-processes of the full system. In the
20case of coastal morphodynamics, hydrodynamic (wave and currents), sediment transport
(bedload and suspended load) and bed evolution models are coupled to simulate the physical
system as shown in Figure 1. Depending on the complexity of formulation and spatial
dimension and on typical model application scales, different complex modelling systems can
be classified (Figure 8): Coastal profile models describe the evolution of beach profiles over
time by calculating the cross-shore sediment transport in response to changing boundary
conditions. These cover timescales of storms to seasons (Van Rijn et al., 2003). Coastal
shoreline models describe the evolution of one or several coastlines (isobathymetric
contours) under variable forcing. One-line models describe the evolution of a constant shore
profile. Such models can be based on behaviour oriented rules, analytical expressions, or
numerical approaches. Typical ranges of application are shorelines of some kilometres and
their development over years to decades (Hanson et al., 2003a). These concepts have been
extended by multi-line (or n-line) models, in which the cross-shore profile can be discretised
by several layers. These models have been applied to larger domains (1–100 km) with time
scales ranging from seasons to centuries (Steetzel et al., 1998; Sutherland, 2007).
Figure 8: Spatial and temporal scales and applicable morphodynamic modelling systems. Shown are
typical ranges of Discrete Element Models (DEM), non-hydrostatic 3D morphodynamic models (NH 3D
MDM), 3D coastal area morphodynamic models (3D MDM), 2DH coastal area morphodynamic models
(2DH MDM), rapid assessment of morphodynamics models (2D RAM), 1D coastal profile models (1D
CPM), 1D shoreline models (1D SM), 0D empirical models (0D EM).
21Coastal area models simulate the relevant processes on discrete computational grids
covering the entire domain under investigation in 2DH (two-dimensional, vertically
integrated) or 3D. Numerous morphodynamic model studies with scientific or applied aims
cover schematic or idealised settings (Nicholson et al., 1997; van der Molen et al., 2004), and
natural environments like estuaries (Hibma et al., 2003; Winter, 2006a), embayments (Mason
and Garg, 2001b), tidal channels and flats (Albers and von Lieberman, 2010; Dissanayake et
al., 2009), inlets (Cayocca, 2001; Ranasinghe and Pattiaratchi, 1999; Wang et al., 1995),
beaches (Daly and Winter, 2011), or other coastlines (Lesser et al., 2004; Tonnon et al.,
2007). Time scales typically cover engineering time and length scales from the meso- to
macro-scale. Recent developments allow the simulation of flow and sediment dynamics in full
3D - without the common hydrostatic pressure assumption, which does not incorporate
vertical velocity gradients (Figure 9). Fully 3D non-hydrostatic micro-scale morphodynamics
are still limited to very small domains due to the very high computational demand (Giri and
Shimizu, 2006; Kheiashy et al., 2010).
Figure 9: 2DV high-resolution simulation (non-hydrostatic Delft3D-Flow modelling system) of the flow
structure induced by large compound bedforms in a tidal channel. The model resolution is 0.2 m in the
vertical and 0.5 m in the horizontal, thus enabling (a) a detailed picture of the flow separation on the lee
side of the bedforms in the instantaneous currents. The temporal integration of the velocities over one
tidal cycle reveals (b) the residual circulation patterns that are assumed to induce and contribute to the
development on the large bedforms.
223.2 The modelling process
The process of coastal morphodynamic modelling involves all steps of model development
and model application. Commonly modelling is understood as a continuous process of
conception and formulation, coding and compiling, verification, calibration, validation and
application, often performed by the same person – the “modeller”. However, the complexity
of modern numerical modelling systems, the availability of flexible user-friendly and stable
software products, and the vast range of applications coupled with the growing acceptance of
model simulations in science and decision support have led to a separation of the model
development stage and the model application. Today open source or commercial products are
often developed and maintained by some (expert) developers and applied by a much larger
number of (expert) users for dedicated modelling projects. The process of model verification
in model development is understood as the technical confirmation whether a mathematical
equation is correctly implemented in a computer program. Model verification from a user
point of view is the choice of the right modelling system based on well defined criteria.
However, morphodynamic modelling system inter-comparisons or –census are rarely
published (Van Riesen and Much, 2009).
Numerical models are today standard operational tools in academics, administration, and
consultancy. A wide range of modelling systems is easily available and increasingly applied
in decision support issues of different kinds. Growing initiatives like the Community Surface
Dynamics Modelling System (CSDMS) or OpenEarth.nl not only provide access to free
(public domain and open source) modelling systems but also the required pre- and
postprocessing software, input data, and even computational resources. At the same time there
is a growing public acceptance of the often colourful and spectacular three-dimensional
animated simulation results. Availability, the ease of applicability, exaggerated expectations
of stakeholders, and economic interests thus makes inexpert use of models an issue of
growing concern (Thieler et al., 2000). Not only shortcomings of model formulations or faulty
code implementations may lead to unreliable results, but also avoidable issues like missing
model verification (the test of the suitability of the model approach to the problem), careless
treatment of input data (incorrect “default” model parameters and boundary conditions),
insufficient calibration (the tuning of the model to fit measured data), and missing or
incomplete validation (the quantification of model skill based on independent data that was
not used for the calibration). The large number of different modelling systems and model
versions, and the vast variability of model applications also impede an objective inter-
comparison or evaluation of models. Considerable effort has been spent to develop objective
and generally accepted guidelines and standards for reliable, reproducible, and transferable
modelling (Gerritsen et al., 2007; Scholten et al., 2001; Van Waveren et al., 1999; Winter,
2007). Some model standard datasets (e.g. Mayerle and Winter, 2010) and procedures (e.g.
BAW Standard Validation Document) have been proposed, which could offer the opportunity
for objective model inter-comparison. Realistically seen, however, economic interests and
23You can also read