ICES WGSCALLOP REPORT 2018 - ECOSYSTEM PROCESSES AND DYNAMICS STEERING GROUP Report of the Scallop Assessment Working Group (WGScallop)
←
→
Page content transcription
If your browser does not render page correctly, please read the page content below
ICES WGSCALLOP REPORT 2018
  E COSYSTEM P ROCESSES   AND   D YNAMICS S TEERING G ROUP

                            ICES CM 2018/EPDSG:13

                                    R EF . ACOM, SCICOM

Report of the Scallop Assessment
       Working Group (WGScallop)

                      10-12 October 2018

                                            York, UK
International Council for the Exploration of the Sea
Conseil International pour l’Exploration de la Mer
H. C. Andersens Boulevard 44–46
DK-1553 Copenhagen V
Denmark
Telephone (+45) 33 38 67 00
Telefax (+45) 33 93 42 15
www.ices.dk
info@ices.dk

Recommended format for purposes of citation:

ICES. 2018. Report of the Scallop Assessment Working Group (WGScallop), 10–12
October 2018, York, UK. ICES CM 2018/EPDSG:13. 52 pp.

The material in this report may be reused for non-commercial purposes using the
recommended citation. ICES may only grant usage rights of information, data, imag-
es, graphs, etc. of which it has ownership. For other third-party material cited in this
report, you must contact the original copyright holder for permission. For citation of
datasets or use of data to be included in other databases, please refer to the latest
ICES data policy on ICES website. All extracts must be acknowledged. For other re-
production requests, please contact the General Secretary.

The document is a report of an Expert Group under the auspices of the International
Council for the Exploration of the Sea and does not necessarily represent the views of
the Council.

© 2018 International Council for the Exploration of the Sea
ICES WGSCALLOP REPORT 2018                                                                                                                    | i

C o nten ts

       Executive summary ................................................................................................................ 2

       1      Administrative details .................................................................................................. 3

       2      Terms of Reference ........................................................................................................ 3

       3      Summary of Work plan ................................................................................................ 4

       4      Summary of Achievements of the WG during 3-year term ................................... 4

       5      Final report on ToRs, work plan and Science Implementation Plan ................... 5
              5.1      In response to ToR 1 ............................................................................................. 5
              5.2      In response to ToR 2 ............................................................................................. 7
              5.3      In response to ToR 3 ............................................................................................. 7
              5.4      In response to ToR 4 ............................................................................................. 7
              5.5      In response to ToR 5 ............................................................................................. 8
              5.6      Science highlights ............................................................................................... 22

       6      Cooperation .................................................................................................................. 45

       7      Summary of Working Group self-evaluation and conclusions .......................... 45

       Annex 1: List of participants............................................................................................... 46

       Annex 2: Recommendations ............................................................................................... 47

       Annex 3: WGScallop draft resolution 2019–2021 ............................................................ 48

       Annex 4: WGScallop self-evaluation 2016–2018 ............................................................. 51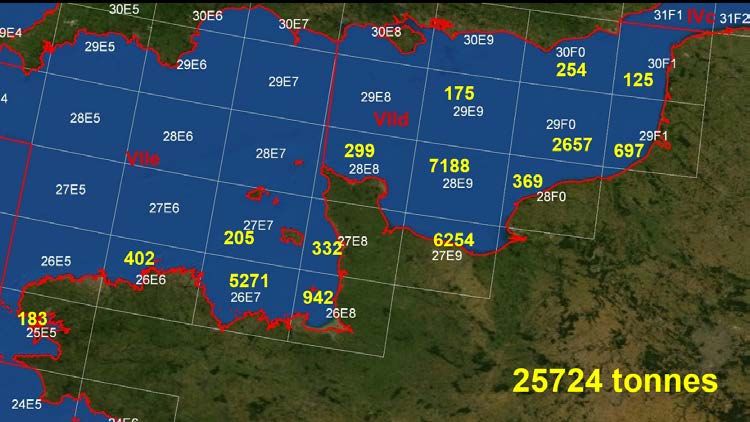
2 |                                                             ICES WGSCALLOP REPORT 2018

Executive summary

      The ICES Scallop Assessment Working Group (WGScallop) met in Aberdeen (2016), Bel-
      fast (2017) and York (2018) with an average of 16 participants from 8 countries. The main
      terms of reference for the working group were to update and provide data and exchange
      knowledge on the various scallop fisheries in the Northeast Atlantic region. This includ-
      ed the compilation of available scallop fisheries data and the production of maps to better
      identify stock boundaries and inform spatial management.
      The WG also considered the various assessments for scallop stocks and reviewed the
      recent developments in the English Channel. The scallop stocks in the Baie ds Seine have
      experienced extremely large recruitment events over the past few years and the group
      has discussed the fisheries management measures in this region.
      Over the last few years, the English Channel has also seen the re-introduction of a scallop
      data collection programme, a cooperative industry survey and stock assessment. The WG
      reviewed the approaches and made recommendations on the methodologies which were
      accepted and included in the most recent assessment.
      A main focus of the group has been understanding the scallop ecosystem and the impacts
      of fishing. A number of work areas have been delivered which examined marine spatial
      planning and potential benefits of seasonal closures, Marine Protected Area’s and Euro-
      pean marine sites as conservation zones and possible recruitment supply areas for scallop
      populations. A number of projects have recently been established through the EU Inter-
      reg programme and the WG is keen to see how these develop over the next few years.
      The WG has made significant progress in terms of establishing an international scientific
      forum where resources, knowledge, experience and insights can be exchanged. This is
      evident in the recent advances in the use of use of camera systems to complement exist-
      ing survey work. Image surveys are expanding due to information exchange; presently
      they are being conducted in Canada, Iceland and the United States; further cameras are
      increasingly being used to examine dredge performance and habitat and are used or be-
      ing trialled in various UK surveys.
      The overall objective of the group continues to be providing scientific advice on scallops
      and defining a common approach to the assessment of scallop stocks. In 2018, for the first
      time all stocks were assessed using an independent fisheries survey. The WG under-
      stands there are still limitations and uncertainties surrounding future funding sources for
      surveys and are also considering fishery dependent indicators and their possible uses to
      inform stock status.
      The growing need for global assessment and advice of scallops is becoming increasing
      apparent and the group plans to use the Baie Des Seines/English Channel and the Irish
      Sea/Isle of Man fisheries as case studies to explore possible management frameworks and
      to continue with the progress of assessments for all scallop stocks.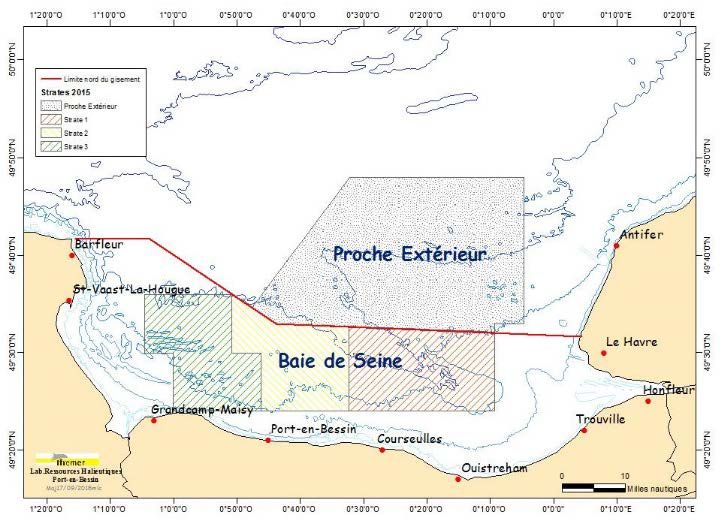
ICES WGSCALLOP REPORT 2018                                                                        | 3

1      Administrative details

       Working Group name

       Scallop Assessment Working Group (WGScallop)

       Year of Appointment within current cycle

       2016

       Reporting year within current cycle (1, 2 or 3)

       3

       Chair(s)

       Kevin Stokesbury, USA

       Meeting dates and venues

       3–7 October 2016, Aberdeen, Scotland, UK (16 participants)
       10–12 October 2017, Belfast, Northern Ireland, UK (14 participants)
       10–12 October 2018, York, England, UK (18 participants)

2      Terms of Reference

       The focus of the first 3-year working group (2013 to 2015) was to provide scientific advice
       on scallops and define a common approach to the assessment of scallop stocks. The
       workshop focussed ICES areas: IIa, IVa, IVb, V, VIa, VIa and IVb, VIIa, VIId, VIIe/h, VIIg,
       and VIII. Scallop species and biological stocks were identified in each of the ICES areas.
       The ToR for this 3-year period (2016 to 2018) were:
           1.     Compile and present data on landings and fishing effort that enables the follow-
                  ing data products to be produced at as high a spatial resolution as the available
                  data allows in ICES areas IV, VI and VII. Refer to WGScallop 2015 for methodol-
                  ogies
                      a.   maps of fishing pressure, fishing effort and landings
                      b.   GLM/GAM standardised LPUE indicators of stock status
                      c.   maps of relative abundance of scallop
                      d. best estimates of absolute abundance using available habitat specific gear
                           efficiency estimates
                      e.   estimates of area of stock distribution exposed to fishing each year
           2.     Identify larval source sink patterns to
                      a.   Inform managers of MPAs and European Marine Sites (EMS) of the po-
                           tential value of protected areas as sources of scallop recruitment
                      b.   Identify populations that are important sources of larval supply, A) Re-
                           view of current research underway on scallops, focusing on population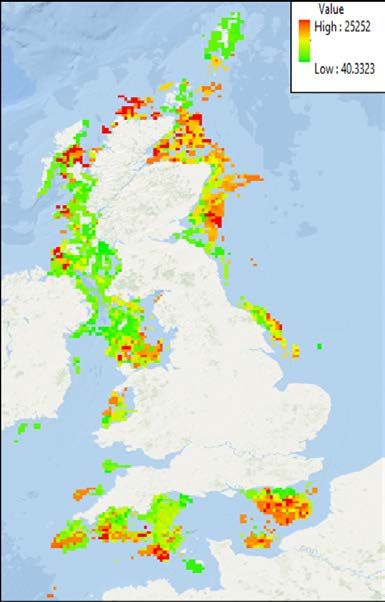
4 |                                                                ICES WGSCALLOP REPORT 2018

                        dynamics, stock structure, life history and habitat impact of fisheries. B)
                        Compare basic models derived from landings and effort to more com-
                        plex models where they are available. (link to WKLife)
          3.   By-catch fish, discard scallop mortality – compile data, see if we can create a uni-
               versal data base (observer trips).

      For the 2017 and 2018 meetings these ToR were expanded upon based on needs identi-
      fied by the group to include:
          4.   Estimate scallop discard mortality
          5.   Review the scallop aging experiment and determine best-practises for further ag-
               ing work
          6.   Review the scallop stock assessment approach and methodologies developed for
               stock in English waters and comment on the appropriateness of the approaches
               to deliver metrics of stock biomass and exploitation rate suitable for use in a
               management context.

3     Summary of Work plan

      To complete compilation of landings, effort, fishing distribution data and to derive basic
      indicators of stock status. Evaluate how stock assessment methods proposed by WKLife
      can be applied to scallop stocks. Evaluate the potential benefit of MPAs and European
      marine sites as sources of scallop recruitment. Evaluate and report on bycatch species
      composition and also on discard mortality rates of undersize scallops with reference to
      the EU landings obligation

4     Summary of Achievements of the WG during 3-year term

      Overview

         •     The first benefit of ICES Scallop working group is the gathering of the group of
               scientists working on the King, Queen and Icelandic scallop fisheries togeth-
               er to exchange knowledge, experience and insights.
         •     To address questions globally as well as locally by sharing and expanding re-
               sources and knowledge.
         •     Focused on understanding the scallop within its ecosystem and the impacts of
               fishing.
         •     Work includes examining effects of the environment on life history and the
               impacts of fishing on benthic communities.
         •     Examined marine spatial planning and potential benefits of MPA’s and Euro-
               pean marine sites as conservation zones and recruitment supply areas for scal-
               lop populations.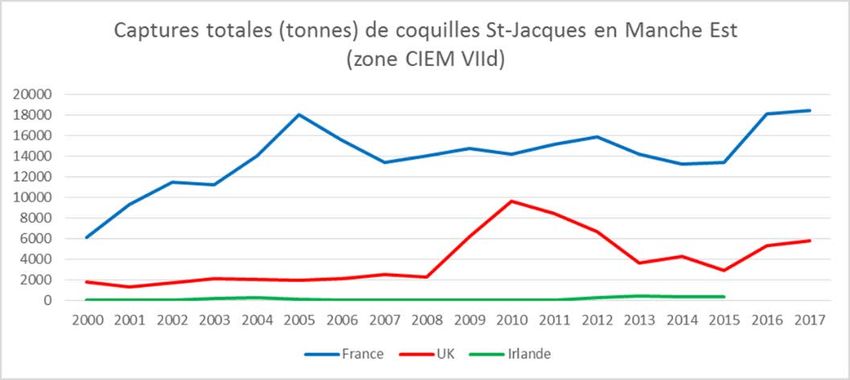
ICES WGSCALLOP REPORT 2018                                                                                  | 5

       Presentations of Working group products

          •    Stokesbury, K.D.E. Overview of ICES scallop working group 2013 to 2016.
               South Western Fish Producer Organization Ltd, Brixham, England, 11 Oct
               2016.
          •    Stokesbury, K.D.E. ICES Scallop Working Group Overview. International Pec-
               tinid Workshop, Portland, Maine, April 2017
          •    Numerous presentations at the pectinid Workshop from members of the
               WGScallop.

       Data products and methodological developments

          •    In 2018 for the first time all stocks were assessed using an independent fisher-
               ies survey.
          •    Image surveys are expanding due to information exchange; presently they are
               being conducted in Canada, Iceland and the United States; further cameras are
               increasingly being used to examine dredge performance and habitat.
          •    Technology exchange including electronic observer data collection (Nestform),
               video technology and automatic processing, VMS and GIS mapping including
               google map open access video catalogues.

       Advisory products

          •    Review and revision of the industry cooperative scallop survey of the English
               Channel.
          •    Development of volunteering rotational plan accepted by French fishermen in
               the Baie des Seine to improve harvest of a large recruiting year-class in 2018,
               based on examples from rotation management in the Gulf of Maine USA.
          •    Although not a direct product of the WG during the six years of its existence
               we have identified, observed and reported on four of the largest recruitment
               events ever observed in scallop populations; the stocks are in the France (Baie
               des Seine), Canada (Georges Bank and Browns Bank), Isle of Man, and the
               United States. This would seem an unusual opportunity for a WG, which we
               would like to follow up with further study of the potential drivers.

5      Final report on ToRs, work plan and Science Implementation Plan

5.1    In response to ToR 1

       Compile and present data on landings and fishing effort that enables the following data products to
       be produced at as high a spatial resolution as the available data allows in ICES areas IV, VI and VII.
       Refer to WGScallop 2015 for methodologies

          a ) maps of fishing pressure, fishing effort and landings
          b ) GLM/GAM standardised LPUE indicators of stock status
          c ) maps of relative abundance of scallop
          d ) best estimates of absolute abundance using available habitat specific gear effi-
              ciency estimates
6 |                                                                       ICES WGSCALLOP REPORT 2018

         e ) estimates of area of stock distribution exposed to fishing each year
      The working group has established information on the location of fishing effort, methods
      of surveying, population dynamics, biological parameters, fishery reference points and
      habitat impacts for the King, Queen and Icelandic scallops in ICES areas: IIa, IVa, IVb, V,
      VIa, VIa and IVb, VIIa, VIId, VIIe/h, VIIg, and VIII, as outlined by the ToR’s, as they
      stand now based on the research of individual groups and organizations. Some infor-
      mation is sparse or lacking such as population dynamics and reference points by stock.
      Each meeting, updates on the stock assessments from different areas are presented (refer
      to summaries below). VMS data is being compiled and examined that includes kilowatt
      days, and VMS hours by ICES rectangle or on a finer scale, and the WG has reached out
      to the WG? For example an overview of VMS data was presented by Bryce Stewart on the
      King scallop fleet activity in 2015 (Figure 1). However, effort from the southern Irish Sea
      is missing. There is a continuing difficulty in compiling these data from different coun-
      tries, particularly for near shore populations, fished by smaller vessels.

      Figure 1. King scallop fleet activity in 2015 by J Holden, A Caeen, B. Lart and B. Stewart.

      In 2018 for the first time all the scallop stocks in the ICES area had independent stock
      assessment surveys. Gear type and configuration vary by country and agency, but each
      were detailed at the working group. Experiments examining the selectivity and efficiency
      of the sampling gear continue and turning these relative estimates of abundance in to
      absolute estimates is still a huge challenge. On-going research to better understand
      dredge efficiency includes outreach to fishermen on best fishing practises, high resolution
      depletion studies and camera work, both examining how the dredge fishes underwater
      and comparisons between different high-resolution density estimates. Work is also un-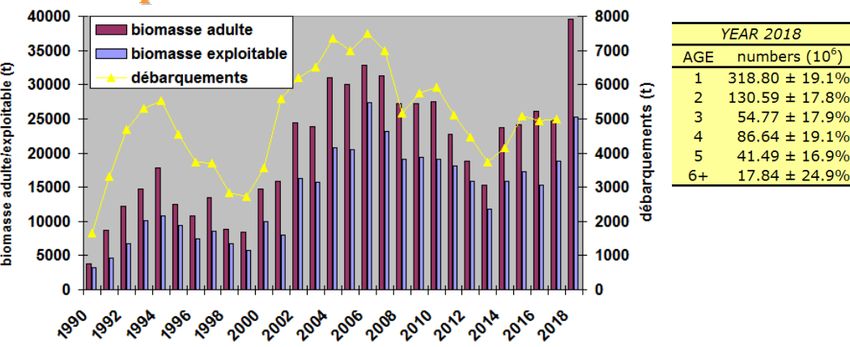
ICES WGSCALLOP REPORT 2018                                                                                  | 7

       derway comparing different stock assessment models such as the CASA to examine dif-
       ferent approaches given our present data limitations.
       A continuing concern is the cost of funding independent surveys. Although this year all
       stocks had an independent survey, continuing support of surveys in the Isle of Man, the
       Celtic Sea, Northern Ireland and Cardigan Bay are all in question. A continual debate
       within the working group is the use of dependent verses independent data for stock as-
       sessment somewhat reflective of the larger discussion being held in a number of fisheries
       (for example “Does catch reflect abundance? Nature 2013, vol 494: 304–306).

5.2    In response to ToR 2

       Identify larval source sink patterns to

          a ) Inform managers of MPAs and European Marine Sites (EMS) of the potential val-
              ue of protected areas as sources of scallop recruitment
          b ) Identify populations that are important sources of larval supply
       In the previous 3 year report (2013–2015) results were presented on a large scale effort
       from France entitled the “COMANCHE Project: Ecosystem interaction and anthropogen-
       ic impacts on king (Pecten maximus) populations in the English Channel” (presented by E
       Foucher at the 21st pectinid Workshop). This project detailed connectivity between differ-
       ent scallop populations highlighting three major functional units (Bay of Seine, Nor-
       mand-Breton Gul and South-western coast of England). Work is also continuing on
       connectivity with a focus in the Celtic Sea where there seems to be a good deal of genetic
       structure within the populations of King scallop.

5.3    In response to ToR 3

       By-catch fish, discard scallop mortality – compile data, see if we can create a universal database
       (observer trips)

       By-catch and discard mortality are two major issues facing this fishery and have direct
       impacts on its classification of sustainability. Presently a number of countries are collect-
       ing detailed information on by-catch in their fishery independent surveys. There also
       have been several studies on discard mortality (i.e. Scotland, the Isle of Man, and Wales).
       Plans are underway to develop a uniform by-catch database compiling the information
       from these different independent surveys and this work will continue at the next meet-
       ing.

5.4    In response to ToR 4

       Review the scallop aging experiment and determine best-practises for further aging work

       In 2013, WGScallop first discussed and compiled information on available data and stock
       assessment methods for scallops. Many institutes rely heavily on ageing methods but
       there are no common methodologies or protocols and this issue has been highlighted and
       discussed at previous meetings. In 2017, WGScallop agreed to implement a scallop (Pec-
       ten maximus) exchange between the institutes. A random sample size of 20 scallops from
       each institute was agreed and an excel template designed. All institutes were requested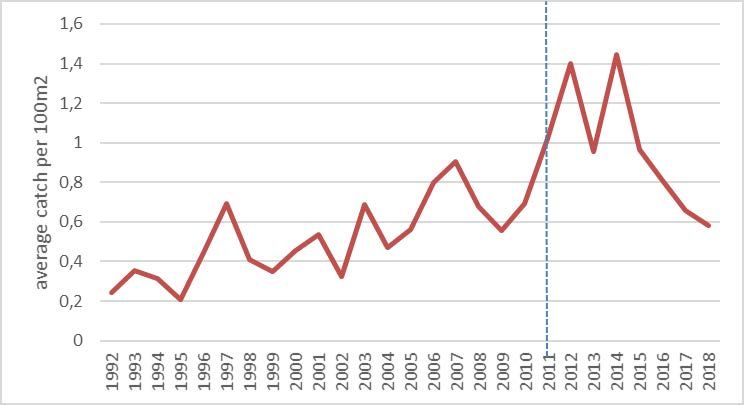
8 |                                                                    ICES WGSCALLOP REPORT 2018

      to provide information on the time of year caught, area/bed, first ring, and time of
      spawning for their submitted scallops. There are no agreed protocols or methodology
      but it was agreed that all scallops should be aged independently and the group also
      agreed that height measurements of each ring would be useful. Institutes uploaded doc-
      uments to the share point detailing their own methodology and standard operating pro-
      cedures, but the understanding was that each institute was going to implement their own
      methods to age the scallops received.
      A total of 111 scallops from six institutes were circulated. Results have been received for
      1200 scallops aged by 20 different readers from six institutes. Scallops have recently been
      received from another institute who wishes to participate; and other institutes have re-
      ported that they are in the process of entering and collating their data and will send
      shortly. Data will be analysed over the next year and results presented to the WG next
      year.

5.5   In response to ToR 5

      Review the scallop stock assessment approach and methodologies developed for stock in English
      waters and comment on the appropriateness of the approaches to deliver metrics of stock biomass
      and exploitation rate suitable for use in a management context

      ‘Scallop wars’ highlight the need for improved international co-operation in fisheries management

      The recent ‘scallops wars’ in the English Channel saw scallop fisheries hitting the head-
      lines around the UK, France, and indeed the world. The dispute was largely between
      British and French ships over access to scallop fishing grounds in the Bay of Seine off the
      coast of Normandy in northern France. Tensions have existed for over a decade, but the
      most recent conflict in September 2018 saw 40 small French boats try to chase off five
      larger British boats. Stones were thrown and boats collided, but there were no injuries or
      sinkings.
      The scallop wars have two underlying, root causes. The first is that there are two groups
      of fishermen, targeting the same species in the same area but under different rules. A
      local regulation prohibits French boats from targeting scallops in the Bay of Seine until
      October each year. But this French regulation does not apply to British or other nations
      boats.
      In previous years, the French fishermen have persuaded the larger UK boats to stay away
      until October by transferring extra European fishing allocation to them, so they can fish
      in other areas. This year, with Brexit looming, and after increased numbers of under 15 m
      British boats fished the area in 2017, this “gentleman’s agreement” broke down.
      Although it is legal for boats from Britain, Ireland and other countries to fish in the area
      before October, the frustration of the French fishermen is understandable. Over a decade
      ago, France instigated highly progressive management measures for its scallop fishery
      (see below), including limits on licences, reductions in boat and gear size, time re-
      strictions, and increases in dredge mesh size.
      Now scallop stocks in the Bay of Seine are at near record levels, but vessels from other
      countries are catching them before the French are allowed to go fishing themselves. In
      comparison, although there are now efforts to improve the sustainability of the scallop
ICES WGSCALLOP REPORT 2018 | 9
fishery around the UK, catch rates are declining overall, while the the number of scallop
fishing boats has increased from 135 a decade ago to more than 200 now.
The second root cause is that nomadic boats from the UK and other countries have no
links to the local community that depends upon the scallops in the Bay of Seine. Small
boats, such as the French use, have a limited range and depend entirely on what they can
catch in the area. In such situations where there are extensive kin ties and shared com-
munities, fishermen are much more likely to develop informal agreements with regard to
who fishes where.
Of course, such tensions work both ways. For many years the French trawled for sea bass
in the English channel, disadvantaging UK fishers who were banned due to concerns
they would catch too many dolphins by mistake. The French fishery was only stopped by
the EU when sea bass stocks collapsed.
It has been suggested that this is just a skirmish before the ‘battle of Brexit’. Ships from
elsewhere in the EU take more fish from UK waters than the British fleet does and many
in the UK fishing community would like to see reform that addresses what they see as an
injustice. The problem is that most fish are not scallops, which rarely move, but instead
undergo annual migrations across international boundaries. Therefore preventing fishing
in one area may not necessarily reduce access to stocks.
In the absence of robust international agreements that manage stocks rather than areas,
and respect the fact that neither fish nor shellfish care about human boundaries, the
North Sea could become the new Mediterranean, where poor regulation and disagree-
ment between EU and non-EU states has resulted in a steady decline in stocks. Climate
change induced shifts in abundance and distribution will likely further complicate mat-
ters.
In the face of Brexit we should be aiming to improve international relations, not damage
them. Otherwise fish and shellfish stocks and the wider marine environment are likely to
suffer most – at which point everyone loses.
* Adapted from the original article in The Conversation: https://theconversation.com/scallop-wars-
between-britain-and-france-are-just-a-pre-brexit-skirmish-102588
Initial assessment of Scallop (Pecten maximus) stock status for selected waters within the Channel
2016/2017 – UK Cefas
At the 2017 meeting, a detailed description of the cooperative industry survey for the
English Channel was presented and reviewed by the working group. An update of the
success of that first field season is presented below. The advice of the Working Group
was followed and the survey was modified to improve the precision by increasing the
number of stations in the stratified random design. Refer to the summary below provid-
ed by CEFAS.
A review of the sampling design of the newly developed English Channel cooperative
dredge survey conducted by Cefas and the fishing Industry was completed (ToR 6, 2017,
Belfast). This survey came together very quickly resulting from a great deal of work and
coordination between the scientific agency and the industry. Surveys began in May and
were conducted into September 2017. Data from the summer’s surveys were not available10 | ICES WGSCALLOP REPORT 2018
at this meeting but the sampling design, assumptions and possible statistical procedures
were presented and discussed.
The beds in the English Channel were defined by examining 8 years of VMS data. Two
grids of different scales were laid over the VMS data. A course grid of 0.10 divided the
beds into blocks (each approx. 80km2) and a 2nd finer grid of 0.0250 divided each block
into 16 cells (each approx. 5km2). One cell was randomly selected within each block, the
midpoint of which was used as a tow position. The number of random tows was reduced
by 25% to enable the fishing industry partners to contribute to tow location selection. The
randomly selected tows were used to estimate the density/abundance of each block with-
in a bed but blocks where no random tow was available the bed median density was
used. Where the density from a non-random industry provided tow was available this
was used for the cell estimate only. This process was necessary as the industry tows were
not randomly assigned and their influence therefore had to be restricted to a local effect
only. Biomass in each block was estimated from the size distribution and a bed specific
length weight relationship and these estimates were summed to provide estimates for
each bed.
Substrate specific efficiency was previously estimated by depletion tow experiments.
Estimates suggested higher efficiency for this gear compared to some other studies, but
those used were thought to be more relevant. We suggested that continuing and expand-
ing these efficiency experiments, maybe add a camera to dredge (useful in other areas i.e.
Isle of Man).
Permission was not obtained to sample in French waters for the 2017 sampling year and
bed median densities were applied to those areas within the French EEZ.
Drop camera surveys are being conducted in non-fished areas (non-contact ~0.5m alti-
tude); these worked well but covered only small area given the low scallop density (~1
scallop to 100m2). We suggested conducting some drop camera samples in the fished
areas where dredge survey tows are taken, could add to the estimates of dredge efficien-
cy.
Addressing the 3 primary questions on design put forward by the research scientists
conducting the survey the WG suggested:
1 ) The definitions of the beds using the VMS and a polygon tool
This is a sound approach that clearly defines the beds based on the fishing effort.
2 ) The stratification on rectangles characterizing the bed
Habitat map might improve precision and accuracy by enabling stratification by sub-
strate type. The basis for stratification could be further developed.
Re-randomize stations annually? Examine the data collected in 2017 by post-stratifying
by habitat to see if re-stratification is required.
3 ) The inclusion of the industry survey stations in the sampling design.
The inclusion of the industry tows complicates the estimate of the variance associated
with the survey design, probably a bootstrap technique will be required.ICES WGSCALLOP REPORT 2018 | 11
Need to conduct analysis of the industry vs random tows on actual data. Does the reduc-
tion of 25% of the random tows result in a significant increase in variance? The survey
could be improved possibly by randomly assigning (within strata) 100% of the tows.
Industry LPUE data in the previous year could be used to assign industry tows.
Explore different interpolations, different smoothers, geostatistical procedures etc.
The monitoring programme started in 2017 includes two other data streams: The use of
UWTV to estimate abundance in non-dredged areas and an industry scallop sampling
scheme to provide the age structure of removals.
Assessment of Scallop (Pecten maximus) stock status for selected waters within the Channel
2017/2018 – UK Cefas
The first assessment of scallop stocks in the English Channel was carried out towards the
end of 2017 and the report presented to the meeting. Partial presentation of the executive
summary is included below:
The report describes the initial assessment of the status of some of these stocks undertak-
en in 2017 by the Centre for the Environment, Fisheries and Aquaculture Science (Cefas)
during a collaborative project with the UK fishing industry, Defra and Seafish.
Five stock assessment areas have been identified as being of importance to UK fisheries,
three in ICES subdivision 27.7.e (Inshore Cornwall, I; Offshore, O; Lyme Bay, L) and two
in 27.7.d (North, N; South, S). These assignments are based on regional differences in
growth and fishery exploitation patterns. Fisheries data are available at the spatial reso-
lution of ICES Rectangle and their boundaries are used to describe the extent of the as-
sessment areas. The fished stock in the Bay de Seine part of 27.7.d.S is assessed by France
whose scientists carry out an assessment of biomass and exploitation rate on fished
grounds in this region.
This report assesses the status of the dredged portion of stocks in 27.7.d.N, 27.7.e.I,
27.7.e.L and 27.7.e.O with additional estimates of unfished biomass in some parts of
27.7.e.L and 27.7.e.I. There is likely to be biomass of scallops outside those areas surveyed
in this initial year but for which there are no data to make any estimates. This report
does not cover scallop stock in area 27.7.d.S. The biomass and exploitation rate of the
fished portion of stock in the Bay de Seine part of 27.d.S is routinely estimated by scien-
tists from IFREMER in a robust process.
Three data streams were used for the assessments described in this report. Dredge sur-
veys in the main fished beds of 27.7.d.N, 27.7.e.I, 27.7.e.L and 27.7.e.O were used to esti-
mate harvestable biomass available to the dredge fishery (converting survey catch rates
to absolute biomass via a gear-efficiency coefficient). The scallop biomass in some non-
dredged regions of assessment areas 27.7.e.I and 27.7.e.L was estimated from underwater
TV surveys; no underwater TV survey was undertaken in 27.7.d.N or 27.7.e.O. Estimates
of harvestable biomass (i.e. biomass above minimum size and in areas in which dredgers
can operate) and the exploitation rate experienced by those scallops are covered by this
assessment, however the assessments presented here are not able to fully estimate the
impact of the fishery on the wider stock as we were unable to estimate the scallop bio-
mass in all un-dredged areas. Dredge surveys and catch sampling only cover the portions
of stock found on the main fished grounds, as identified by density of VMS data. Har-12 | ICES WGSCALLOP REPORT 2018
vest rate estimates from dredge surveys or commercial sampling therefore only apply to
the fished portion of the stock. In situations where there are significant portions of non-
dredged stock that are contributing offspring to the fished areas, the MSY harvest rate
will, in future, need to be adjusted to compensate for this.
The potential harvest rates experienced by the surveyed portion of stocks were estimated
by comparing the international landings to the available biomass estimates, either
dredged area only or including the biomass from un-dredged areas from the available
UWTV surveys. Finally, the age compositions of the landings were used in a cohort mod-
el to obtain alternative estimates of harvesting rates.
In order to put the estimates of biomass and harvest rate into context, candidate harvest
rates for maximum sustainable yield have been estimated.
This is the first attempt at stock assessments undertaken for scallops in this region. Single
points of data are always more uncertain than when a time series are available, so the
results of this assessment should be viewed with some caution. The estimates of harvest
rate from the different data streams are given below.
HARVEST RATE ON HARVEST RATE HARVEST RATE ON MSY
DREDGED POR- FOR WIDER STOCK DREDGED POR-
CANDIDATE
TION OF STOCK WHERE TION OF STOCK
(DREDGE SURVEY UWTV AVAILABLE (COHORT MODEL)
ONLY) (NOT 100% COVER-
AGE)
27.7.D.N. 35.5% NA 48.0% 25.0%
27.7.E.I. 27.4% 17.3% 35.3% 24.5%
27.7.E.L. 36.5% 22.0% 32.5% 21.0%
27.7.E.O. 13.6% NA 28.6% 32.8%
We consider this project to be the start of a long-term monitoring and assessment pro-
gramme and there is likely to be some evolution of processes and methodologies. As the
time series of data develops and increases in comprehensiveness, this will in turn con-
tribute to a more robust determination of stock status of King Scallop in this region.
Researchers are still filling data gaps and improving parameter estimates and as such
have included a list of caveats and assumptions in the report which can be found at:
https://www.gov.uk/government/publications/aseessment-of-scallops-stocks-201617
Further evolution of survey design, assessment methodology and refinement of parame-
ter estimates is likely to address these issues.
Updates in 2018
Cefas and their industry collaborators have taken on board WG recommendations re-
garding use of industry selected tow positions for the dredge surveys and from 2018 all
tow positions will be randomly selected each year. Dredge survey beds will be reviewed
at an appropriate frequency.ICES WGSCALLOP REPORT 2018 | 13
The researchers have released RFID tagged scallops and subsequently tried to recapture
these and detect them with RFID readers mounted in front of the dredges to estimate
efficiency. Results of this study were not available at the time of the 2018 meeting. The
technology has been shown to work, but further surveys and testing are necessary to
develop a system capable of being used on commercial fishing vessels. When developed
the equipment will be deployed on the survey fishing vessel to enable estimation of effi-
ciency and more robust density estimates from survey catch rates.
The sampling targets for the industry scallop sampling scheme have been revised from
the original and nominal ones to a system where the number of samples per ICES rectan-
gle and quarter are proportional to the reported landings. The ratio of age samples to
length samples has been increased to provide a better interpretation of age structure.
Annual assessment survey of the Bay of Seine King Scallop stock: results of the survey COMOR2018
The survey took place from 2 to 18 July 2018. The main objective is to assess the King
scallop (Pecten maximus) stock of the Bay of Seine (English Channel, ICES Division 7d,
France), in the area located within the 12 miles limits (inside the French territorial waters)
and also in the area located just in the north of the 12 miles limit, corresponding to the
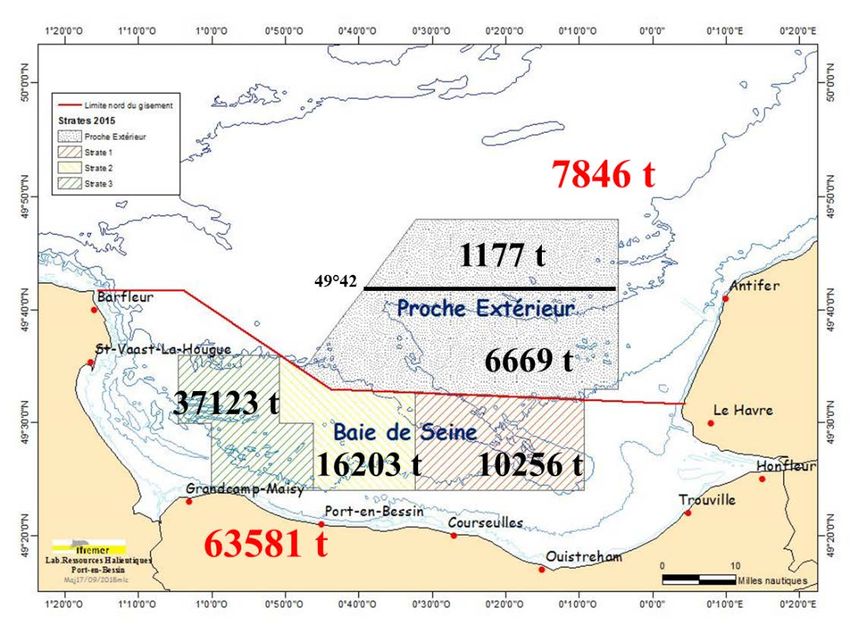
ICES rectangle 28E9, called “Proche Extérieur” (Figure x.1).
Figure x.1. Area of the Bay of Seine assessment survey.
The scientific protocol is based on a random stratified sampling; the employed gear is a 2
meter width French dredge with diving plate, one equipped with 72mm inside diameter
rings, and the second one with 50mm inside diameter rings. Each tow is realized straight
facing into the current; the length is ½ nautical mile, the speed of the R/V vessel 3 knots.
This year, 160 tows have been done.
1 ) Area “Extérieur baie de Seine”
Abundance indexes (number of King Scallops per mile x dredge width) by ages have
been processed, from age 1 to age 7+. The exploitable biomass in the Eastern Channel,
and especially in the north of the Bay of Seine, is mainly composed by 2 and 3 years old
individuals. Age 2 index (83.64) is in 2018 below the 3 previous year’s indexes, and also14 | ICES WGSCALLOP REPORT 2018
below the average index for the last decade (around half of the mean index); (Table. x.1).
Indexes for age 3 to 7 are similar to those observed last and previous years (Figure x.2).
Table x.1. Average abundance indexes in the “Proche Extérieur” for age 1 to 7+, for historical period
1992–2007 and the last decade 2008–2017.
1 an 2 ans 3 ans 4 ans 5 ans 6 ans 7 ans
Moyenne 48.13 59.66 12.09 3.49 0.80 0.18 0.16
1992-2007
Moyenne 135.49 152.78 22.38 4.64 1.23 0.51 0.22
2008-2017
Figure x.2. Trends of abundance indexes in the area “Proche Extérieur” from 1999 to 2018.
The age 1 index is around 3 times better than last year, meaning the arrival of a new large
cohort in the fishery in 2019. Globally, the situation of the stock is better now that it was
historically; all indexes by age are around 3 times higher for the current decade than for
the period from 1992 to 2007.
The exploitable biomass (King Scallops over the 110 mm MLS) is estimated to 7846
tonnes (Figure x.3). It is less than B2017 (18783 tonnes) and the average B2008–2017 biomass
(11 502 tonnes). Anyway, the status of the stock could not be considered in danger, be-
cause the exploitable biomass remains higher than the average biomass from 1998 to 2007
(5554 tonnes), and because the projected arrival of the new exploitable cohort in 2019 will
be high again. The structure of the population shows that the stock is mainly composed
by age 2 and 3 years old scallops (Figure x.4).ICES WGSCALLOP REPORT 2018 | 15
Figure x.3. Trends of estimated exploitable biomass in the area “Proche Extérieur” from 1998 to 2018.
Figure x.4. Structure of the population of the “Proche Extérieur” in July 2018.
2 ) Bay of Seine
This area is located between the French coast of Normandy and the 12 nautical miles
limit on the North. This King Scallop seabed is entirely into the French territorial waters.16 | ICES WGSCALLOP REPORT 2018
The global status of the Bay of Seine stock is really good, it is the best situation ever seen
from the beginning of the time series. Age 2 and age 3 indexes (respectively 789.08 and
175.63) are the two records of the time series. The age 2 index is approximatively 3 times
and half above the average index of the last decade (218.66). The age 3 index, correspond-
ing to King scallops already fished since one year, is 5 times better than the average. It
results from the decision of French authorities and French fishermen Organizations to
maintain closed during all the fishing season the Western part of the Bay of Seine (rota-
tional closure). The improvement of the stock status in the bay of Seine could be observed
on average indexes of historical period compared to average indexes of the last decade
(Table. x.2). The age 1 index is one time again relatively high (394.33), above the average
(Figure x.5).
Table x.2. Average abundance indexes in the “Bay of Seine” for age 1 to 7+, for historical period 1992–
2007 and the last decade 2008–2017.
1 an 2 ans 3 ans 4 ans 5 ans 6 ans 7 ans
Moyenne 57.85 66.69 13.26 4.26 1.22 0.29 0.13
1992-2007
Moyenne 256.55 218.66 34.24 9.45 2.78 0.91 0.59
2008-2017
Figure x.5. Trends of abundance indexes in the area “Bay of Seine” from 1999 to 2018.
The exploitable biomass (King Scallops over the 110 mm MLS) is estimated to 63581
tonnes (Figure x.6), better than B2017 (48572 tonnes) and 3.5 times above the average B2008–
2017 biomass (17 233 tonnes).ICES WGSCALLOP REPORT 2018 | 17
Figure x.6. Trends of estimated exploitable biomass in the area “Bay of Seine” from 1998 to 2018.
The structure of the population is the same as the “Proche Exterieur” and shows that the
stock is mainly composed by age 2 and 3 years old scallops (Figure x.7).
Figure x.7. Structure of the population of the “Bay of Seine” in July 2018.
The global situation off the coasts of Normandy (Eastern Channel) is good, but the most
proportion of the exploitable biomass is located into the French territorial waters (Figure
x.8).18 | ICES WGSCALLOP REPORT 2018
Figure x.8. Distribution of the exploitable biomass off the coasts of Normandy, Eastern Channel,
France.
Recent French landings and trends 2000–2017 in the King Scallop fishery in Eastern Channel.
Almost all of the French King Scallop landings come from the English Channel, less than
2% have been caught in the Rade de Brest (Western end of Brittany) or small sea grounds
in the Bay of Biscay (South of Brittany, Pertuis Charentais).
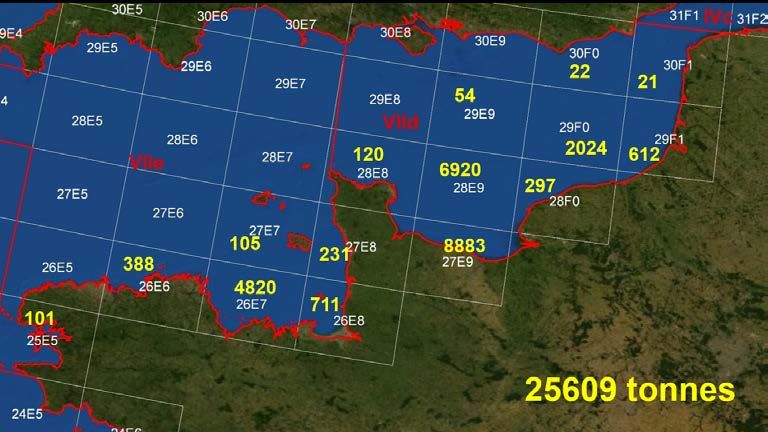
25 724 tons were caught during the fishing season 2016–2017 (from October to 15 May),
18 334 tons in Eastern Channel and 7390 tons in Western Channel, respectively 71% and
29% (Figure x.9).ICES WGSCALLOP REPORT 2018 | 19
Figure x.9. French landings during the fishing season 2016–2017 in the Channel, by ICES rectangle
(Source: Database SACROIS, French Ministry of Fisheries/Ifremer Système d’Information Halieu-
tique).
In the Western Channel, 71% of the catches are coming from the Bay of Saint-Brieuc, in-
shore sea ground within the French territorial waters (ICES rectangle 26E7). In the East-
ern Channel, the 3 ICES rectangles 27E9, 28E9 and 29F0 contribute to 88% of the total
French landings in the Eastern Channel, and the 2 single rectangles 27E9 (entirely within
the French territorial waters) and 28E9 (northern part in international waters, middle
corresponding to the “Proche Extérieur” and southern part in French territorial waters)
contribute to 73% of the total French landings. These 2 rectangles are so essential for the
sustainability of the French King Scallop fishery in Eastern Channel.
For the last fishing season 2017–2018, the global landings in the English Channel is really
stable (25 609 tons), but the repartition between Eastern and Western Channel slightly
different. Indeed, 6420 tons (25%) have been caught in Western Channel (including 4820
tons in the Bay of Saint-Brieuc, 75% of Western landings) and 19189 tons (75%) in Eastern
Channel (Figure x.10).20 | ICES WGSCALLOP REPORT 2018
Figure x.10. French landings during the fishing season 2017–2018 in the Channel, by ICES rectangle
(Source: Database SACROIS, French Ministry of Fisheries/Ifremer Système d’Information Halieu-
tique).
In the Eastern Channel for the season 2017–2018, the 3 ICES rectangles 27E9, 28E9 and
29F0 contribute to 93% of the total French landings in the Eastern Channel, and the 2
single rectangles 27E9 (entirely within the French territorial waters) and 28E9 (northern
part in international waters, middle corresponding to the “Proche Extérieur” and south-
ern part in French territorial waters) contribute to 82% of the total French landings.
The global trends of King scallop landings in the Eastern Channel (ICES division VIId)
present a continuous increase since 2000, from 8000 tons (6000t for France and 2000 for
UK) to more than 24 000 tons in 2017 (18 000t for France and 6000t for UK); (Figure x.11).
Figure x.11. King scallop landings trends in Eastern Channel, from 2000 to 2017.ICES WGSCALLOP REPORT 2018 | 21
The trends of King scallop landings by month in the Eastern Channel from 2008 to 2017
are slightly different between France and UK, and also between the most important ICES
rectangles (27E9, 28E9, 29F0 and the other rectangles of the VIId division). The seasonali-
ty of the fishing season in France is clearly shown (Figure x.12), in November and De-
cember in the Bay of Seine inshore fishery (entirely within the French territorial waters in
27E9, and from October to May in the other rectangles (Figure x.12b,c,d).
a. International landings in 27E9 ICES rectangle.
b. International landings in 28E9 ICES rectangle.
c. International landings in the other ICES rectangle of Eastern Channel (ICES division 7d).
d. International landings in Eastern Channel (ICES division 7d), all rectangles.
Figure x.12. Monthly trends of international King scallop landings in the ICES division 7d, from 2008
to 2017.
UK landings do not show such a seasonality and appear all over the year, especially in
the middle and northern part of the Eastern English Channel. They appear in the Bay of
Seine in the ICES rectangle 28E9 quite recently, the first year of important landings is
2012. Catches in this area, off the French coast, are opportunistic and concentrated during
only 2 months, October and November. Anyway, ULK landings are representing during
the all period around third of French landings.22 | ICES WGSCALLOP REPORT 2018
The French LPUE (in Kg/hour) are constantly increasing from 2000 to 2017, in all areas in
the Eastern Channel (Figure x.13). In the French territorial waters (ICES rectangle 27E9),
where restrictive measures are in place since the middle of the 2000s (fishing season, limi-
tation of hours per day and fishing days per week, individual quotas per boat, limitation
of number of boats and number of dredges per boats, high selectivity of fishing gears…),
LPUE have been raised from 60 Kg per hour in 2000 to nearly 250 Kg per hour in 2017.
Figure x.13. Trends of French LPUE (in Kg per hour) in the ICES division 7d, from 2008 to 2017.
5.6 Science highlights
Northern Celtic Sea and Southern Irish Sea
Surveys
In 2017, and funded through the Interreg BLUEFISH Project, the Marine Institute com-
pleted the first dedicated scallop surveys took place in the northern Celtic Sea and south-
ern Irish Sea since 2005. The aim of the survey was to investigate whether a relationship
identified from previous surveys between scallop density (i.e. number of individuals
caught per 100 m2) and acoustic backscatter data, which is reflective of ground type, still
existed in the scallop grounds of the northern Celtic Sea off the south-east coast of Ire-
land. Any shift in the distribution of sand or gravel patches would render the previous
ground discrimination maps redundant. Seabed acoustic surveys are regularly carried
out by the Marine Institute using a multibeam echo-sounder sonar system that provides
information on the hardness and texture of the seabed. In the northern Celtic Sea there
are two principal ground types dominated by either sand or gravel. No acoustic backscat-
ter data is currently available for the scallop grounds of the southern Irish Sea.
The survey took place between 24 September and 2 October 2017 on board the RV Celtic
Voyager, using four Newhaven spring-loaded dredges (commonly used by fishing ves-
sels targeting scallops in Ireland) Due to bad weather, only 24 stations (three in the south-
west Irish Sea and 21 in the northern Celtic Sea) were sampled. Scallop catches were
measured and weighed throughout the survey, with tissue samples taken for genetic and
biotoxin analysis. Bycatch was also recorded. The RV Prince Madog carried out dredging
at 10 stations in the northern Celtic Sea at the same time.
Results of the survey indicate the linear relationship between scallop density and ground
type still existed for the range of acoustic backscatter values in this area. Similar to surveyICES WGSCALLOP REPORT 2018 | 23
results from 2001–2005, scallop abundance was highest on grounds comprised of grav-
el/coarse sediment, and substantially lower on sand sediments. A linear relationship was
also observed from the stations sampled by the RV Prince Madog, although sampling
was not carried out on stations covering the same range of acoustic backscatter values as
the RV Celtic Voyager, with catches also lower when compared to the RV Celtic Voyager.
This relationship suggests that P. maximus discriminate not only between sand and gravel
sediments, but also between different grades of these sediments. From 2001–2005, rela-
tionships between abundance and ground type were also observed over fine spatial
scales, indicating that spatial differences in larval supply was not a contributing factor to
this relationship.
A 2018 survey is currently underway, and aims to survey some of the main beds fished
by the offshore Irish scallop fleet (vessels >20 m), with their spatial extent identified using
VMS data from 2014–2016. The survey areas are Cardigan Bay, the southern Irish Sea,
and the inshore and offshore scallop grounds of the northern Celtic Sea. The 2018 survey
is also funded through the BLUEFISH Project and will take place on board commercial
fishing vessels as opposed to a research vessel. In the southern Irish Sea, where acoustic
backscatter data is not available, the location of sampling stations has been allocated in
proportion to the fishing activity of the Irish fleet from 2014–2016 in these areas. In the
Celtic Sea, the location of sampling stations has been determined using classified acoustic
backscatter data that identifies patches of seabed as being predominantly comprised of
either sand or gravel sediments. Locations were randomly allocated based on where a
1500 m tow can be carried out on one of the predominant types of substrate, with approx-
imately 80% of stations to take place on gravel based on the 2005 survey that identified
scallop abundance as being approximately 80% greater on gravel sediments compared to
sand. Successful surveys will allow for abundance estimates to be calculated for these
areas that take into account dredge efficiency parameters, with geostatistical methods
being employed to use the available acoustic backscatter data to inform the interpolation
of the survey data (Co-Kriging) in the Celtic Sea.
The annual spawning cycle
Opportunistic sampling of shucked muscle and gonad samples submitted to the institute
for biotoxin testing has taken place throughout 2018 in order to identify spawning times
of scallop in the Celtic Sea. Variation in the macroscopic appearance of the gonad allows
a spawning stage to be assigned, with a time-series of the proportions of developing, ripe
and spent gonads allowing mass-spawning events to be identified. Data collected thus far
indicates three main spawning events: mid-May, mid-July, and continuous spawning
from mid-August through to mid-September. Sampling will continue throughout 2019. A
good time-series of data would also allow the environmental variables that influence
gonad development and spawning times to be identified. Knowledge of spawning times
will also provide information for larval dispersal simulations investigating connectivity
between scallop stocks in the southern Irish Sea and Celtic Sea.
Size distribution of the catch and landings
A port sampling programme has been in place since 2009 whereby random samples of
scallop landings by ICES rectangle from the Irish fleet are opportunistically sampled for
shell height at seafood processors. The programme provides a time-series of size data24 | ICES WGSCALLOP REPORT 2018
from the scallop stocks fished by the Irish fleet. Since 2009 through to September 2018,
237 samples from 33 ICES rectangles have been obtained, with 131 of these samples from
the Celtic Sea (31E2, 31E3, 32E2, 32E3, 33E3 and 33E3). Less frequent samples from the
English Channel, Irish Sea, and the North Channel between Northern Ireland and Scot-
land are also obtained Approximately 400 scallops are measured per sample. Port sam-
pling in 2018 has increased compared to previous years as a result of involvement in the
BLUEFISH Project.
Sampling on board commercial scallop vessels has been in place since 2011. Marine Insti-
tute observers measure the size distribution of the scallop catch and also record and
measure bycatch species, Twenty seven trips have been completed from 2011–2017, with
data collected from 793 individual hauls in ICES area VIIa, and 184 hauls in area VIIg. In
area VIIa, spotted ray and plaice have been the most recorded bycatch species, and in
area VIIg, white-bellied monkfish and megrim have been the most frequent. Elasmo-
branch species such as the cuckoo ray, lesser-spotted dogfish and thornback ray has also
been more frequently recorded as a bycatch species in area VIIa compared to VIIg.
Catch and effort indicators
A 15 year time-series of logbook (landings) and VMS (effort) data from the Irish offshore
scallop fleet (vessels > 15 m) is available. Although the VMS and Landings data are re-
ported at different temporal and spatial resolutions they can be combined to link land-
ings and fishing time, and calculations of nominal landings per unit effort (LPUEn)
described as kgs.dredge-1.day-1, kgs.dredge-1.loggedhr-1 or kgs.dredge-1.VMShr-1. VMS
data from scallop vessels has been used to map the historic distribution of scallop fishing.
This has defined the known distributional extent of commercially viable scallop beds
fished by the Irish fleet. The annual distribution of scallop fishing provides an estimate of
the annual footprint or pressure to which the stock is exposed, although the footprint
estimate is sensitive to the resolution (ping frequency) of the VMS data.
Temporal trends in LPUEn are different across areas. In the Celtic Sea, catch rates in-
creased from approximately 50 kgs.dredge-1.day-1 from 2005–2007 to approximately 75
kgs.dredge-1.day-1 in 2011–2013, but has since steadily declined to 2007 levels in 2016.
Since the Irish fleet began entering the eastern English Channel scallop fishery on an
annual basis in 2011, catch rates reached 200 kgs.dredge-1.day-1 in 2012; more than double
the LPUEn returned from any other area exploited by the fleet during our time-series. A
subsequent decrease in catch rates followed in 2013 and 2014. Catch rates in 2015 once
again increased to 200 kgs.dredge-1.day-1, and in 2016 reached 240 kgs.dredge-1.day-1,
making this area a very efficient and lucrative fishery for the Irish fleet.
LPUEn can be standardised (LPUEs) to remove trends that may be due to factors other
than changes in the abundance of scallop. Likely factors to consider are fishing season
(month), location (e.g. ICES rectangle within stock), ground type, vessel power, gear
type, vessel plotting systems, wind speed and tidal strength. Information to supplement
this work will be gathered directly from skippers of the fleet through questionnaires and
interviews, with the aim of identifying the environmental factors & gear settings the fleet
consider important for maintaining gear efficiency & catch rates.
Increased frequency of VMS and catch reporting, as implemented in some inshore VMS
systems for smaller vessels, potentially allows reconstruction of precise vessel track in-ICES WGSCALLOP REPORT 2018 | 25
formation and the landings associated with that track. As the number of dredges can be
predicted from vessel length the swept-area associated with a given catch could be esti-
mated. Accounting for gear efficiency would then allow absolute estimates of the abun-
dance of the component of the stock above the minimum landing size to be estimated
and provide survey type information based on a much higher volume of data than can be
achieved from a dedicated survey. Changes in biomass could then be tracked seasonally
and be used to inform near real time management.
Connectivity across scallop beds in the Irish and Celtic Seas
Larval dispersal simulations were undertaken in the Irish and Celtic Seas by the Marine
Institute to assess the level of connectivity between scallop beds in the area. The work is
ongoing. Connectivity across five scallop beds (north east Celtic Sea, south Irish Sea,
Cardigan Bay and Liverpool Bay) was estimated annually for years 2011–2015.
The Ichthyop model was used to interface with archived ROMS model output files which
contain arrays of current vectors and temperature and salinity data at 3 hour intervals at
resolutions of 1.2–1.5km in the horizontal and with up to 40 vertical layers. Current vec-
tors, from ROMS output, integrated the effects of coastal topography, depth, wind forc-
ing, freshwater inflows and solar heating on current strengths and direction within grid
cells in the model. ROMS output faithfully reproduced salinity and temperature fields
observed from satellite data.
Simulated larvae were introduced to Ichthyop by subsampling vessel monitoring system
(VMS) data. The VMS data were assumed to be a proxy for the distribution and relative
abundance of adult scallop and therefore represented locations from which larvae would
be introduced to the water column during spawning events.
Larvae were treated either as passive particles with neutral buoyancy or particles which
migrated vertically on a 24hr period between near-surface waters (night) and 20m depth
(day). This, on average, retained larvae above the thermocline in areas of stratified water.
Simulations were initiated on 1 June of each year and ran for a maximum of 40 days but
the total amount of heat (degree hours/days) experienced by larvae was calculated for
each larvae during the model runs and larvae were deemed to be competent to settle
after a given number of degree days identified from published temperature development
rate functions. Physiological rather than chronological age was therefore used to identify
the point at which settlement could occur. Spawning was presumed to occur during June
throughout the area and in all years 2011–2015.
Outputs from Ichthyop are in the form of NETcdf files. R scripts were developed to ex-
tract and report the outputs including conversion to shape file format for use within GIS,
reporting of depth distributions of larvae during simulation, tracking individual larvae
and drawing polygons describing the distribution of dispersal.
Results indicate that there is limited connectivity across the 5 scallop beds studied with a
high level of self-recruitment. There is no exchange of larvae from the eastern Irish Sea
south to other beds. There is no exchange of larvae from the Celtic Sea north into the Irish
Sea. Larvae may be transported from the south Irish Sea into the Celtic Sea. There is some
east west exchange of larvae between the south Irish Sea and Cardigan Bay. The south
Irish Seabed is at highest risk of limited larval supply. Interannual differences in the levelYou can also read